Article

Potential for Climate Change Mitigation in Degraded Forests: A Study from La Primavera, México

by
Arturo Balderas Torres
1,2,*,
Ricardo Ontiveros Enríquez
3,
Margaret Skutsch
1,2 and
Jon C. Lovett
4
1
CSTM, Twente Centre for Studies in Technology and Sustainable Development, University of Twente, Postbus 217, Enschede 7500 AE, The Netherlands
2
Centro de Investigaciones en Geografía Ambiental, Universidad Nacional Autónoma de México (UNAM), antigua carretera a Pátzcuaro 8701, Morelia CP 58190, Michoacán, Mexico
3
Ingeniería Ambiental, PTI Instituto Tecnológico y de Estudios Superiores de Occidente (ITESO), Tlaquepaque CP 45090, Mexico
4
School of Geography, University of Leeds, Leeds LS2 9JT, UK
*
Author to whom correspondence should be addressed.
Forests 2013, 4(4), 1032-1054; https://doi.org/10.3390/f4041032
Submission received: 23 September 2013 / Revised: 8 November 2013 / Accepted: 15 November 2013 / Published: 22 November 2013
(This article belongs to the Special Issue Forest and Wood Vegetation Carbon Stores and Sequestration)

Abstract

:
Forests contribute to climate change mitigation by removing atmospheric carbon dioxide and storing it in biomass and other carbon pools. Additionally, since appropriate forest management can reduce emissions from deforestation and forest degradation, it is important to estimate the magnitude of these services to include them into climate policy. We used a forest inventory stratified by canopy cover in the oak-pine forest of La Primavera Biosphere Reserve in México (30,500 ha), to assess the potential provision of forest carbon services. Inventory results were used in combination with a Landsat image to estimate carbon stocks in arboreal biomass. Potential carbon removals were calculated from published allometric equations and models estimating tree growth rates, for enhancements in forested areas and for reforestation/afforestation. Carbon stocks estimated in arboreal biomass at the time of the inventory were 4.16 MtCO2eq (3.42–4.89). The potential for further carbon sequestration and enhancement could take the level of stocks up to 9.77 MtCO2eq (7.66–11.89, 95% confidence interval); previous fires have degraded carbon stocks below their natural potential. The results present a gradient of carbon stocks for different degradation levels and are consistent with national and international estimates and previous local research. The baseline for the estimation of reduced emissions is critical for assessing the overall contribution of forests to mitigate climate change. The local baseline of emissions might be around 1% according to historical data; however, when enhancements and reduced emissions are valuated together, a baseline of 3.7% is required to prevent the creation of perverse incentives favouring previously degraded areas; considering these figures for reduced emissions, the yearly carbon services provided by La Primavera, including enhancements, sequestration and reduced emissions, could be between 169.4 ktCO2eq/year (134.8–204.5) and 282.1 ktCO2eq/year (228.2–337.1), respectively. Over a period of 60 years, this would be equivalent to 2.4 and 4.1 times the magnitude of mean standing stocks at the time of the inventory. If incentive-based mechanisms are used to maintain and enhance forest carbon services and perverse incentives are to be avoided, a balanced mix of incentives and controls is needed.

1. Introduction

Forests contribute to climate change mitigation by removing atmospheric carbon dioxide and storing it in different carbon pools (i.e., biomass, soil, dead organic matter, litter) [1]. Deforestation and forest degradation are important contributors to global greenhouse gas emissions, but if these processes are controlled, forests can significantly contribute to climate change mitigation. It is estimated that 15% of global greenhouse gas emissions came from deforestation over the period of 2000–2005 [2]. Moreover, forests comprise an important carbon reservoir, since they store about twice the amount of carbon present in the atmosphere [3]. Terrestrial ecosystems could also be a major sink with the potential to offset from 2% to 30% of expected emissions during this century [3,4]. Forest-based strategies offer a cost-effective means to mitigate climate change (e.g., [3,5]), so appropriate forest management can help both to reduce emissions from deforestation and forest degradation and to increase carbon removals.
A number of policies have been devised to promote the conservation and enhancement of forest services. These include programs of payments for environmental services (PES), carbon markets for carbon sequestration and the (as yet not fully agreed upon) international policy to reduce emissions from deforestation and forest degradation in forests in developing countries (REDD+). These initiatives provide performance-based incentives for the provision of the services. In carbon markets and REDD+, this performance refers to the gains in carbon benefits with reference to a baseline [6]. Estimation of gains over the baseline requires measurement of the levels and changes in forest carbon stocks and emissions from forest loss and degradation.
The objective of this work is to obtain an estimate of the level of carbon services produced in forests as a preliminary step for the valuation of these services. The impacts of the selection of a particular forest reference emissions level (REL) for quantification of emissions reductions and the implications for incentive-based policies are discussed. The mixed oak-pine forest of La Primavera Biosphere Reserve in México (30,500 ha) is used as the case study. We report the results from a forest inventory to estimate carbon stocks in biomass using published allometric equations. The forest inventory used for estimation of carbon stocks was stratified by canopy cover to provide detailed data on how stock levels in biomass differ in areas with different levels of degradation. This information is used in combination with growth functions to model potential carbon removals from forest enhancement and reforestation/afforestation. Potential emissions reductions from deforestation and forest degradation are estimated for forested areas at different reference emissions levels. Results are compared with default data provided by the Intergovernmental Panel on Climate Change (IPCC) and national and local data for this type of ecosystem in México. The paper is divided as follows: first, a general description of the methods used to estimate carbon stocks and stock changes is given; then, information about the study area is presented, followed by a description of the methods used in the forest inventory and for the estimation of carbon stocks, potential removals and emissions reductions. Finally, the results are presented, and conclusions are drawn.

2. Background

2.1. Quantification of Forest Carbon Services

The basic procedure for estimating carbon stocks in forests is to obtain an estimate of carbon content or an annual carbon stock change factor per hectare and multiply it by the corresponding area of forest [1,7]. The IPCC has published methods to assess carbon stocks and stock changes in forests. These methodologies are used in the preparation of inventories of greenhouse gas emissions and to monitor the performance of mitigation measures. They are based on a combination of ground and remotely-sensed data (e.g., forest inventories, allometric equations or biomass expansion factors and analysis of satellite images) (e.g., [1]). In order to prepare initial estimates, default carbon content figures for different carbon pools are available (Tier 1, under IPCC guidelines); nationally and locally derived data is used to refine the estimates for more advanced assessments (Tiers 2 and 3) [1,8]. Forest areas can be obtained from international or national statistics and cartography, ground data (e.g., surveys) and through the analysis of satellite imagery [1]. Changes in carbon stocks can be obtained by performing successive inventories over a period of time to measure net growth or by the estimation of yearly gains and losses based on growth factors or models and on statistics on rates of extraction [1]. These methods provide the basis for the development of national forest monitoring systems to estimate forest-related emissions and removals and activities under REDD+ [9].
Agreements under the United Nations Framework Convention on Climate Change (UNFCCC) have defined different rules to account for forest carbon services in the context of the provision of positive incentives for their valuation. Carbon removals in “new” forests are considered carbon sequestration, while carbon gains occurring in existing forests under REDD+ are said to be carbon enhancements (additional to gains from reduced emissions from deforestation and forest degradation). In order to separate these two groups of carbon services, a clear definition of forests is necessary. Forests are defined in the Marrakesh Accords as areas with a minimum size of 0.05 to 1 ha, where woody plants have the potential to grow at least two to 5 m high at maturity and have a minimum canopy cover from 10% to 30% [10]. Countries may choose their thresholds within these margins according to their national circumstances. In the Clean Development Mechanism of the Kyoto Protocol (CDM), developing countries can execute reforestation and afforestation activities in areas that have not been forested since 1990; for afforestation projects, the requirement is that the area has not been forest in the last fifty years [10]. Thus, carbon sequestration activities can be developed in areas that are currently not forests (i.e., cropland, grasslands and degraded land with canopy cover below the threshold for forest). Conversely, carbon enhancement and reductions in emissions from deforestation and forest degradation relate to carbon gains in forested areas with canopy cover above the threshold. To enable participation in CDM carbon markets or REDD+, countries need to communicate to the UNFCCC their definition of forests. For afforestation/reforestation projects under the CDM, México adopted the 30% threshold for canopy cover, 1 ha for minimum forest area and 4 m for minimum tree height [11]. It is not absolutely certain that these thresholds will be adopted by México with respect to REDD+ [12], since the definition according to the national forest law uses a 10% threshold.
For reforestation and afforestation projects, carbon removals are quantified by comparing the growth of the planted trees with the carbon stock expected according to the business as usual scenario, which describes what would have happened had the project not been implemented. Estimations of reduced emissions from deforestation and forest degradation are made on the basis of the performance of a project or intervention in comparison with the expected levels of emissions (i.e., in the absence of the intervention) defined in a baseline or REL. If the baseline also integrates the information on carbon enhancements, then it is referred to as a forest reference level (RL) [6]. A major hurdle is the fact that there is, in most cases, little or no historical data with the required level of detail to set the baselines for forest degradation [13]. Furthermore, there are still no agreed guidelines on how to construct these baselines, although it has been established that countries can prepare their baselines at national and/or sub-national levels [6]. Given the limited availability of data, a number of parties proposed to the UNFCCC Subsidiary Body for Scientific and Technological Advice (SBSTA) that at least during the early stages of REDD+, when the systems to monitor forest stocks and changes may not have been in place yet, conservative estimates of emissions reductions should be used (e.g., using Tier 1, default emissions factors or proxies) [14,15]. At the SBSTA expert meeting on REL/RLs in 2011, there were suggestions in favour of defining default baseline values or proxies for degradation in order to enable its inclusion in the early stages of implementation [16]. There were also discussions about whether countries have to choose between a REL or a RL or whether they may develop both, targeting different regions in their countries [16]; the decision on RELs/RLs leaves these two options open, but no clear decisions on these matters were made.
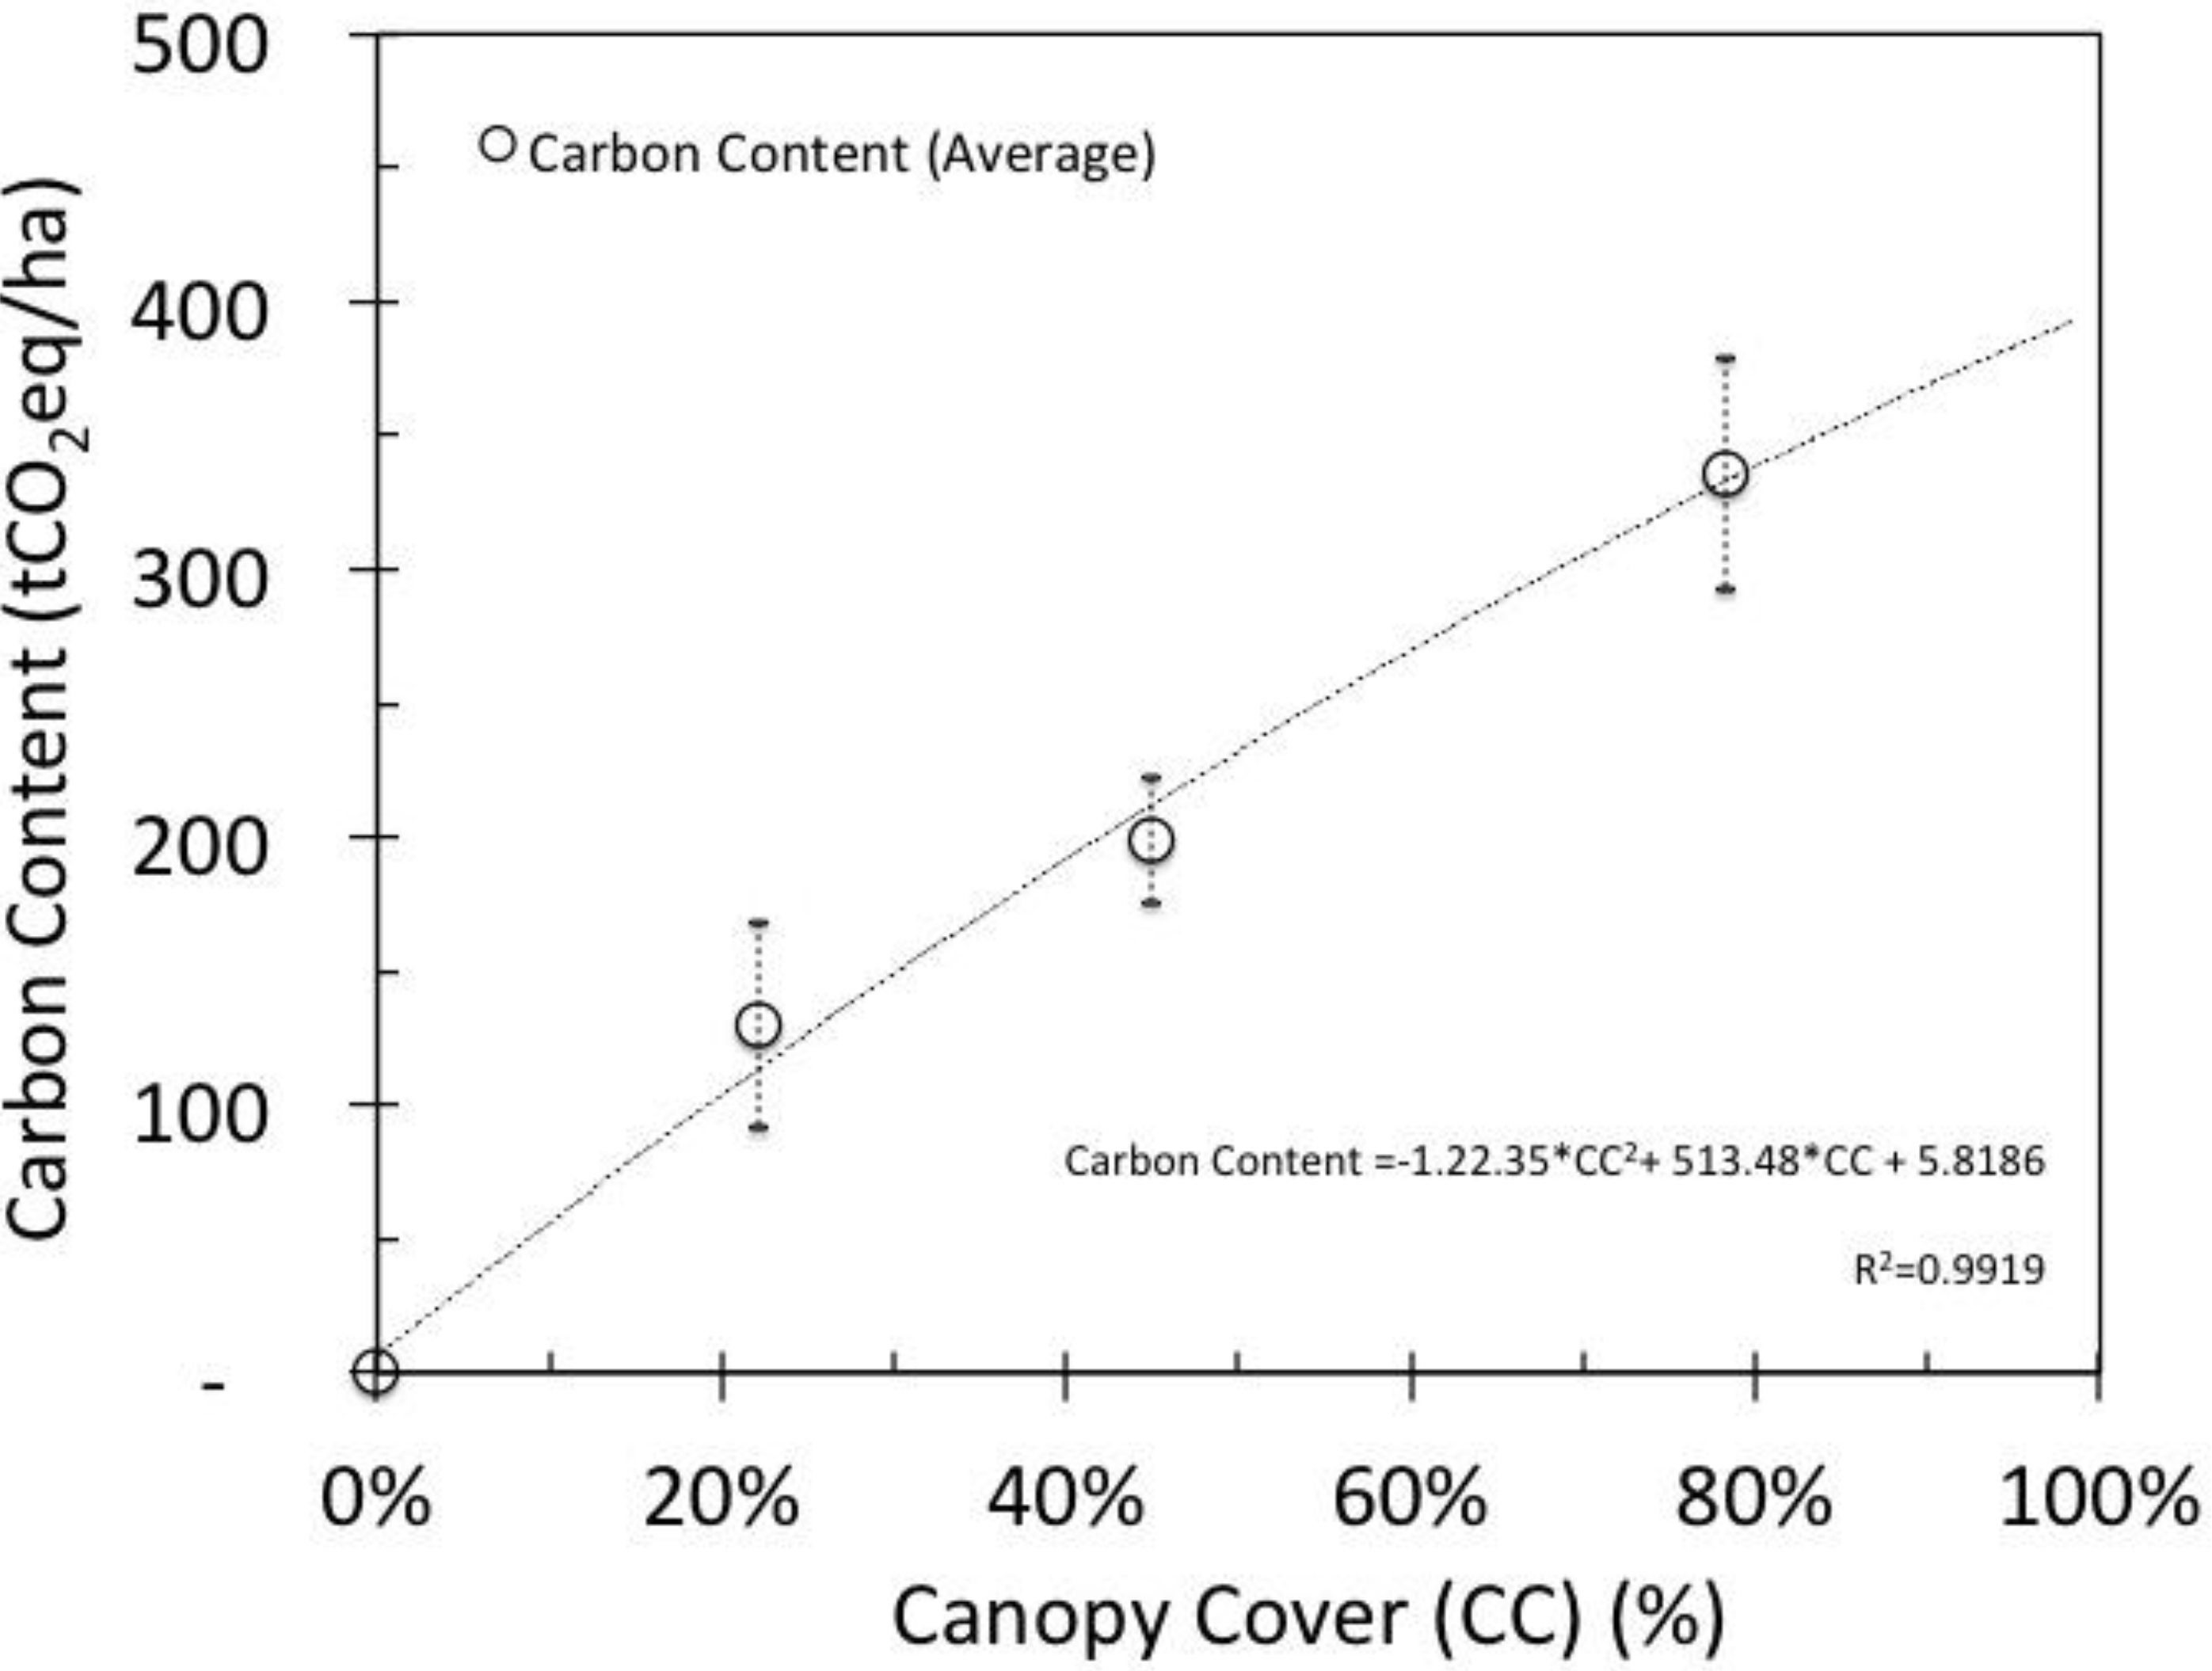
In the case of deforestation, carbon emissions are estimated based on changes in the rates of forest loss. For instance, if a forest loses 1% of its area per year, the carbon lost will be proportional to the initial stock of carbon in the forest; thus ceteris paribus reduced emissions will be higher in areas where forests had initially more carbon. It is important to make clear that under this rationale, it is not the level of carbon stocks that will be valuated, but the change in the rate of loss. However, the level of carbon stocks determines the expected emissions and, hence, the prospects for future reduced emissions, against a given (estimated) risk of deforestation or forest degradation. In the case of forest degradation, the baseline will refer to the annual percentage of carbon being lost from a forest that remains forest (i.e., is not converting to another land use). In this case, the potential for reduced emissions from degradation would also be related to the initial content of carbon stocks; more emissions from degradation can be expected in areas with initially higher stocks of carbon, since, clearly, those areas already degraded could soon reach the threshold for forests/non-forest if the degradation process continues (i.e., they have less carbon to lose). This highlights the importance of evaluating carbon stocks to quantify forest carbon services and the need to account for the level of degradation (i.e., the estimation of carbon stocks at different canopy cover levels); the information on canopy cover serves to identify the boundary between a forested and a non-forested area for carbon accounting. All estimates of reduced emissions require working with data that are essentially counterfactual (i.e., estimates of what would be the case in the future if the intervention were not to take place), which means they are not fully certain (baselines could be set at different levels, which would result in different assessments of the reductions).
Conversely, carbon enhancements can be readily measured at the local level through standard forest inventories when repeated measurements are undertaken (e.g., [17]). Moreover, the growth functions of trees can be used to model forest growth and potential enhancements as part of higher Tier methods based on the IPCC methodologies. If a forest area is known to have been degraded or to be degrading prior to the commencement of REDD+ activity, any increases in stock during the REDD+ accounting period will be additional, representing forest enhancement, with the baseline taken as the level of stock measured at the beginning of this period [17]. There will also be a (unmeasured, uncredited) reduction in degradation when the forest enhancement occurs, since the manifestation of the growth of stock implies that the degradation has been reversed [17]; hence, the estimate of carbon impacts of the REDD+ activity would be conservative.

2.2. Study Area

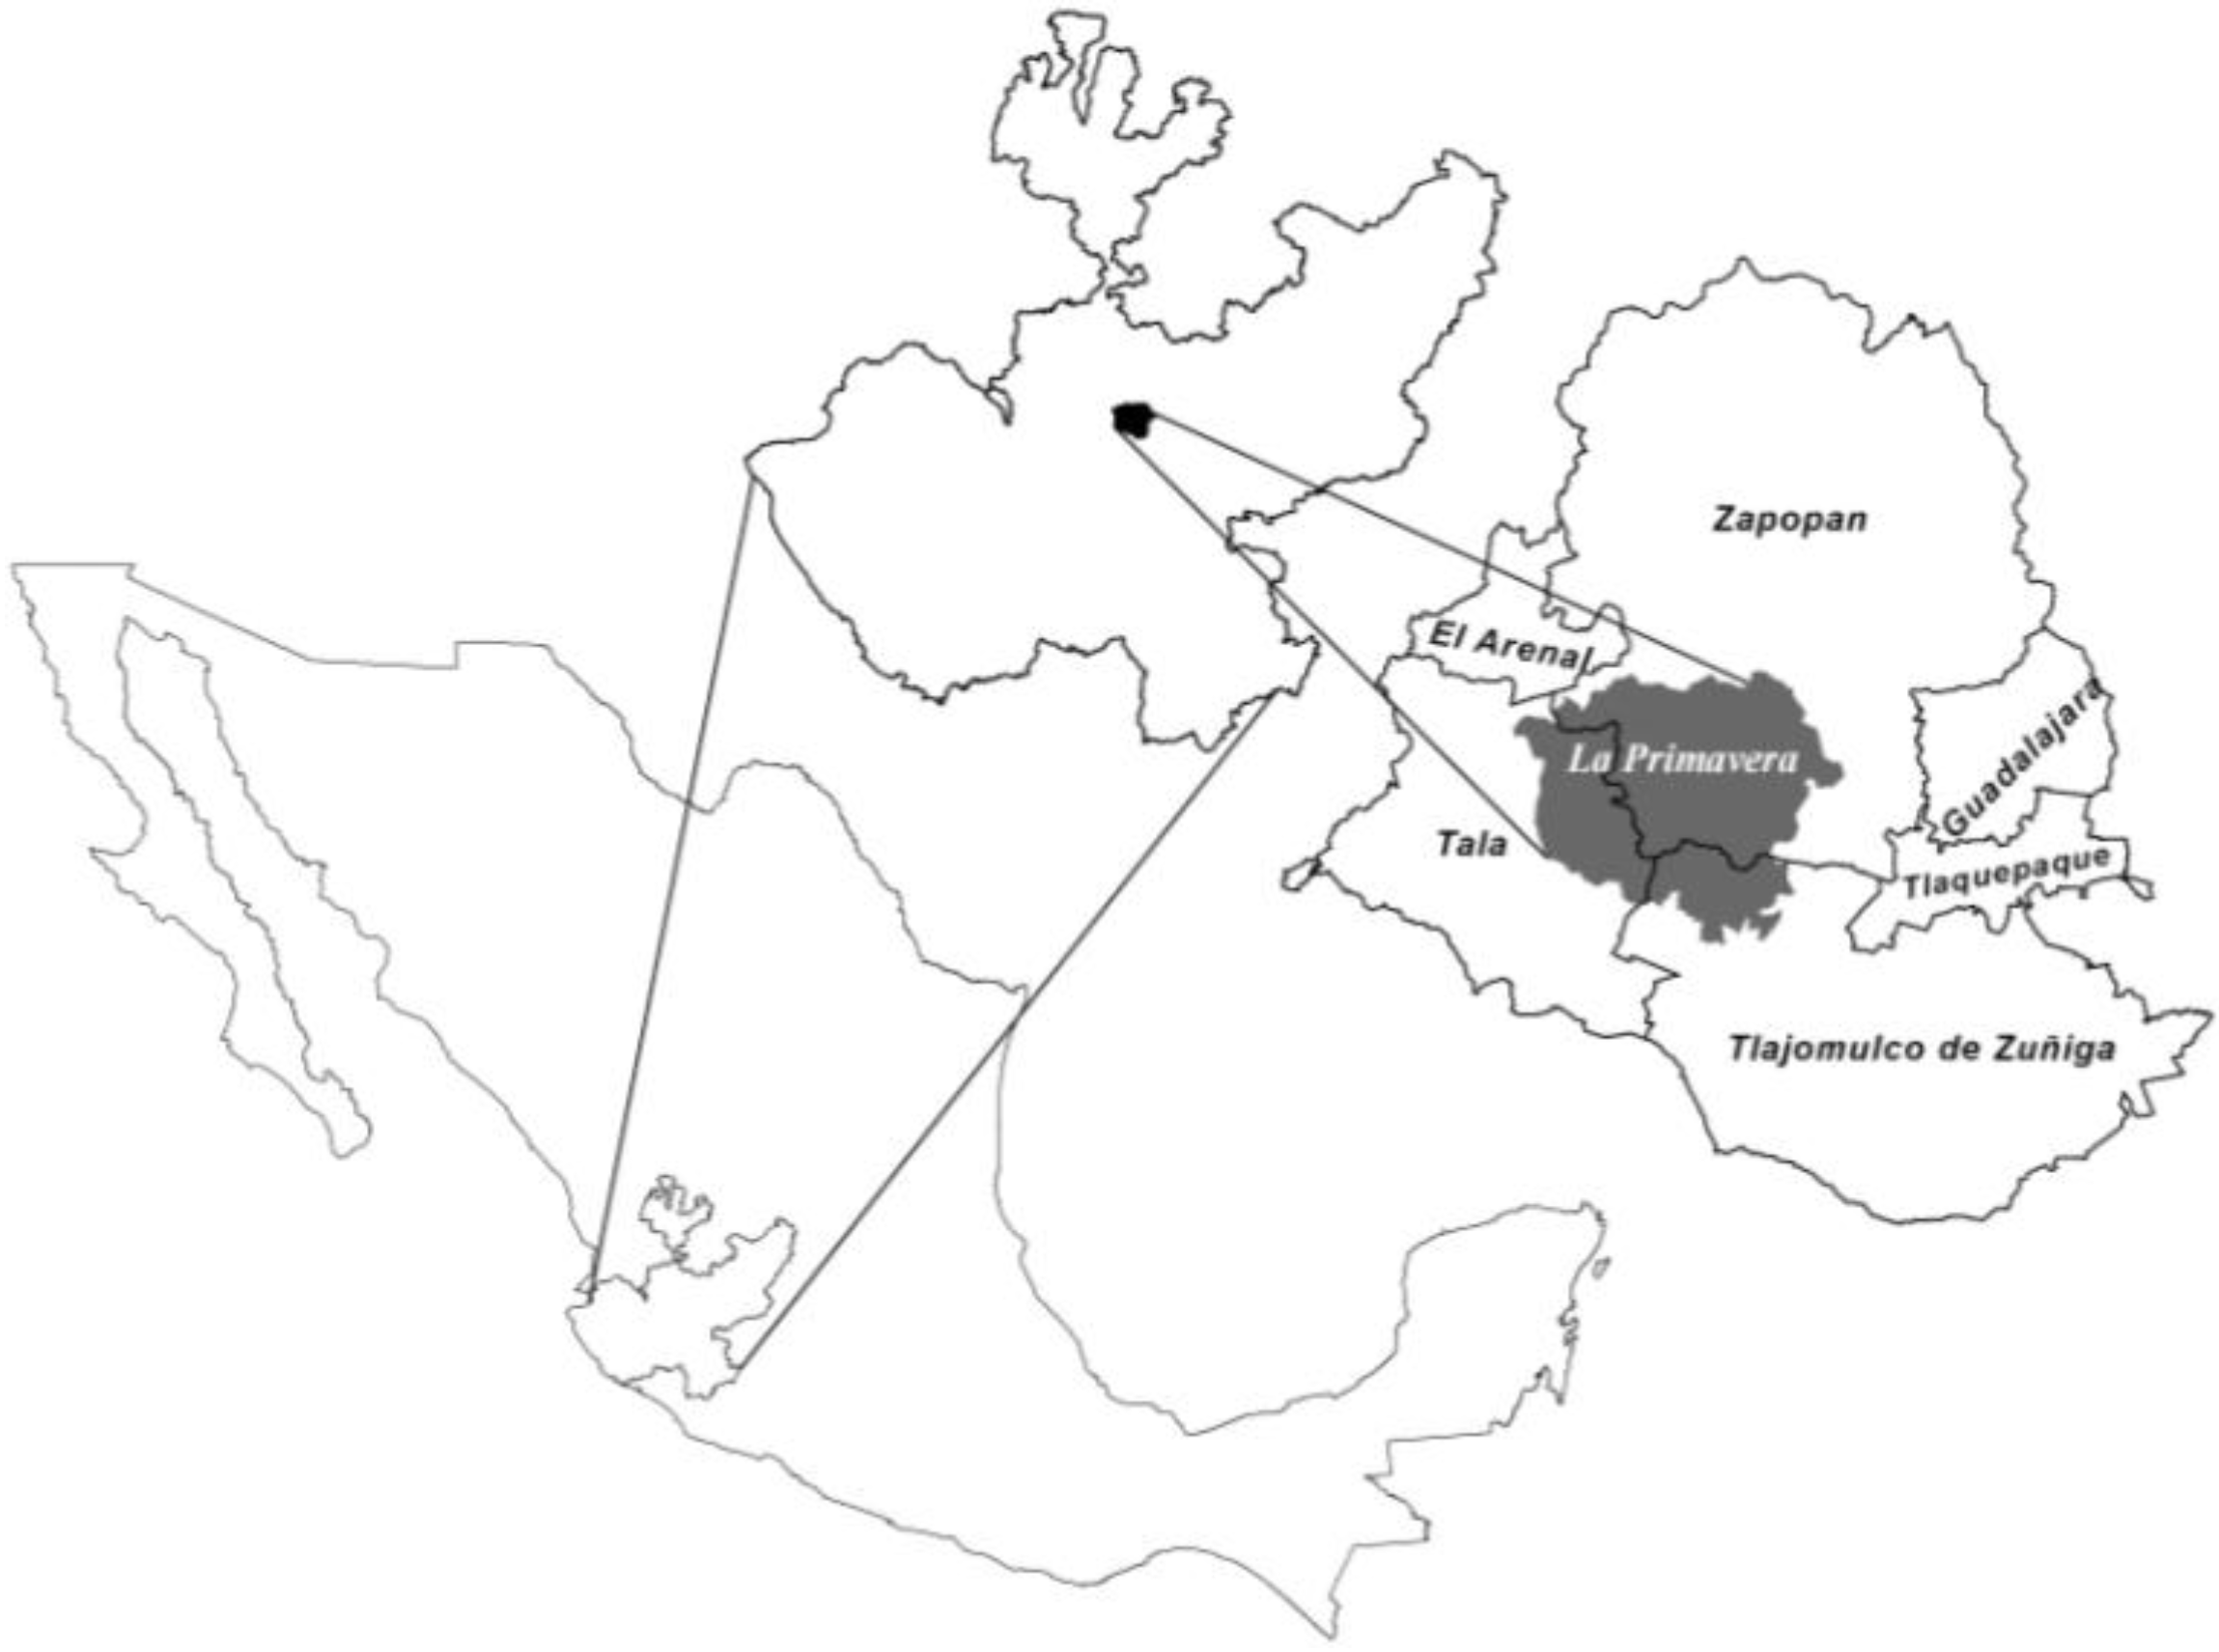
La Primavera forest is a Biosphere Reserve of 30,500 ha located in the State of Jalisco in México (Figure 1) [18,19]. According to its management plan, La Primavera consists mainly of oak-pine mixed forests, but natural grasslands and agricultural areas are also present. The altitude ranges from 1400 to 2200 meters above sea level (masl). Annual mean temperature is 20.6 °C (± 6 °C) and annual precipitation ranges from 800–1000 mm. Regosols and lithosols are the principal types of soils present; in general, the soil is poor and affected by erosion and recurrent fires [18]. From 1998 to 2012, the aggregate area affected by fires was 29,722 ha [20], including 8200 ha, which burned in April 2012 [21].
According to the IPCC guidelines [1,22], La Primavera corresponds to a Tropical Montane System (i.e., temperature > 20 °C and altitude above 1000 masl, and it would be classified as “Dry”, <1000 mm). According to the first inventory of greenhouse gas (GHG) emissions and removals in Jalisco [23], preliminary estimates of gross losses in carbon stocks in biomass (not accounting for enhancements and other carbon pools) between 2002 and 2008 in Jalisco are around 1.01% per year, while for the municipalities of Tala, Tlajomulco and Zapopan, where La Primavera is located, the gross rates of loss of carbon stocks were 2.30%, 2.17% and 1.36%, respectively (average 1.84%). These figures are estimated following the most recent IPCC guidelines [1] based on national cartography for the representation of land (Approach 3) [24,25]; emission factors at Tier 2 [26]; and statistics on forest fires and timber production [27,28].
Figure 1. Study area. The location of La Primavera in México, the State of Jalisco and neighbouring municipalities.
Forests 04 01032 g001
Although no earlier published forest inventory to estimate carbon stocks data were available, historical evidence indicates that carbon stocks in La Primavera are decreasing, or at least not increasing. According to La Primavera’s management plan, in 1970, the forest area was 25,764 ha, the remaining area being agriculture, grasslands and bare soil; the forested area decreased to 24,463 ha in 1990 [18]. This change alone represents a loss of 5% of forest area over 20 years (0.3% annually). However, forested areas have also been subject to recurrent fires, most of them associated with human activities (e.g., agricultural practices or even deliberate fires set in an attempt to change land use [29]). From 1998 to 2012, the aggregate area affected by fires was 29,722 ha (Martinez, 2012), including 8200 ha, which burned in April, 2012 [21]. This is equivalent to 122% of the current forested area, which means that, on average, fires affect 9% of the forested areas every year. Whether these disturbances result in land conversion (e.g., forests to grasslands) and should be accounted for as definitive carbon losses (deforestation) depends on the rate of recovery of the affected areas. If affected areas fail to recover to canopy cover levels above the thresholds for forest definition in a period of 20 years, they would be reclassified in another land use category, and the forest loss would have to be accounted for, in the context of GHG inventories [8]. However, if areas affected by fires slowly recover to previous biomass stock levels (i.e., above the thresholds for forest definition), fires would not be considered to have resulted in land use category changes or forest loss (instead, the temporary losses would be considered to be degradation), although non-CO2 emission from fires still would need to be accounted for [8]. If the areas recover, but do not reach previous stock levels, net emissions from degradation could be estimated.

3. Methods

3.1. Forest Inventory

The forest inventory focused on measurement of trees in oak-pine mixed forests; 103 measurement plots of 30 × 30 m were established between June–July, 2009. The variables measured included diameter at breast height (DBH, at 1.3 m), total tree height, height to the base of living crown and crown diameter. All trees with DBH larger than 7.5 cm were measured; sprouts bifurcating below 1.3 m height were considered as individual trees. The basal area was obtained by summing the cross-sectional area at breast height for all trees in the measurement plots; the site slope was measured with a clinometer. Sites were located over areas with slopes of less than 65%. Canopy cover was obtained by mapping the shade contour of the crowns of the trees present in the plot and then computing the area covered by them [30]. Sampling was random and stratified for three levels of canopy cover: low (10%–30%), medium (30%–60%) and high (>60%).

3.2. Allometric Equations and Growth Models

First, biomass in trees was estimated using the equations for below and above ground biomass for pines and oaks [31] (Equations 1 and 2). These equations were developed in north-western México in oak-pine forests with similar soil and precipitation conditions to those of La Primavera; these are considered to be the best available equations for biomass for our case, since there are no allometric equations developed specifically for the study area. Biomass figures are later converted to carbon, assuming biomass has 50% carbon content, and to CO2eq using the factor (44/12) [22]. In Equation (1), the specific gravity (ρ) for oaks is 0.63 and for pines is 0.55 [31].
Aboveground_biomass = 0.0752 × DBH24448 × 2.0031ρ
Belowground_biomass = 0.0051 × DBH2668
Based on the National Forest Inventory, Návar-Cháidez [32] indicates that the productivity (growth rate) in mixed oak-pine forests in Nuevo Leon (north-eastern México) is low, with an average diametric increment of less than 0.36 cm/year. Merlín-Bermudes [33] studied the growth of oaks in the stage of Durango and presents figures for the growth of Q. sideroxyla Humb and Bonpl, which are also low (<0.30 cm/year), indicating that oaks may reach diameters of 20 cm only after 150 years. The DBH-age growth model presented by Merlín-Bermudes [33] is used to derive the equation for the yearly diametric increment for oaks as a function of current DBH (Equation 3). Equation (4) gives the annual growth rate of mixed pines and oaks based on observations of the time, required for a 5 cm increase in DBH, given different starting DBHs based on the information of Návar-Cháidez [32]. The units of the increments, the left side of Equations (3) and (4), are given in cm/year. For each tree in the inventory, we calculated the potential increment based on the initial (measured) DBH and the yearly increase over a given period of time, using the growth model of Merlín-Bermudes [33] for the oaks and the growth rate observations of Návar-Cháidez [32] for the pines.
Increment_Oaks = 0.1184 × ln(DBH) − 0.1036
Increment_Pines = 1.1384 × DBH−0.47
Based on Equations (3) and (4), the increments in DBH of the trees measured in the inventory are obtained for periods of 5 years up to 30 years, then for a period of 30 years (60 years from present) and a final period of 40 years (100 years from present). Based on the final DBH at the end of each period, Equations (1) and (2) are used to estimate the new carbon stock and enhancement for 30, 60 and 100 years for each tree and at the inventory plot level; the final basal area (m2/ha) at the end of each period is also calculated. Enhancement also includes the growth of new trees recruited in the areas without canopy cover; this growth modelling assumes a zero mortality of trees in each plot; this is an initial approach, and more advanced modelling should consider this aspect (e.g., for instance, mortality rates can be obtained as part of a second round of inventory measurements). When the value of basal area or carbon content in a plot reached 40 m2/ha and 625 tCO2eq/ha (ton of CO2 equivalent), respectively, no further enhancements were allowed in the calculation, to prevent the estimation of values above the maximums registered in La Primavera. The potential for carbon sequestration in non-forest areas is estimated using Equations (3) and (4) and for a reforestation plan of 300 oak and 400 pines per hectare.

3.3. Forest Area

In order to generate carbon estimates for La Primavera, forest area was estimated from local cartography in combination with the analysis of recent mid-resolution satellite imagery (Landsat from March, 2011). The use of Landsat images has been suggested by some parties for the first stages of REDD+, since it provides information over a relatively long time span (from 1990 to 2005) and is freely available [14]. A Landsat L5 scene from March 1, 2011 (pixel resolution: 30 m), was classified through the algorithm identifying bare earth, vegetation with low (10% to 30%), medium (30%–60%) and high cover (above 60%) and other classes according to its spectral signatures [34,35].
Suitable Landsat scenes closer to the time of the inventory were unfortunately not found; requirements were that they should cover the whole area, be relatively cloud free and have been taken in the same months as the inventory. The scene from March, 2011, was selected because no major forest fires were reported between the time of the inventory and the date of the satellite image and it was the one closest to the dates in which the inventory was done. The most recent large fire before the inventory occurred was in 2005 and affected about 11,000 hectares in the western part of La Primavera [20].
The Land Use and Vegetation Map Series IV [25] of the National Institute for Geography and Statistics (INEGI) was used as a mask to identify oak-pine forested areas; INEGI Series IV is based on 2007–2008 SPOT (Satellite Pour l’Observation de la Terre) images with field verification from 2006–2007 [36]. Using INEGI’s polygons, the pixels inside the forest area were then classified as non-forest (i.e., bare earth) or according to the vegetation cover level taken from the Landsat image (low, medium and high) (Figure 2).

3.4. Tiers 1 and 2 Values for Carbon Stocks and Increments in Oak-Pine Forests

Carbon content in forests varies across ecosystems and with management practice and the degree of conservation. In the case of oak-pine mixed forests, default values of carbon in biomass range from 94 to 204 tCO2eq/ha using the Revised 1996 IPCC methodologies [22]; and from 140 to 540 tCO2eq/ha for the mountain tropical climatic region in the most recent guidelines published by the IPCC [1]. These values correspond to Tier 1 level emission factors. Carbon content figures based on the national forest and soil inventory (Tier 2 data) are 150 tCO2eq/ha (uncertainty (U) = 6%) for primary and 66 tCO2eq/ha (U = 14%) for secondary mixed forests [26]. Using the land cover classes from INEGI [25], the mean weighted value for carbon content in La Primavera, based on the national data, is 149 tCO2eq/ha (142–157 tCO2eq/ha, 95%, Confidence Interval (C.I.), U = 5%) [26].
Figure 2. La Primavera, Landsat 5 image classified by canopy cover level.
Forests 04 01032 g002
Basal area is also often used as a proxy for biomass and carbon content (e.g., [37]). In a local study developed in the Rio Salado watershed that accounts for 40% of the area of La Primavera, the mean basal area was found to be 12.6 m2/ha and was positively correlated with canopy cover as estimated from aerial photographs [38]. In the work presented here, however, the forest inventory covers the whole of the Biosphere Reserve and takes into account variations in canopy cover as measured from the ground, and this is used to derive carbon content in arboreal biomass, with the help of published allometric equations. The default and the national and local published values are then compared with the results of the forest inventory.
The IPCC default values for annual biomass growth in Tropical Mountain Systems and vegetation types most similar to those of La Primavera are presented in Table 1. In the IPCC guidelines, these values are used to estimate carbon removals by biomass growth in forested areas for the purposes of national GHG inventories. According to Tier 2 level data, in secondary (abandoned) mixed oak-pine forests, the biomass increment during 1993–2002 was 1.1 tonnes of biomass/ha/year (0.9–1.3 tonnes of biomass/ha/year, 95% confidence interval (C.I.)) [26].
Table 1. Default values for annual biomass growth factors in Intergovernmental Panel on Climate Change (IPCC) guidelines.
SourceClimatic Domain and Vegetation TypeAnnual Growth
(ton/ha/year) *
IPCC, 2006Natural Forests in Tropical Mountain Systems
North and South America (<20 year)2.0–6.4
North and South America (>20 year)0.6–1.9
Plantations in Tropical Mountain Systems
Americas Pinus12.7
Americas Other Broadleaf5.2
* Annual growth of aboveground biomass (AGB) [1]; belowground biomass is added based on the equation for belowground biomass (BGB) published by Cairns et al. [39]; BGB = exp[−1.0587 + 0.8836 × ln(AGB)].

4. Results

4.1. Forest Inventory and Carbon Stocks

The general results of the inventory at the plot level are presented in Table 2; 3412 trees of 14 species were measured (oaks (nine species), pines (two) and other genera (three)). The dominating species were Q. resinosa Liebm. and P. oocarpa Schiede ex Schltdl. Balderas Torres and Lovett [40] presented general results of the inventory when exploring the relationship between carbon and basal area.
Table 2. General characteristics of the forest inventory at plot level in oak-pine forest in La Primavera, México (mean, standard deviation and range)(Adapted from [40]).
VariableMeanS.D.Range
Basal Area (Inventory) (m2/ha)17.07.51.9–37.0
Weighted Mean Basal Area (m2/ha) a12.53.711.7–13.3 b
Canopy Cover (%) c54%22%10%–96%
Density (trees/ha)36828011–1144
Mean Diameter at Breast Height (DBH) in Site (cm)27.315.814.7–158.0
Mean Crown Diameter in Site (m)6.34.41.9–36.3
Mean Height in Site (m)12.24.33.6–35.9
% of Oaks62%30%0%–100%
Slope (%)12.0%9.3%1.0%–60.0%
Altitude (masl)1711971410–2180
a Weighted stratified mean and standard deviation (S.D.) according to forest area under each canopy cover class. Stratified mean and variance computed following standard statistical methods [41]. b Corresponds to 95% C.I. based on the standard error of the stratified basal area [42]. c Canopy cover maps were drawn in 90 sites.
Table 3 shows the carbon content per hectare and the 95% confidence intervals obtained in the inventory for mixed forests with low, medium and high canopy cover levels. Figure 3 presents the level of carbon stocks as a function of canopy cover for the three classes (low, medium and high canopy cover (CC)). It fits a quadratic function well, and as shown in Table 3, the carbon mean of the three CC classes are independent. One of the difficulties of using canopy cover to model carbon is that this variable has an asymptotic value of 100%, while carbon can continue increasing (e.g., [43]). However, Figure 3 can help in modelling emissions from deforestation and forest degradation given initial values of canopy cover.
Table 3. Carbon content in arboreal biomass in oak-pine mixed forest in La Primavera México (tCO2eq/ha). Mean values and confidence intervals based on the standard error of the mean (S.E.).
StrataMean (SD)Range (95%)S.E.CI (95%) aU bn
Canopy Cover (CC) (%)Low CC <30%130 (63)59–2581792–16829%13
Medium CC 30%–60%199 (77)93–37112175–22212%43
High CC >60%336 (120)161–62421293–37913%33
a Based on the standard error of the means [42] and using the t-values for two-tailed 95% confidence interval (CI) b Percentage Uncertainty (U) (%); this it half the 95% confidence interval divided by the mean.
Figure 3. Relationship between canopy cover (CC) and carbon content for Low (<30%), Medium (30%–60%) and High CC (>60%) in oak-pine mixed forest in La Primavera, México (mean values and 95% confidence intervals).
Forests 04 01032 g003
The weighted mean for carbon is 170 tCO2eq/ha (160–181 tCO2eq/ha, 95% C.I, U = 6%). Table 3 shows the differences in carbon stocks for forest areas with different canopy cover levels. There is no overlap in the confidence intervals of the three types of areas showing the differences in carbon stocks at different levels of canopy cover. However, it can be noticed that the uncertainty for the areas with low CC is larger due to the smaller sample size. Considering the size of the inventory plots chosen, the incidence of areas with low canopy cover levels was lower (i.e., when there were few trees, these tended to be large, thus easily covering more than 30% of the plot). This could have been solved if we had used larger plot sizes for the low canopy cover class; however, the plot size was held constant to keep the consistency across the three canopy cover classes. Nevertheless, the differences in the level of carbon stocks indicate the general trend in carbon loss that can be associated with forest degradation measured as reductions in canopy cover. Table 4 presents the carbon content in La Primavera obtained by multiplying the area of each cover class by the corresponding carbon content.
Table 4. Carbon content estimate in arboreal biomass in oak-pine mixed forest in La Primavera (mean values and 95% CI; values in MtCO2eq).
Canopy Cover ClassArea (ha)Mean (Minimum–Maximum)
Low CC10,6051.38 (0.98–1.78)
Medium CC13,4422.67 (2.35–2.98)
High CC3240.11 (0.09–0.12)
Total24,3714.16 (3.42–4.89)
Minimum/maximum according to the 95% CI in Table 3; non-forest area: 6265 ha; overall area results in 30,636 ha, due to the effect of pixel size of the Landsat image and the boundary of the polygon of the Biosphere Reserve; the difference is 0.4%.

4.2. Carbon Removals

Table 5 presents the biomass growth rates expected in La Primavera forest, by areas of different initial canopy cover, together with the potential carbon sequestration from reforestation in non-forested areas (lower part of the table).
As mentioned earlier, the inventory information was used to set a limit on the potential growth of trees. We consider that it is unlikely that forests can reach values greater than 40 m2/ha for basal area and 625 tCO2eq/ha for carbon content, since these were the maximum values found during fieldwork. For this reason, in the forest areas with high canopy cover, growth stops from year 60 onwards, as most sites will have reached a total basal area of above 35 m2/ha. For the case of reforestation, considering the slow growth rates implied by Equations (3) and (4), it is clear that it will take longer for oaks to grow and capture carbon and reach their maximum biomass (100–200 years). This is reflected in the fact that, after 30 years, the expected basal area for this reforestation plan will be relatively low (<8 m2/ha). The estimated basal area figures after 100 years for areas with medium and high CC and for afforestation/reforestation are considerably higher than the basal area values measured during the inventory. This indicates that the predicted increments in stocks over long time horizons may not be realistic given the limits on growth imposed by soil quality and disturbances (e.g., fires).
Table 6 shows the potential for carbon enhancement in forest (natural increases due to growth once forests are better protected) and carbon sequestration (in new plantation of trees) in La Primavera. The table includes the potential enhancements at 30, 60 and 100 years. Over a 100-year horizon, it can be seen that potential carbon removals would be higher than the current levels of carbon stocks in aboveground biomass (e.g., mean values 11.21 vs. 4.16 MtCO2eq). However, as presented in Table 5, to reach the levels suggested in the 100 horizon, the forest would have to grow to basal areas higher than those observed in any of the measurement plots. For this reason, the scenario for potential carbon removals is restricted to the actual maximum basal areas observed in the field inventory (last column in Table 6). In this scenario, it is assumed that areas with a high canopy cover level are already in equilibrium; thus, further enhancement would not be expected. Areas with low canopy cover and those afforested/reforested would grow up to the value presented for the 60 year horizon, reaching mean basal areas of 21.4 and 18.8 m2/ha respectively; enhancements in areas with medium canopy cover would be those corresponding to a horizon of 30 years, with a mean basal area of 23.6 m2/ha. Under the restriction imposed by current maximum basal area, the potential carbon removals will be still of higher magnitude than current carbon stocks (5.61 vs. 4.16 MtCO2eq), meaning that in the long run (60 years), there is the potential to double standing stocks in La Primavera.

4.3. Reduced Emissions and Total Forest Carbon Services

The results in Table 5 and Table 6 indicate the potential magnitude of carbon enhancements that could be reached under programs offering incentives through valuing forest carbon services (e.g., PES, voluntary carbon markets or REDD+). To fully estimate the potential carbon gains from improved forest management in La Primavera, it will be necessary to include the potential gains from emissions reductions. Although the REL will (eventually) be set as part of national or sub-national REDD+ activities, it is possible to evaluate how RELs set at different levels would influence the quantification of forest carbon services. Based on information on carbon stocks and potential removals, Table 7 shows the scale of potential reduced emissions and total forest carbon services in La Primavera at two different RELs (1.0% and 3.7%); average yearly values are obtained over the relevant time horizons. The first value (1.0%) was selected because it is comparable to the initial estimate of emissions from forest loss in Jalisco [23], while the second corresponds to that required to prevent perverse incentives in the valuation of reduced emissions, as discussed below.
Table 7 shows that given the higher initial level of carbon stocks, potential emissions reductions will be higher in areas with higher levels of CC. However, if management of areas following degradation processes is successful and enhancements are produced, this would imply that because an unknown rate of degradation has been reversed, carbon gains measured in terms of enhancement alone will underestimate climate benefits [17]. Thus, total forest carbon services can be obtained by the aggregation of potential removals plus emissions reductions. At an REL of 1.0%, total carbon gains in areas with high CC (conserved forests in equilibrium) will be lower than those for areas with low and medium CC and even slightly lower than those for reforestation/afforestation activities. Only when the REL is equal to 3.7% will carbon gains in areas with high CC match those of medium CC at mean values. Figure 4 presents a graphic representation of the changes in the aggregated forest carbon services in areas under degradation, or at risk of deforestation, as a function of the REL. This demonstrates how, for lower REL values, potential carbon gains are lower in well-conserved forests in equilibrium. For reforestation/afforestation, potential carbon benefits are independent of the REL. Considering these figures for reduced emissions, yearly carbon services provided by La Primavera, including enhancements, sequestration and reduced emissions, could be between 169.4 ktCO2eq/year (134.8–204.5) and 282.1 ktCO2eq/year (228.2–337.1) for the RELs of 1% and 3.7%, respectively. Over a period of 60 years, this would be equivalent to 2.4 and 4.1 times the magnitude of mean standing stocks at the time of the inventory.
Table 5. Biomass growth rates and expected basal area in La Primavera (mean values, and 95% CI).
Change DescribedMean Biomass Growth Rate (ton/ha/year)Basal Area (m2/ha)
0 to 30 years30 to 60 years60 to 100 yearsInitial30 years60 years100 years
Enhancement Forest Areas
Low CC1.7 (1.0–2.4)2.1 (1.4–2.7)2.0 (1.2–2.8)9.4 (6.3–12.6)15.9 (9.5–22.2)21.4 (15.6–27.3)29.6 (23.6–35.5)
Medium CC2.8 (2.5–3.2)2.3 (1.8–2.8)0.4 (0.2–0.7)14.0 (12.5–15.5)23.6 (21.0–26.1)33.5 (30.6–36.5)40.0 (37.7–42.3)
High CC3.2 (2.4–3.9)0.2(0.0–0.4)0.1 (0.0–0.3)23.7 (21.5–25.9)37.0 (34.3–39.8)38.8 (37.1–40.6)39.6 (38.9–40.2)
Reforestation/Afforestation
Oaks (300 trees/ha)0.04 (0.03–0.06)0.12 (0.09–0.14)0.5 (0.4–0.6)-0.4 (0.3–0.5)1.2 (0.9–1.6)4.7 (3.5–5.8)
Pines (400 trees/ha)1.23 (0.92–1.54)2.47 (1.85–3.093.6 (2.7–4.5)-7.2 (5.4–9.0)17.6 (13.2–22.0)34.5 (25.9–43.5)
Total Reforestation/Afforestation1.27 (0.96–1.59)2.58 (1.94–3.23)4.1 (3.1–5.1)-7.6 (5.7–9.5)18.8 (14.1–23.5)39.2 (29.4–48.9)
Table 6. Potential for carbon enhancement and sequestration in arboreal aboveground biomass in oak-pine mixes in La Primavera (MtCO2eq).
Carbon Enhancement/Removals30 years60 years100 yearsScenario Restricted by Basal Area
Enhancement in Existing Forests
Low CC0.99 (0.58–1.40)2.22 (1.40–2.97)3.77 (2.33–5.15)2.22 (1.402.97)
Medium CC2.07 (1.85–2.37)3.77 (3.18–4.44)4.16 (3.38–5.13)2.07 (1.852.37)
High CC0.06 (0.04–0.07)0.06 (0.04–0.08)0.06 (0.04–0.08)-
Sub-Total Enhancement3.12 (2.47–3.84)6.05 (4.62–7.49)8.00 (5.75–10.36)4.29 (3.255.34)
Sequestration in Non-Forest areas Afforestation/Reforestation0.44 (0.330.55)1.33 (0.991.66)3.21 (2.414.01)1.33 (0.991.66)
Total Potential Removals (Enhancement + Sequestration)3.56 (2.804.38)7.37 (5.629.15)11.21 (8.1614.37)5.61 (4.247.00)
Total Potential Future Carbon Stocks (Actual + Potential Removals)7.72 (6.22–9.27)11.53 (9.0414.04)15.37 (11.5819.26)9.77 (7.6611.89)
Table 7. Potential forest carbon services from reduced emissions and removals in La Primavera. All values in tCO2eq/ha/year and correspond to the mean, minimum and maximum values (95% CI; REL, reference emissions level).
Forest AreasReforestation/Afforestation (60 years)
Low CCMedium CCHigh CC
Reduced Emissions, REL = 1.0%1.3 (0.9–1.7)2.0 (1.7–2.2)3.4 (2.8–3.7)-
Reduced Emissions, REL = 3.7%4.8 (3.4–6.2)7.3 (6.5–8.2)12.6 (10.3–13.7)-
Carbon Removals3.5 (2.2–4.7)5.1 (4.6–5.9)-3.5 (2.6–4.4)
Total Forest Carbon Services, REL = 1.0%4.8 (3.1–6.3)7.1 (6.3–8.1)3.4 (2.8–3.7)3.5 (2.6–4.4)
Total Forest Carbon Services, REL = 3.7%8.3 (5.6–10.9)12.5 (11.1–14.1)12.6 (10.3–13.7)3.5 (2.6–4.4)
Figure 4. Potential forest carbon services in La Primavera as a function of the REL (considering mean values for carbon stocks and potential removals).
Forests 04 01032 g004

5. Conclusions

5.1. Comparison with Default Values and Local Studies

The estimates of carbon stocks obtained in this study are within the range of the default values provided by the IPCC and are also consistent with published information in México for this type of vegetation. The weighted mean for carbon stock is closer to the higher end of the range of default values for this vegetation type as first published in the Revised 1996 IPCC methodologies [22]; however, it is very close to the lower limit of the range of the values published in IPCC’s more recent guidelines [1]. Estimates of carbon stocks are higher than those based on the national inventory [26] (i.e., a mean value of 149 tCO2eq/ha, as described above). However, this is partly due to differences in the allometric equations used. De Jong et al. [26] used the equations published by Brown [44] and Cairns et al. [39] because they generate the most conservative values ([26], p. 1699). If these equations are applied to the inventory data presented here, the weighted average value for carbon in biomass becomes 141 tCO2eq/ha (133–149 tCO2eq/ha, 95% CI), which is even lower, but not statistically different, than the estimate based on the national estimates by de Jong et al., of 149 tCO2eq/ha (142–157 tCO2eq/ha, 95% CI).
The results of the forest inventory are also similar to estimates of the level of stock published earlier for La Primavera, expressed in terms of basal area. The weighted basal area found here is in agreement with the figure found in the Rio Salado watershed (i.e., 12.5 m2/ha vs. 12.6 m2/ha) [38]. However, the basal area for the high CC areas, 23.7 m2/ha (21.5–25.9 m2/ha, 95% CI), is higher than the 18.5 m2/ha for the class with high canopy cover in Rio Salado, although there is an overlap of the confidence intervals (14.8–22.3 m2/ha, 95% CI, CC > 75%). Something to consider in explaining this is that the largest trees found in the inventory presented here were Q. castanea Née, and this specie is not reported in the inventory for the study in Rio Salado. The sampling of areas outside Rio Salado watershed and at higher altitudes, where larger trees were present, increased the basal area values for this canopy cover class in our forest inventory.
The biomass growth rates presented in Table 5 are similar to those reported in the IPCC guidelines for natural forests (Table 1): they are at the higher end of areas older than 20 years and the lower end limit for younger forests (<20 years). They are well below the values reported for plantations for this climatic domain. When differences due to the selection of the allometric model are considered, the growth figures are also within the range provided by national data. The general agreement in the results of the local data with that obtained at the national level indicates that there were no biases during the sampling, and thus, the results for different canopy cover levels can help to set reference values for stock levels in degraded areas.
If default values are to be used to generate conservative figures of carbon stocks and potential enhancement in this type of vegetation and climatic domain, one recommendation is to select values closer to the lower end of the ranges provided by IPCC; otherwise, it is likely that default values would overestimate carbon content and enhancement figures, especially in degraded areas. This issue is relevant, because as mentioned before, it may be necessary to use default data to make estimates of carbon stocks and stock changes in REDD+, at least during the first stages of implementation. In this context, it is necessary to define what is meant by “conservative” estimates. Usually, conservative estimates refer to values that lie below the real ones. However, the IPCC default carbon content values refer to undisturbed areas of forest [14]; thus, when default factors are used in forest areas that have been degraded, or that have a lower carbon density or canopy cover than intact forests, carbon content and subsequent emissions/removals may in fact be overestimated. Moreover, if default values are going to be used to estimate potential enhancement over long periods of time, it is necessary to determine the higher end limit for enhancements, as we have presented, using the locally observed values for basal area. Failing to set a limit when growth is modelled over a large period of time may result in unrealistic estimates of potential stock levels, i.e., above those that can be observable in reality. The careful selection of appropriate allometric models is indeed one of the most important aspects to be considered in assessing carbon stocks, since differences between equations is one of the largest contributors to the uncertainties of the estimates [45,46]. However, it is necessary to evaluate carefully the convenience of developing local equations, since a large effort might be required in terms of the number and diameter of trees that need to be included in the destructive sample [45,46].

5.2. Forest Carbon Services and Incentive Based Mechanisms

The values for potential carbon removals presented here are based on the modelling of tree growth. Although these are similar to default and nationally-derived values, it is still necessary to evaluate if improved forest management in La Primavera, including control of fires, grazing, soil improvement and fertilisation, would lead to carbon stock increases of the magnitude estimated. Field measurements over time in pilot areas under such management would be needed in order to assess the impacts of management improvements in terms of annual growth rates of stock. It is important to recall that the estimates presented here only considered one of the carbon pools (i.e., biomass in trees, above and below ground). If other carbon pools and emissions from forest fires and other disturbances are factored in, the potential enhancement and emissions reductions from sustainable management of La Primavera could be even higher. Given the faster growth of pines, including a higher proportion of pines in the mix would increase the initial rate of carbon capture over the first 100 years after reforestation. In many areas, the presence of pines has been reduced precisely because of their higher vulnerability to the frequent fires; in this sense, the oaks have a competitive advantage, as they have a great facility to produce new sprouts when the stem has died in the fire, provided the root is not affected (e.g., [47]). If carbon sequestration is to be included as an element of the management plan in La Primavera, the advisability of reintroducing pines (P. oocarpa) in areas where it has presumably been displaced by frequent forest fires should be carefully considered. If increasing the densities of pine is adopted as part of the forest management plan, any thinning that takes place in the future should be considered as a carbon loss (degradation), unless carbon storage in durable wood goods or incorporation into other carbon pools can be demonstrated (e.g., deadwood, litter, soil).
The second point to consider in the quantification of forest carbon services in La Primavera is the way in which results-based climate change mitigation benefits from reduced emissions will be quantified. In this context, the level at which the REL is set will play a crucial role. There is a danger of perverse incentives and moral hazards associated with this, since compensation would be potentially higher to those who had previously deforested/degraded forests than to those with better previous performance (e.g., [48]). Adequate and effective policy instruments to control and incentivize reduction in emissions from deforestation and degradation and conservation of carbon stocks in forests should be considered as a complement to incentives for carbon removals, preventing the creation of perverse incentives (e.g., land use change regulations, judicial processes, improved management practices, payments for conservation).
In practice, in order to promote carbon enhancements and sequestration, the essential first step is to address the issues associated with carbon emissions (e.g., fires and deliberate land use change), as the recurrence of human-induced disturbances can compromise the permanence of carbon gains. If activities to increase carbon stocks are to be implemented in La Primavera, then additional issues that need to be considered in estimating forest carbon services are the permanence and risks arising from future disturbances and the potential leakage from displaced agricultural and grazing practices.

5.3. Further Work

The area of forest in La Primavera with high canopy cover, as estimated from the Landsat image, is quite small (Table 4). This may indicate the degree of degradation of the forests; however, it could also indicate systematic differences in the methods used to assess canopy cover. In the canopy maps drawn during fieldwork, the crowns were considered “solid”, which results in an overestimation of canopy cover in comparison with the estimates made from the satellite image. The remote sensor detects soil and signals of other non-photosynthetic materials through the spaces within the canopy; this produces a conservative result for forest area under each forested canopy cover class. An alternative could have been to select a scene corresponding to the rainy season, when the foliage would have been denser. However, grasslands and seasonal vegetation might then have been interpreted as aerial vegetation [35], thus resulting in overestimation of canopy cover, forest area and carbon stocks. In trying to reduce this problem, the Series IV of INEGI was used as a mask to identify forest and non-forest areas and then subtracting pixels classified as bare land to refine the value for forest area. An alternative approach would have been to determine on the ground the factor of “light porosity” of tree crowns and, thus, develop a factor to reduce the canopy cover levels measured during fieldwork by a given percentage. This would have most likely resulted in the increase in estimated carbon stocks for the lower canopy cover classes, since some plots in the inventory, which were identified with higher cover and carbon, would have changed classes. The problem of describing changes in canopy cover accurately and precisely is one of the well-known limitations in the use of mid-resolution imagery for detailed studies of degradation and enhancement in forests. For future works, the identification of individual tree canopies and canopy cover from high-resolution imagery or aerial photographs could be used in combination with the results from the inventory, to refine the carbon estimates presented here.
The local inventory described corresponds to a Tier 3 approach under recent IPCC guidelines. However, suggested practices for the full implementation of Tier 3 were not adopted. The following activities could be performed as part of future fieldwork to refine the estimates: verify the suitability of the allometric equations used; undertake external verification and advanced quality assurance and control practices during a second inventory campaign; use satellite images with higher resolution; include other carbon pools (i.e., soils and organic dead matter); and include advanced forest dynamic models. It is necessary to undertake periodic forest inventories to monitor further increments and carbon enhancements in the different carbon pools.

5.4. Final Conclusions

Results indicate that in degraded forests, like La Primavera, long-term potential increments from forest enhancements might be comparable in size to the current carbon stocks. Results based on local field data stratified by canopy cover produce estimates that are comparable with the lower ends of the IPCC default values for carbon content in biomass and with national inventories in México. Results also indicate that it may not be unreasonable to use conservative IPCC default values to estimate carbon stocks in biomass. Estimates of biomass growth based on inventory data and equations modelling tree growth also provide results similar to default values, but it is necessary to validate these figures as part of future work; especially if modelling over the long term is required. While it is possible to get conservative estimates of carbon enhancements using mid-resolution satellite imagery, such as Landsat, in combination with ad hoc forest inventories, it is necessary to identify any systematic errors in the evaluation of canopy cover by comparing the results drawn from this set of remotely sensed data with high resolution images or photographs. However, the results presented here can help to identify the scale and differences in carbon stocks and potential enhancements across areas with different levels of degradation. In order to estimate the potential total carbon forest services that could be produced in the study area, the effect of the selection of the REL was analysed. The selection of the REL is a critical aspect in defining the scale of total forest carbon services. Moreover, it is necessary to design the appropriate mix of incentives and controls to reduce emissions and enhance carbon without generating moral hazards and perverse incentives. Although carbon enhancements can be measured in areas currently under the threat of degradation or deforestation, it is important not to forget that the risk imposed by the very factors driving carbon emissions are the major obstacles in realizing carbon potential in forests under REDD+.

Acknowledgments

The authors thank Ana Luisa Santiago, Agustín Gallegos, Antonio Rodríguez Rivas, Raymundo Villavicencio, Adalberto Arias Menaut, Mara Belén, the students from the Instituto Tecnológico y de Estudios Superiores de Occidente and the La Primavera Executive Office for their contribution in the fieldwork of the forest inventory. The authors are grateful to Fernando Paz Pellat, Martín Bolaños and Edgardo Medrano for the help in the classification of the images following the algorithm by Palacios-Sanchez et al. (2006) and to two anonymous reviewers for their comments on a previous version of the manuscript. This research received funds from the Darwin Initiative (Project: 17027 to Jon C. Lovett and Arturo Balderas Torres). Arturo Balderas Torres acknowledges scholarships granted by the Consejo Nacional de Ciencia y Tecnología (CONACYT) and the Secretaría de Educación Pública (SEP) of the Mexican government.

Conflicts of Interest

The authors declare no conflict of interest.

References

  1. IPCC, Intergovernmental Panel on Climate Change, 2006 IPCC Guidelines for National Greenhouse Gas Inventories. Prepared by the National Greenhouse Gas Inventories Programme; Eggleston, H.S.; Buendia, L.; Miwa, K.; Ngara, T.; Tanabe, K. (Eds.) IGES: Hayama, Japan, 2006.
  2. Van der Werf, G.R.; Morton, D.C.; Defries, R.S.; Olivier, J.G.J.; Kasibhatla, P.S.; Jackson, R.B.; Collatz, G.J.; Randerson, J.T. CO2 emissions from forest loss. Nat. Geosci. 2009, 2, 737–738. [Google Scholar] [CrossRef]
  3. Canadell, J.G.; Raupach, M.R. Managing forests for climate change mitigation. Science 2008, 320, 1456–1457. [Google Scholar]
  4. Beerling, D.J.; Woodward, F.I. Vegetation and Terrestrial Carbon Cycle: Modeling the First 400 Million Years; Cambridge University Press: Cambridge, UK, 2004. [Google Scholar]
  5. Strassburg, B.; Turner, K.; Fisher, B.; Schaeffer, R.; Lovett, A. Reducing emissions from deforestation-The “combined incentives” mechanism and empirical simulations. Glob. Environ. Chang. 2009, 19, 265–278. [Google Scholar] [CrossRef]
  6. United Nations Framework Convention on Climate Change. Guidance on Systems for Providing Information on How Safeguards are Addressed and Respected and Modalities Relating to Forest Reference Emission Levels and Forest Reference Levels as Referred to in Decision 1/CP.16. In Proceedings of the 2011 Durban Climate Change Conference, Durban, KZN, South Africa, 28 November 2011–11 December 2011; UNFCCC: Durban, KZN, South Africa, 2012.
  7. Maniatis, D.; Mollicone, D. Options for sampling and stratification for national forest inventories to implement REDD+ under the UNFCCC. Carbon Balance Manag. 2010, 5, 9. [Google Scholar] [CrossRef]
  8. IPCC, Intergovernmental Panel on Climate Change, Good Practice Guidance for Land Use, Land-Use Change and Forestry, Prepared by the National Greenhouse Gas Inventories Programme; Penman, J.; Gytarsky, M.; Hiraishi, T.; Krug, T.; Kruger, D.; Pipatti, R.; Buendia, L.; Miwa, K.; Ngara, T.; Tanabe, K. (Eds.) IGES: Hayama, Japan, 2003.
  9. United Nations Framework Convention on Climate Change, Report of the Conference of the Parties on Its Fifteenth Session, Held in Copenhagen Held From 7 to 19 December 2009; FCCC/CP/2009/11/Add.1.; UNFCCC: Durban, KZN, South Africa, 2010.
  10. United Nations Framework Convention on Climate Change, Report of the Conference of the Parties on Its Seventh Session, Held at Marrakesh from 29 October to 10 November 2001; FCCC/CP/2001/13/Add.1.; UNFCCC: Durban, KZN, South Africa, 2002.
  11. United Nations Framework Convention on Climate Change. Minimum Values for Forests (A/R Projects). Designated National Authorities, México. Available online: http://cdm.unfccc.int/DNA/ARDNA.html?CID=140 (accessed on 20 May 2012).
  12. CONAFOR; National Forestry Commission. Visión de México sobre REDD+. Comisión Nacional Forestal: Zapopan, México, 2010. [Google Scholar]
  13. Herold, M.; Román-Cuesta, R.M.; Mollicone, D.; Hirata, Y.; van Laake, P.; Asner, G.P.; Souza, C.; Skutsch, M.; Avitabile, V.; Macdicken, K. Options for monitoring and estimating historical carbon emissions from forest degradation in the context of REDD+. Carbon Balance Manag. 2011, 6, 13. [Google Scholar] [CrossRef]
  14. United Nations Framework Convention On Climate Change, Views on Methodological Guidance for Activities Relating to Reducing Emissions from Deforestation and Forest Degradation and the Role of Conservation, Sustainable Management of Forests and Enhancement of Forest Carbon Stocks in Developing Countries; FCCC/SBSTA/2011/MISC.7.; UNFCCC Subsidiary Body for Scientific and Technological Advice: Durban, KZN, South Africa, 2011.
  15. United Nations Framework Convention On Climate Change, Methodological Guidance for Activities Relating to Reducing Emissions from Deforestation and Forest Degradation and the Role of Conservation, Sustainable Management of Forests and Enhancement of Forest Carbon Stocks in Developing Countries; FCCC/SBSTA/2010/MISC.1.; UNFCCC Subsidiary Body for Scientific and Technological Advice: Durban, KZN, South Africa, 2010.
  16. United Nations Framework Convention On Climate Change, Report on the Expert Meeting on Forest Reference Emission Levels and Forest Reference Levels for Implementation of REDD-Plus Activities; FCCC/SBSTA/2011/INF.18.; UNFCCC Subsidiary Body for Scientific and Technological Advice: Durban, KZN, South Africa, 2011.
  17. Skutsch, M.; Torres, A.B.; Mwampamba, T.H.; Ghilardi, A.; Herold, M. Dealing with locally-driven degradation: A quick start option under REDD+. Carbon Balance Manag. 2011, 6. [Google Scholar] [CrossRef]
  18. CONANP, Natural Protected Area Management Plan for La Primavera; Comisión Nacional de Áreas Naturales Protegidas, SEMARNAT: México D.F., México, 2000.
  19. UNESCO, 2011. Man and the Biosphere Programme. United Nations Educational, Scientific and Cultural Organization. Available online: http://www.unesco.org/mabdb/br/brdir/directory/contact.asp?code=MEX (accessed on 29 September 2011).
  20. Martinez, A. Revelan satélites daño en bosque. Grafico Animado. Mural 13 de Mayo; Newspaper Article: Guadalajara, México, 2012. [Google Scholar]
  21. NASA 2012. Fire Chars Forest Near Guadalajara. News. Available online: http://earthobservatory.nasa.gov/IOTD/view.php?id=78058&src=eoa-iotd (accessed on 28 May 2012).
  22. IPCC, Intergovernmental Panel on Climate Change, Revised 1996 IPCC Guide- Lines for National Greenhouse Gas Inventories. Intergovernmental Panel on Climate Change; United Nations Environment Programme, Organization for Economic Co-Operation and Development, International Energy Agency: Paris, France, 1997.
  23. Alcocer, M. Programa Estatal de Accion Ante el Cambio Climatico del Estado de Jalisco. Inventario de Emisiones y Remociones de GEI en el sector de Agricultural, Bosques y Otros Usos de Suelo. Programa Estatal de Acción ante el Cambio Climático del Estado de Jalisco; Universidad Autónoma de Guadalajara: City, México, 2011–2013. [Google Scholar]
  24. INEGI, National Institute for Statistics and Geography, Conjunto nacional de uso de suelo y vegetación a escala 1:250000, Serie III; DGG-INEGI: México, 2005.
  25. INEGI, National Institute for Statistics and Geography, Conjunto nacional de uso de suelo y vegetación a escala 1:250,000 Serie IV; Instituto Nacional de Estadistica y Geografia: Aguascalientes, México, 2010.
  26. De Jong, B.; Anaya, C.; Masera, O.; Olguín, M.; Paz, F.; Etchevers, J.; Martínez, R.D.; Guerrero, G.; Balbontín, C. Greenhouse gas emissions between 1993 and 2002 from land-use change and forestry in México. For. Ecol. Manag. 2010, 260, 1689–1701. [Google Scholar] [CrossRef]
  27. Estadísticas de Incendios Forestales, CONAFOR, National Forestry Commission. Available online: http://www.conafor.gob.mx/portal/index.php/transparencia-y-rendicion-de-cuentas/transparencia-focalizada/programa-incendios-forestales (accessed on 28 May 2012).
  28. SEMARNAT Secretary Of Environment And Natural Resources, Volumen de la produccion forestal maderable por region y municipio segun grupo de especies 2008–2009. Secretaría de Medio Ambiente y Recursos Naturales, Delegación en el Estado. Subdelegación de Gestión para la Protección Ambiental y Recursos Naturales. Available online: http://www.inegi.org.mx/est/contenidos/espanol/sistemas/aee11/estatal/jal/default.htm (accessed on 28 May 2012).
  29. Alvaro Garcia Chavez, Intencional el incendio en La Primavera: Funcionario—Declaration of Alvaro Garcia Chavez Secretary of Rural Development of the State of Jalisco. El Universal, 24 April 2012.
  30. Gill, S.J.; Biging, G.S.; Murphy, E.C. Modeling conifer tree crown radius and estimating canopy cover. For. Ecol. Manag. 2000, 126, 405–416. [Google Scholar] [CrossRef]
  31. Návar, J. Allometric equations for tree species and carbon stocks for forests of northwestern México. For. Ecol. Manag. 2009, 257, 427–434. [Google Scholar] [CrossRef]
  32. Návar-Cháidez, J.J. The temperate forests of the state of Nuevo León: Sustainable management for goods and environmental services. Madera y Bosques 2010, 16, 51–69. [Google Scholar]
  33. Merlín-Bermudes, E. Estudios sobre el conocimiento de algunas especies de encino en Durango, México. Ph.D. Thesis, Universidad Autónoma de Nuevo León, Linares, México, June 2005. [Google Scholar]
  34. Palacios-Sanchez, L.A.; Martínez-Menes, M.; Sandoval, B.F.; Solorio, C.O.; Exebio-García, A.; Oropeza-Mota, J.L.; Palacios-Sánchez, L.A. Clasificador genérico de objetos en imágenes ETM+. Agrociencia 2006, 40, 613–626. [Google Scholar]
  35. Paz-Pellat, F.; Marín-Sosa, M.I.; Reyes-Reyes, M.; Ibarra-Hernández, F.; Pascual-Ramírez, F. Documento de referencia para la estimacion de la cobertura aerea anual de la vegetacion y su tendencia de cambio en el estado de Chiapas; Colegio de Postgraduados: México, 2010. [Google Scholar]
  36. Victoria-Hernandez, A.; Niño-Alcocer, M.; Rodríguez-Ávalos, J.A.; Argumedo-Espinoza, J.A. Generacion de información de uso de suelo y vegetación proyectos y convenios escala 1:50000; Instituto Nacional de Estadistica y Geografia: México, 2011. Available online: http://www.inegi.org.mx/eventos/2011/conf_ibero/doc/ET6_46_HERN%C3%81NDEZ.pdf (accessed on 20 September 2013).
  37. Phillips, O.L.; Malhi, Y.; Higuchi, N.; Laurance, W.F.; Nunez, P.V.; Vasquez, R.M.; Laurance, S.G.; Ferreira, L.V.; Stern, M.; Brown, S.; et al. Changes in the carbon balance of tropical forests: Evidence from long-term plots. Science 1998, 282, 439–442. [Google Scholar] [CrossRef]
  38. Santiago-Pérez, A.L.; Villavicencio-García, R. Multiple Analyses of Environmental and Structural Variables to Characterization of Quercus and Pinus in the La Primavera, Jalisco, México. In Presented at The Annual Meeting of the Association for Tropical Biology and Conservation, Morelia, México, 15–19 July 2007.
  39. Cairns, M.A.; Brown, S.; Helmer, E.H.; Baumgardner, G.A. Root biomass allocation in the world’s upland forests. Oecologia 1997, 111, 1–11. [Google Scholar] [CrossRef]
  40. Balderas Torres, A.; Lovett, J.C. Using basal area to estimate above-ground carbon stocks in forests: La Primavera Biosphere’s Reserve, Mexico. Forestry 2012, 86, 267–281. [Google Scholar] [CrossRef]
  41. Schreuder, H.T.; Ernst, R.; Ramirez-Maldonado, H. Statistical Techniques for Sampling and Monitoring Natural Resource; Gen. Tech. Rep. RMRS-GTR-126; U.S. Department of Agriculture, Forest Service, Rocky Mountain Research Station: Fort Collins, CO, USA, 2004. [Google Scholar]
  42. IPCC, Intergovernmental Panel on Climate Change, Good Practice Guidance and Uncertainty Management in National Greenhouse Gas Inventories, Intergovernmental Panel on Climate Change 2000. Available online: http://www.ipcc-nggip.iges.or.jp/public/gp/english/ (accessed on 28 May 2012).
  43. Shaw, J.D. Models for Estimation and Simulation of Crown and Canopy Cover. Proceedings of the Fifth Annual Forest Inventory and Analysis Symposium; Department of Agriculture Forest Service: Washington, DC, USA, 2003; p. 222. Available online: http://www.treesearch.fs.fed.us/pubs/142937 (accessed on 7 November 2013).
  44. Brown, S. Estimating Biomass and Biomass Change of Tropical Forests: A Primer; Food and Agriculture Organization: Rome, Italy, 1997. [Google Scholar]
  45. Chave, J.; Condit, R.; Aguilar, S.; Hernandez, A.; Lao, S.; Perez, R. Error propagation and scaling for tropical forest biomass estimates. Philos. Trans. R. Soc.: Biol. Sci. 2004, 359, 409–420. [Google Scholar] [CrossRef]
  46. Van Breugel, M.; Ransijn, J.; Craven, D.; Bongers, F.; Hall, J.S. Estimating carbon stock in secondary forests: Decisions and uncertainties associated with allometric biomass models. For. Ecol. Manag. 2011, 262, 1648–1657. [Google Scholar] [CrossRef]
  47. Zavala-Chávez, F. Introducción a la ecología de la regeneración natural de encino; Universidad Autónoma Chapingo: México, 2001. [Google Scholar]
  48. Wunder, S. Can Payments for Environmental Services Reduce Deforestation and Forest Degradation? In Realising REDD+: National Strategy and Policy Options; Angelsen, A., Brockhaus, M., Kanninen, M., Sills, E., Sunderlin, W.D., Wertz-Kanounnikoff, S., Eds.; Center for International Forestry Research: Bogor, Indonesia, 2009; pp. 213–224. [Google Scholar]

