Article

Forest Typification to Characterize the Structure and Composition of Old-growth Evergreen Forests on Chiloe Island, North Patagonia (Chile)

by
Jan R. Bannister
1,* and
Pablo J. Donoso
2
1
Chair of Silviculture, Faculty of Environment and Natural Resources, Albert-Ludwigs University, Tennenbacherstrasse 4, Freiburg, D-79106, Germany
2
Faculty of Forest Sciences and Natural Resources, Universidad Austral de Chile, Casilla 567, Valdivia, 5090000, Chile
*
Author to whom correspondence should be addressed.
Forests 2013, 4(4), 1087-1105; https://doi.org/10.3390/f4041087
Submission received: 23 July 2013 / Revised: 29 October 2013 / Accepted: 19 November 2013 / Published: 28 November 2013

Abstract

:
The Evergreen forest type develops along the Valdivian and North-Patagonian phytogeographical regions of the south-central part of Chile (38° S–46° S). These evergreen forests have been scarcely studied south of 43° S, where there is still a large area made up of old-growth forests. Silvicultural proposals for the Evergreen forest type have been based on northern Evergreen forests, so that the characterization of the structure and composition of southern Evergreen forests, e.g., their typification, would aid in the development of appropriate silvicultural proposals for these forests. Based on the tree composition of 46 sampled plots in old-growth forests in an area of >1000 ha in southern Chiloé Island (43° S), we used multivariate analyses to define forest groups and to compare these forests with other evergreen forests throughout the Archipelago of North-Patagonia. We determined that evergreen forests of southern Chiloé correspond to the North-Patagonian temperate rainforests that are characterized by few tree species of different shade tolerance growing on fragile soils. We discuss the convenience of developing continuous cover forest management for these forests, rather than selective cuts or even-aged management that is proposed in the current legislation. This study is a contribution to forest classification for both ecologically- and forestry-oriented purposes.

1. Introduction

Ecological land classification is a primary need for land use allocations. Ecosystem classifications segregate the landscape based on the interactions of climate, physiography, soils, and vegetation, under the rationale that the landscape is “conceived as ecosystems, large and small, nested within one another into a hierarchy of spatial sizes” [1]. The structure of an ecosystem is determined by the relationships between physiography, soils, and vegetation [2], and regardless of scale, an ecosystem has the following main characteristics: (a) similar physiography, soils and vegetation; (b) similar growth-and-yield; and (c) similar silvicultural potential [3]. In its lower hierarchy levels, ecological land classification aims to have a precise description of forest types and subtypes in order to facilitate forest management and silvicultural planning [4], following the logic that the smallest operational ecosystem unit is where sustainable forestry starts [5].
In Chile, Forest Law is based on the 12 forest types described by Donoso [6]. These forest types were defined on the basis of geographical distribution, environment, relative importance of species composition, and timber volumes and average productivity [6]. Some forest types also include a subtypification, which considers different successional or conservation states of each subtype. The Evergreen forest type, dominated by broadleaved evergreen species, is the largest forest type with an area of over 4 million ha [7]. Currently, Chiloé Island (41°48’ S–43°27’ S) has an approximate area of 550,000 ha covered by the Evergreen forest type in different stages of development and conservation [7]. In the last three decades, a series of studies on the ecology, dynamics and structure of forests in northern and central Chiloé have been published (e.g., [8,9,10,11,12,13,14]). These studies refer to the Evergreen forest type, when oriented to forestry, or to either Valdivian of North-Patagonian temperate rainforests, a phytogeographical division developed by Veblen et al. [15] that is usually followed in forest ecology studies. On Chiloé Island, the two physiognomic formations of the Evergreen forest type overlap, Valdivian forests in well-drained lands, and North-Patagonian forests, in lands with restricted drainage conditions [10,15]. Valdivian forests characteristically include Eucryphia cordifolia Cav. and Aextoxicon punctatum R. et Pav., and generally lacks Nothofagus nitida (Phil.) Krasser., which is a more characteristic species in North-Patagonian forests along with other dominant species such as the podocarps Saxegothaea conspicua Lindl. and Podocarpus nubigena Lindl. [15]. Drimys winteri J.R. et G. Forster. is usually a canopy species and various myrtles are understory species in both formations, although their density is higher in wetter conditions and restricted drainage [14]. Weinmannia Trichosperma Cav. can be in both formations as an emergent species in old-growth forests, but in general, it is more common to the south.
In the evergreen forests of north-central Chiloé Island, gap dynamics plays an important role in regeneration of tree species, by being the dominant disturbance regime in old-growth forests [11,12,16,17]. The dominance of small-scale disturbances, plus the absence of human disturbance, allows the coexistence of shade-tolerant and shade-intolerant species, and the existence of large, but decreasing, areas of forests in advanced successional stages [11,12]. South of this north-central region of Chiloé Island, the only evergreen forest for which its structure and dynamics has been described is found in the work by Innes [18] in the Taitao Peninsula (46° S). In these forests, the shade-intolerant species W. trichosperma and N. nitida showed a high relative importance, suggesting that the dynamics towards the south of this forest type may be related to a higher proportion of larger-scale disturbances that increases the competitiveness of these species [18]. Thus, there are no studies on forest ecology in the evergreen forests of the southern part of the Chiloé Island, which cover approximately 315,000 ha (57% of this forest type in the island), especially as old-growth forests [7]. These forests, in the Pirulil Mountain Range, have been able to persist over time with a good conservation status, perhaps due to poor access and because the island’s population is located mainly on the east coast and further north [19] , which contrasts with the severe forest fragmentation in the north of the island [20]. We consider that it is a timely opportunity to study the structure and composition of these old-growth forests as a basis for developing management proposals, and to better understand reference ecosystems in case of restoration initiatives.
In the Evergreen forest type, Donoso [6], two subtypes were defined for old-growth forests, one dominated by emergent shade-intolerant species (including Nothofagus dombeyi (Mirb.) Oerst., N. nitida, W. trichosperma or E. cordifolia) and one dominated by shade-tolerant species, which reflect two different successional conditions in these old-growth forests. These subtypes occur at the scale of stands, since they are the result of either large-scale disturbances (e.g., massive tree falls) or small-scale disturbances (e.g., gap formation). In north-central Chiloé, both forest subtypes occur in old-growth forests [13]. Towards the south, in the Aysén Archipelago (46° S), it was suggested that the subtype dominated by emergent shade-intolerant species tends to dominate [18]. For each of these two subtypes the application of different silvicultural methods are allowed [21]. While the regulations of the Chilean forest service (CONAF) include the possibility of management plans through a poor proposal of uneven-aged silviculture, basically selective harvesting [21], they also promote the application of small block and strip clearcuts as well as shelterwood cuts that lead to the generation of even-aged forests. These regulations were developed before any experimental silvicultural methods had been reported in Chile, or after some even-aged silvicultural methods had yielded abundant regeneration in Valdivian forests located in the northern part of the distribution of the forest type [22]. Therefore, it can be highly questionable whether the current regulations for management of the evergreen forests are applicable to the great variety of tree composition and site quality (fragility) in forests of this large forest type, like the case of North-Patagonian forests.
Despite general knowledge about changes in species composition and structure in evergreen forests, there is little knowledge about forest attributes in old-growth insular evergreen forests located between 43° and 46°30’ S. In addition, the importance of the link between forest typification and silvicultural planning is scarcely acknowledged in the literature. In this context, this study, conducted in an area >1000 ha in southern Chiloé Island seeks to (a) define if the forests of the study area correspond to the Valdivian or North-Patagonian temperate rainforest regions, (b) define groups in old-growth forests of the Evergreen forest type in southern Chiloé Island on the base of their structure and composition, and (c) discuss the convenience of using continuous cover forestry to sustain the management of Evergreen forests growing on fragile sites like those in this study and elsewhere in southern Chile. The definition of forest groups and the knowledge of its structure and tree composition is of great importance for future planning of appropriate silvicultural systems for the management and conservation of forests in southern Chiloé, especially in the scenario that these forests are increasingly more accessible to the island’s population that has already severely degraded and fragmented the forests in the north of the island. This study therefore aims to highlight the importance of regional descriptions of forest types and their subtypes to develop sustainable management proposals.

2. Experimental Section

2.1. Study Area

The study area corresponds to a patch of continuous old-growth evergreen forests without apparent human intervention in an area of approximately 1060 ha (Figure 1) at altitudes between 100 and 200 m a.s.l. (Meters above sea level) in southern Chiloé Island, approximately 10 km from the city of Quellón (between 43°03’–43°06’ S and 73°44’ and 73°47’ W). The forest is dominated by the species Amomyrtus luma (Mol) Lengr. et Kausel., D. winteri, L. philippiana Looser. and S. conspicua, with emergent trees of the pioneer species N. nitida and W. trichosperma (Table 1). The total heights are relatively homogeneous in the studied forest, with the higher individuals of N. nitida and W. trichosperma reaching up to 32 m, and D. winteri, L. philippiana and S. conspicuous 20 to 25 m.
Figure 1. Study area in southern Chiloé Island. Grey color illustrates areas with evergreen forest cover; white color illustrates areas with other vegetation [7].
Forests 04 01087 g001
The climate can be classified as mild with strong oceanic influence, with a relative humidity of 80% and an average temperature of 10.6 °C [23]. The average annual rainfall in the area is 2105 mm (Quellón, 12 m a.s.l.) and soils are composed of metamorphic schists [24]. The topography is gently undulated with rolling hills with maximum slopes of 15%, and does not include formations dominated by Tepualia stipularis (Hook et. Arn.) Griseb. (“tepuales”) or peatlands that are characteristic of flat areas with very poor drainage [25].
Table 1. Shade tolerance of the main tree and woody species mentioned in this study.
SpeciesFamilyAbrev.Shade tolerancePosition in vertical profile of old-growth forests
Embothrium coccineum J.R. et. G. Forster.*ProteaceaeEcIntolerant1§
Nothofagus nitida (Phil) Krasser.FagaceaeNnIntolerant2Emergent
Semi-tolerant1
Tepualia stipularis (Hook et. Arn.) Griseb.*MyrtaceaeTsIntolerant2Understory
Weinmannia trichosperma Cav.CunoniaceaeWtIntolerant1Emergent
Amomyrtus luma (Mol.) Legr. et. Kausel.MyrtaceaeAlTolerant1Lower canopy
Laureliopsis philippiana Looser.MonimiaceaeLpTolerant1Canopy
Lomatia ferruginea (Cav.) R. Br.*ProteaceaeLfTolerant1Understory
Luma apiculata (D.C.) Burret.*MyrtaceaeLaTolerant1Understory
Podocarpus nubigena Lindl.*PodocarpaceaePnTolerant1Canopy
Saxegothaea conspicua Lindl.PodocarpaceaeScTolerant1Canopy
Caldcluvia panniculata (Cav.) D. Don.*CunoniaceaeCpSemi-tolerant1Understory
Drimys winteri J.R. et. G. Forster.WinteraceaeDwSemi-tolerant1Canopy
Note: * Included in category “other species”; § Pioner short-lived species infrequent in old-growth forests; 1 Based on [26]; 2Based on [27].

2.2. Experimental Design and Statistical Analysis

In the study area 46 plots, each 1000 m2 (50 × 20 m) in size were established. In order to keep the characteristics of the site as homogeneous as possible and thus avoid possible effects of site on variations of structure and tree composition, the forest near two rivers that crossed the sampled area was not included (Figure 1). In the remaining area, plots were spaced 300 m apart. In each plot, tree species were identified, the diameter at breast height (DBH at 1.3 m) was measured for each tree DBH ≥ 5 cm and also tree regeneration was recorded on three 4 m2 subplots at equidistant space along the longitudinal center of each plot. All seedlings were identified at the species level and where assigned into three height classes (0–50 cm, 51–150 cm, >150 cm and <5 cm DBH). The similarity between tree composition of the forests in this study area and other evergreen forests from other geographical areas of southern Chile was studied by a cluster analysis, using the species present in each of these forests. The cluster analysis was based on the Jaccard index (JI) and the algorithm UPGMA (unweighted pair-group average) was used, with a “bootstrap” resampling to give statistical support to the different nodes (1000 iterations). UPGMA is a consistent agglomerative clustering algorithm in which between-group dissimilarities are calculated as the average of all possible pairs of members of each group [28]. To perform the cluster analysis we included all the tree species from this study and those reported by other authors for evergreen forests of the North-Patagonian archipelago [8,9,10,13,16,17,18] (see list of tree species in supplementary Table S1). This approach could be influenced by the different sampling effort between studies, but since we focused the analysis only on tree species, this should not be a problem.
With the information obtained in the inventory, the number of trees (density) and basal area (G) per species and hectare was determined, which allowed the calculation of the importance value (IV) for each species in each plot using the formula 1 [29].
Forests 04 01087 i001
where,
IVtree = importance value for trees.
Dsp = species density per plot.
Dtot = total plot density.
Gsp = species basal area within the plot.
Gtot = total basal area per plot.
In order to identify forest groups in the studied forest, the importance value for each tree species per plot was used to run a principal component multivariate analysis (PCA), with six components that corresponded to the importance values of the six canopy/emergent tree species in the forest: D. winteri, N. nitida, A. luma, S. conspicua, W. trichosperma and L. philippiana (Table 1). Understory species were therefore excluded from the analysis (<3.5% of the basal area). The PCA was based in a covariance matrix with 46 rows corresponding to the plots and six columns with the variables for each plot. The variables corresponded to the importance values of the canopy/emergent tree species measured at the i-th sampled plot. Three components were chosen with “eigenvalues” higher than 1.0 and accounted for 71% of the variability of the data (43%, 17% and 11%, respectively). The initial factors pattern was rotated using the VARIMAX method as a way to obtain the best interpretable factors. With the forest groups identified, and since there were different numbers of plots per groups, we performed the nonparametric Kruskal-Wallis test to observe statistical differences between groups in density, basal area and quadratic mean diameter (QMD in cm). In those cases where significant differences were found multiple post hoc comparisons were made based on the non-parametric Mann-Whitney test using the Bonferroni method, with a significance level of P < 0.05.
The forest groups were characterized using density (trees ha−1), basal area (m² ha−1), and the quadratic mean diameter (QMD) of each species in each forest group. The importance value (IVreg) for the regeneration of each species was calculated using formula 2.
IVreg = (Arel1 + Arel2 + Arel3) ÷ 3
where,
IVreg = importance value for regeneration.
Arel1 = relative abundance of the species for height class 1.
Arel2 = relative abundance of the species for height class 2.
Arel3 = relative abundance of the species for height class 3.
Comparison of importance values of regeneration for each species within each forest group was also conducted with the Kruskal-Wallis nonparametric statistical test followed by multiple post hoc comparisons.
Combining all plots within each group, the diameter structure was graphed for all tree species together and also for the species grouped according to their shade tolerance (intolerant, tolerant and semitolerant). The diameter structures were compared adjusting Weibull functions to the diameter distributions of the different forest groups and subgroups of species [30]. The base formula of the Weibull distribution uses three parameters for x ≥ 0 and accommodates to a variety of distribution shapes, so that the distribution is very useful to model diameter structures. The mathematical expression of this function is:
Forests 04 01087 i002
where,
x = diameter at 1.3 m (DBH).
a = location parameter.
b = scale parameter.
c = shape parameter.
When the parameter c is <1, the diameter distribution fits a negative exponential curve, if c is >1 and <3.6 the distribution is unimodal and positively skewed, if c = 3.6 the distribution approximates to a normal distribution and if c is >3.6 the distribution is negatively skewed [13,30]. To estimate the parameters, the maximum likelihood method [31] was applied and the 2-parameter Weibull model was used, setting the source parameter “a” to 0.

3. Results

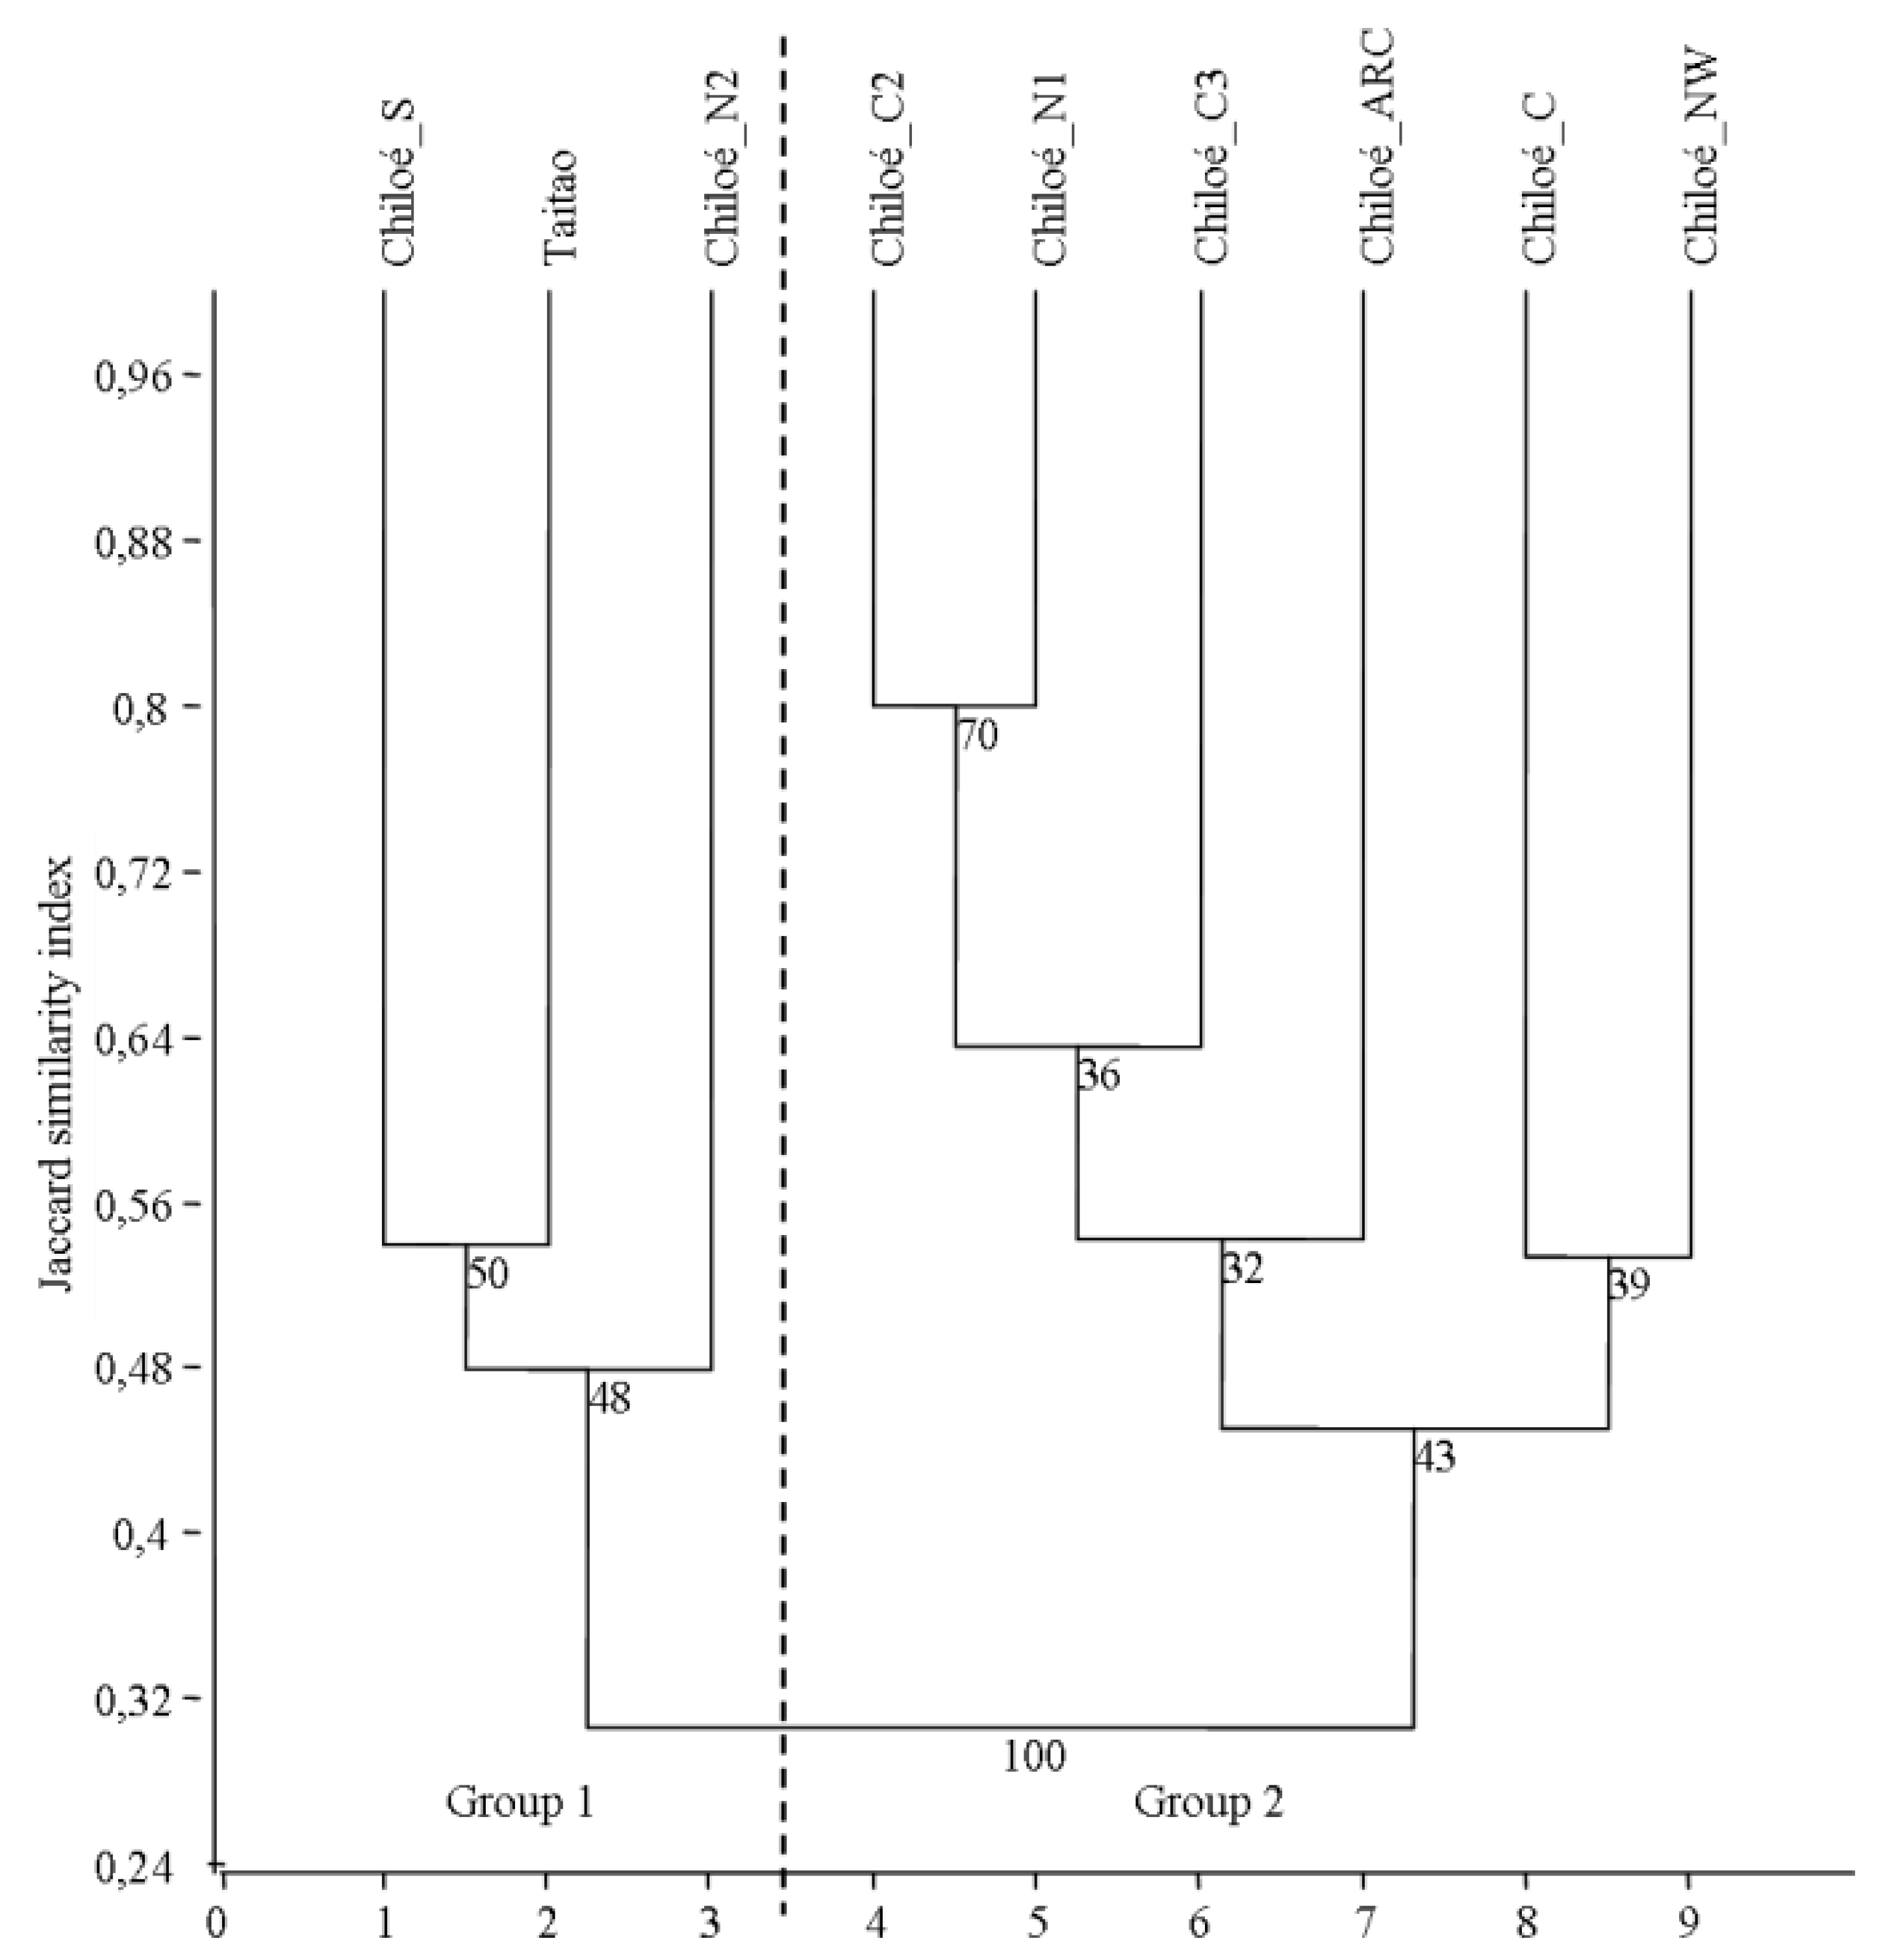
3.1. Similarity between Evergreen Forests of the Region

The cluster analysis showed two main groups, dividing the North-Patagonian forests from the Valdivian forests of north-central Chiloé Island (Figure 2). The node division of the cluster analysis in these two groups was accompanied by a 100% bootstrap support. The tree species composition from the present study showed a greater similarity to the North-Patagonian forests of the Taitao Peninsula (JI = 0.538) and the North-Patagonian forest studied by Gutierrez et al. [13] (JI = 0.529) as compared with the forests of central and northern Chiloé (JI mean = 0.293).
Figure 2. Cluster analysis based on the floristic composition of tree species in different studies in the insular region of North Patagonia. Numbers close to nodes represent the bootstrap support. The dotted line represents division into 2 groups. Group 1: Chiloé_S = this study; Taitao = Innes [18], Chiloé_N2 = North-Patagonian forest of Gutiérrez et al. [13], and Group 2: Chiloé_C = Armesto and Fuentes [17], Chiloe_C2 = Donoso et al. [9], Chiloé_C3 = Veblen [16], Chiloé_ARC = Armesto and Figueroa [10], Chiloé_N1 = Valdivian forest of Gutiérrez et al. [13], Chiloé_NW = Donoso et al. [8].
Forests 04 01087 g002

3.2. Definition of Groups in Old-Growth Forests

Component 1 of the PCA represented plots with high importance values for the species A. luma and L. philippiana and low values for the species S. conspicuous and W. trichosperma; component 2 grouped plots with high importance values for D. winteri, and component 3 grouped plots with high importance values for N. nitida (Figure 3). Consequently four evergreen forest groups were chosen for the studied area in southern Chiloé island: group (1) forests dominated by A. luma, L. philippiana and D. winteri; group (2) forests dominated by A. luma, L. philippiana and D. winteri but with emerging individuals of N. nitida; group (3) forests dominated by emergent trees of N. nitida and W. trichosperma above a canopy of D. winteri, A. luma and L. philippiana., and group 4) forests dominated by S. conspicua and the shade-intolerant species N. nitida and W. trichosperma (Table 2).
Table 2. Mean values and standard deviations (Sd) for density, basal area and quadratic mean diameter for each species and forest group.
Group 1Group 2Group 3Group 4
n = 16n = 12n = 9n = 9
Density (trees per ha)Mean (Sd)Mean (Sd)Mean (Sd)Mean (Sd)
Drimys winteri104 (±62.3)133 (±85.5)214 (±105.5)106 (±56.8)
Amomyrtus luma313 (±148.6)295 (±165.9)207 (±150.4)190 (±185.1)
Laureliopsis philippiana218 (±121.4)170 (±103.6)62 (±58.5)43 (±65.8)
Nothofagus nitida5 (±12.1)27 (±21.0)60 (±77.3)44 (±31.3)
Saxegothaea conspicua-7 (±20.2)3 (±7.1)141 (±94.7)
Weinmannia trichosperma4 (±8.9)1 (±2.9)64 (±59.8)63 (±65.4)
Other species*71 (±106.9)89 (±73.5)149 (±117.1)58 (±52.6)
Total715a (±208.4)722a (±195.4)760a (±251.3)646a (±183.0)
Basal area (m² per ha)Mean (Sd)Mean (Sd)Mean (Sd)Mean (Sd)
Drimys winteri12.9 (±8.7)10.7 (±6.6)15.9 (±8.0)9.6 (±8.7)
Amomyrtus luma10.6 (±6.3)8.1 (±3.4)6.6 (±4.3)2.9 (±3.5)
Laureliopsis philippiana25.1 (±17.3)13.5 (±8.4)6.4 (±9.2)2.6 (±5.6)
Nothofagus nitida1.1 (±4.2)12.7 (±10.8)9.1 (±12.6)12.7 (±8.5)
Saxegothaea conspicua-1.6 (±4.1)0.9 (±2.6)32.3 (±15.2)
Weinmannia trichosperma2.1 (±4.0)0.5 (±2.0)18.0 (±13.9)16.7 (±13.7)
Other species*1.7 (±2.6)2.1 (±1.3)3.5 (±3.2)1.3 (±1.3)
Total53.8a (±16.6)49.6a (±10.3)60.8ab (±13.4)78.3b (±13.1)
Quadratic mean diameter (cm)Mean (Sd)Mean (Sd)Mean (Sd)Mean (Sd)
Drimys winteri38.9 (±10.7)33.6 (±13.9)31.5 (±8.9)36.3 (±17.2)
Amomyrtus luma20.8 (±4.6)19.3 (±3.1)21.2 (±6.0)14.4 (±4.3)
Laureliopsis philippiana38.2 (±8.6)35.6 (±13.7)33.2 (±10.4)21.6 (±7.7)
Nothofagus nitida47.6 (±37.3)83.3 (±27.9)49.7 (±29.9)60.4 (±15.6)
Saxegothaea conspicua-72.7 (±34.4)51.4 (±27.4)64.3 (±29.7)
Weinmannia trichosperma83.8 (±20.9)94.0 (-)72.5 (±25.8)61.1 (±13.3)
Other species*17.2 (±4.0)20.7 (±12.8)18.8 (±6.1)17.8 (±5.6)
Total31.3a (±5.2)30.1a (±4.0)32.7ab (±4.9)39.9b (±5.1)
Note: Different letters indicate significant differences (P < 0.05) between each forest group, n = number of plots; * Understory woody species.

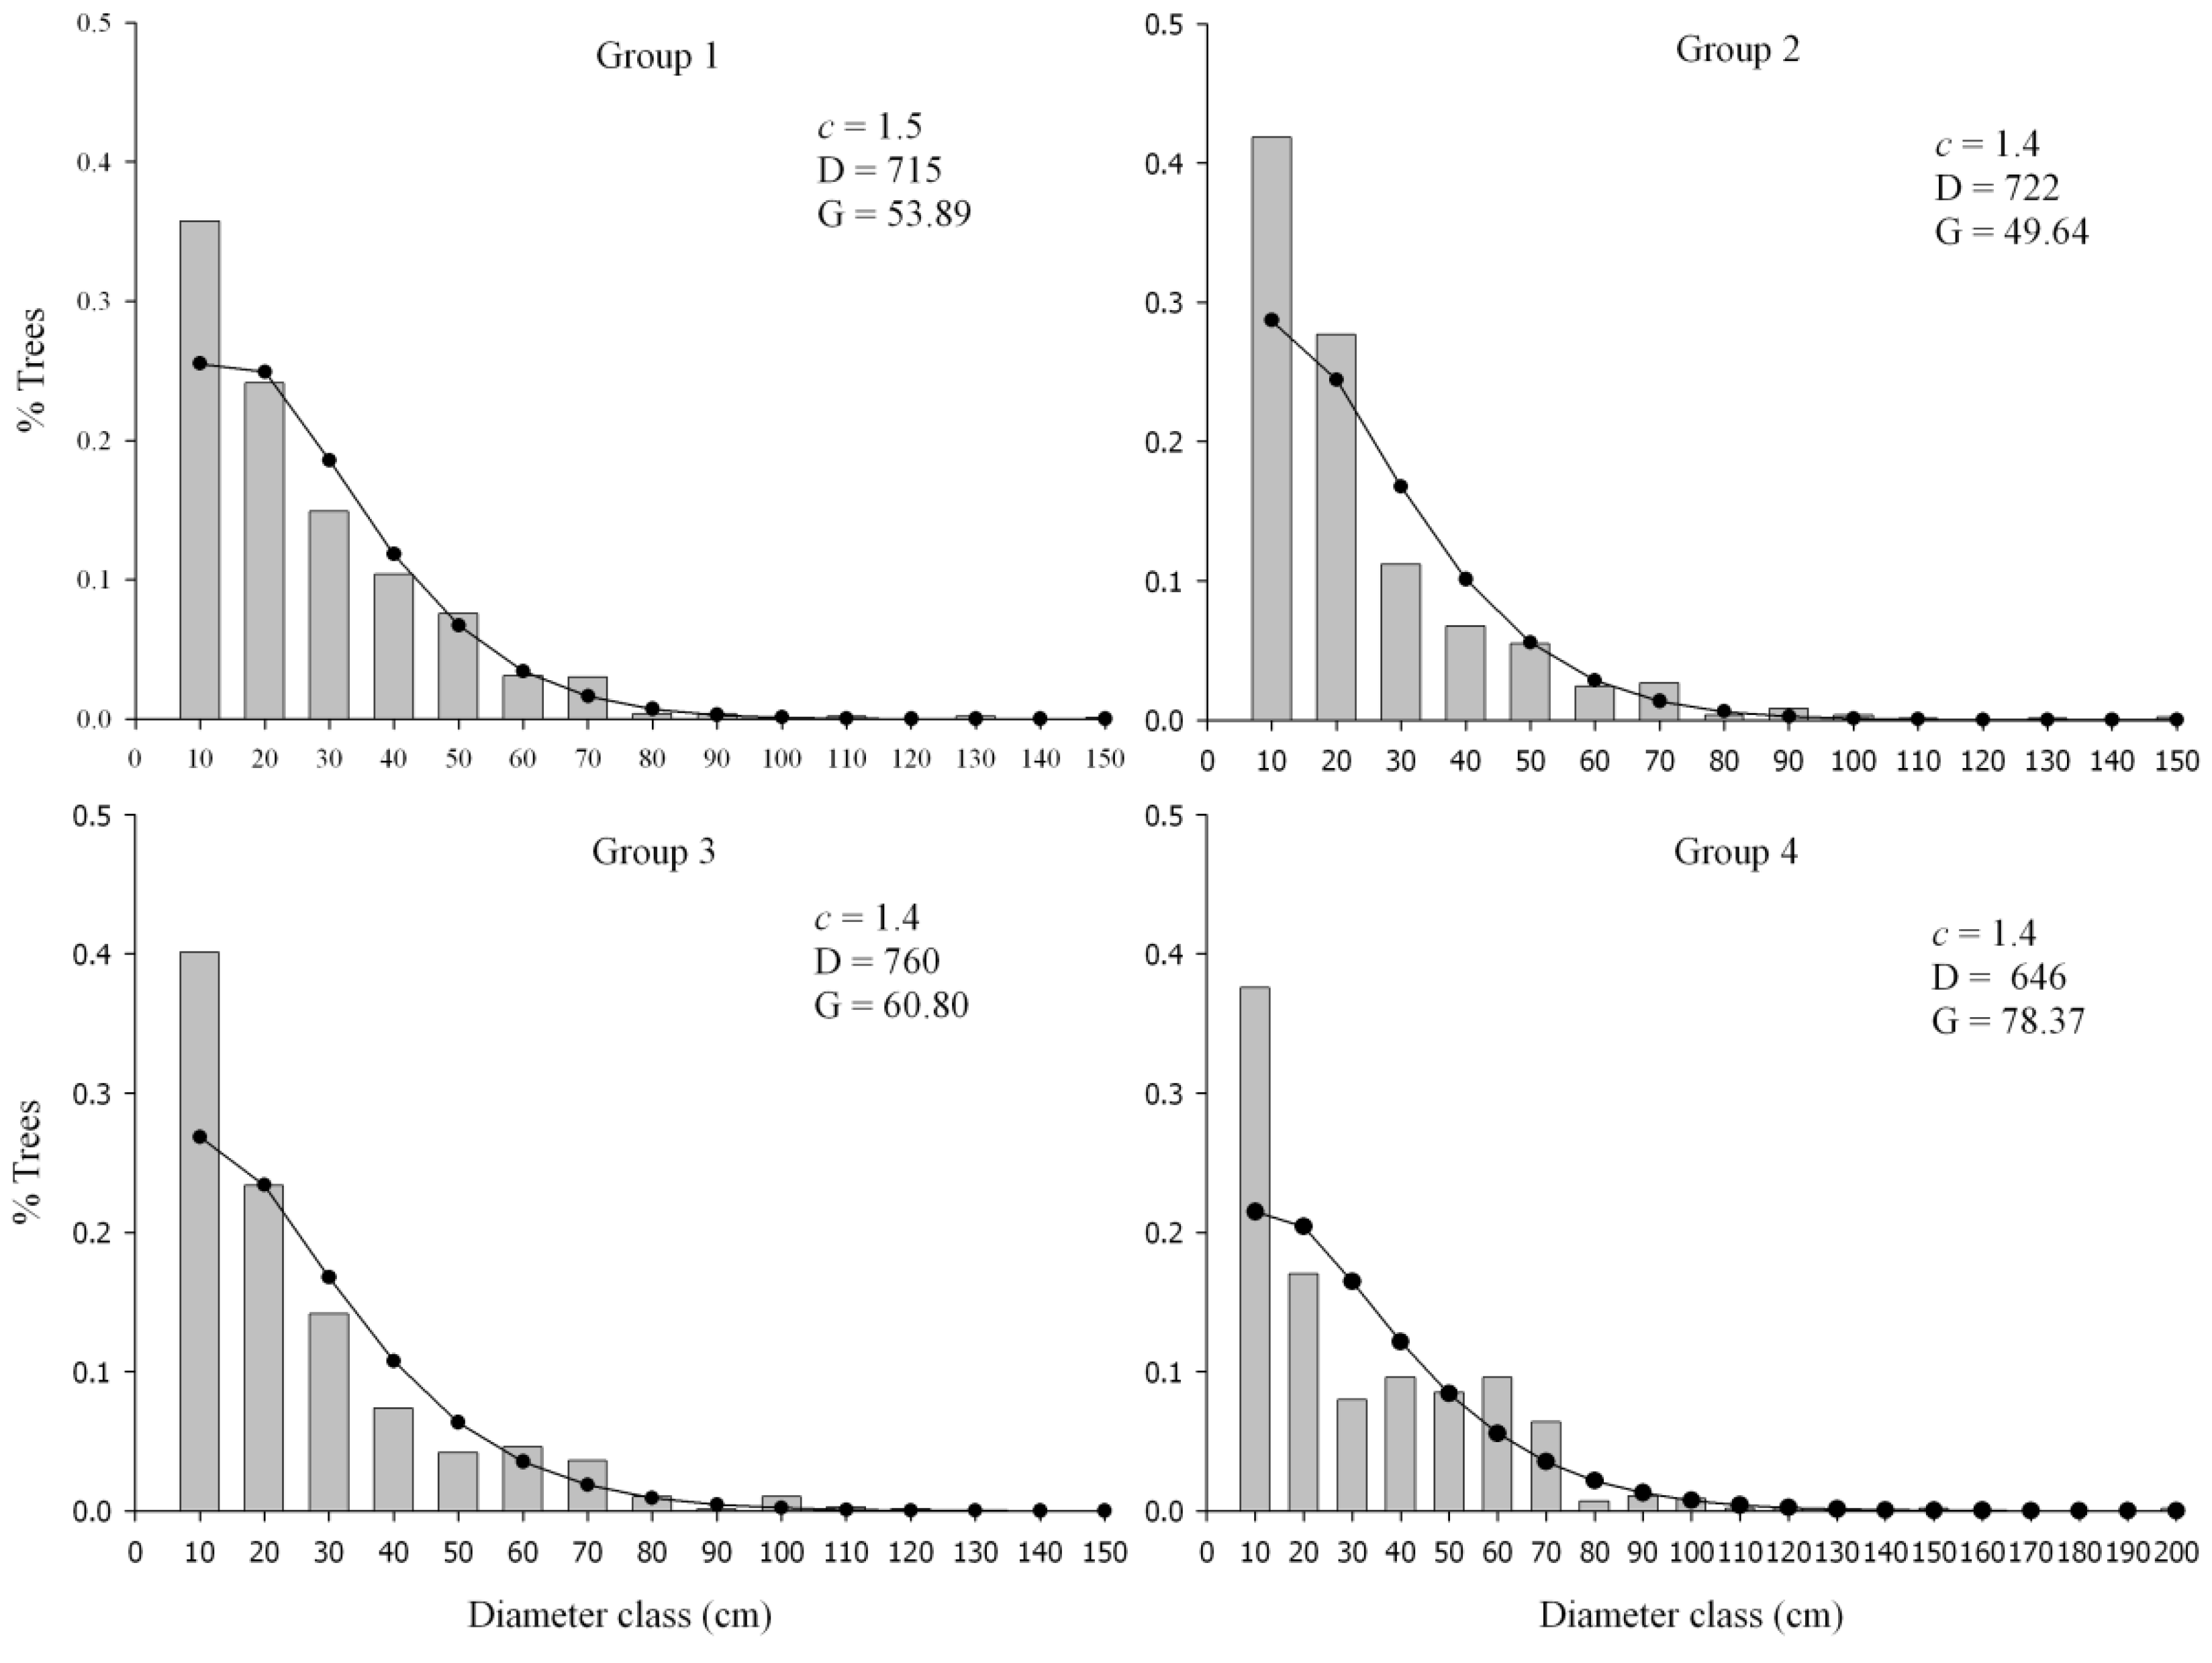
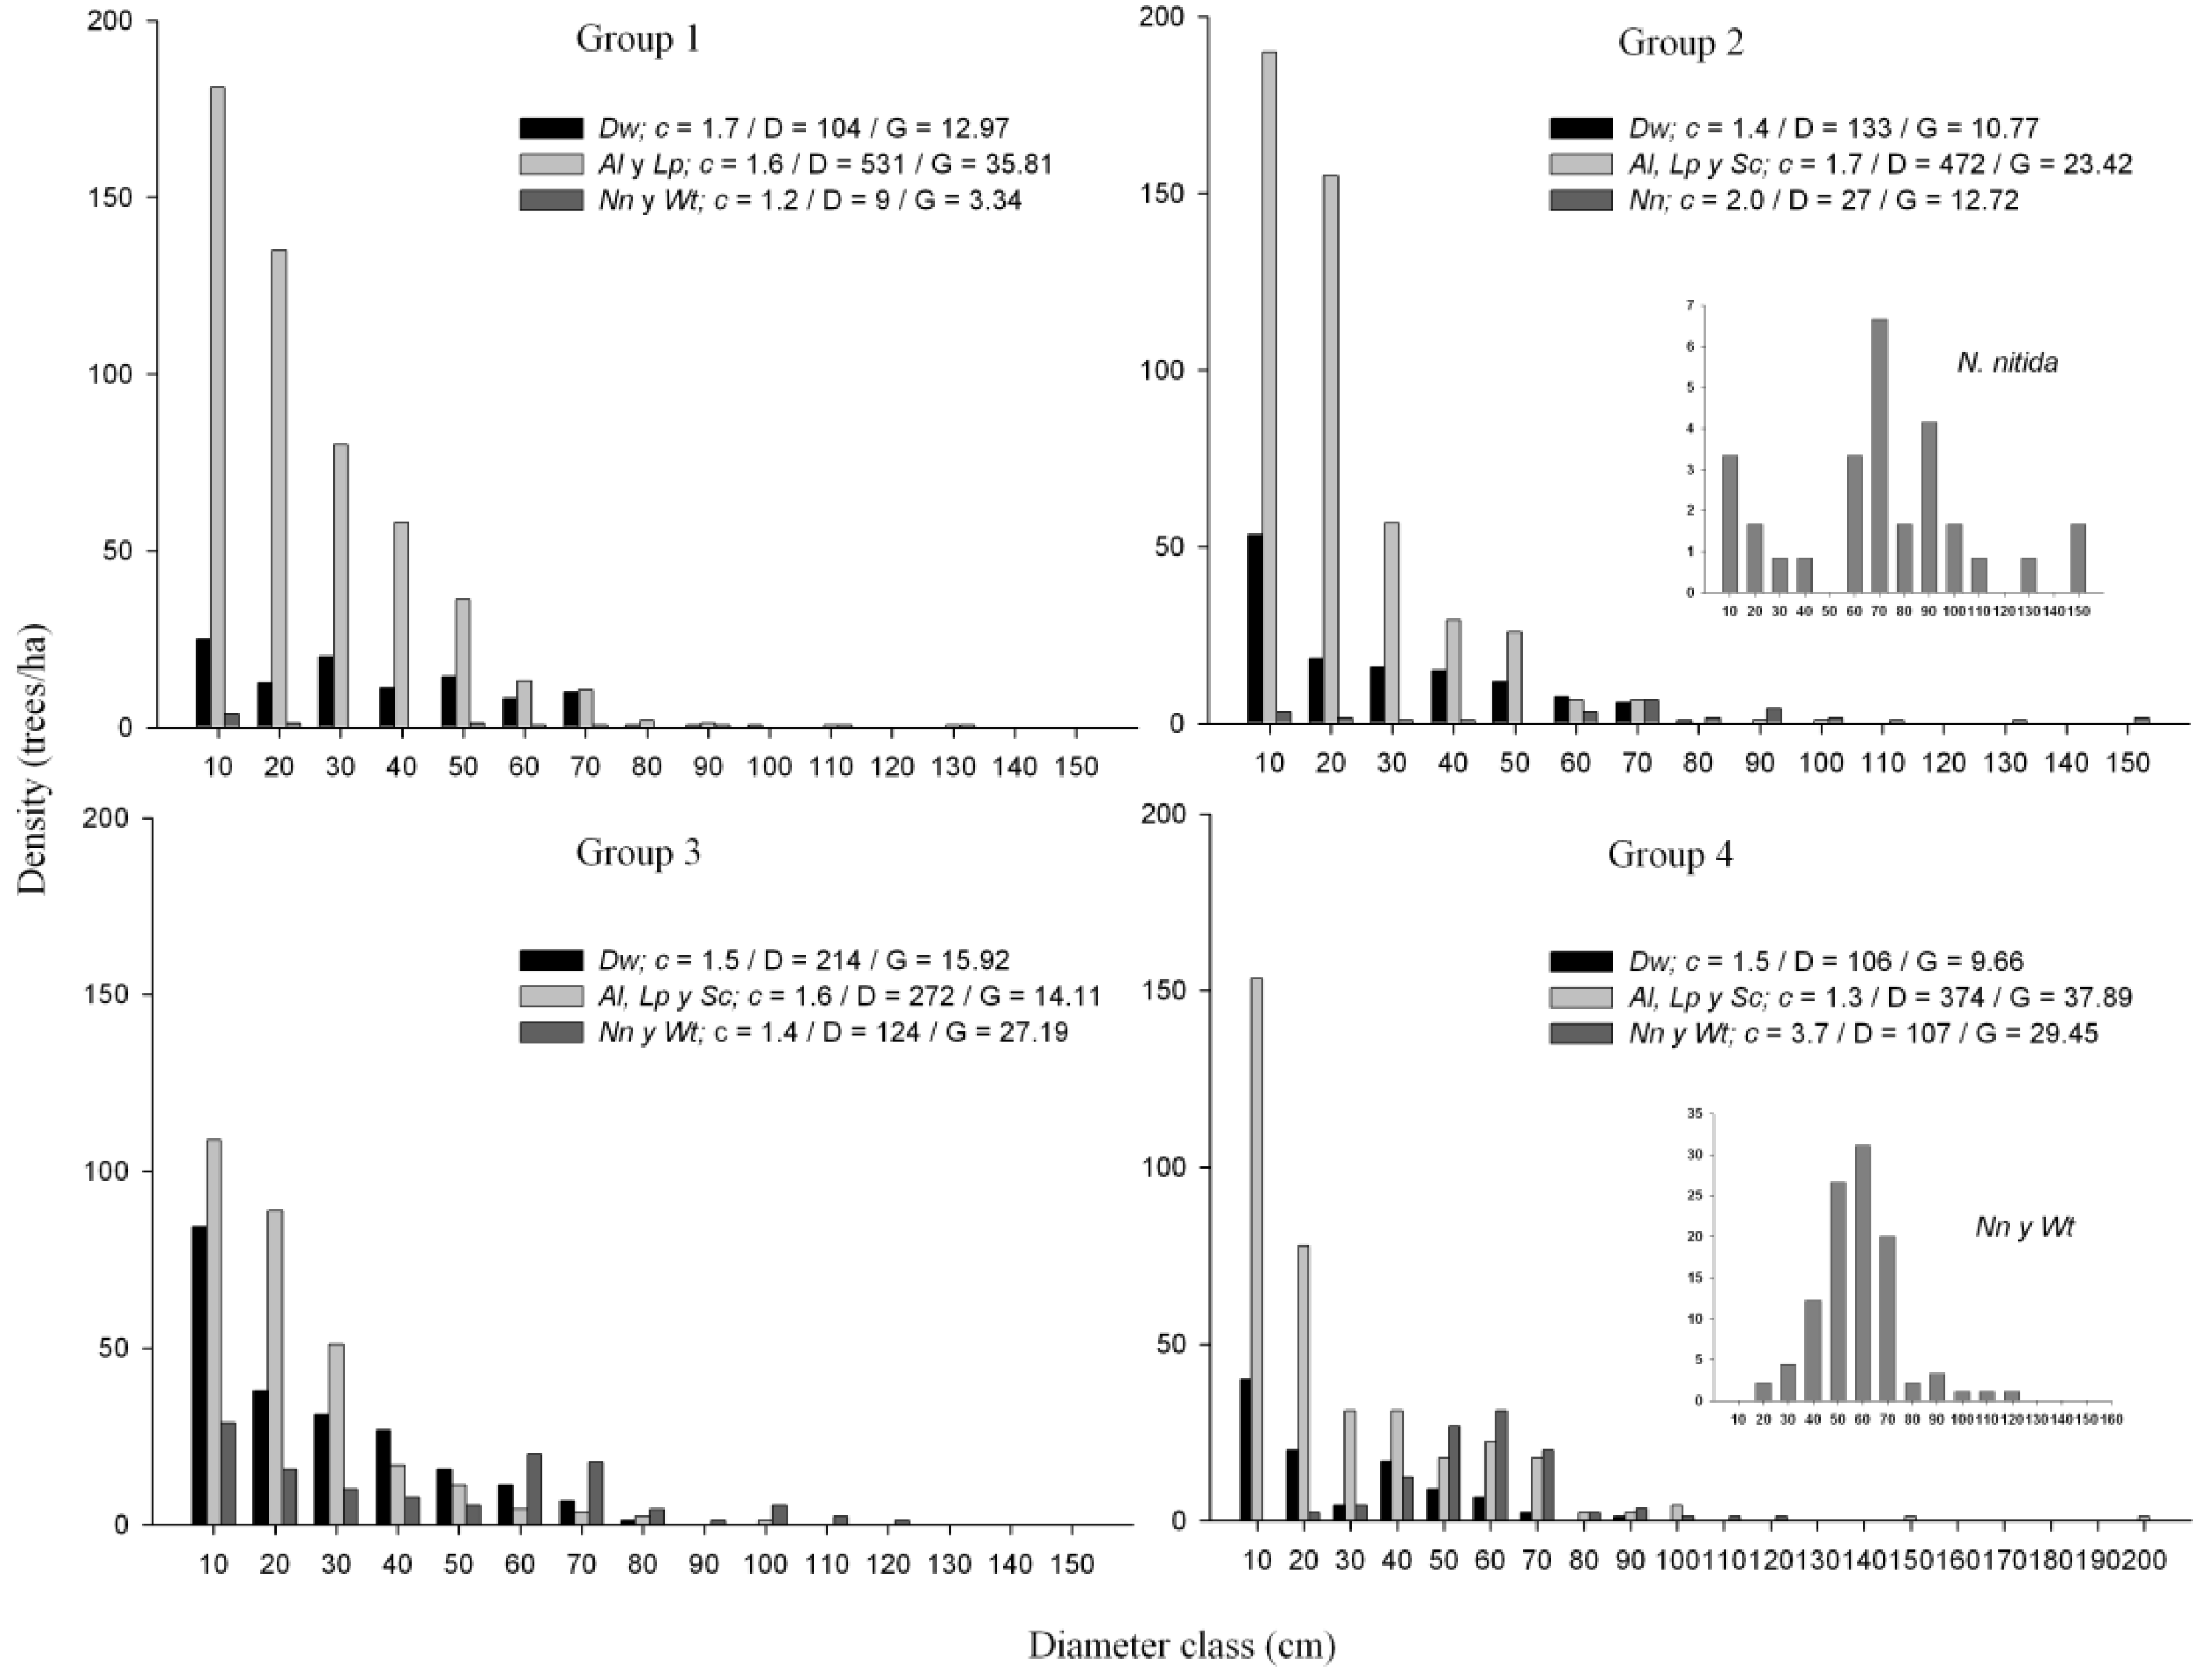
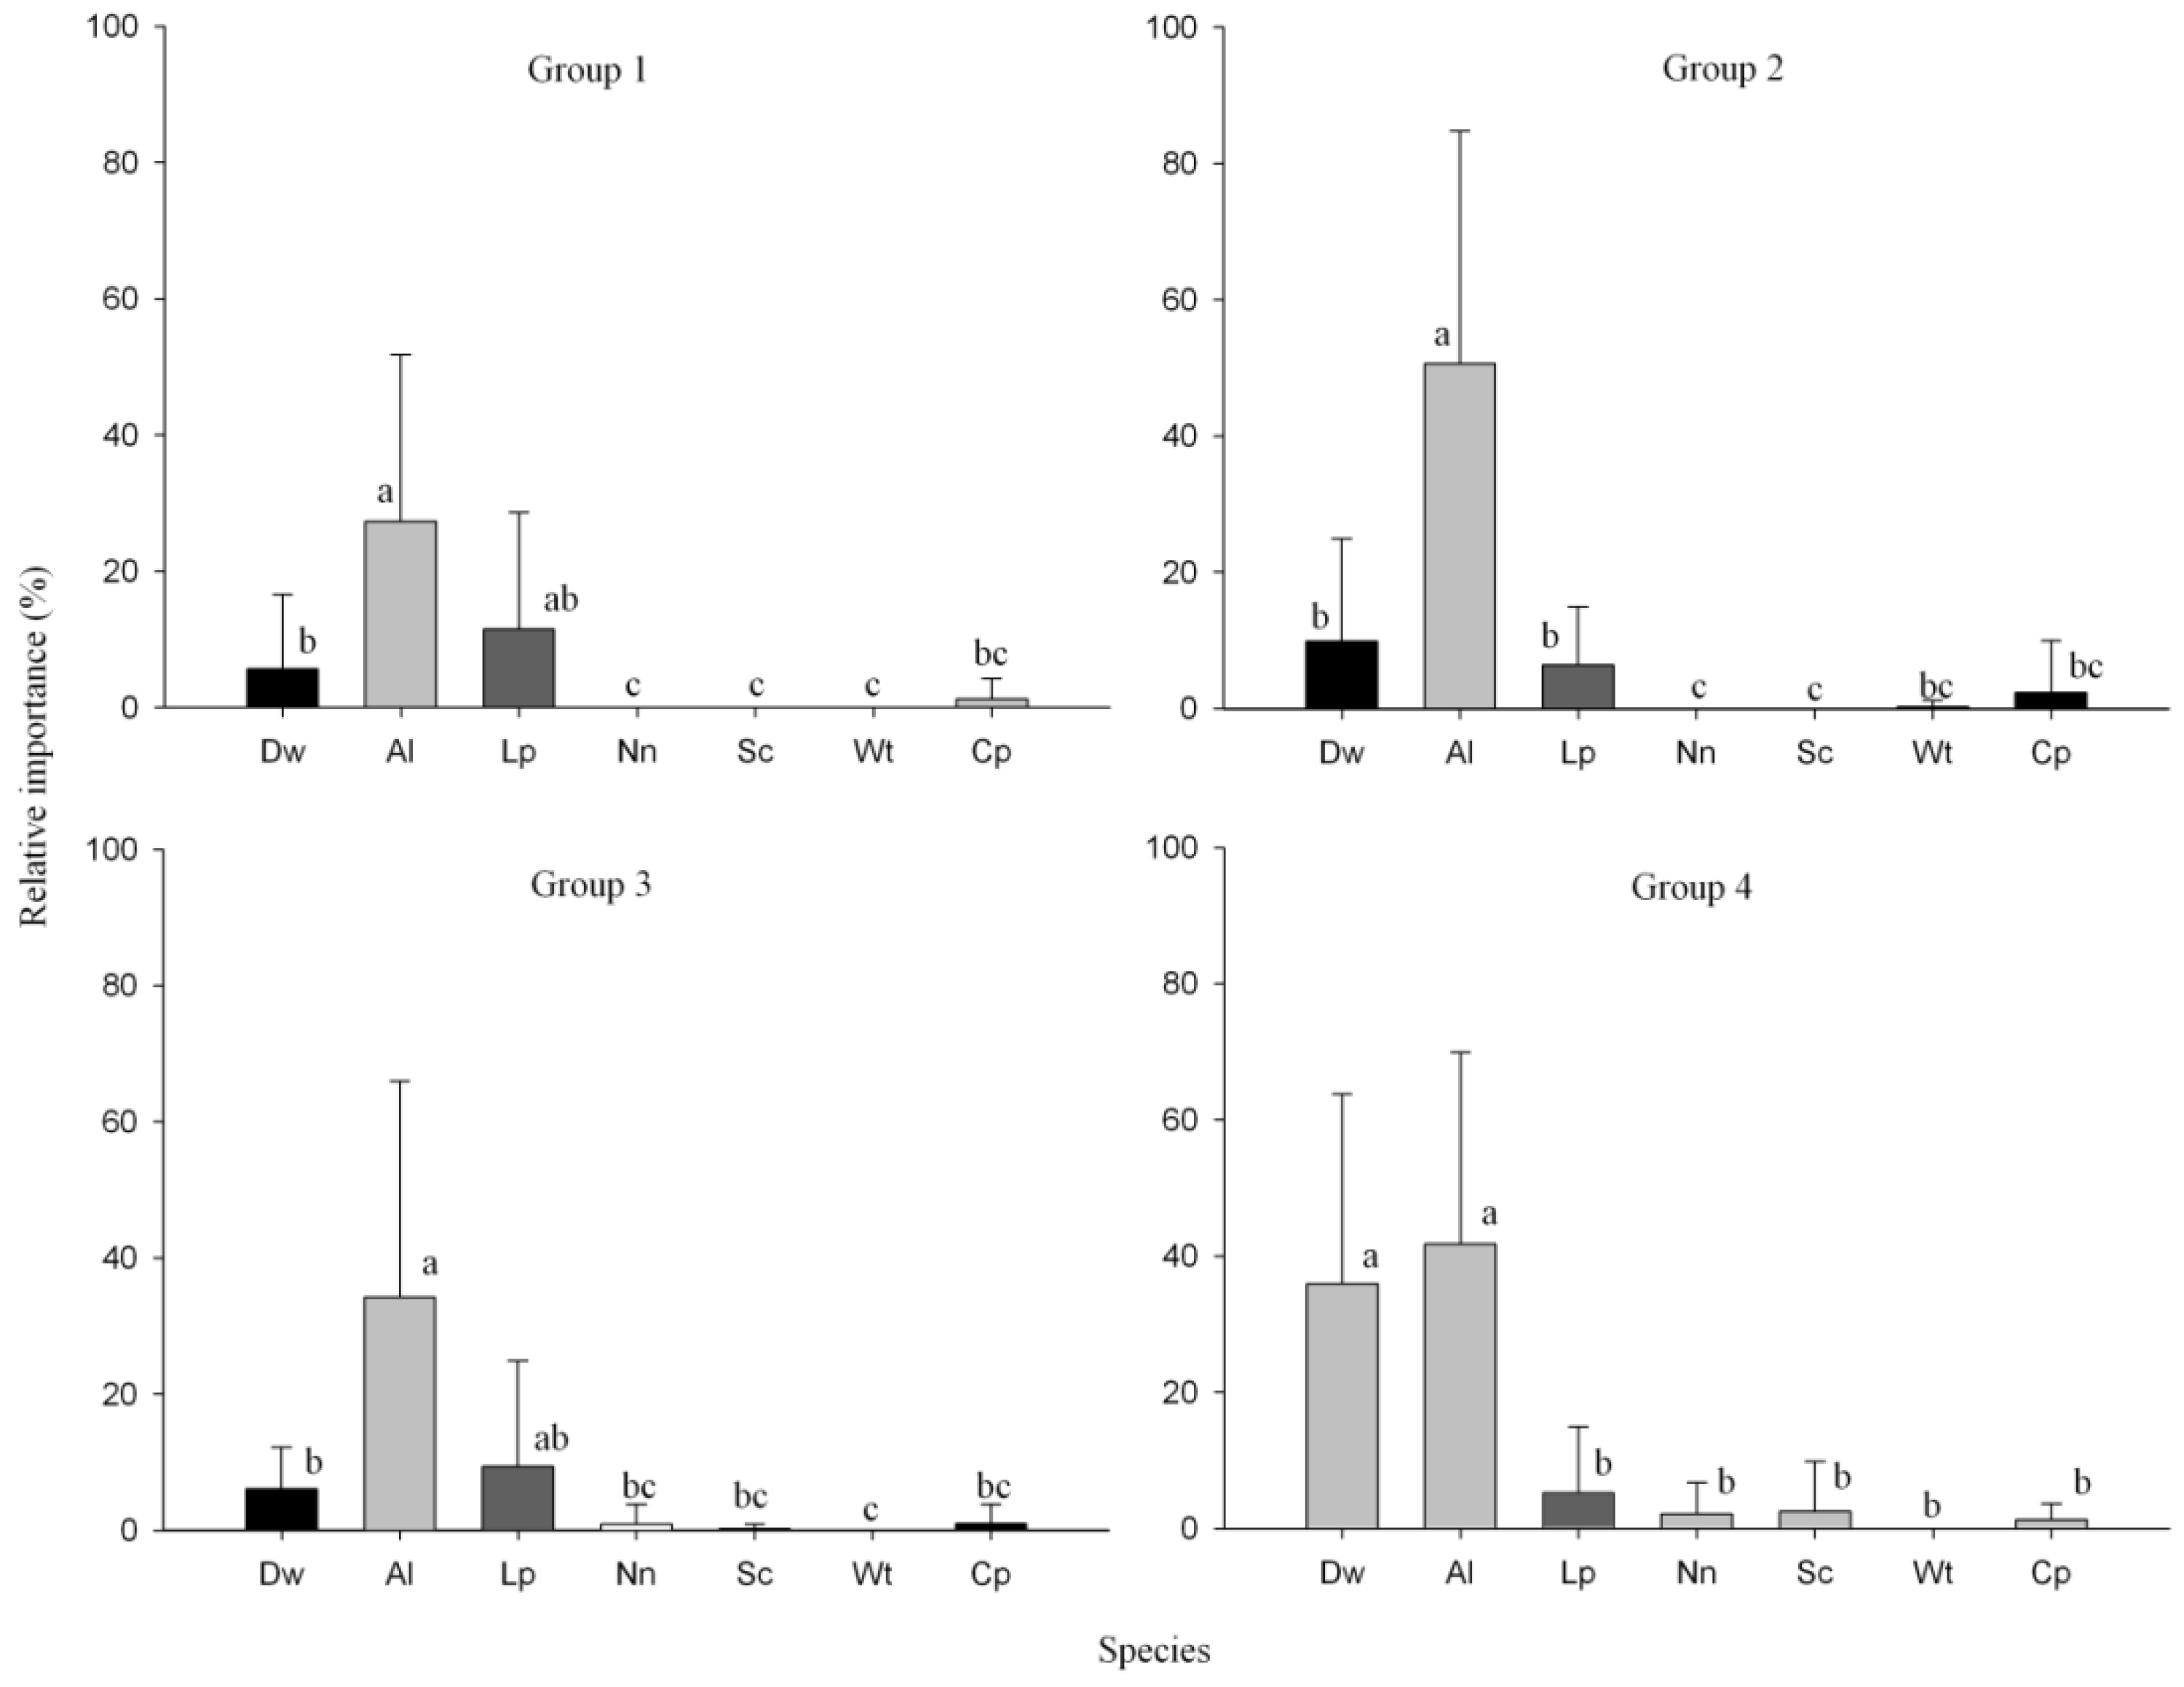
3.3. Structure and Composition of Forest Groups

The maximum DBH for groups 1, 2 and 3 fluctuated between 100 and 150 cm, whereas in the group 4 there were trees up to 200 cm in DBH. Groups 1 and 2 had less than 2% of the trees over 80 cm in DBH, whereas groups 3 and 4 showed a high proportion of trees over 80 cm (11 and 8.4%, respectively). The four defined forest groups showed no significant differences in density (P ≥ 0.05). Groups 1, 2 and 3 showed no significant differences in basal area and QMD (P ≥ 0.05), whereas the group 4 showed a significantly greater basal area than groups 1 and 2 (P < 0.001) but no significant differences with group 3 (P ≥ 0.05) (Table 2). Thus, group 3 would be in an intermediate position between two groups with low basal area (groups 1 and 2) and high basal area (group 4).
Figure 3. Diagram for (A) component 1 vs. 2 and (B) component 1 vs. 3, originated from the principal component analysis using data of importance values for tree species in the 46 sampled plots. Each symbol type represents plots of different forest groups.
Forests 04 01087 g003
The four groups showed negative exponential diameter structures with c parameter values of the Weibull distribution that ranged between 1.4 and 1.5 (Figure 4). In the analysis by shade-tolerance groups, group 1 presented for the shade-tolerant species L. philippiana and A. luma a curve with a high negative slope (c = 1.6) with individuals in all size classes (Figure 5). Drimys winteri presented individuals in all size classes but with a less steep curve (c = 1.7). The group of shade-intolerant species (N. nitida and W. trichosperma) presented a very low c value (1.2). Group 2 had a similar structure to the previous situation regarding shade-tolerant species (c = 1.6), but D. winteri presented a less flattened curve than in the previous group 1 (c = 1.4). In larger diameter classes (DAP > 60 cm), N. nitida was the dominant species presenting a positively skewed normal curve (c = 2). In group 3, D. winteri and the shade-tolerant species showed negative exponential curves and dominance in the lower diameter classes (c = 1.5 and 1.6, respectively). However, the shade-intolerant species N. nitida and W. trichosperma had individuals in all size classes but were especially dominant in the upper classes. The situation of group 4 was similar to that of group 3, but even more pronounced in terms of shade-intolerant species, which showed a normal curve (c = 3.7) with a maximum number of trees between 50 and 80 cm in DBH. In this group, S. conspicuous, which was the dominant species, had individuals up to 200 cm in DBH and had a high frequency of individuals over 40 cm in DBH, which produces a flattening of the negative exponential curve for shade-tolerant species. However, the group of shade-tolerant species presented a c value of 1.3. In the case of D. winteri this species had fewer individuals than in the previous groups and had a c value of 1.5.
In regards to regeneration, A. luma had significantly greater importance values in all groups except for group 4, where D. winteri had a similar importance value. Other species with high average importance values for regeneration in all groups were L. philippiana and D. winteri (Figure 6). Nothofagus nitida and S. conspicua only had regeneration in groups 3 and 4, but with higher values in the group 4, similar to L. philippiana. Weinmannia trichosperma hardly showed regeneration in any group and Caldcluvia panniculata (Cav.) D. Don. had regeneration in all groups but with medium to low importance values.
Figure 4. Diameter structure by forest group including all tree species. Weibull function line indicates the adjusted size distribution. c = Weibull shape parameter, D = mean density (trees per ha), G = mean basal area (m2 per ha).
Forests 04 01087 g004
Figure 5. Diameter structure of the principal tree species grouped according to their shade tolerance for each forest group. Inset in groups 2 and 4 show the diameter structure of the shade-intolerant species. Abbreviations of species in Table 1: c = shape parameter of the Weibull distribution, D = mean density (trees per ha), G = mean basal area (m2 per ha).
Forests 04 01087 g005
Figure 6. Relative importance values for the regeneration of each tree species by forest group. Abbreviations of species are given in Table 1. Different letters indicate significant differences (P < 0.05) between tree species.
Forests 04 01087 g006

4. Discussion

4.1. Valdivian or North-Patagonian Forests?

The cluster analysis (Figure 2) clearly divides forests into two regions, grouping the north and center of Chiloé in one, and in a different group the ones of this study in addition to other North-Patagonian forests [13,18]. This study provides evidence to indicate that the latitudinal ecotone between Valdivian and North-Patagonian forests within the Evergreen forest type occurs around the center of Chiloé (43° S), confirming the limit suggested by other authors between these two physiographic regions [15,32]. Furthermore, the limit proposed by the present study coincides with the division between the North and South temperate biogeographic region defined between parallels 42° and 43° S on the basis of 74% of the vascular species of Chile [33].
Since the forests of southern Chiloé correspond to North-Patagonian forests, it is highly questionable that the current regulations for management of Valdivian forests are being applied to these forests, which have other dominant tree species and structure. Therefore, as it is suggested in the following sections, the definition of forest groups and the characterization of their structure and tree composition are of great importance for future planning of appropriate silvicultural systems for the management and conservation of forests in southern Chiloé.

4.2. Forest Groups in the Evergreen Forests of Southern Chiloé

Our study shows that in a relatively narrow and homogeneous area of rolling hills and low elevation in southern Chiloé (1060 ha), the two subtypes of old-growth forests of the Evergreen forest type are found [6,29], e.g., forests with emergent shade-intolerant trees (W. trichosperma and N. nitida; groups 3 and 4) and forests dominated by shade-tolerant species (L. philippiana and A. luma, groups 1 and 2). Six tree species (A. luma, D. winteri, L. philippiana, W. trichosperma, N. nitida and S. conspicua) occupy the space between the lower canopy and emergent tier in the forest, but their relative dominance (importance) can be very different as observed in the defined groups (Table 2).
Within the study area, besides distinguishing differences in composition/relative importance, also differences in basal area were observed for the different species, suggesting that differences in volumes also occur. Group 4, with more shade-intolerant emergent trees had a significantly higher basal area than groups 1 and 2, which do not have or have a very low presence of these species (Table 2). To segregate forests types or groups, basal area has been the least considered of the four variables identified for developing the forest types in Chile [6]. In this context, the present study suggests that the basal area of a forest can be a relevant variable for forest typification, which is also very important to define sustainable silvicultural alternatives in them. It remains to be studied whether the basal area of the emergent and canopy layers in the groups is independent, for example if the phenomenon of additive basal area occurs as it has been observed in old-growth forests of N. dombeyi, S. conspicua and L. philippiana in the Valdivian Andes and in other temperate forests of the world (see [34] and references therein).
The diameter structure of the forests was also different among the groups dominated by shade-tolerant and those dominated by shade-intolerant species. While the c parameter of the Weibull function is low in the four groups, reflecting a negative exponential distribution, the groups 1 and 2 show a structure with a reverse J-shaped diameter distribution, as opposed to groups 3 and 4, which had a rotated-S shape (sensu [35]), especially in group 4. The large proportion of large individuals in groups 3 and 4, due to the persistence of an old cohort of the pioneers N. nitida and W. trichosperma and the more shade-tolerant S. conspicua (group 4) that can achieve giant sizes due to its ability to persist with adventitious roots generated within hollow logs [36], would explain that these groups present diameter structures most similar to the rotated S- shape rather that the reverse J-shape (Figure 4 and Figure 5). The rotated S-shape diameter structures are common in forests with composite structures that include successional and pioneer species, as reported for south central Chile [37] and for old-growth temperate forests of the Northern Hemisphere [35,38,39,40].
Previous studies in the forests of central Chiloé have reported statistically significant relationships between diameter and age for several of the main species in this study [8,11,16]. Consequently, it is possible to interpret the dynamics and successional stage of these forests based on their diameter structure and regeneration, especially in this study where variations in structure and composition are not the result of environment or site, which is homogeneous in the study area. Thus, the groups dominated by shade-tolerant species (1 and 2), could be interpreted as those in a more advanced successional stage due to the dominance of the highly shade-tolerant species A. luma and L. philippiana and the semi shade-tolerant D. winteri, both at tree and seedlings stages. In both groups, shade-tolerant species reach their highest values in density and basal area. By contrast, groups 3 and 4 can be interpreted as those in earlier successional stages. In both groups, the shade-intolerant species W. trichosperma and N. nitida dominate in terms of basal area, and in group 4 also along with S. conspicua. In group 3, shade-tolerant and shade-intolerant species coexist, with a continuous regeneration mode for the shade-tolerant species and D. winteri, and a bimodal structure for the shade-intolerant species (Figure 5). Regeneration in group 3 is dominated by A. luma, L. philippiana and D. winteri, but unlike groups 1 and 2, in this case there is also regeneration of N. nitida. These characteristics, in addition to the bimodal structure, indicate that in this forest group, tree fall gaps form canopy openings large enough for N. nitida to regenerate, as it has also been observed in forests of northern Chiloé Island [11].

5. Conclusions

The degradation and fragmentation of native forests that has increased in the last years in northern Chiloé, mainly because of harvesting firewood [41], has gradually moved towards the southern forests of the island which, up to now, have been in good conservation conditions. In this context, it is very likely that an increase in human pressure towards these forests will occur. While the Chilean native forest law (No. 20.283) does not include subsidies for managing old-growth forests, which suggests that the State does not want individuals to manage these forests, the reality is that except for some private protected areas, most private forest owners tend to use their forests, including the old-growth ones. Therefore, it is very important to know the structure and dynamics of these forests in order to (a) design sustainable silvicultural systems and prevent future degradation of these forests, and (b) have these studies as a reference for restoration initiatives of degraded areas and to generate old-growth attributes in managed secondary forests [42].
While regulations for the Evergreen forest type in Chile only include the shelterwood method or selective cuts (sensu [43]), and more recently also small-block or strip clearcuts [21], there are no regulations that promote sustainable uneven-aged silviculture [44]. The conditions of increasing soil fragility towards the south of Chiloé, and the characteristics of the forests in this region, suggest that continuous cover methods are required. If it is desired to maintain shade-intolerant species (N. nitida and W. trichosperma) in managed uneven-aged forests coexisting with more shade-tolerant species (A. luma, L. philippina, D. winteri), either for timber or to maintain higher tree diversity (at the stand or landscape levels), selection cuts can be regulated through lower residual basal areas, shorter cutting cycles to retain low basal areas through the cutting cycle, and good post-cut control of understory competition (especially from Chusquea sp.). The data from this study shows that regeneration of N. nitida and W. trichosperma was scarce, with basal areas from 50 to 80 m2/ha (Table 2), so that it is likely that basal areas throughout the cutting cycles should range between 30 to 50 m2/ha, or probably even less than this, if it is expected that shade-intolerant species become part of the managed forests. Alternatively, the group selection system could be used, but the follow-up of these cuts is always a limitation [43]. If it is desired to promote managed forests dominated by the shade-tolerant species, then basal areas throughout the cutting cycle could be relatively higher, and the aim should be to promote the development of valuable timber tree species such as D. winteri, L. philippiana and S. conspicua rather than the conspicuous A. luma. In all cases, however, the high understory competition from Chusquea sp., is an issue that deserves particular and continuous attention.
In this context, forest characterization as performed in this study coupled with knowledge about site conditions must be considered as an important part of the ecological basis to develop sustainable management guidelines, especially if increasing human uses are expected on these ecosystems.

Acknowledgments

The authors would like to thank Celso O. Navarro from Universidad de la Frontera, for providing inventory data on which this study is based, Andrés Caracciolo for checking data in the average heights of Yaldad, Álvaro Gutiérrez for valuable comments on earlier versions of the manuscript, and Daniel Uteau and Christian Salas for helping in the statistical analysis. Also, we would like to thank three anonymous reviewers for their useful comments. Pablo J. Donoso thanks the Fondecyt Project No. 1110744.

Conflicts of Interest

The authors declare no conflict of interest.

References

  1. Rowe, J.S.; Sheard, J.W. Ecological land classification: A survey approach. Environ. Manage. 1981, 5, 451–464. [Google Scholar] [CrossRef]
  2. Pregitzer, K.S.; Goebel, P.C.; Wigley, T.B. Evaluating forestland classification schemes as tools for maintaining biodiversity. J. For. 2001, 99, 33–40. [Google Scholar]
  3. Barnes, B.V.; Zak, D.R.; Denton, S.R.; Spurr, S.H. Forest Ecology, Fourth Edition. ed; John Wiley & Sons: New York, NY, USA, 1999; p. 774. [Google Scholar]
  4. Ministère des Ressources Naturelles. Available online: http://www.mrn.gouv.qc.ca/espanol/inicio.jsp (accessed on 10 July 2013).
  5. Tappenier, J.C.; Maguire, D.A.; Harrington, T.B. Silviculture and Ecology of Western U.S. Forests; Oregon State University Press: Corvallis, Oregon, OR, USA, 2007; p. 440. [Google Scholar]
  6. Donoso, C. Tipos forestales de los bosques nativos de Chile; Investigación y Desarrollo Forestal; CONAF/PNUD/FAO.; Food and Agriculture Organization of the United States: Chile, 1981; p. 70. [Google Scholar]
  7. Corporación Nacional Forestal; Comisión Nacional de Medio Ambiente; Universidad Austral de Chile. Pontificia Universidad Católica de Chile; Universidad Católica de Temuco. In Catastro y evaluación de los recursos vegetacionales nativos de Chile. Informe nacional con variables ambientales; Corporación Nacional Forestal: Santiago, Chile, 1999; p. 87. [Google Scholar]
  8. Donoso, C.; Grez, R.; Escobar, B. Estructura y dinámica de bosques del tipo forestal siempreverde en un sector de Chiloé Insular. Bosque 1984, 5, 82–104. [Google Scholar]
  9. Donoso, C.; Escobar, P.; Urrutia, J. Estructura y estrategias regenerativas de un bosque virgen de Ulmo (Eucryphia cordifolia Cav.)—Tepa (Laurelia philippiana Phil.) Looser en Chiloé, Chile. Rev. Chil. Hist. Nat. 1985, 58, 171–186. [Google Scholar]
  10. Armesto, J.J.; Figueroa, J. Stand Structure and dynamics in the temperate rain forests of Chiloé Archipelago, Chile. J. Biogeogr. 1987, 14, 367–376. [Google Scholar] [CrossRef]
  11. Gutierrez, A.G.; Armesto, J.J.; Aravena, J.C. Disturbance and regeneration dynamics of an old-growth North Patagonian rain forest in Chiloé Island, Chile. J. Ecol. 2004, 92, 598–608. [Google Scholar] [CrossRef]
  12. Gutierrez, A.G.; Aravena, J.C.; Carrasco-Farías, N.V.; Christie, D.A.; Fuentes, M.; Armesto, J.J. Gap-phase dynamics and coexistence of a long-lived pioneer and shade-tolerant tree species in the canopy of an old-growth coastal temperate rain forest of Chiloé Island, Chile. J. Biogeogr. 2008, 35, 1674–1687. [Google Scholar] [CrossRef]
  13. Gutierrez, A.G.; Armesto, J.J.; Aravena, J.C.; Carmona, M.; Carrasco, N.V.; Christie, D.A.; Peña, M.P.; Pérez, C.; Huth, A. Structural and environmental characterization of old-growth temperate rainforests of northern Chiloé Island, Chile: Regional and global relevance. For. Ecol. Manag. 2009, 258, 376–388. [Google Scholar]
  14. Donoso, P.J.; Soto, D.P.; Bertín, R.A. Size-density relationships in Drimys winteri secondary forests of the Chiloé Island, Chile: Effects of physiography and species composition. For. Ecol. Manag. 2007, 239, 120–127. [Google Scholar] [CrossRef]
  15. Veblen, T.T.; Schlegel, F.; Oltremari, J. Temperate broad-leaved evergreen forests of South America. In Temperate Broad-Leaved Evergreen Forests; Elsevier Science Publishers: Amsterdam, The Netherlands, 1983; pp. 5–31. [Google Scholar]
  16. Veblen, T.T. Forest development in tree-fall gaps in the temperate rain forests of Chile. Natl. Geogr. Res. 1985, 1, 161–184. [Google Scholar]
  17. Armesto, J.J.; Fuentes, E.R. Tree species regeneration in a mid-elevation, temperate rain forest in Isla de Chiloé, Chile. Vegetatio 1988, 74, 151–159. [Google Scholar] [CrossRef]
  18. Innes, J.L. Structure of evergreen temperate rain forests on the Taitao Peninsula, Southern Chile. J. Biogeogr. 1992, 19, 555–562. [Google Scholar] [CrossRef]
  19. Ther-Ríos, F. Prácticas cotidianas e imaginarios en sociedades litorales. El sector de Cucao, Isla Grande de Chiloé. Rev. Antropol. Chil. 2008, 40, 67–80. [Google Scholar]
  20. Echeverria, C.; Coomes, D.A.; Hall, M.; Newton, A.C. Spatially explicit models to analyze forest loss and fragmentation between 1976 and 2020 in southern Chile. Ecol. Model. 2008, 212, 439–449. [Google Scholar] [CrossRef]
  21. Donoso, C.; Donoso, P.J.; González, M.E.; Sandoval, V. Los bosques siempreverdes. In Silvicultura de los bosques nativos de Chile; Editorial Universitaria: Santiago, Chile, 1999; pp. 297–339. [Google Scholar]
  22. Donoso, C. Regeneración y crecimiento en el tipo forestal siempreverde costero y andino tras distintos tratamientos silviculturales. Bosque 1989, 10, 69–83. [Google Scholar]
  23. Di Castri, F.; Hajek, E. Bioclimatología de Chile; Vicerrectoría Académica de la Universidad Católica de Chile: Santiago, Chile, 1976; p. 163. [Google Scholar]
  24. Watters, W.A.; Fleming, C.A. Contributions to the geology and palaeontology of Chiloé Island, Southern Chile. Philos. Trans. R. Soc. B Biol. Sci. 1972, 263, 369–408. [Google Scholar] [CrossRef]
  25. Bannister, J.R.; Donoso, P.J.; Bauhus, J. Persistence of the slow growing conifer Pilgerodendron uviferum in old-growth and fire-disturbed southern bog forests. Ecosystems 2012, 15, 1158–1172. [Google Scholar] [CrossRef]
  26. Donoso, C. Antecedentes básicos para la silvicultura del tipo forestal siempreverde. Bosque 1989, 10, 37–53. [Google Scholar]
  27. Aravena, J.C.; Carmona, M.R.; Perez, C.A.; Armesto, J.J. Changes in tree species richness, stand structure and soil properties in a successional chronosequence in northern Chiloé Island, Chile. Rev. Chil. Hist. Nat. 2002, 75, 339–360. [Google Scholar]
  28. Kreft, H.; Jetz, W. A framework for delineating biogeographical regions based on species distributions. J. Biogeogr. 2010, 37, 2029–2053. [Google Scholar] [CrossRef]
  29. Donoso, C. Bosques Templados de Chile y Argentina: Variación, Estructura y Dinámica; Universitaria: Santiago, Chile, 1993; p. 484. [Google Scholar]
  30. Bailey, R.; Dell, T.R. Quantifying diameter distributions with the Weibull function. For. Sci. 1973, 19, 97–104. [Google Scholar]
  31. Cohen, A.C. Maximum likelihood estimation in the Weibull distribution based on complete and on censored samples. Technometrics 1965, 7, 579–588. [Google Scholar] [CrossRef]
  32. Veblen, T.T.; Alaback, P.B. A comparative review of forest dynamics and disturbance in the temperate rainforests of North and South America. In High-Latitude Rainforests and Associated Ecosystems of the West Coast of the Americas. Climate, Hydrology, Ecology and Conservation; Springer Verlag: New York, NY, USA, 1995; pp. 173–215. [Google Scholar]
  33. Bannister, J.R.; Vidal, O.J.; Teneb, E.; Sandoval, V. Latitudinal patterns and regionalization of plant diversity along a 4270-km gradient in continental Chile. Austral Ecol. 2012, 37, 500–509. [Google Scholar] [CrossRef]
  34. Donoso, P.J.; Lusk, C.H. Differential effects of emergent Nothofagus dombeyi on growth and basal area of canopy species in an old-growth temperate rainforest. J. Veg. Sci. 2007, 18, 675–684. [Google Scholar] [CrossRef]
  35. Goff, F.G.; West, D. Canopy-understory interaction effects on forest population structure. Forest Sci. 1975, 21, 98–108. [Google Scholar]
  36. Veblen, T.T.; Schlegel, F.; Escobar, B. Structure and dynamics of old-growth Nothofagus forests in the Valdivian Andes. J. Ecol. 1980, 68, 1–31. [Google Scholar] [CrossRef]
  37. Donoso, P.J. Structure and Growth in Coastal Evergreen Forests as the Bases for Uneven-Aged Silviculture in Chile; State University of New York: New York, NY, USA, 2002; p. 314. [Google Scholar]
  38. Lorimer, C.G.; Krug, A.G. Diameter distributions in even-aged stands of shade-tolerant and midtolerant tree species. Am. Midl. Nat. 1983, 109, 331–345. [Google Scholar] [CrossRef]
  39. Tyrrel, L.E.; Crow, T. Structural characteristics of old-growth hemlock-hardwood forests in relation to age. Ecology 1994, 75, 370–386. [Google Scholar] [CrossRef]
  40. Westphal, C.; Tremer, N.; Von Oheimb, G.; Hansen, J.; Von Gadow, K.; Hardtle, W. Is the reverse J-shaped diameter distribution universally applicable in European virgin beech forests? For. Ecol. Manag. 2006, 223, 75–83. [Google Scholar] [CrossRef]
  41. Neira, E.; Bertín, R.A. Hábitos del uso de la leña en Castro, Isla de Chiloé. Bosque Nativo 2009, 45, 3–8. [Google Scholar]
  42. Bauhus, J.; Puettmann, K.; Messier, C. Silviculture for old-growth attributes. For. Ecol. Manag. 2009, 258, 525–537. [Google Scholar] [CrossRef] [Green Version]
  43. Nyland, R.D. Silviculture: Concepts and Applications.; McGraw-Hill: New York, NY, USA, 2002; p. 682. [Google Scholar]
  44. Nyland, R.D. Even- to uneven-aged: The challenges of conversion. For. Ecol. Manag. 2003, 172, 291–300. [Google Scholar] [CrossRef]

Table S1. Tree species included in the cluster analysis.
Species nameFamily
Aextoxicon punctatum R. Et Pav.Aextoxicaceae
Amomyrtus luma (Mol.) Legr. et. Kausel.Myrtaceae
Amomyrtus meli(Phil) Legr. et KauselMyrtaceae
Aristotelia chilensis (Mol) StuntzElaeocarpaceae
Caldcluvia panniculata (Cav.) D. Don.Cunoniaceae
Dassiphylum diacanthoides (Less.) Cabrera Asteraceae
Drimys winteri J.R. et. G. Forster.Winteraceae
Embothrium coccineum J.R. et.G. Forster.Proteaceae
Eucryphia cordifoliaCav.Eucryphiaceae
Gevuina avellanaMol.Proteaceae
Laureliopsis philippiana Looser.Monimiaceae
Lomatia ferruginea (Cav.) R. Br.Proteaceae
Luma apiculata (D.C.) Burret.Myrtaceae
Myrceugenia chrysocarpa (O. Berg) KauselMyrtaceae
Myrceugenia ovata(Hooker et Arntt) BergMyrtaceae
Myrceugenia parviflora (DC) Kausel.Myrtaceae
Myrceugenia planipes(H et A.) BergMyrtaceae
Nothofagus dombeyi(Mirb.) Oerst.Fagaceae
Nothofagus nitida (Phil) Krasser.Fagaceae
Ovidia pillo pillo (C.Gray) Hohen. ex. C.F.W.Meissn.Thymelaeaceae
Podocarpus nubigena Lindl.Podocarpaceae
Raphithamnus spinosus(Juss.) MoldenkeVerbenaceae
Saxegothaea conspicua Lindl.Podocarpaceae
Sophora microphylla AitonPapilionaceae
Tepualia stipularis (Hook et. Arn.) Grises.Myrtaceae
Weinmannia trichosperma Cav.Cunoniaceae

