White Spruce Plantations on Abandoned Agricultural Land: Are They More Effective as C Sinks than Natural Succession?

Abstract
:1. Introduction
2. Experimental Section
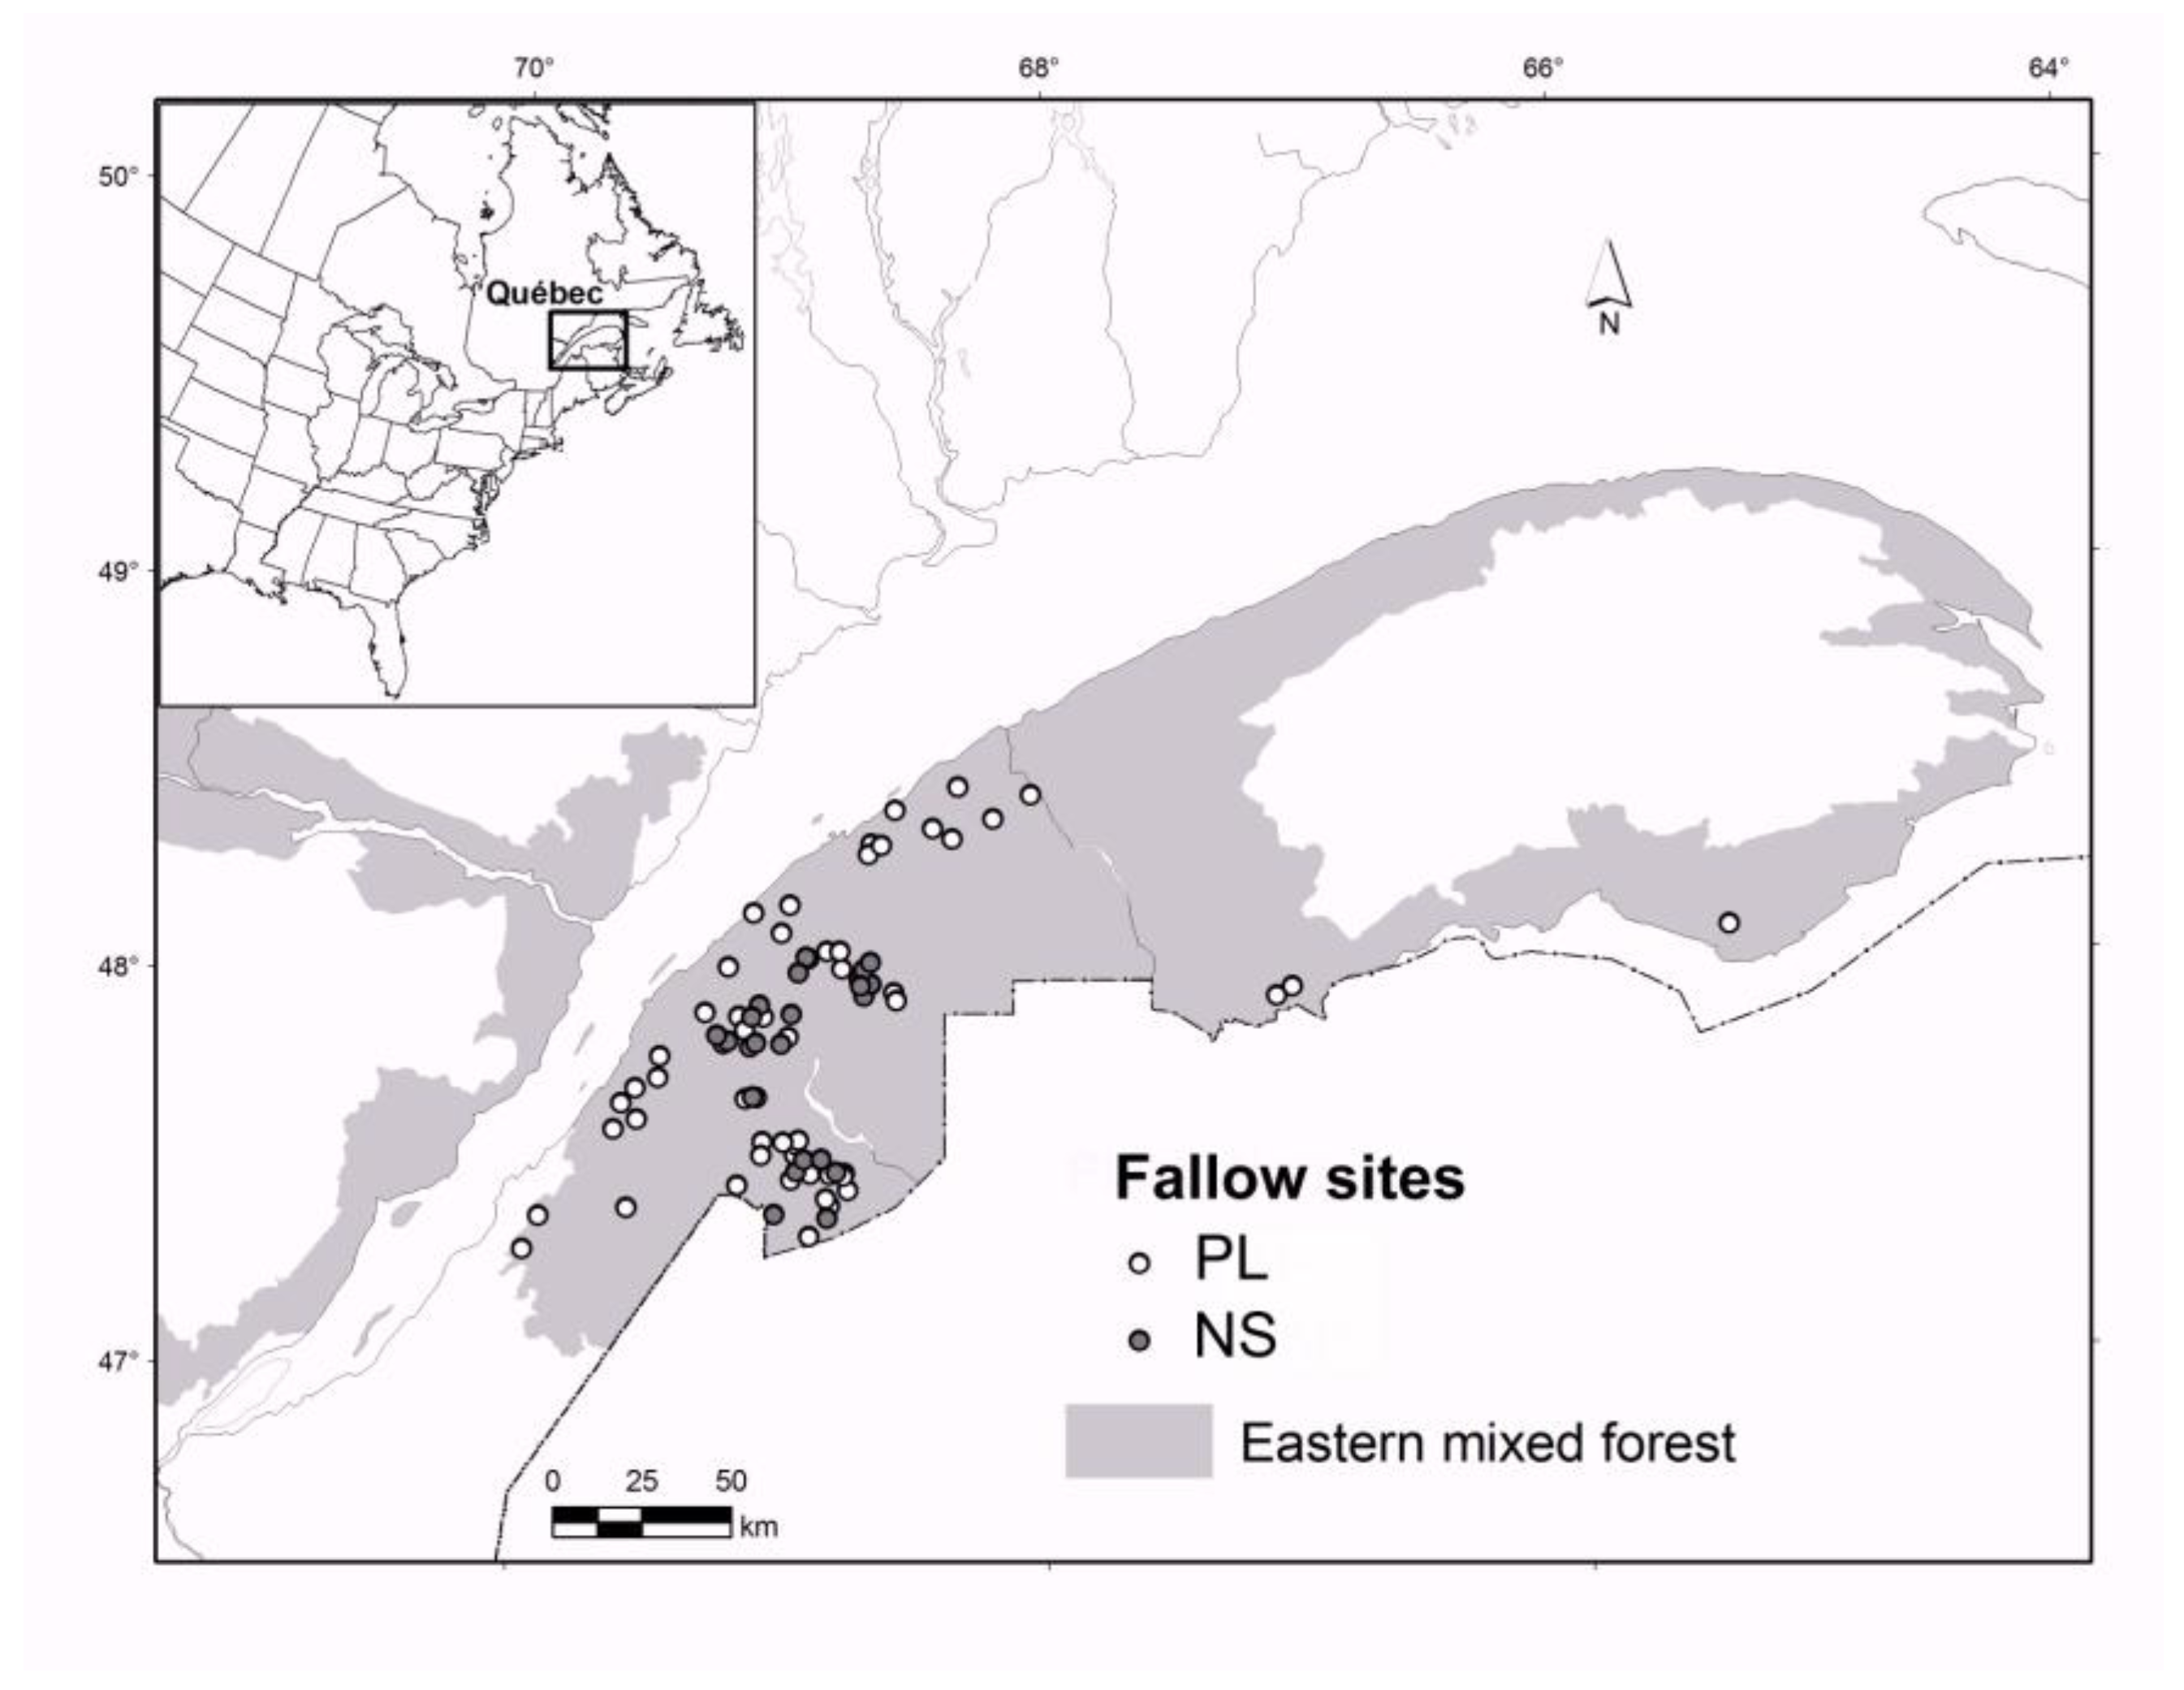
2.1. Study Area

2.2. The Chronosequence Approach
2.3. Tree and Shrub Measurements
2.4. Sampling of Litter and of Vegetation Shorter than 1.3 m
2.5. Soil Sampling
2.6. Laboratory Analyses
2.7. Total C Content Estimation
2.8. Statistical Analyses
3. Results
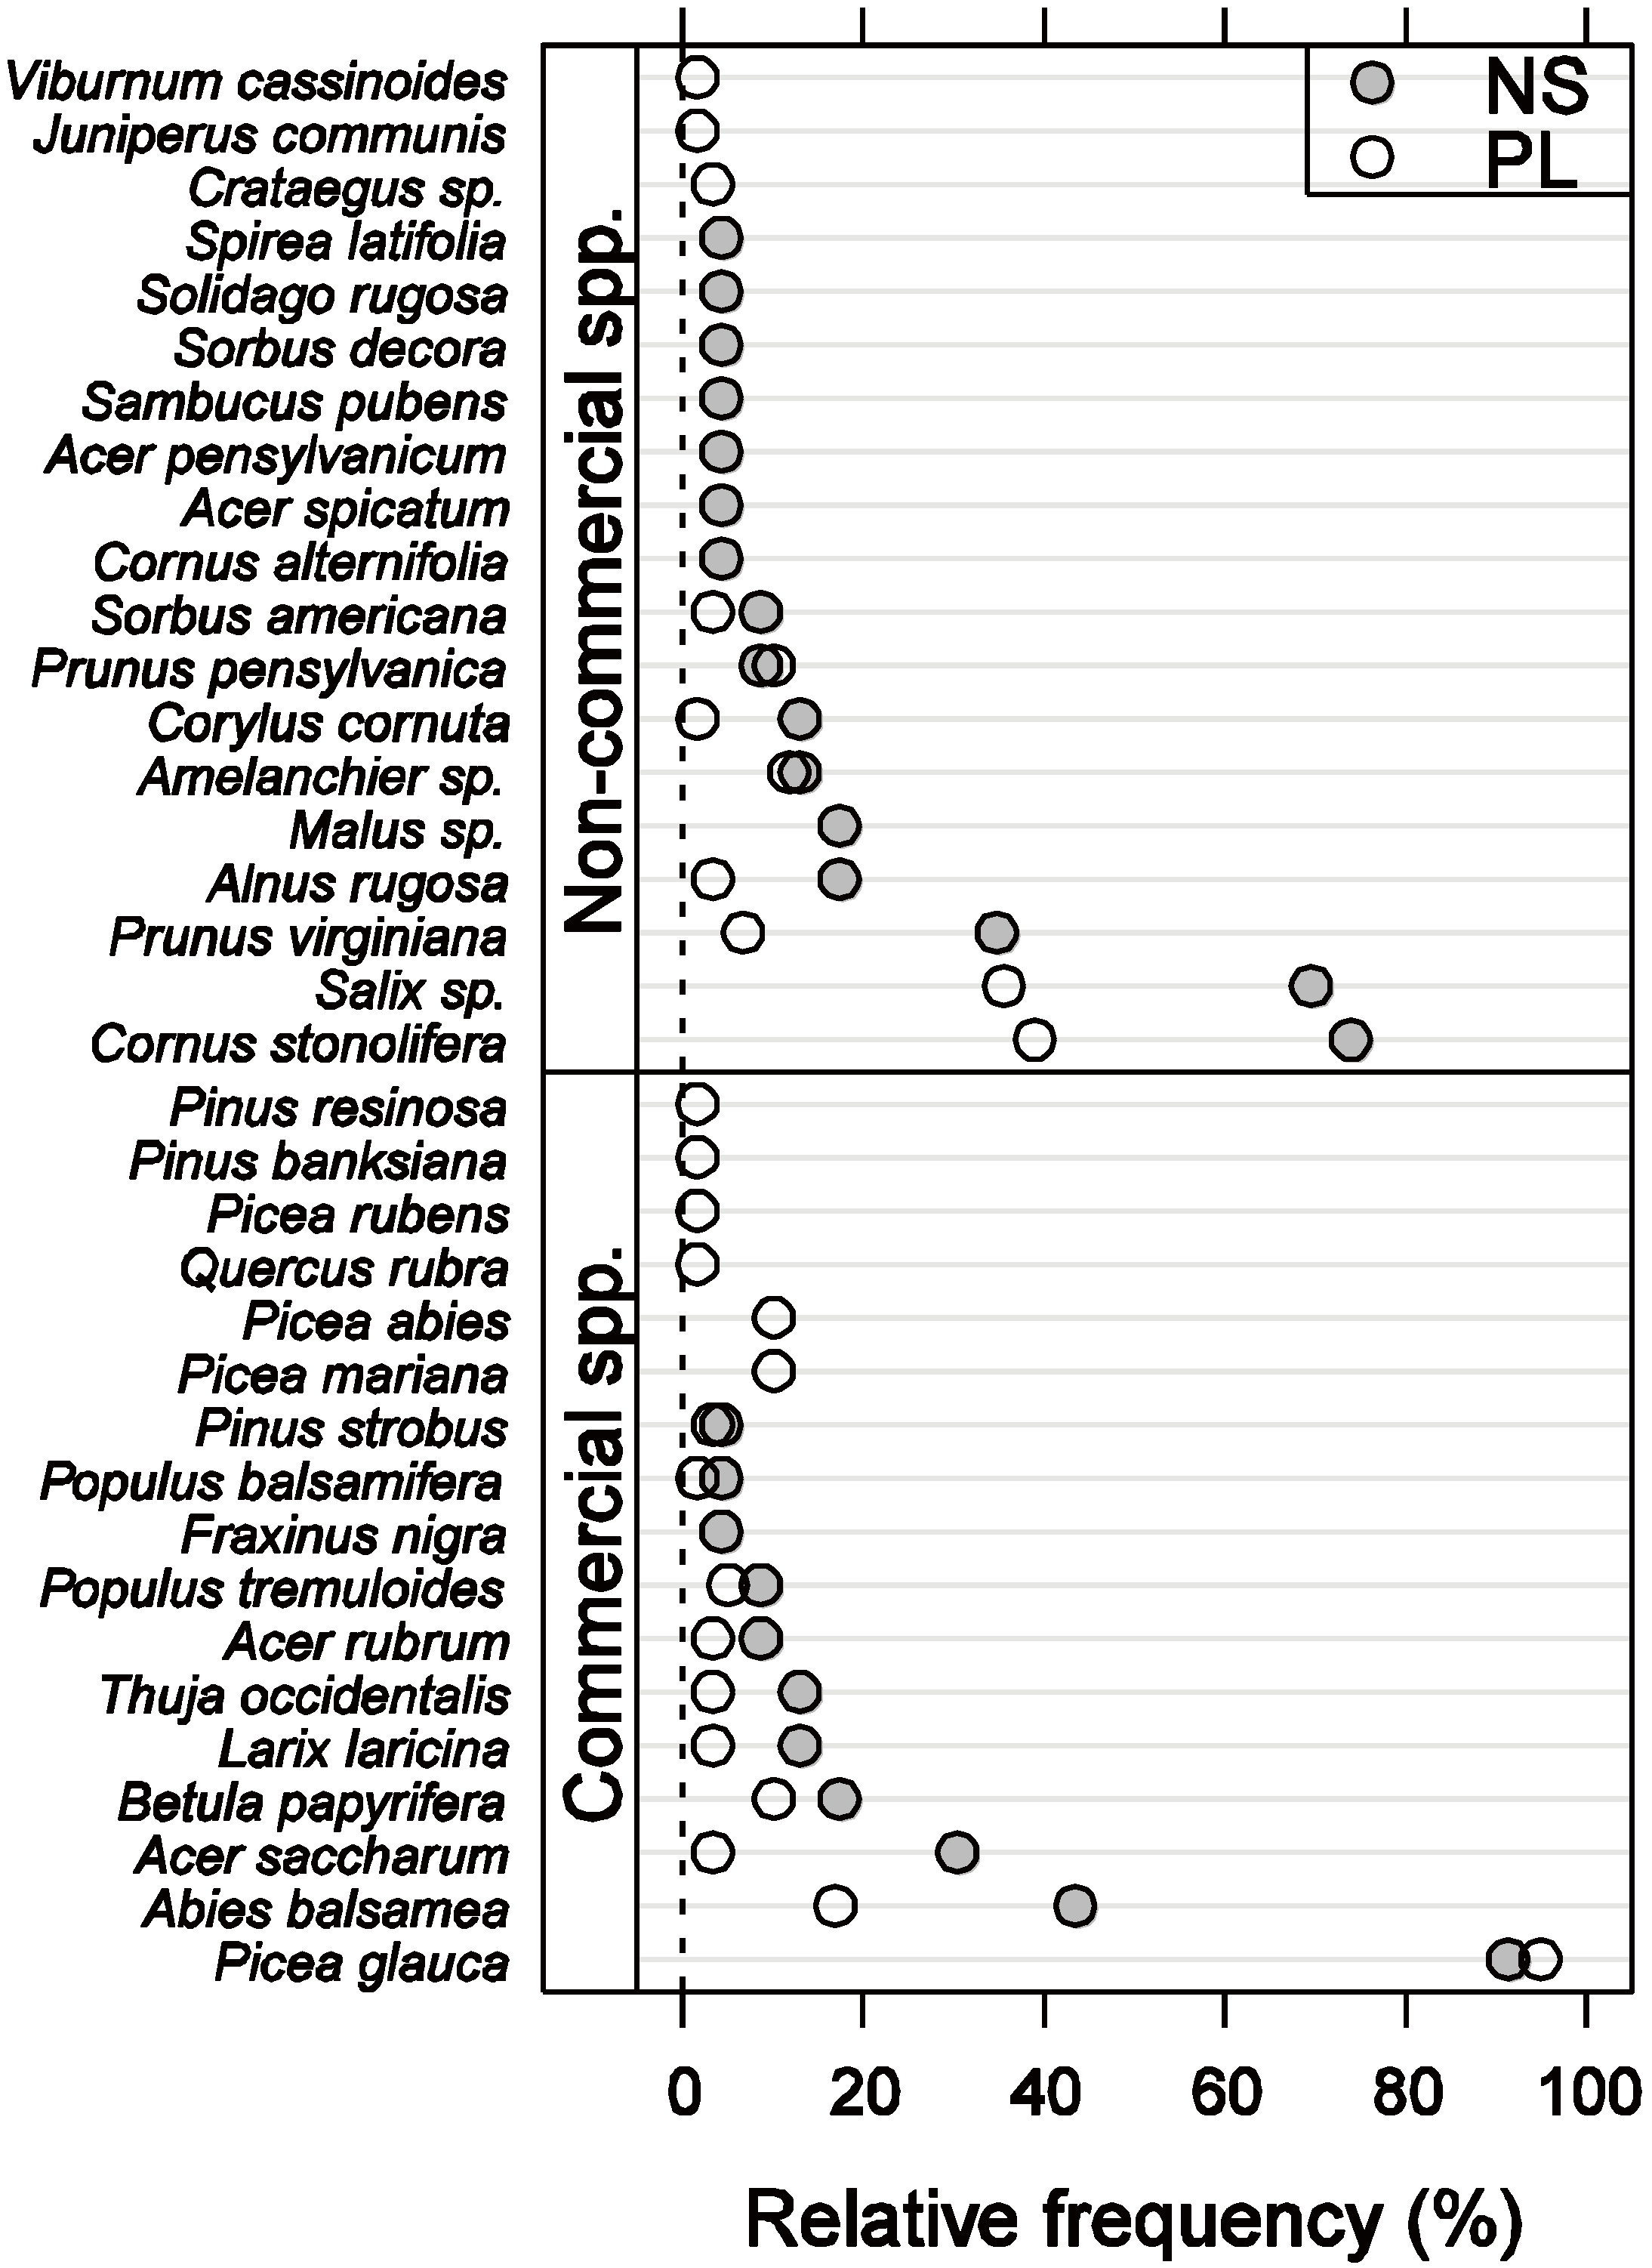
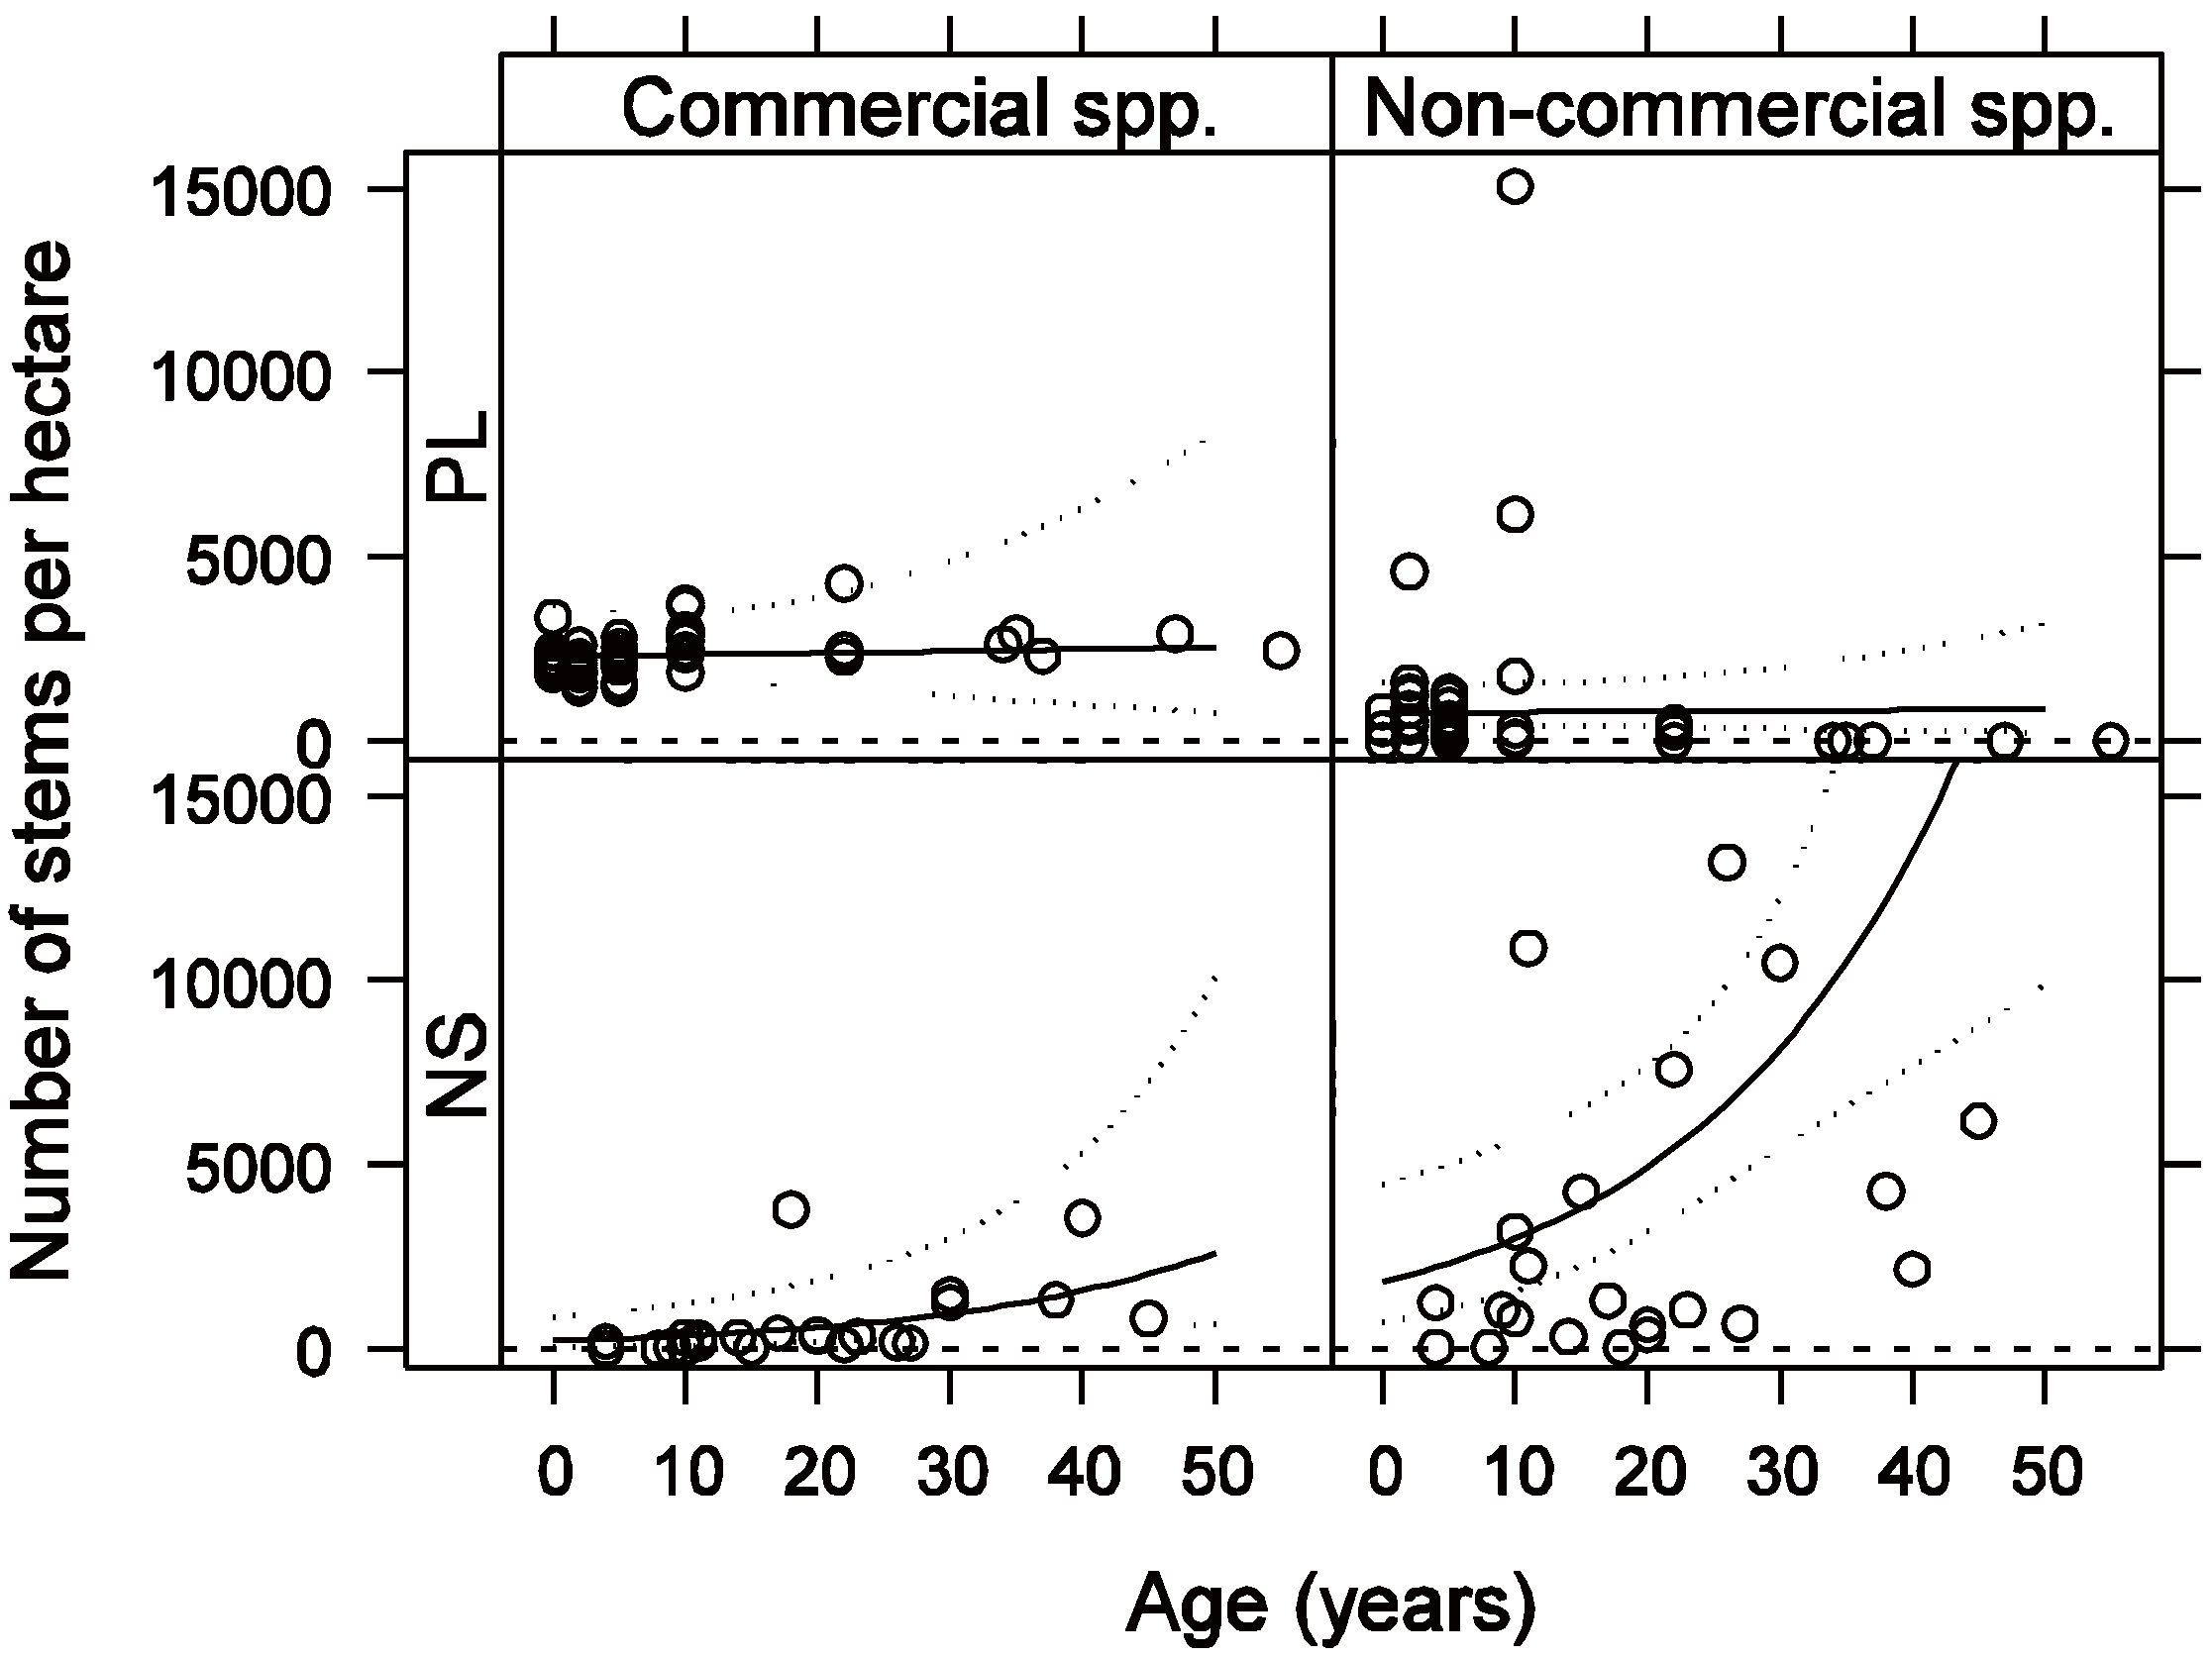
3.1. Vegetation Composition and Density
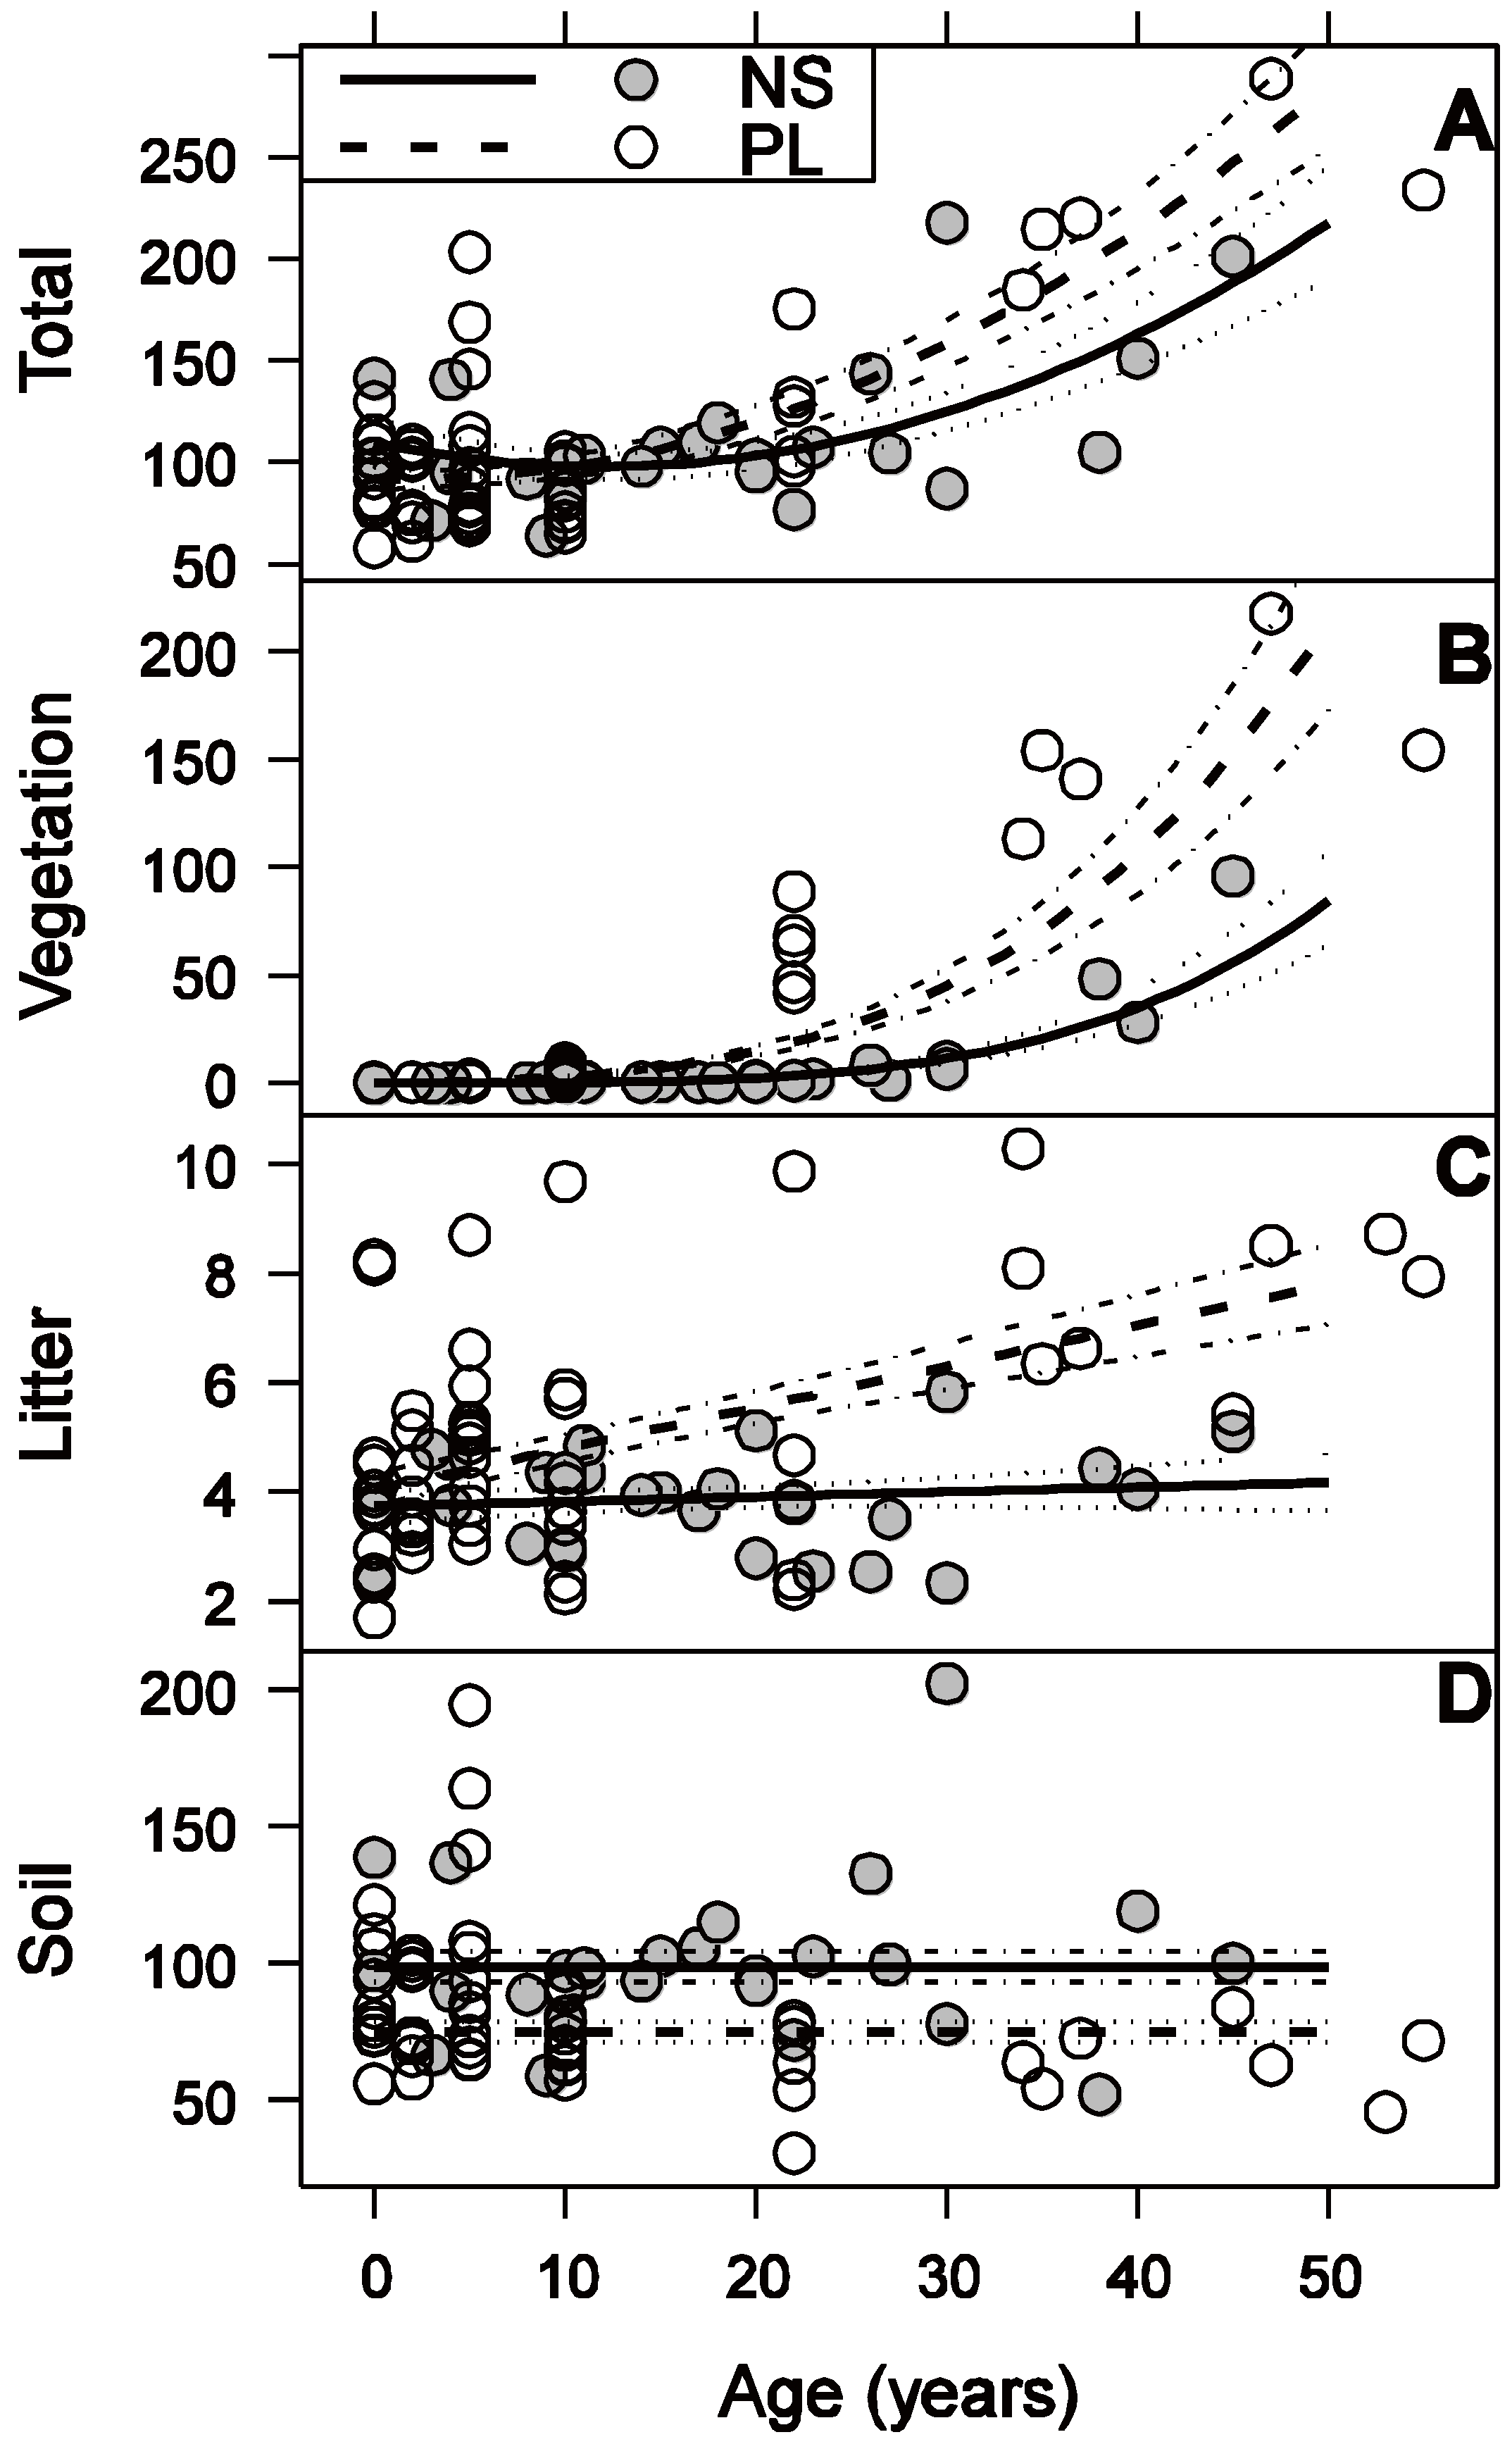
3.2. Vegetation C Stock

| Compartment | Age = 0 years | Age = 50 years | ||||||||
|---|---|---|---|---|---|---|---|---|---|---|
| NS | PL | Difference | P | NS | PL | Difference | P | |||
| Bulk density | 0.975 (0.031) | 0.888 (0.021) | 0.086 (0.031) | 0.005 | 0.854 (0.042) | 0.767 (0.043) | 0.086 | 0.005 | ||
| C stocks | Soil (0–50 cm) | 96.6 (9.6) | 82.0 (4.7) | −14.5 (10.7) | 0.173 | 97.9 (15.6) | 53.9 (10.6) | −44.1 (18.9) | 0.020 | |
| Litter | 3.7 (0.3) | 4.0 (0.3) | 0.3 (0.4) | 0.490 | 4.2 (0.5) | 7.8 (0.7) | 3.6 (0.9) | <0.001 | ||
| Aboveground vegetation | 0.5 (0.3) | 0.0 (0.1) | 0.5 (0.3) | 0.067 | 67.9 (21.1) | 196.6 (42.5) | 128.7 (21.3) | <0.001 | ||
| Coarse roots | 0.0 (0.0) | 0.0 (0.0) | 0.0 (0.0) | 0.434 | 16.3 (2.7) | 16.9 (2.7) | 0.6 (0.2) | 0.014 | ||
| Total | 109.6 (11.8) | 91.8 (5.5) | −17.8 (11.8) | 0.135 | 217.9 (28.7) | 285.7 (31.0) | 67.8 (28.1) | 0.018 | ||
3.3. Litter C Stock
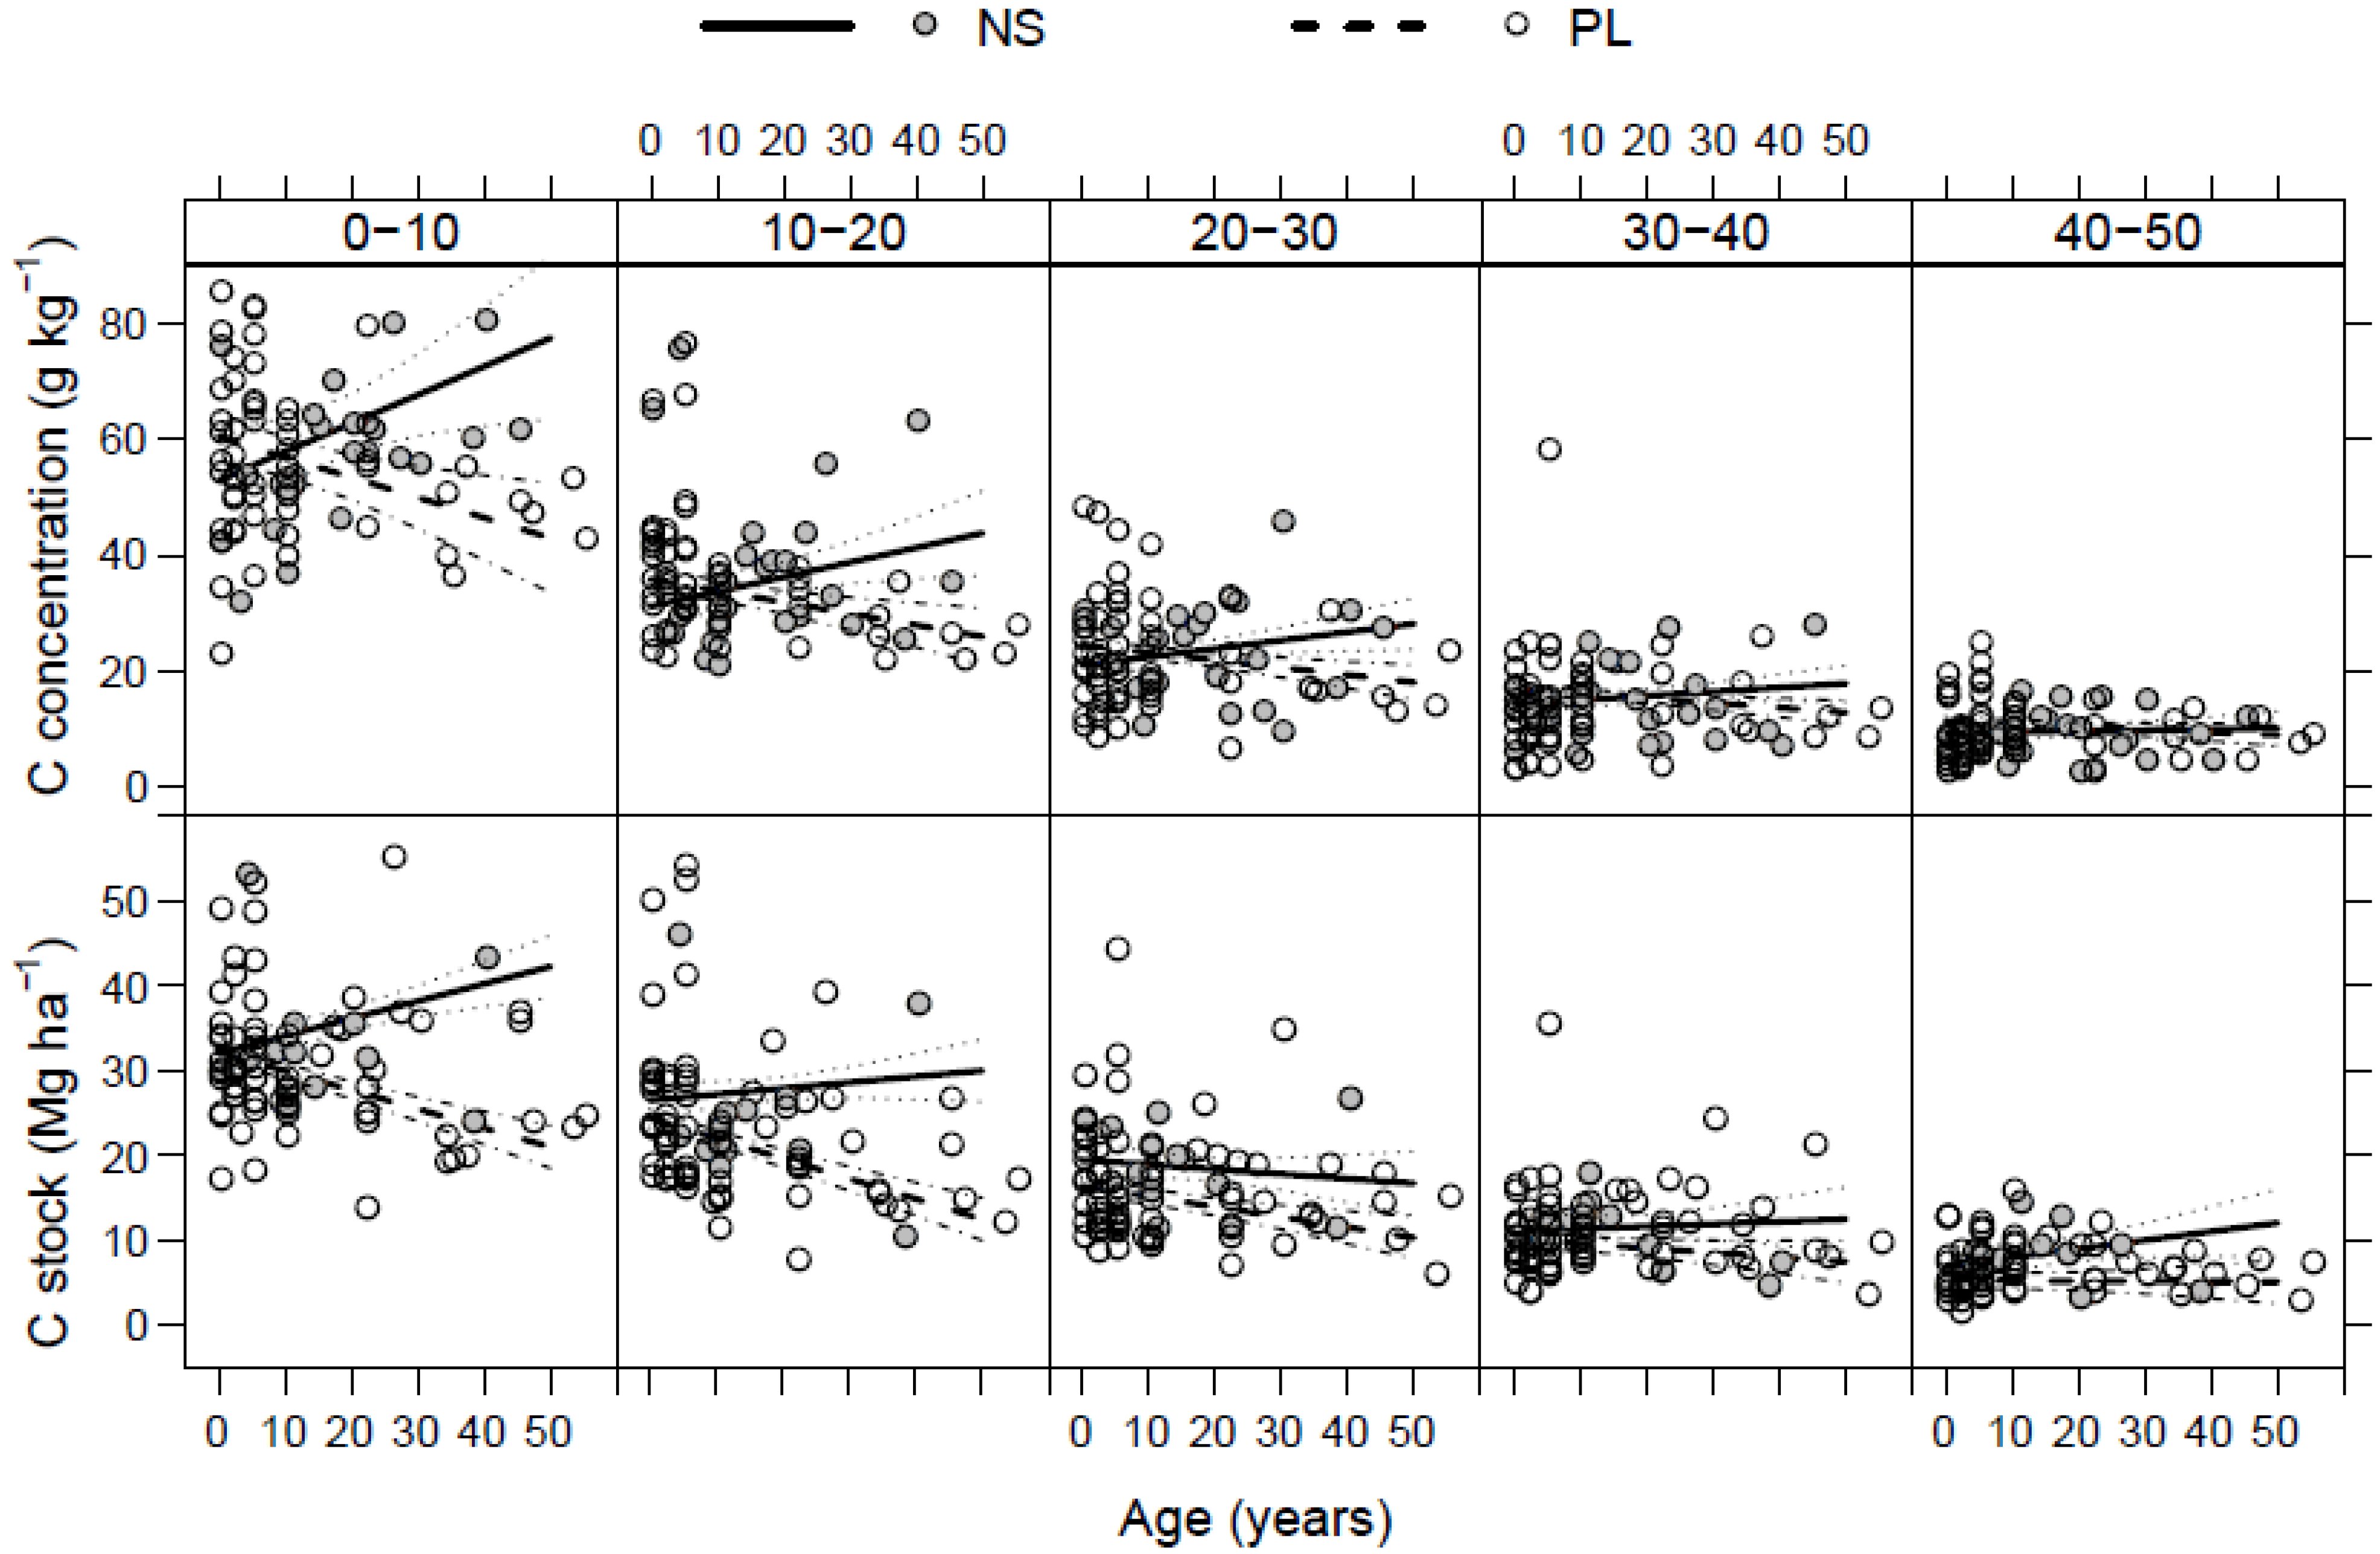
3.4. Soil C Stock

3.5. Total C Stock
4. Discussion
4.1. Vegetation
4.2. Litter
4.3. Soil
4.4. Total
5. Conclusions
- (1)
- To promote long-term climate change mitigation, PL sites should have planned rotations of more than 50 years for them to reach a net gain of C in the mineral soil, since soil C stocks of PL sites were still decreasing after 50 years.
- (2)
- Longer-term studies on spruce PL sites should be continued to determine the moment when mineral soil starts to sequestrate C, and down to which depth. Also, measuring fine root production and mortality would allow estimation of the importance of this soil C input.
- (3)
- Although NS sites sequester less C, they still represent an interesting option because of other advantages, such as a lower cost, a higher plant biodiversity, and a larger soil C sink in the 0–30 cm layer.
Acknowledgments
Conflicts of Interest
References
- Solomon, S.; Qin, D.; Manning, M.; Chen, Z.; Marquis, M.; Averyt, K.B.; Tignor, M.; Miller, H.L. Climate Change 2007: The Physical Science Basis; Contribution of Working Group I to the Fourth Assessment Report of the Intergovernmental Panel on Climate Change, 2007; Cambridge University Press: Cambridge, UK, 2007. [Google Scholar]
- Metz, B.; Davidson, O.R.; Bosch, P.R.; Dave, R.; Meyer, L.A. Climate Change 2007: Mitigation of Climate Change; Contribution of Working Group III to the Fourth Assessment Report of the Intergovernmental Panel on Climate Change, 2007; Cambridge University Press: Cambridge, UK, 2007. [Google Scholar]
- Lal, R. Soil carbon sequestration impacts on global climate change and food security. Science 2004, 304, 1623–1627. [Google Scholar] [CrossRef]
- McLauchlan, K. The nature and longevity of agricultural impacts on soil carbon and nutrients: A review. Ecosystems 2006, 9, 1364–1382. [Google Scholar] [CrossRef]
- Rey Benayas, J.M.; Martins, A.; Nicolau, J.M.; Schulz, J.J. Abandonment of agricultural land: An overview of drivers and consequences. CAB Rev. Perspect. Agri., Vet. Sci., Nutr. Nat. Resour. 2007, 2, 057:1–057:14. [Google Scholar]
- Parson, H.E. Regional trends of agricultural restructuring in Canada. Can. J. Reg. Sci. 1999, 22, 343–356. [Google Scholar]
- Vouligny, C.; Gariépy, S. Abandoned Farmland in Quebec—Status and Development Options; Agriculture and Agri-Food Canada: Ottawa, Canada, 2008. [Google Scholar]
- Food and Agriculture Organization (FAO). State of the World’s Forests 2011; FAO: Rome, Italy, 2011. Available online: http://www.fao.org/docrep/013/i2000e/i2000e00.htm (accessed on 10 May 2013).
- Lugo, A.E. The apparent paradox of re-establishing species richness on degraded lands with tree monocultures. For. Ecol. Manage. 1997, 99, 9–19. [Google Scholar] [CrossRef]
- Chazdon, R.I. Beyond deforestation : Restoring forests and ecosystem services on degraded lands. Science 2008, 320, 1458–1460. [Google Scholar] [CrossRef]
- Cuesta, B.; Rey Benayas, J.M.; Gallardo, A.; Villar-Salvador, P.; Gonzales-Espinosa, M. Soil chemical properties in abandoned Mediterranean cropland after succession and oak reforestation. Acta Oecologica 2012, 38, 58–65. [Google Scholar] [CrossRef]
- Fensham, R.J.; Guymer, G.P. Carbon accumulation through ecosystem recovery. Environ. Sci. Policy 2009, 12, 367–372. [Google Scholar] [CrossRef]
- Foote, R.L.; Grogan, P. Soil carbon accumulation during temperate forest succession on abandoned low productivity agricultural lands. Ecosystems 2010, 13, 795–812. [Google Scholar] [CrossRef]
- Van Minnen, J.G.; Strengers, B.J.; Eickhout, B.; Swart, R.J.; Leemans, R. Quantifying the effectiveness of climate change mitigation through forest plantations and carbon sequestration with an integrated land-use model. Carbon Balance Manage. 2008, 3, 3. [Google Scholar] [CrossRef]
- Betts, R.A. Offset of the potential carbon sink from boreal forestation by decreases in surface albedo. Nature 2000, 408, 187–190. [Google Scholar] [CrossRef]
- Schaeffer, M.; Eickhout, B.; Hoogwijk, M.; Strengers, B.; van Vuuren, D.; Leemans, R.; Opsteegh, T. CO2 and albedo climate impacts of extra-tropical carbon and biomass plantations. Global Biogeochem. Cycles 2006, 20. [Google Scholar] [CrossRef]
- White, T.M.; Kurz, W.A. Afforestation on private land in Canada from 1990 to 2002 estimated from historical records. For. Chron. 2005, 81, 491–497. [Google Scholar]
- Tremblay, S.; Périé, C.; Ouimet, R. Changes in organic carbon storage in a 50 year white spruce plantation chronosequence established on fallow land in Quebec. Can. J. For. Res. 2006, 36, 2713–2723. [Google Scholar] [CrossRef]
- Ouimet, R.; Tremblay, S.; Périé, C.; Prégent, G. Ecosystem carbon accumulation following fallow farmland afforestation with red pine in southern Quebec. Can. J. For. Res. 2007, 37, 1118–1133. [Google Scholar] [CrossRef]
- Saucier, J.-P.; Bergeron, J.-F.; Grondin, P.; Robitaille, A. Les régions écologiques du Québec méridional (3e version): un des éléments du système hiérarchique de classification du territoire mis au point par le ministère des Ressources naturelles du Québec, Québec, Canada; Supplément de l’Aubelle; Gouvernement du Québec: Québec, Canada, 1998.
- Noël, J. Relations entre la végétation, le milieu physique, les perturbations naturelles et le climat dans le Québec méridional, documents cartographiques: Tome 1. Le système hiérarchique de classification écologique du MRNQ, le milieu physique, les perturbations naturelles et le climat; Ministère des Ressources naturelles, Direction de la recherche forestière, Gouvernement du Québec: Québec, Canada, 2002.
- Robitaille, A.; Saucier, J.-P. Land district, eco-physiographic units and areas: The landscape mapping of the Ministère des Ressources naturelles du Québec. Environ. Monit. Assess. 1996, 39, 127–148. [Google Scholar] [CrossRef]
- Soil Classification Working Group. The Canadian System of Soil Classification, 3rd ed.; Agriculture and Agri-Food Canada: Ottawa, Canada, 1998. [Google Scholar]
- Federer, C.A.; Turcotte, D.E.; Smith, C.T. The organic fraction-bulk density relationship and the expression of nutrient content in forest soils. Can. J. For. Res. 1993, 23, 1026–1032. [Google Scholar] [CrossRef]
- Li, Z.; Kurz, W.A.; Apps, M.J.; Beukema, S.J. Belowground biomass dynamics in the Carbon Budget Model of the Canadian Forest Sector: recent improvements and implications for the estimation of NPP and NEP. Can. J. For. Res. 2003, 33, 126–136. [Google Scholar] [CrossRef]
- IPCC National Greenhouse Gas Inventories Programme. 2006 IPCC Guidelines for National Greenhouse Gas Inventories; Eggleston, H.S., Buendia, L., Miwa, K., Ngara, T., Tanabe, K., Eds.; IGES: Hayama, Japan, 2006; Volume 4. [Google Scholar]
- Tremblay, S.; Ouimet, R.; Houle, D. Prediction of organic carbon content in upland forest soils of Quebec, Canada. Can. J. For. Res. 2002, 32, 903–914. [Google Scholar] [CrossRef]
- Oksanen, J.; Blanchet, F.G.; Kindt, R.; Legendre, P.; Minchin, P.R.; O’Hara, R.B.; Simpson, G.L.; Solymos, P.; Stevens, M.H.H.; Wagner, H. Vegan: Community Ecology Package, R Package Version 2.0-9; 2013. Available online: http://CRAN.R-project.org/package=vegan (accessed on 1 October 2013).
- Pinheiro, J.; Bates, D.; Sarkar, D.; R Development Core Team. nlme: Linear and Nonlinear Mixed Effects Models, R Package Version 3.1-103; 2012. Available online: http://CRAN.R-project.org/package=nlme (accessed on 1 September 2013).
- R Development Core Team. R: A language and Environment for Statistical Computing; R Foundation for Statistical Computing: Vienna, Austria, 2012. [Google Scholar]
- Jackson, R.; Canadell, J.; Ehleringer, J.; Mooney, H.A.; Sala, O.; Schulze, E. A global analysis of root distributions for terrestrial biomes. Oecologia 1996, 108, 389–411. [Google Scholar] [CrossRef]
- Thuille, A.; Schulze, E.D. Carbon dynamics in successional and afforested spruce stands in Thuringia and the Alps. Glob. Change Biol. 2006, 12, 325–342. [Google Scholar] [CrossRef]
- Anderson, K.J.; Allen, A.P.; Gillooly, J.F.; Brown, J.H. Temperature-dependence of biomass accumulation rates during secondary succession. Ecol. Lett. 2006, 9, 673–682. [Google Scholar] [CrossRef]
- Ruskule, A.; Nikodemus, O.; Kasparinska, Z.; Kasparinskis, R.; Brumelis, G. Patterns of afforestation on abandoned agriculture land in Latvia. Agrofor. Syst. 2012, 85, 215–231. [Google Scholar] [CrossRef]
- Harmer, R.; Peterken, G.; Kerr, G.; Poulton, G. Vegetation changes during 100 years of development of two secondary woodlands on abandoned arable land. Biol. Conserv. 2001, 100, 291–304. [Google Scholar]
- Sirami, C.; Brotons, L.; Martin, J.L. Vegetation and songbird response to land abandonment: From landscape to census plot. Diversity Distrib. 2007, 13, 42–52. [Google Scholar]
- Bonet, A.; Pausas, J.G. Species richness and cover along a 60-year chronosequence in old-fields of southeastern Spain. Plant Ecol. 2004, 174, 257–270. [Google Scholar] [CrossRef]
- Ontario Ministry Natural Resources (OMNR). A Silvicultural Guide for the Tolerant Hardwood Forest in Ontario; Queen’s Printer for Ontario: Toronto, Canada, 1998.
- Egler, F.E. Vegetation science concepts. 1. Initial floristic composition—A factor in old-field vegetation development. Vegetatio 1954, 4, 412–417. [Google Scholar] [CrossRef]
- Zhang, K.; Dang, H.; Tan, S.; Wang, Z.; Zhang, Q. Vegetation community and soil characteristics of abandoned agricultural land and pine plantation in the Qinling Mountains, China. For. Ecol. Manage. 2010, 259, 2036–2047. [Google Scholar] [CrossRef]
- Paul, K.I.; Polglase, P.J.; Nyakuengama, J.G.; Khana, P.K. Change in soil carbon following afforestation. For. Ecol. Manage. 2002, 168, 241–257. [Google Scholar] [CrossRef]
- Li, D.; Niu, S.; Luo, Y. Global patterns of the dynamics of soil carbon and nitrogen stocks following afforestation: A meta-analysis. New Phytol. 2012, 195, 172–181. [Google Scholar] [CrossRef]
- Guo, L.B.; Gifford, R.M. Soil carbon stocks and land use change: a meta analysis. Glob. Change Biol. 2002, 8, 345–360. [Google Scholar] [CrossRef]
- Laganière, J.; Angers, D.A.; Paré, D. Carbon accumulation in agricultural soils after afforestation: A meta-analysis. Glob. Change Biol. 2010, 16, 439–453. [Google Scholar] [CrossRef]
- Shi, S.; Zhang, W.; Zhang, P.; Yu, Y.; Ding, F. A synthesis of change in deep soil organic carbon stores with afforestation of agricultural soils. For. Ecol. Manage. 2013, 296, 53–63. [Google Scholar] [CrossRef]
- Poeplau, C.; Don, A.; Vesterdal, L.; Leifeld, J.; van Wesemael, B.; Schumaker, J.; Gensior, A. Temporal dynamics of soil organic carbon after land-use change in the temperate zone—Carbon response functions as a model approach. Glob. Change Biol. 2011, 17, 2415–2427. [Google Scholar] [CrossRef]
- Guo, L.B.; Wang, M.; Gifford, R.M. The change of soil carbon stocks and fine root dynamics after land use change from a native pasture to a pine plantation. Plant Soil 2007, 299, 251–262. [Google Scholar] [CrossRef]
- Binkley, D.; Kaye, J.; Barry, M.; Ryan, M.G. First-rotation changes in soil carbon and nitrogen in a plantation in Hawaii. Soil Sci. Soc. Am. J. 2004, 68, 1713–1719. [Google Scholar] [CrossRef]
- Resh, S.C.; Binkley, D.; Parotta, J.A. Greater soil carbon sequestration under nitrogen-fixing trees compared with Eucalyptus species. Ecosystems 2002, 5, 217–231. [Google Scholar] [CrossRef]
- Polglase, P.J.; Paul, K.I.; Khana, P.K.; Nyakuengama, J.G.; O’Connell, A.M.; Grove, T.S.; Battaglia, M. Change in Soil Carbon Following Afforestation or Reforestation; National Carbon Accounting System Tech Report No. 20; Australian Greenhouse Office: Canberra, Australia, 2000. [Google Scholar]
- Ellert, B.H.; Bettany, J.R. Calculation of organic matter and nutrients stored in soils under contrasting management regimes. Can. J. Soil Sci. 1995, 75, 529–538. [Google Scholar] [CrossRef]
- National Inventory Report 1990–2011: Greenhouse Gas Sources and Sinks in Canada. Part 3; The Canadian Government’ Submission to the UN Framework Convention on Climate Change; Environment Canada: Gatineau, Canada, 2013.
- Roy, M. Personal communication, Ministère des Ressources naturelles: Québec, Canada, 2006.
© 2013 by the authors; licensee MDPI, Basel, Switzerland. This article is an open access article distributed under the terms and conditions of the Creative Commons Attribution license (http://creativecommons.org/licenses/by/3.0/).
Share and Cite
Tremblay, S.; Ouimet, R. White Spruce Plantations on Abandoned Agricultural Land: Are They More Effective as C Sinks than Natural Succession? Forests 2013, 4, 1141-1157. https://doi.org/10.3390/f4041141
Tremblay S, Ouimet R. White Spruce Plantations on Abandoned Agricultural Land: Are They More Effective as C Sinks than Natural Succession? Forests. 2013; 4(4):1141-1157. https://doi.org/10.3390/f4041141
Chicago/Turabian StyleTremblay, Sylvie, and Rock Ouimet. 2013. "White Spruce Plantations on Abandoned Agricultural Land: Are They More Effective as C Sinks than Natural Succession?" Forests 4, no. 4: 1141-1157. https://doi.org/10.3390/f4041141