1. Introduction
Land use/cover change (LUCC) is recognized as a considerable driving force behind global environmental change [
1]. In order to conduct the sustainable management of natural resources, it is necessary to understand and quantify the change process [
2]. In arid lands, where vegetation patterns show positive feedback between plant density and water infiltration [
3], LUCC shows the impact of human activities on the environmental change. Milne [
4] defined continuously changing ecosystems as either an alteration in the surface components of the vegetation cover or as a spectral/spatial movement of a vegetation entity over time [
5]. It is necessary to develop efficacious measures to monitor spatial forest change patterns in arid environments, so that policy making can be improved and for academic interest.
In the arid area of Northwest China, the increase in water requirements for agriculture and urbanization has resulted in escalating conflicts and environmental degradation [
6,
7]. The Tarim River, which is the longest inland river in China at 1321 km long, is divided into upper, middle and lower reaches, according to its hydrological characteristics [
8]. In the lower Tarim River, over 320 km had dried up by 1972, which led to drastic changes in vegetation cover and in aquatic and riparian communities [
9]. In 2000, the ecological water conveyance project (EWCP) was launched to protect and restore the declining number of fragile vegetation species, where
Populus euphratica is the most widespread species [
10]. Over the last 50 years, the area of
Populus euphratica forest has shrunk considerably. According to official records from the Tarim River Basin Management Bureau (TRBMB), in 1954, the area of
Populus euphratica forest along the main stream was 520,026 ha [
11]. According to Deng,
et al. [
12], statistics derived from remote sensing imagery showed that the total area of forest in the upper and middle reaches was 247,660 ha in 2005, but by 2008,
Populus euphratica forest in the lower reaches had declined to 101,489 ha [
13]. The oasis desertification and degeneration of
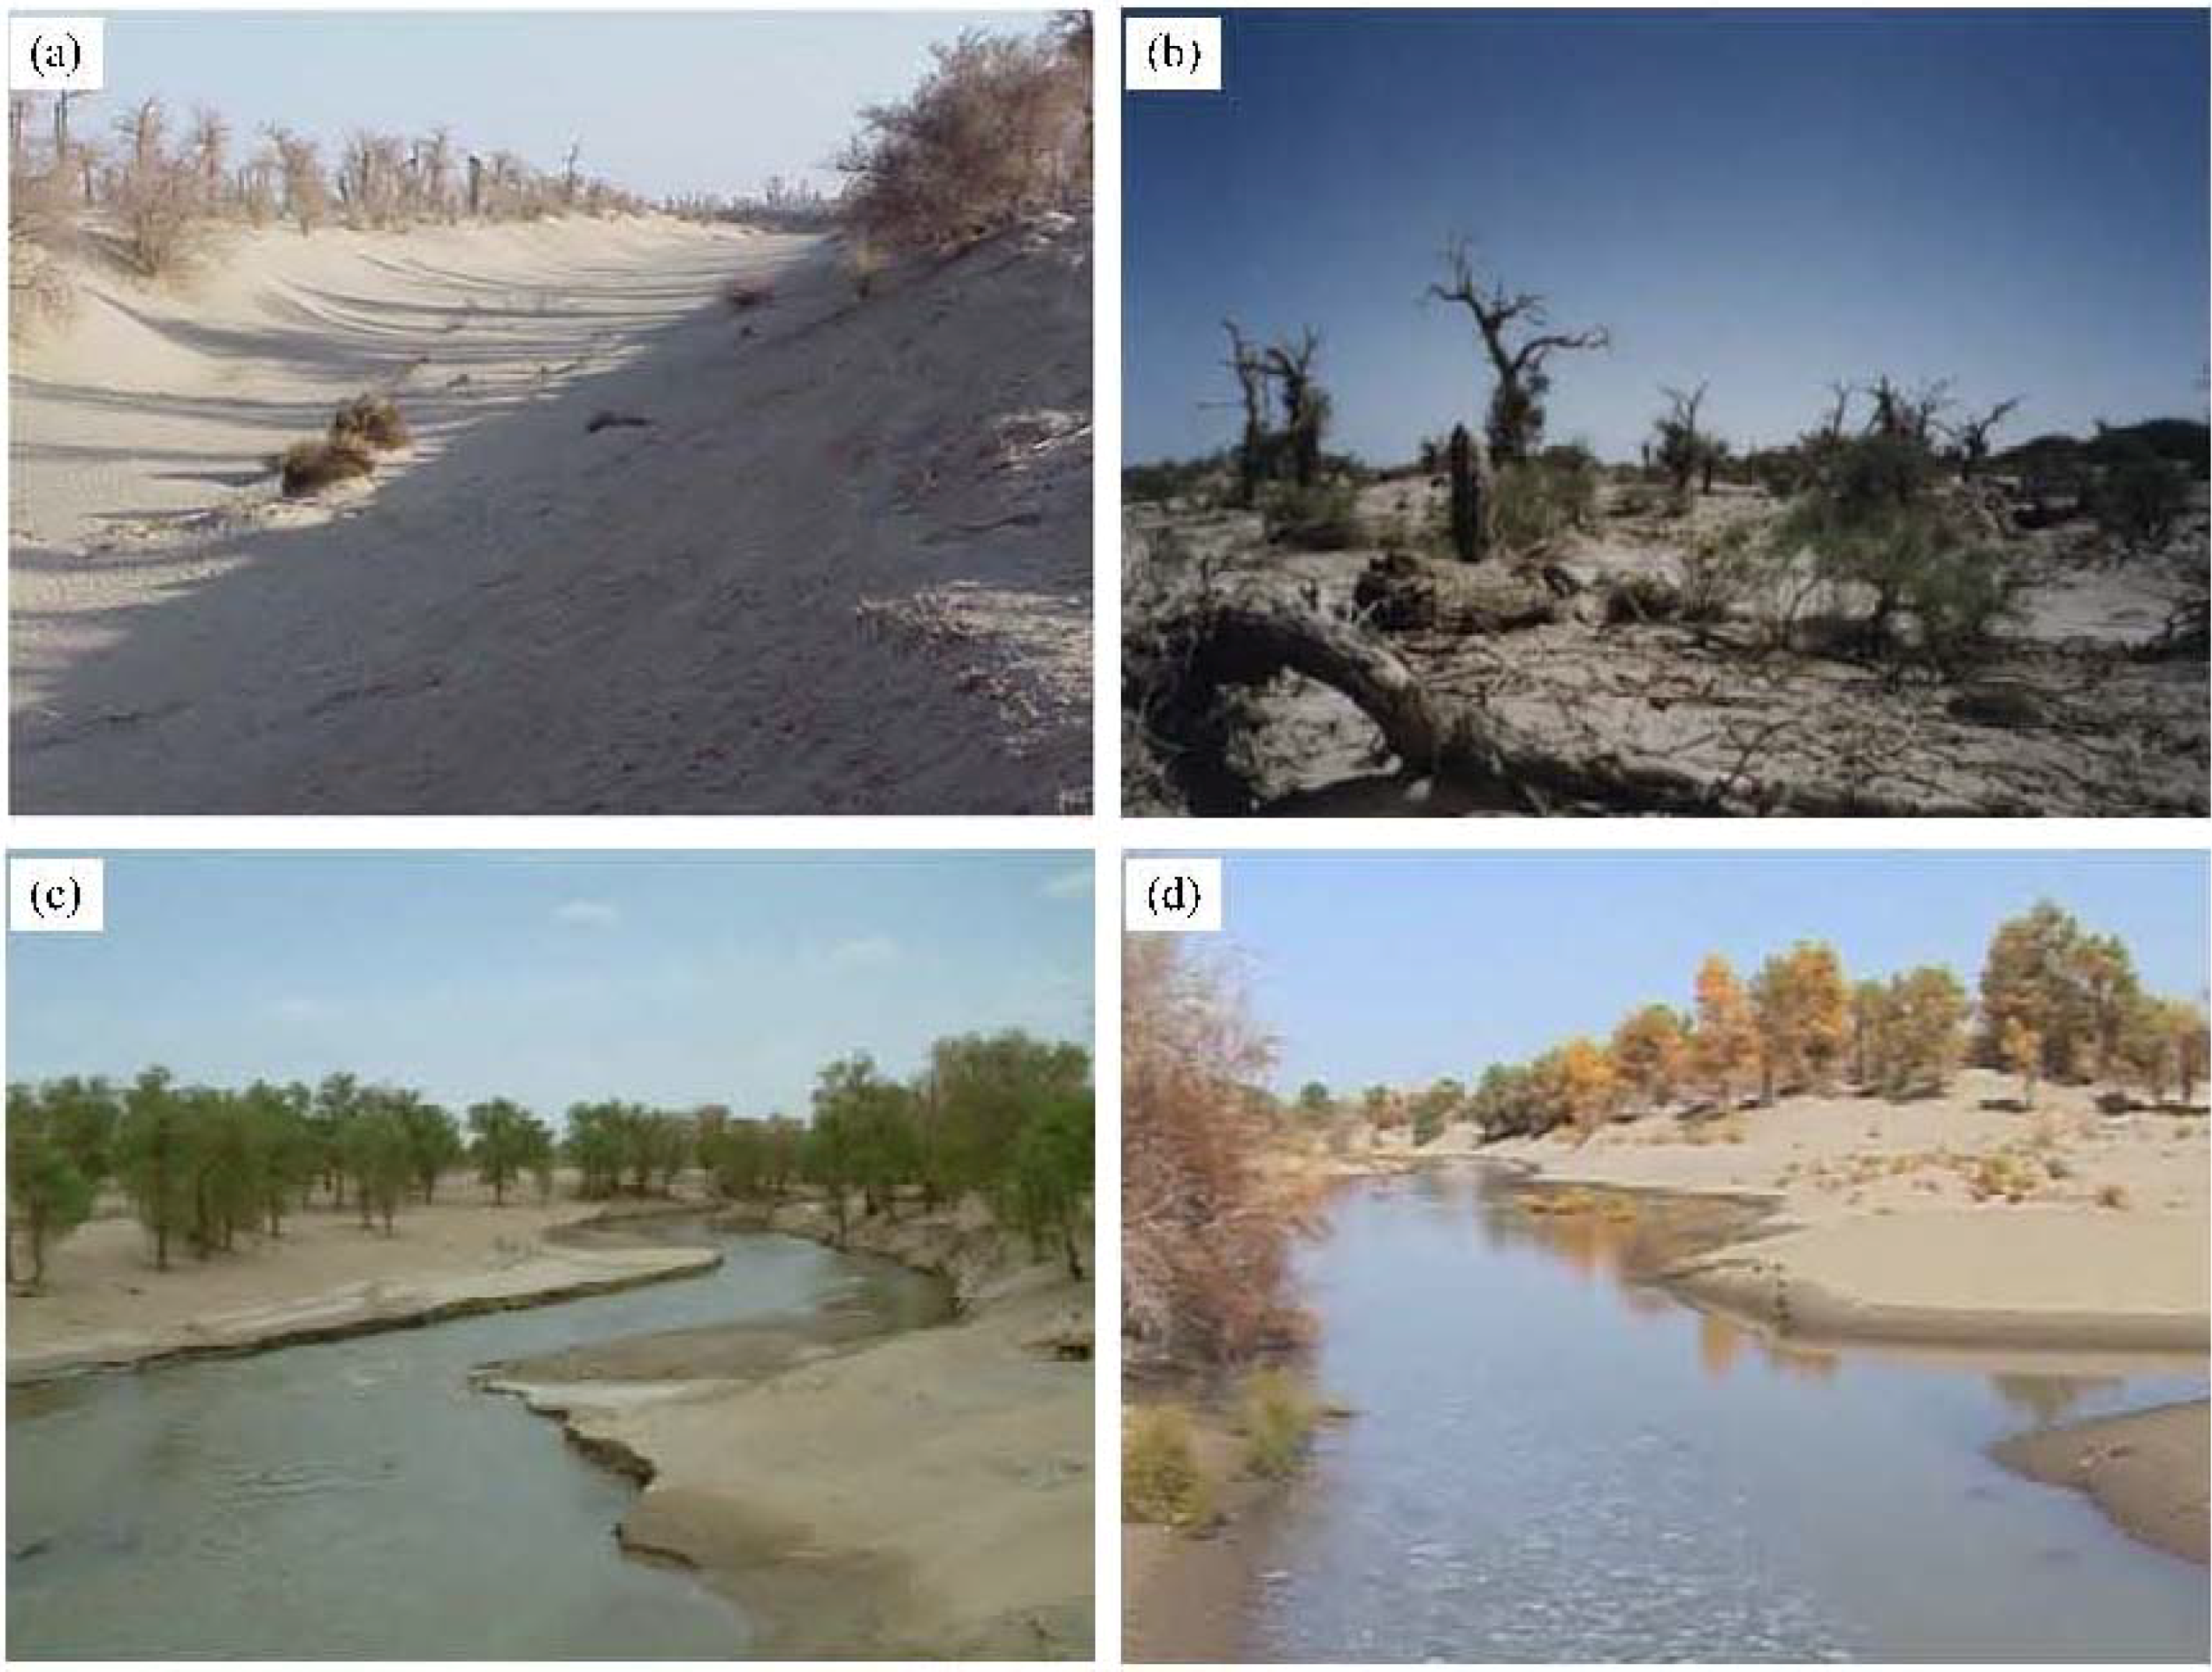
Populus euphratica trees before EWCP are shown in
Figure 1a,b, and the environmental changes after EWCP are shown in
Figure 1c,d. There is an urgent need to model the spatial pattern of
Populus euphratica forest change and to analyze its driving forces.
The response to the EWCP in the lower Tarim River has been widely investigated by experts in hydrology [
14,
15], groundwater dynamics [
16,
17], geochemistry [
18], ecology [
19,
20] and water resource management [
21,
22,
23]. There is a general consensus that the EWCP has been effective at restoring
Populus euphratica forests in the lower reaches of the Tarim River [
20,
24]. However, others say that EWCP has caused a decline in riparian communities under certain circumstances, such as decreased vegetation coverage along the watercourse influenced by the water changes [
25] and the decreased area of the natural vegetation in the vertical direction of the river [
12]. Huang and Pang [
16] concluded that the long-term stability of the ecosystem cannot be achieved by the current water diversion scheme in the EWCP. Further long-term investigation about the spatial pattern of forest change is needed to support the monitoring and conservation of the regional ecological environment. Nevertheless, specific information about
Populus euphratica forest with respect to spatial distribution after the EWCP is still missing. Large collections of remote sensing imagery have made the analysis of long-term change detection possible [
26,
27,
28], so in this study, using satellite imagery, we focused on the spatial pattern of
Populus euphratica forest change as affected by the EWCP.
Figure 1.
(a) Oasis desertification and natural vegetation decline in the lower Tarim River before the ecological water conveyance project (EWCP); (b) degenerated Populus euphratica trees; (c) water conveyance in summer (June, 2010); (d) water conveyance in autumn (October, 2010).
Figure 1.
(a) Oasis desertification and natural vegetation decline in the lower Tarim River before the ecological water conveyance project (EWCP); (b) degenerated Populus euphratica trees; (c) water conveyance in summer (June, 2010); (d) water conveyance in autumn (October, 2010).
The aim of this study was to quantify the spatial pattern of Populus euphratica forest change as affected by the water conveyance program and to analyze the change trajectory by using remote sensing imagery. Two spatial analysis methods were utilized in order to represent the forest change, namely: bi-temporal change detection and temporal trajectory analysis. The former is used for detecting the presence or absence of changes, while the latter is used to measure and evaluate the trajectory of forest change. In this study, we focused on the spatial pattern change of forests and on the driving forces behind it. The relationship between forest change and water conveyance was analyzed by correlation analysis. The reasons for the forest change were summarized after the field investigations in order to provide a reference for the on-going EWCP.
2. Materials and Methodology
2.1. Study Area
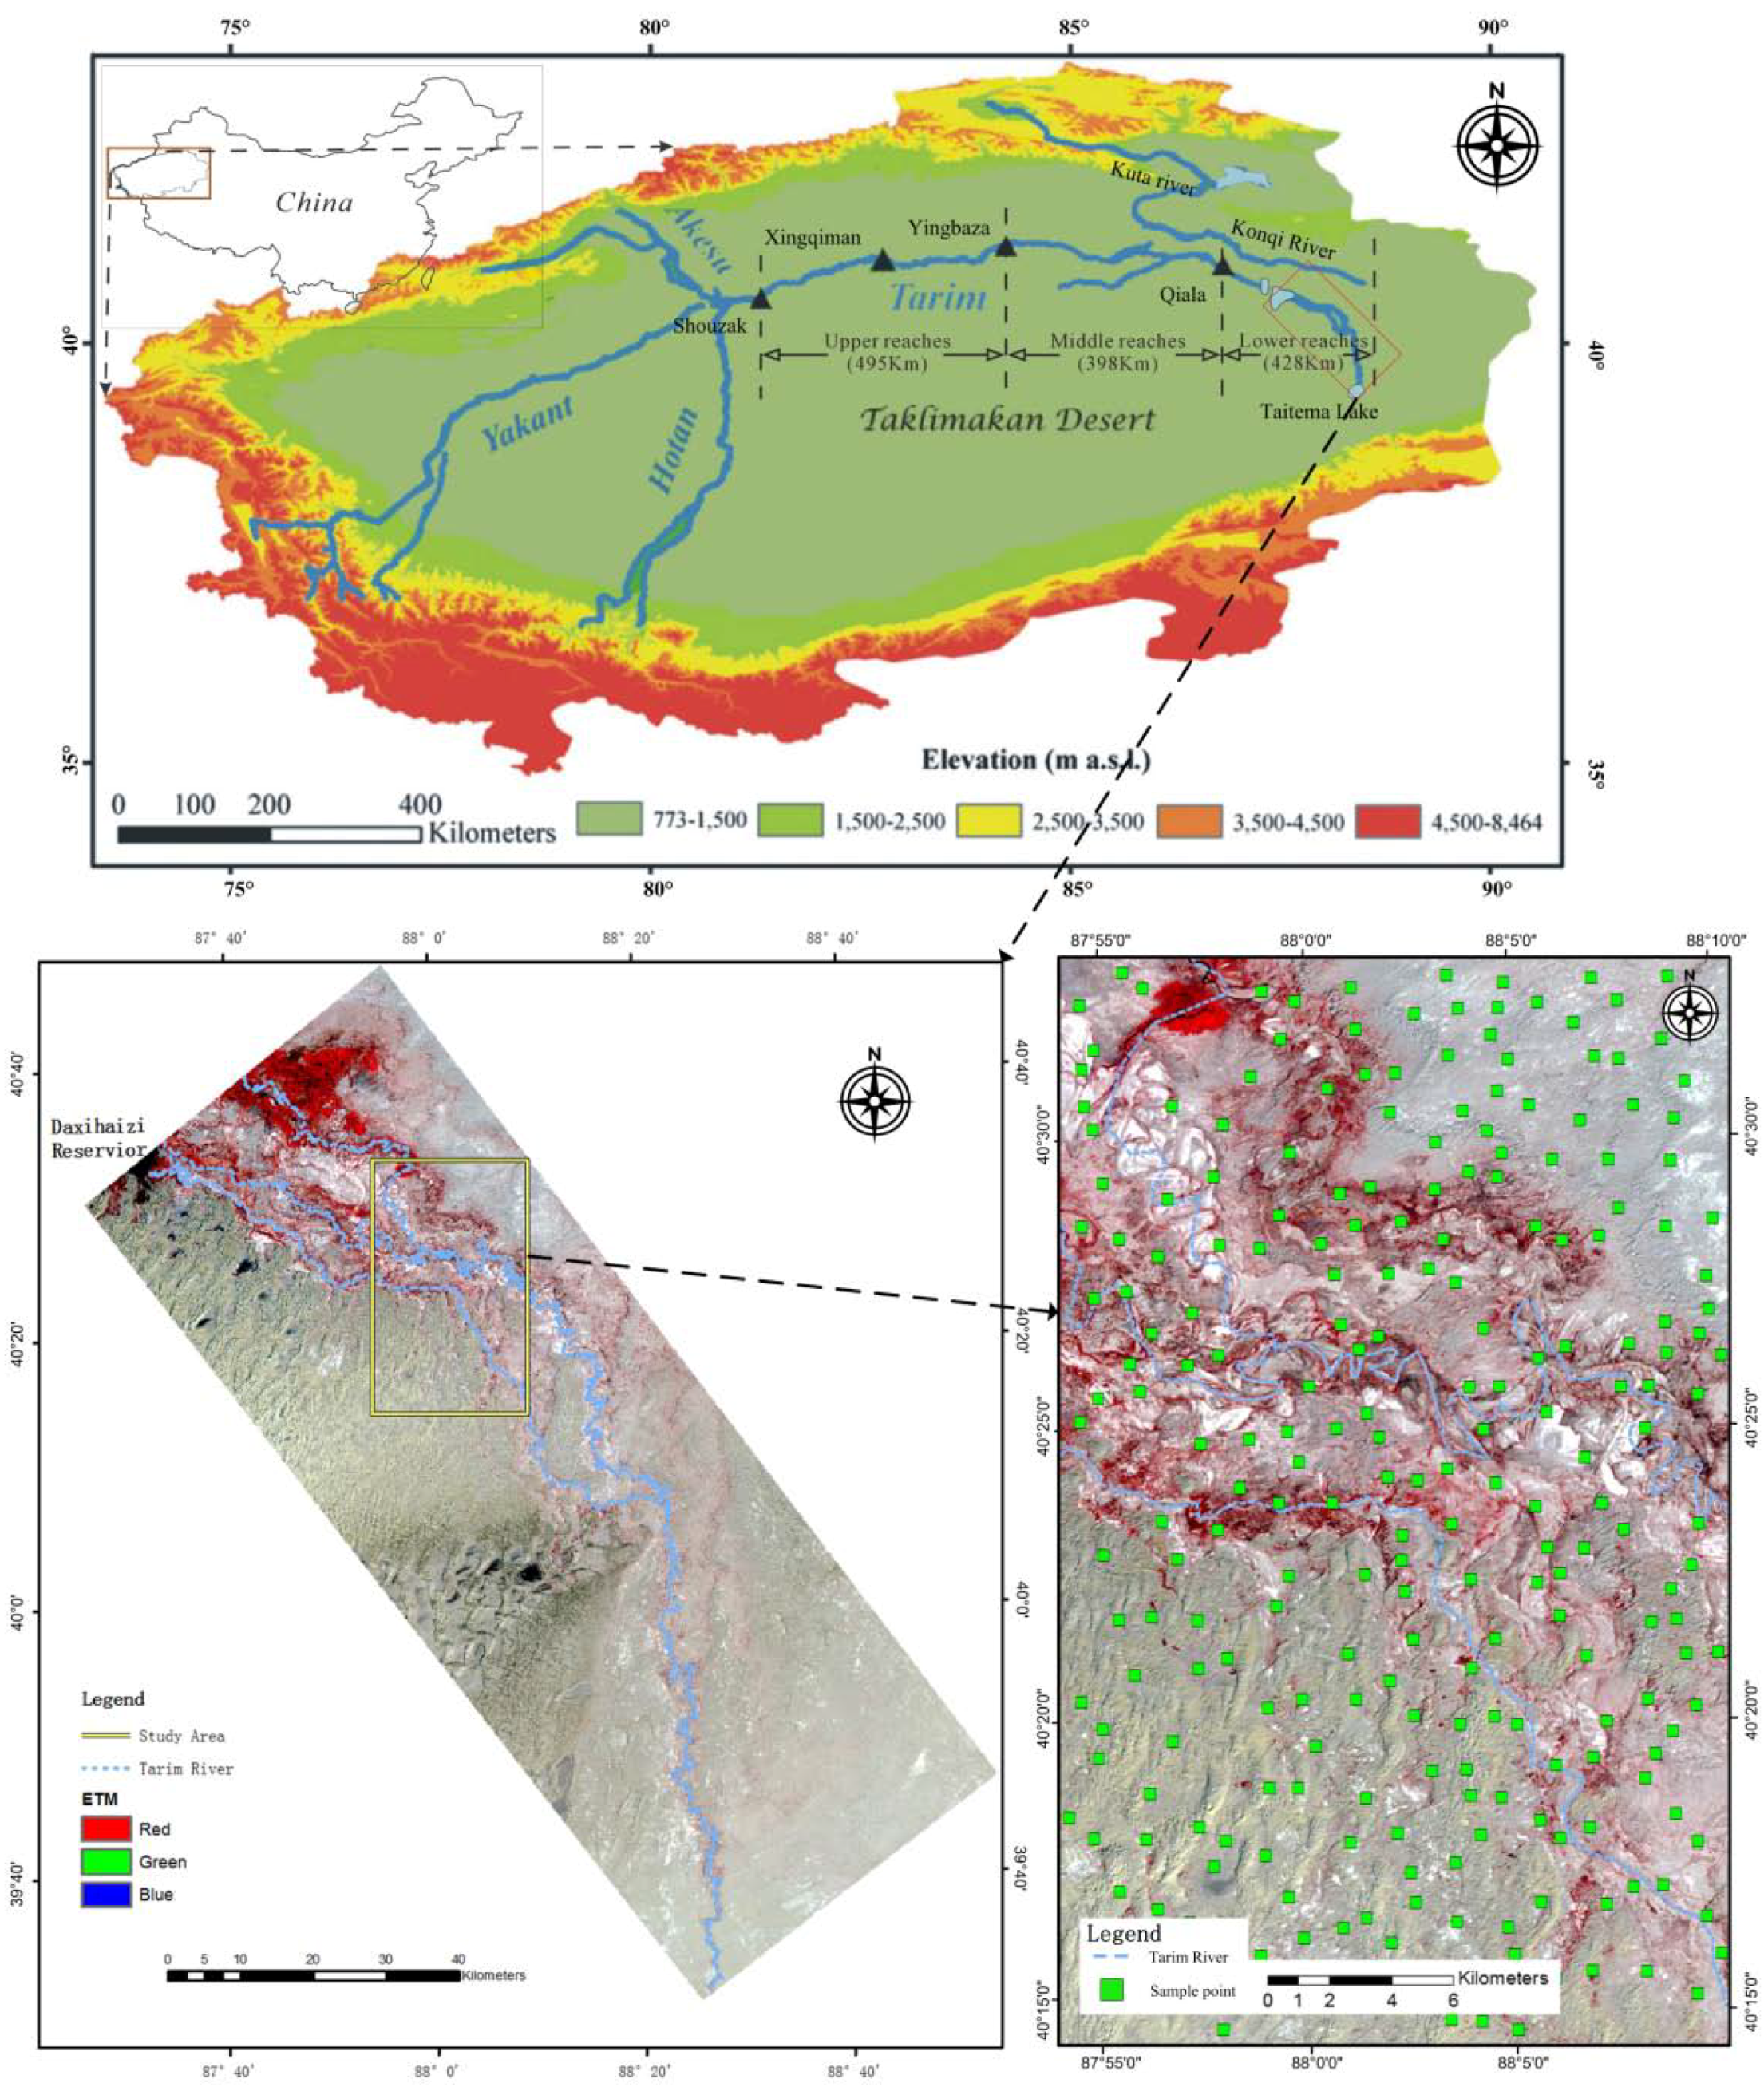
The study area is located in the lower reach of the Tarim River. The Tarim River Basin is seated in the hinterland of the Eurasian continent with annual precipitation ranging from 17 to 42 mm and an annual potential evaporation of more than 2000 mm [
29]. The main part of the Tarim River is 1321 km long, running from Shouzak to Taitema Lake. The lower reach is 428 km long and stretches from Qiala to Taitema Lake (
Figure 2). The Tarim River Basin is an independent closed hydro system,
i.e., a purely dissipative inland river. The flow direction of the main river is from west to east. The river channel migrates southward, due to the piedmont slope in the southern Tianshan Mountain, and northward, because of the movement of sand dunes in the Taklimakan Desert. Thus, an expansive alluvial plain has formed in this region. The study area covered an area of 24,700 ha and was located 50 km away from the Daxihaizi Reservoir (
Figure 2).
Figure 2.
Location map of the study area. The upper figure shows the drainage area of the Tarim River. The Tarim river basin has three tributary rivers: the Akesu River (year-round), the Hotan River (during the flood season) and the Yakant River (during the heavy flood season). The lower figure on the left is a Landsat ETM+ image (pseudo-colored image after the combination of bands 2, 3 and 4) from 2009. The lower figure on the right shows the study area and the location of 248 sample points.
Since 1972, a 321 km long stretch of water in the lower Tarim River has been intercepted, due to the building of the Daxihaizi Reservoir. The Konqi River has acted as the beginning of the downstream water conveyance to the lower Tarim River through the canal in Kuta River since 1976 (
Figure 2). In 2000, the EWCP, as a part of an integrated water resource management plan, was implemented in order to conduct a series of intermittent water deliveries from the Daxihaizi Reservoir to Taitema Lake. The delivered water flows along the modified river channel to nourish riparian communities by river overflow flooding [
30]. Twelve water deliveries transported 3.476 × 10
9 m
3 of water to the lower reach between 2000 and 2011 (
Table 1). The project aims to better schedule and manage the water resources in the upper reach to ensure a sufficient water supply to reach the ecosystems to preserve the lower reach. In dry years, the volume of delivered water was not enough because of agricultural irrigation in the upper and middle reaches. The water did not arrive at the terminal Taitema Lake, 358 km away from the Daxihaizi Reservoir. During the 12 watering events, the shortest watering distance in the EWCP was 106 km from the reservoir, which coincided with the study area.
Table 1.
Statistics for the 12 intermittent water deliveries to the lower Tarim River, in which the watering distances represent the longest distance along the river channel that the water travelled.
Table 1.
Statistics for the 12 intermittent water deliveries to the lower Tarim River, in which the watering distances represent the longest distance along the river channel that the water travelled.
| Code | Starting time | Ending time | Water volume (×106 m3) | Watering distances (km) |
|---|
| 1 | 14 May 2000 | 12 July 2000 | 99 | 106 |
| 2 | 3 November 2000 | 5 February 2001 | 227 | 174 |
| 3 | 1 April 2001 | 18 November 2001 | 382 | 310 |
| 4 | 20 July 2002 | 10 November 2002 | 331 | 358 |
| 5 | 1 March 2003 | 3 November 2003 | 625 | 358 |
| 6 | 20 April 2004 | 22 June 2004 | 102 | 358 |
| 7 | 20 April 2005 | 2 November 2005 | 282 | 358 |
| 8 | 25 September 2006 | 21 November 2006 | 233 | 358 |
| 9 | 15 September 2007 | 19 October 2007 | 44 | 106 |
| 10 | 5 December 2009 | 31 December 2009 | 60 | 144 |
| 11 | 20 June 2010 | 15 October 2010 | 265 | 358 |
| 12 | 10 November 2010 | 1 October 2011 | 823 | 358 |
2.2. Data Pre-Processing and Forest Detection
Forest monitoring based on remote sensing data has demonstrated potential as a means to detect, identify and map out the changes in forest cover [
31]. Remote sensing data can obtain ecological data that cannot be collected through field-based methods [
32]. In this study, the 10-year changes and the 5-year changes were investigated so that changes over a relatively short period could be detected. For this reason, twelve satellite images were collected. Four Landsat TM and eight Landsat ETM+ images were acquired from July to September in 1999, 2004 and 2009. Details about the remote sensing data are shown in
Table 2.
Date pre-processing is necessary to remove data acquisition errors and noise [
33]. In arid areas, the application of the remote sensing imagery approach to spatial information produces high quality results due to the use of cloud-free images [
34]. The RS images were almost cloud-free, except for one image with more than 10% cloud coverage (
Table 2). Radiometric calibration coefficient formulas provided by Chander,
et al. [
35] were used to transform the digital numbers into reflectance. The Normalized Difference Vegetation Index (NDVI) is known as a proxy for terrestrial vegetation and is defined by a normalized ratio of red and near-infrared reflectance [
36]. It has often been used as the dependent variable for the establishment of change trajectories [
37,
38,
39]. The NDVI is sensitive in low to moderate dense vegetation, such as in semi-arid and arid areas [
40], so it was utilized in this study for forest change detection.
Table 2.
Landsat satellite data used in this study. The study area is located in the overlapping part of the satellite images in path 141 and 142.
Table 2.
Landsat satellite data used in this study. The study area is located in the overlapping part of the satellite images in path 141 and 142.
| Satellite | Sensor | Path/row | Cloud cover (%) | Sun elevation (degrees) | Sun azimuth (degrees) | Acquisition date |
|---|
| Landsat 7 | ETM+ | 142/32 | 1.49 | 63.8726 | 125.4425 | 6 July 1999 |
| Landsat 7 | ETM+ | 142/32 | 8.88 | 56.8835 | 136.4934 | 16 August 1999 |
| Landsat 7 | ETM+ | 142/32 | 0 | 55.1448 | 139.2369 | 23 August 1999 |
| Landsat 7 | ETM+ | 142/32 | 21.0 | 45.5756 | 151.1020 | 14 September 1999 |
| Landsat 7 | ETM+ | 142/32 | 0 | 63.4286 | 123.6797 | 3 July 2004 |
| Landsat 7 | ETM+ | 141/32 | 0 | 60.0456 | 128.4550 | 28 July 2004 |
| Landsat 7 | ETM+ | 141/32 | 2.0 | 56.7950 | 134.0078 | 13 August 2004 |
| Landsat 7 | ETM+ | 142/32 | 0 | 50.7843 | 143.0371 | 5 September 2004 |
| Landsat 5 | TM | 142/32 | 0 | 60.6547 | 127.6688 | 25 July 2009 |
| Landsat 5 | TM | 142/32 | 0 | 57.6041 | 133.0496 | 10 August 2009 |
| Landsat 5 | TM | 142/32 | 0 | 53.7646 | 139.3801 | 26 August 2009 |
| Landsat 5 | TM | 142/32 | 1.23 | 49.2109 | 145.6848 | 11 September 2009 |
Populus euphratica forests flourish with a maximum growth period between July and September [
41,
42]. There were few other plant species in the study area apart from
Populus euphratica and
Tamarix ramosissima [
9]. The NDVI for
Populus euphratica is more likely to be recorded by remote sensors, because its spectral-radiometric features in the recording wave band are far stronger than
Tamarix ramosissima. Therefore, the NDVI for
Populus euphratica was chosen as the objective data and the rest of the NDVI value for the area was considered to belong to it. Summer NDVI (SNDVI) was defined as the average monthly composite between July and August [
36]. The SNDVI, as it will be referred to here, requires that a series of multi-temporal geo-referenced satellite data be processed into NDVI images. This was generated using the maximum value composite (MVC) method. The maximum value in the remote sensing imageries was chosen and the pixels with an SNDVI < 0.1 were marked as non-vegetated areas [
36,
43]. On a pixel-by-pixel basis, the highest NDVI value in a period was retained for each pixel location, and a final MVC image was produced after all pixels had been evaluated. Because of the definition of remote sensing functions by the MVC method, atmospheric correction in this study was an indirect correction, which is less dependent on the aerosol loading [
44].
A multi-spectral 4-m resolution IKONOS image, acquired in July, 2009, was used for image-to-image registration and SNDVI accuracy assessment and assisted the field investigation. It was geometrically rectified using 32 ground control points (GCPs) selected from a 1:10,000 topographic map. The GCPs corresponded to intersections and river channels turns in the topographic map. TM and TEM+ images with 30-m resolution were geometrically registered using image-to-image registration to the master IKONOS image. The registration error was limited to within 10% of one pixel.
There is a serious problem for researchers when they collect reference data for accuracy assessment on multi-temporal images, because simultaneous ground-truth data over a long period of time are very difficult to find [
45]. In this study, an IKONOS image in 2009 was selected as the reference date for the accuracy assessment of SNDVI in 2009. The assessment analyzed whether there was a non-vegetated area when SNDVI < 0.1 and
vice versa. In the study area, 248 sample points were generated by the stratified random sampling scheme (
Figure 2), in which the minimum allowed distance was 1 km between any two randomly placed points. For the other two historical SNDVI images, we used 115 desert located sample points for accuracy assessment, because there was little vegetation coverage change, and an obvious SNDVI < 0.1 could be reliably detected by image interpretation.
2.3. Bi-Temporal Change Detection
Bi-temporal change detection is widely applied in the detection of LUCC when high-temporal resolution images are not available [
46]. Most change detection methods belong to the bi-temporal change detection approach, including: vegetation index differencing [
47], multi-temporal composite and classification [
48] and change vector analysis [
49]. Bi-temporal change detection in this study belonged to the detection of vegetation index differencing category, in which the SNDVI data in the first single-date imagery was subtracted from the second,
i.e., a bi-temporal comparison of SNDVI (
SNDVI) between two peak-green summer images in Equation (1). This method was used to detect change in the forest cover.
The bi-temporal comparison results were then merged into a change trend map using Equation (2), where
g(
xij) denotes the three states of change trend: increased, unchanged and decreased. The pixels with −0.1 ≤
xij ≤ 0.1 were marked as unchanged regions (
g(
xij) = 0) [
36]. Increased and decreased regions were more and less than 0.1, respectively.
The local indicator of spatial association (LISA), also called the local Moran statistic, is an indicator that achieves two objectives. It detects significant patterns of local spatial association and acts as a diagnostic for the stability of global statistics [
50]. As shown in detail by Anselin [
50], for the LISA,
Ii for observation
i is expressed as Equation (3):
where
Sx2 is the variance,
ωij is the spatial weight value and the summation over
j is such that only neighboring values around
i are included. A positive
Ii value (positive spatial association) provides information on high values (above the mean) associated with high neighboring values or low values (below the mean) associated with low neighboring values. Correspondingly, a negative
Ii value (negative spatial association) provides information on high values associated with low neighboring values or low values associated with high neighboring values [
51,
52].
There were two primary purposes for LISA analysis: (1) developing the merge rule for SNDVI (xij); and (2) dividing the similar districts of classification results. For the first purpose, LISA was applied to develop the merge rule needed to display the result of changes in Populus euphratica forest. Using the LISA merge rule, i.e., a series of overlay analyses of SNDVI between RS images in 1999, 2004 and 2009, the change region in the different periods was extracted into one map. Neighboring pixels were continuously merged into a patch, until all LISA values in all patches turned negative in the final classification result. In other words, if the patches represented homogeneous change states in a neighborhood, they were merged together for the same spatial aggregation feature. The process of data integration was not accomplished until the LISA values in every patch were all negative. For the second purpose, the final classification result was divided into similar districts by two LISA features, i.e., high values surrounded by low values and low values surrounded by high values. In the study area, the divided districts had two states of vegetation change: increased area surrounded by decreased area and decreased area surrounded by increased area. To detect the driving force that formed these districts, we undertook three field investigations between 2010 and 2012. Field visits and local management agency interviews were conducted in the divided vegetation-change districts.
2.4. Temporal Trajectory Analysis
Temporal trajectory analysis is employed to conduct multi-temporal change detection over longer time intervals and uses remote sensing images. It facilitates the detection of ecosystem modifications [
46] and is widely used to compute anomalies in the time profiles of vegetation indices [
53,
54,
55]. In this study, vegetation index differencing for two time intervals,
i.e., 1999–2004 and 2004–2009, were studied by temporal trajectory analysis.
The three vegetation change states (increased, decreased and unchanged) were constrained in a time-to-space conversion matrix by permutations and combinations of the three change states that were generated during bi-temporal change detection (
Table 3). Given that n is the number of time periods, there are 3
n−1 combinations of change conditions in the resulting map. For this study, the number
n is three. All classified images were integrated in GIS (ArcGIS 10.1), and the classification results were then merged into each of the nine groups shown in
Table 3.
2.5. Correlation Analysis
Correlation analysis was applied in order to reveal the relationship between water conveyance and Populus euphratica forest change area. According to the cumulatively transferred water volume in the corresponding time periods, the 12 intermittent water deliveries from 1999 to 2009 were split into nine parts. Therefore, there were nine points about the watering event in the time series. Change detection for forest in the temporal trajectory analysis focused on two time intervals: 1999–2004 and 2004–2009. To be consistent with water conveyance in the time series, linear interpolation of the forest change area was employed to fill vacancies in the time series and to carry out the correlation analysis. Significance tests of the correlation coefficients and coefficients of variation were performed to make quantitative decisions about the relationship between the water volume and forest area change.
Table 3.
Permutations and combinations of three vegetation-change states for two time intervals, in which “+” represents the increased state, “−”represents the decreased state and “0”represents the unchanged state.
Table 3.
Permutations and combinations of three vegetation-change states for two time intervals, in which “+” represents the increased state, “−”represents the decreased state and “0”represents the unchanged state.
| Code | 1999–2004 | 2004–2009 |
|---|
| 1 | + | + |
| 2 | + | 0 |
| 3 | 0 | + |
| 4 | 0 | 0 |
| 5 | − | + |
| 6 | + | − |
| 7 | 0 | − |
| 8 | − | 0 |
| 9 | − | − |
3. Results
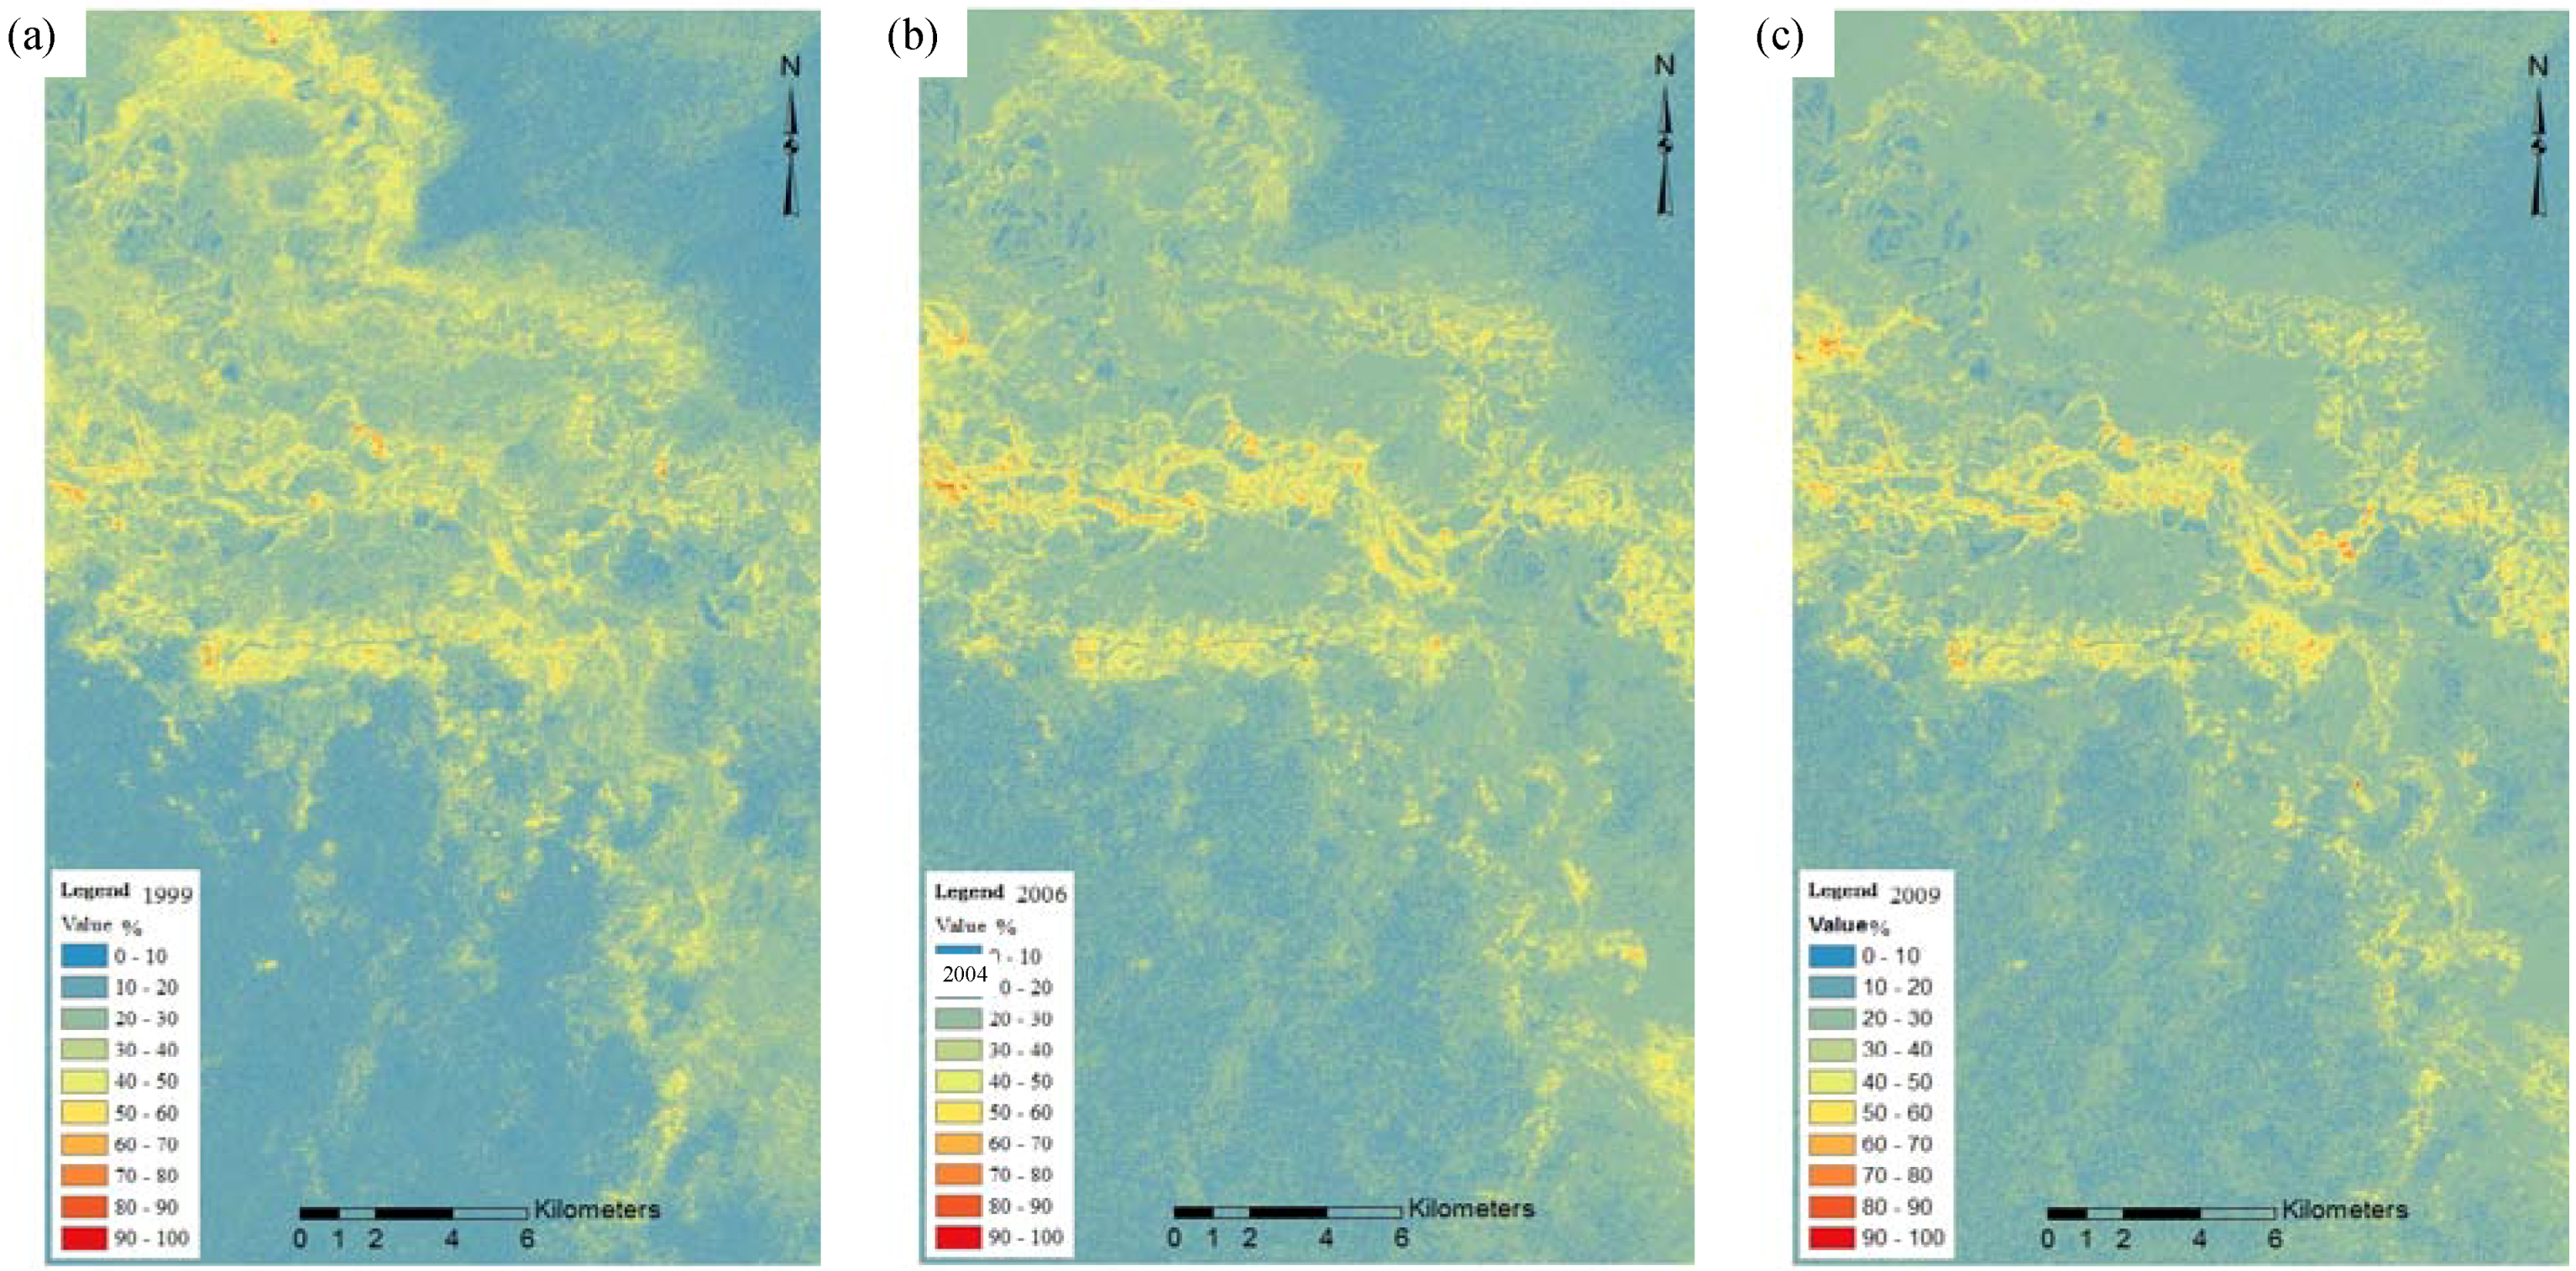
3.1. Summer NDVI
The SNDVI values for the three time periods, to a certain extent, displayed the coverage of
Populus euphratica forests before and after the EWCP. The spatial distribution of the SNDVI value is shown in
Figure 3. The overall accuracy of the SNDVI classifications in 1999, 2004 and 2009 were 90.32%, 92.74% and 85.47%, respectively. Higher SNDVI values were concentrated in the northern region in 1999 and 2004 than in 2009. Higher values began to appear in the middle region in 2009 and this showed that the spatial distribution of
Populus euphratica forest had shrunk from the north to the middle watercourse, even though water conveyance had occurred.
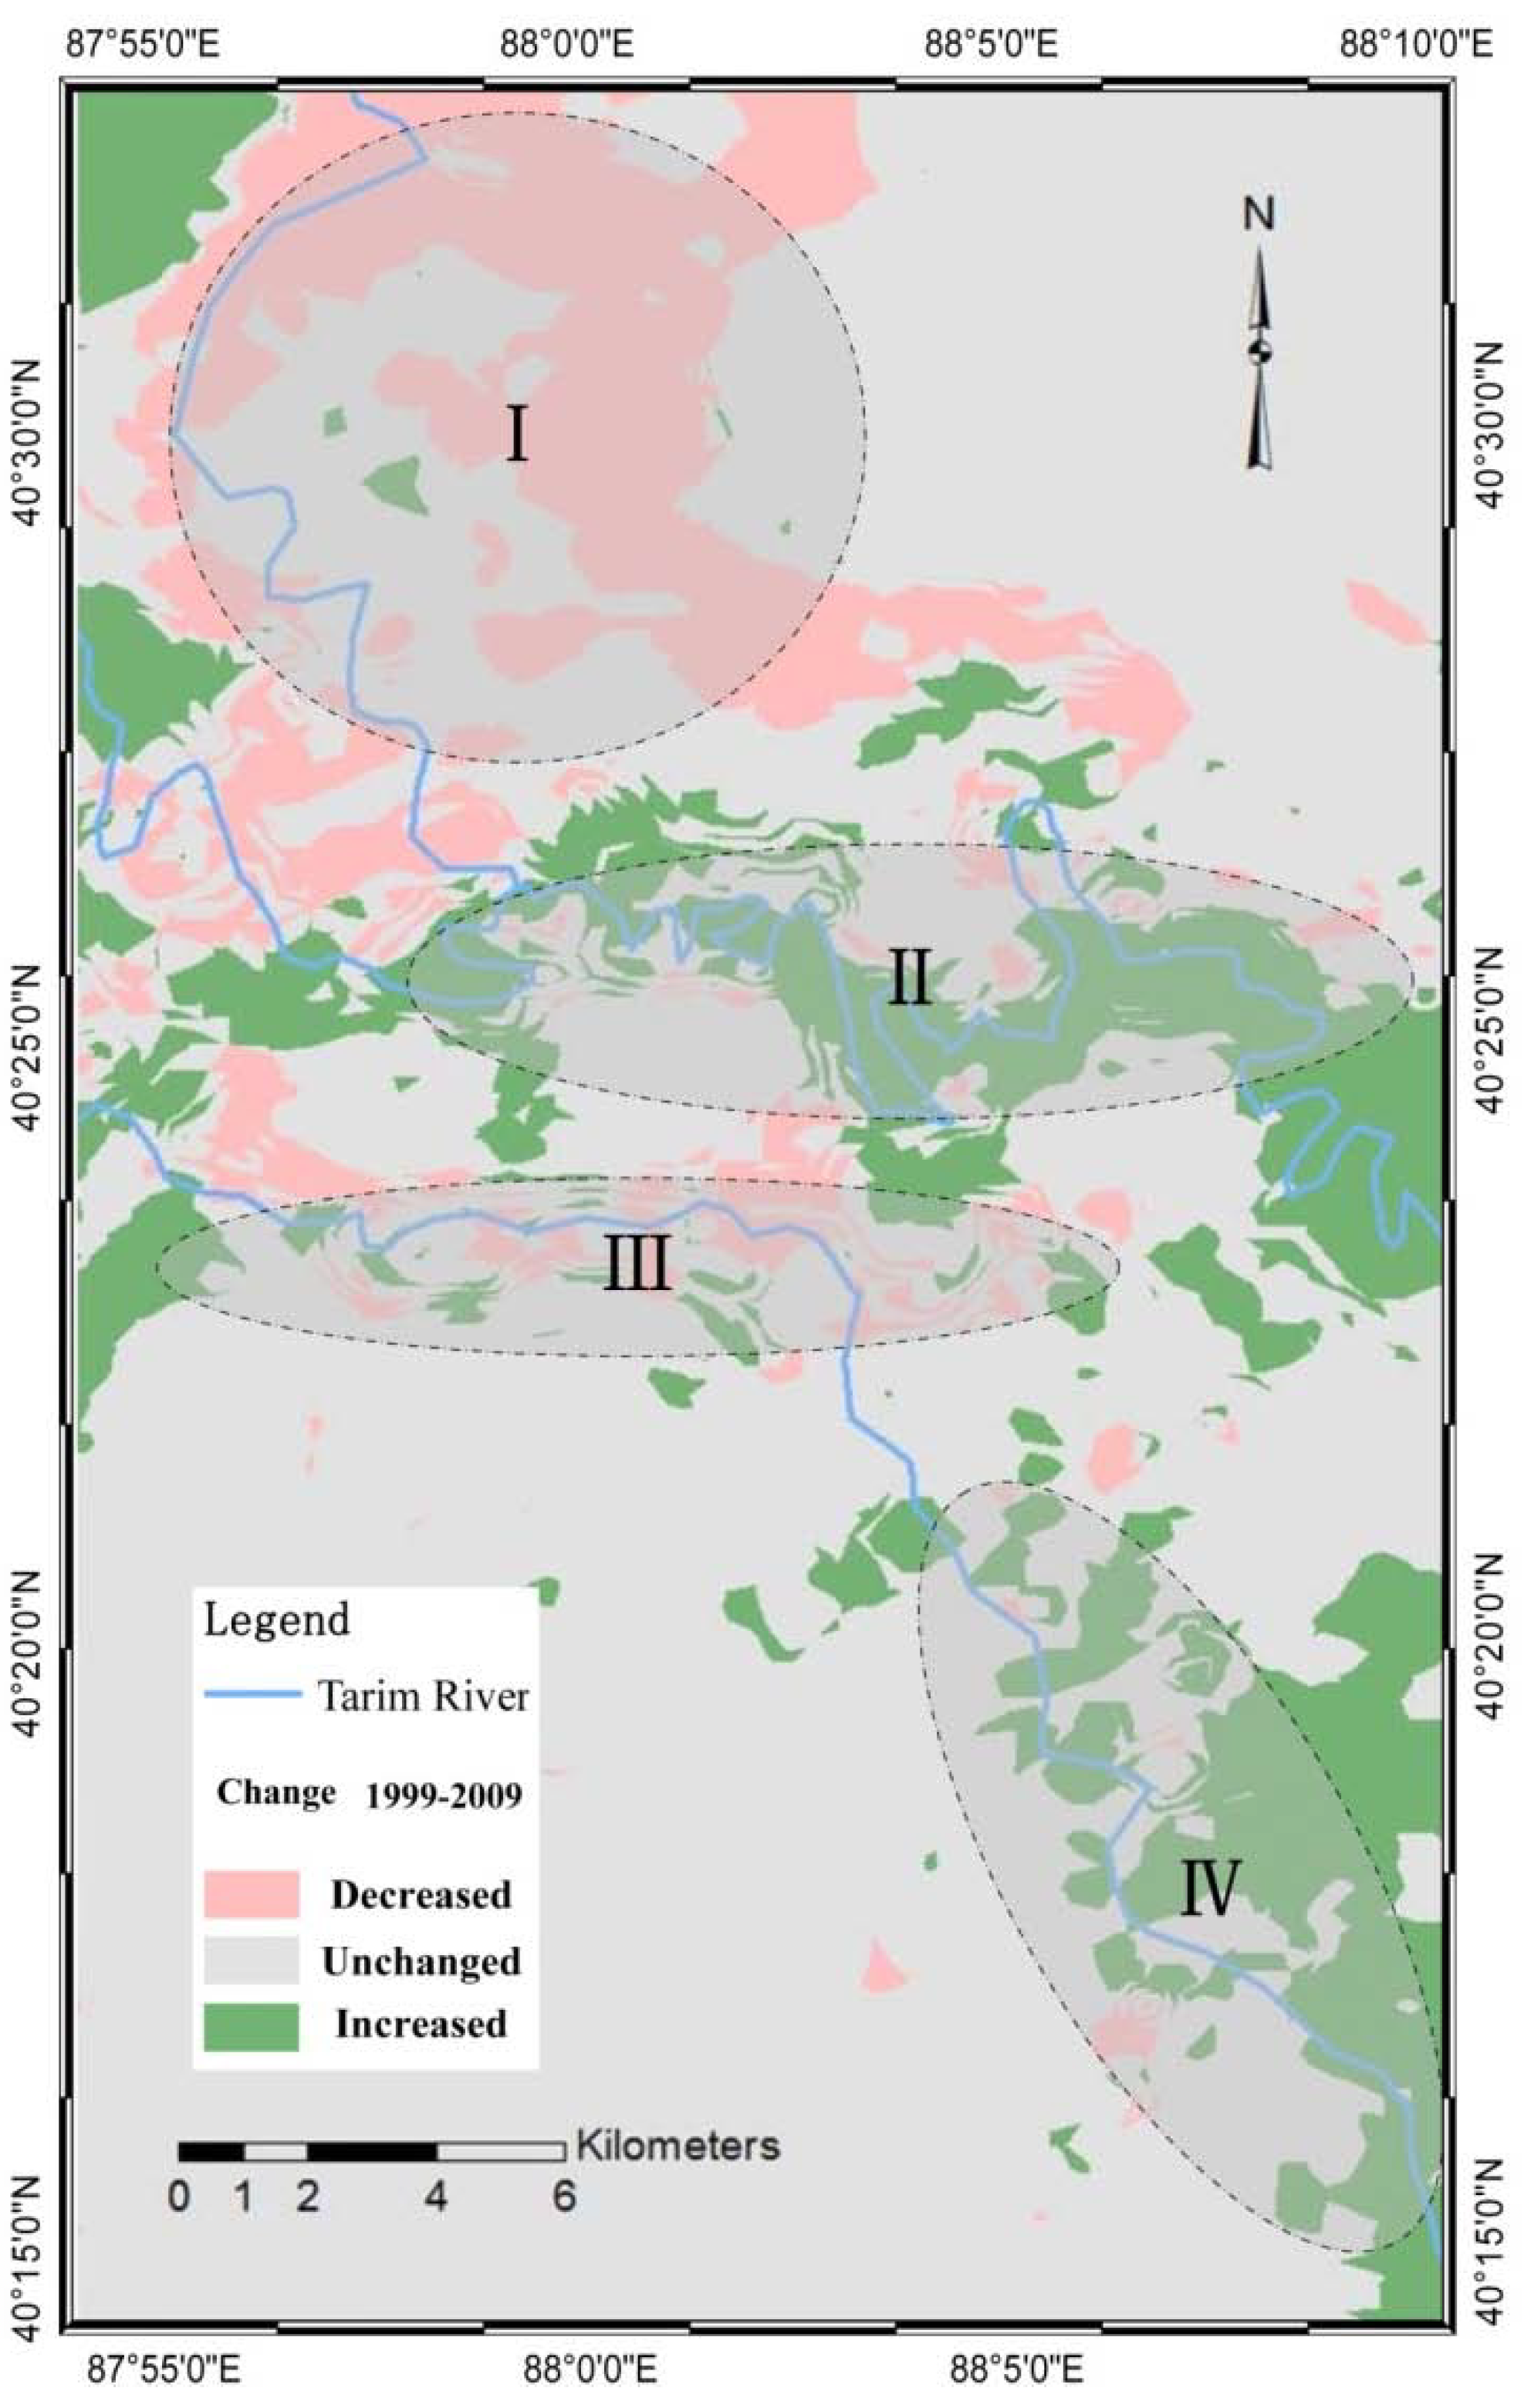
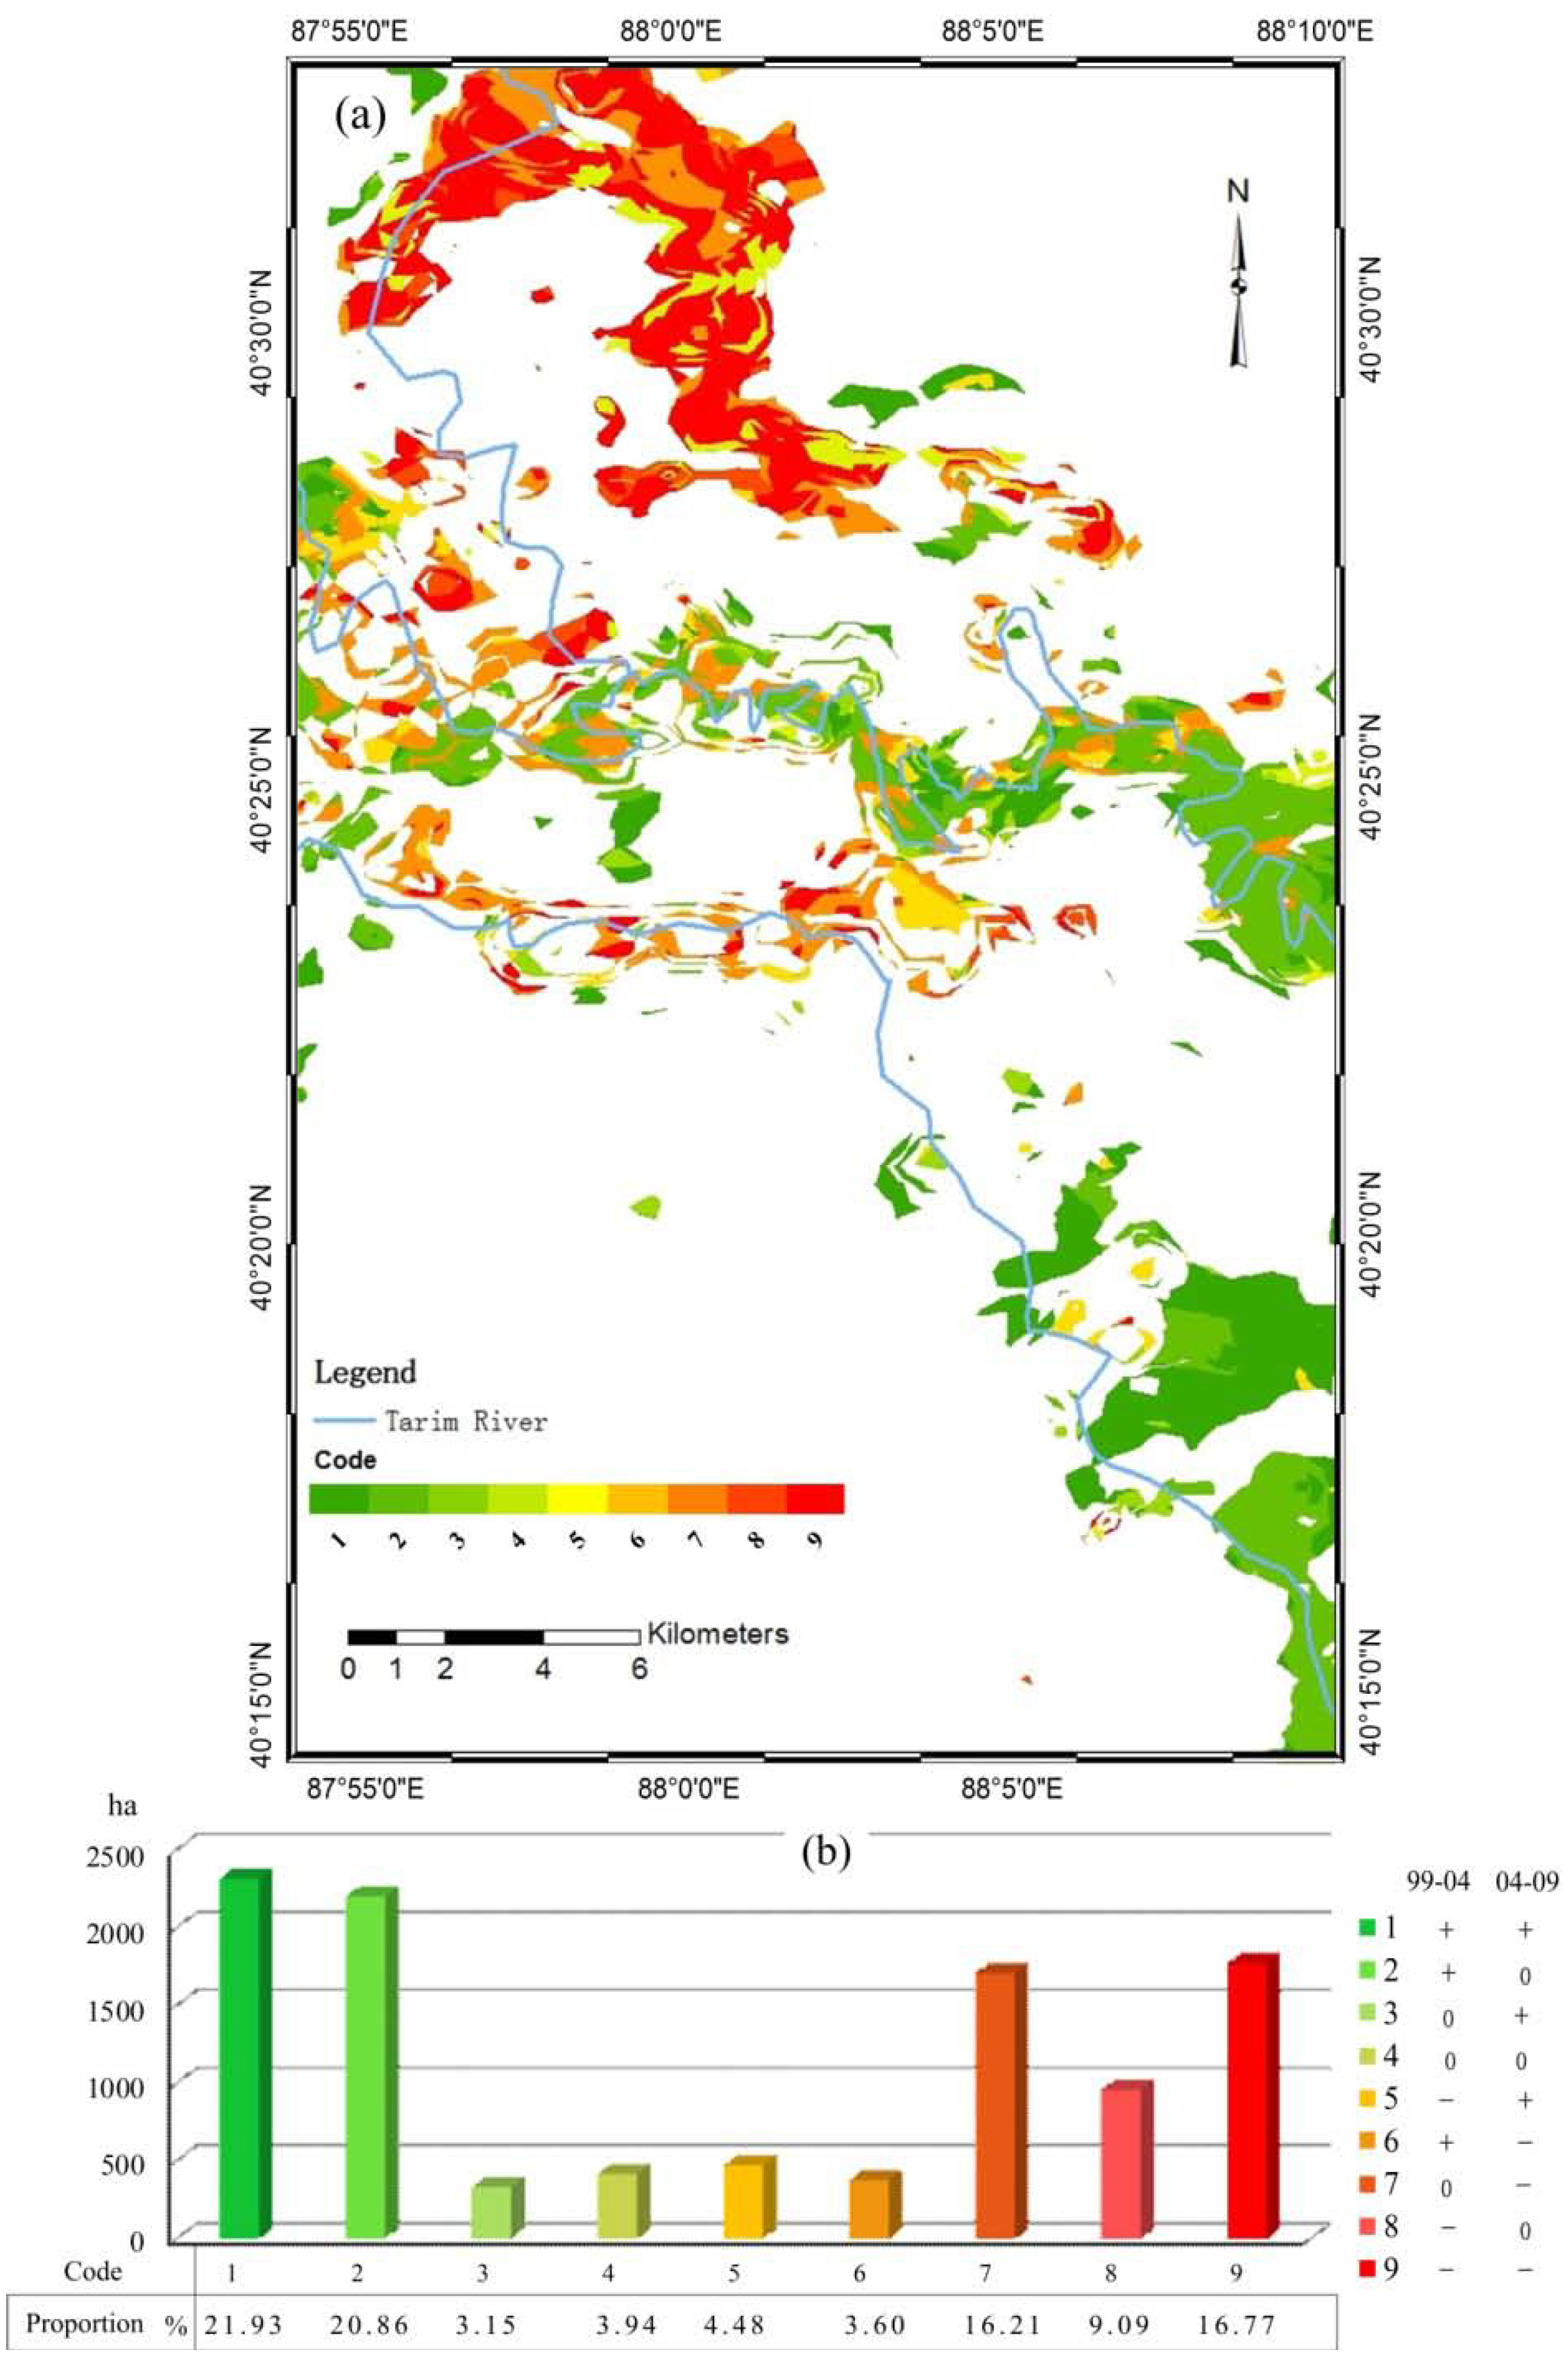
3.2. Spatial Pattern of Forest Change
Two types of districts are shown by the two LISA features in
Figure 4. Districts with significant LISA are shaded in the grey circle for the corresponding access measures. The change region in the different time periods is also illustrated on the map. The red, green and grey parts denote the reduced (subtractive SNDVI < −0.1), increased (subtractive SNDVI > 0.1) and unchanged regions (subtractive −0.1 ≤ SNDVI ≤ 0.1), respectively. The results showed that the LIAS merge rule provided a visual presentation of forest change in map form.
In the Districts I and III, high SNDVI values were associated with low neighboring values, whereas low SNDVI values were associated with high neighboring values in the Districts II and IV. For 1999–2009 period, there was a decreasing trend in the northern area and an increasing trend in the southern area, and the region with both conditions was concentrated in the middle.
Figure 3.
Populus euphratica forest condition of the SNDVI in (a) 1999; (b) 2004; and (c) 2009.
Figure 3.
Populus euphratica forest condition of the SNDVI in (a) 1999; (b) 2004; and (c) 2009.
Figure 4.
Forest change from 1999 to 2009 and its division into districts.
Figure 4.
Forest change from 1999 to 2009 and its division into districts.
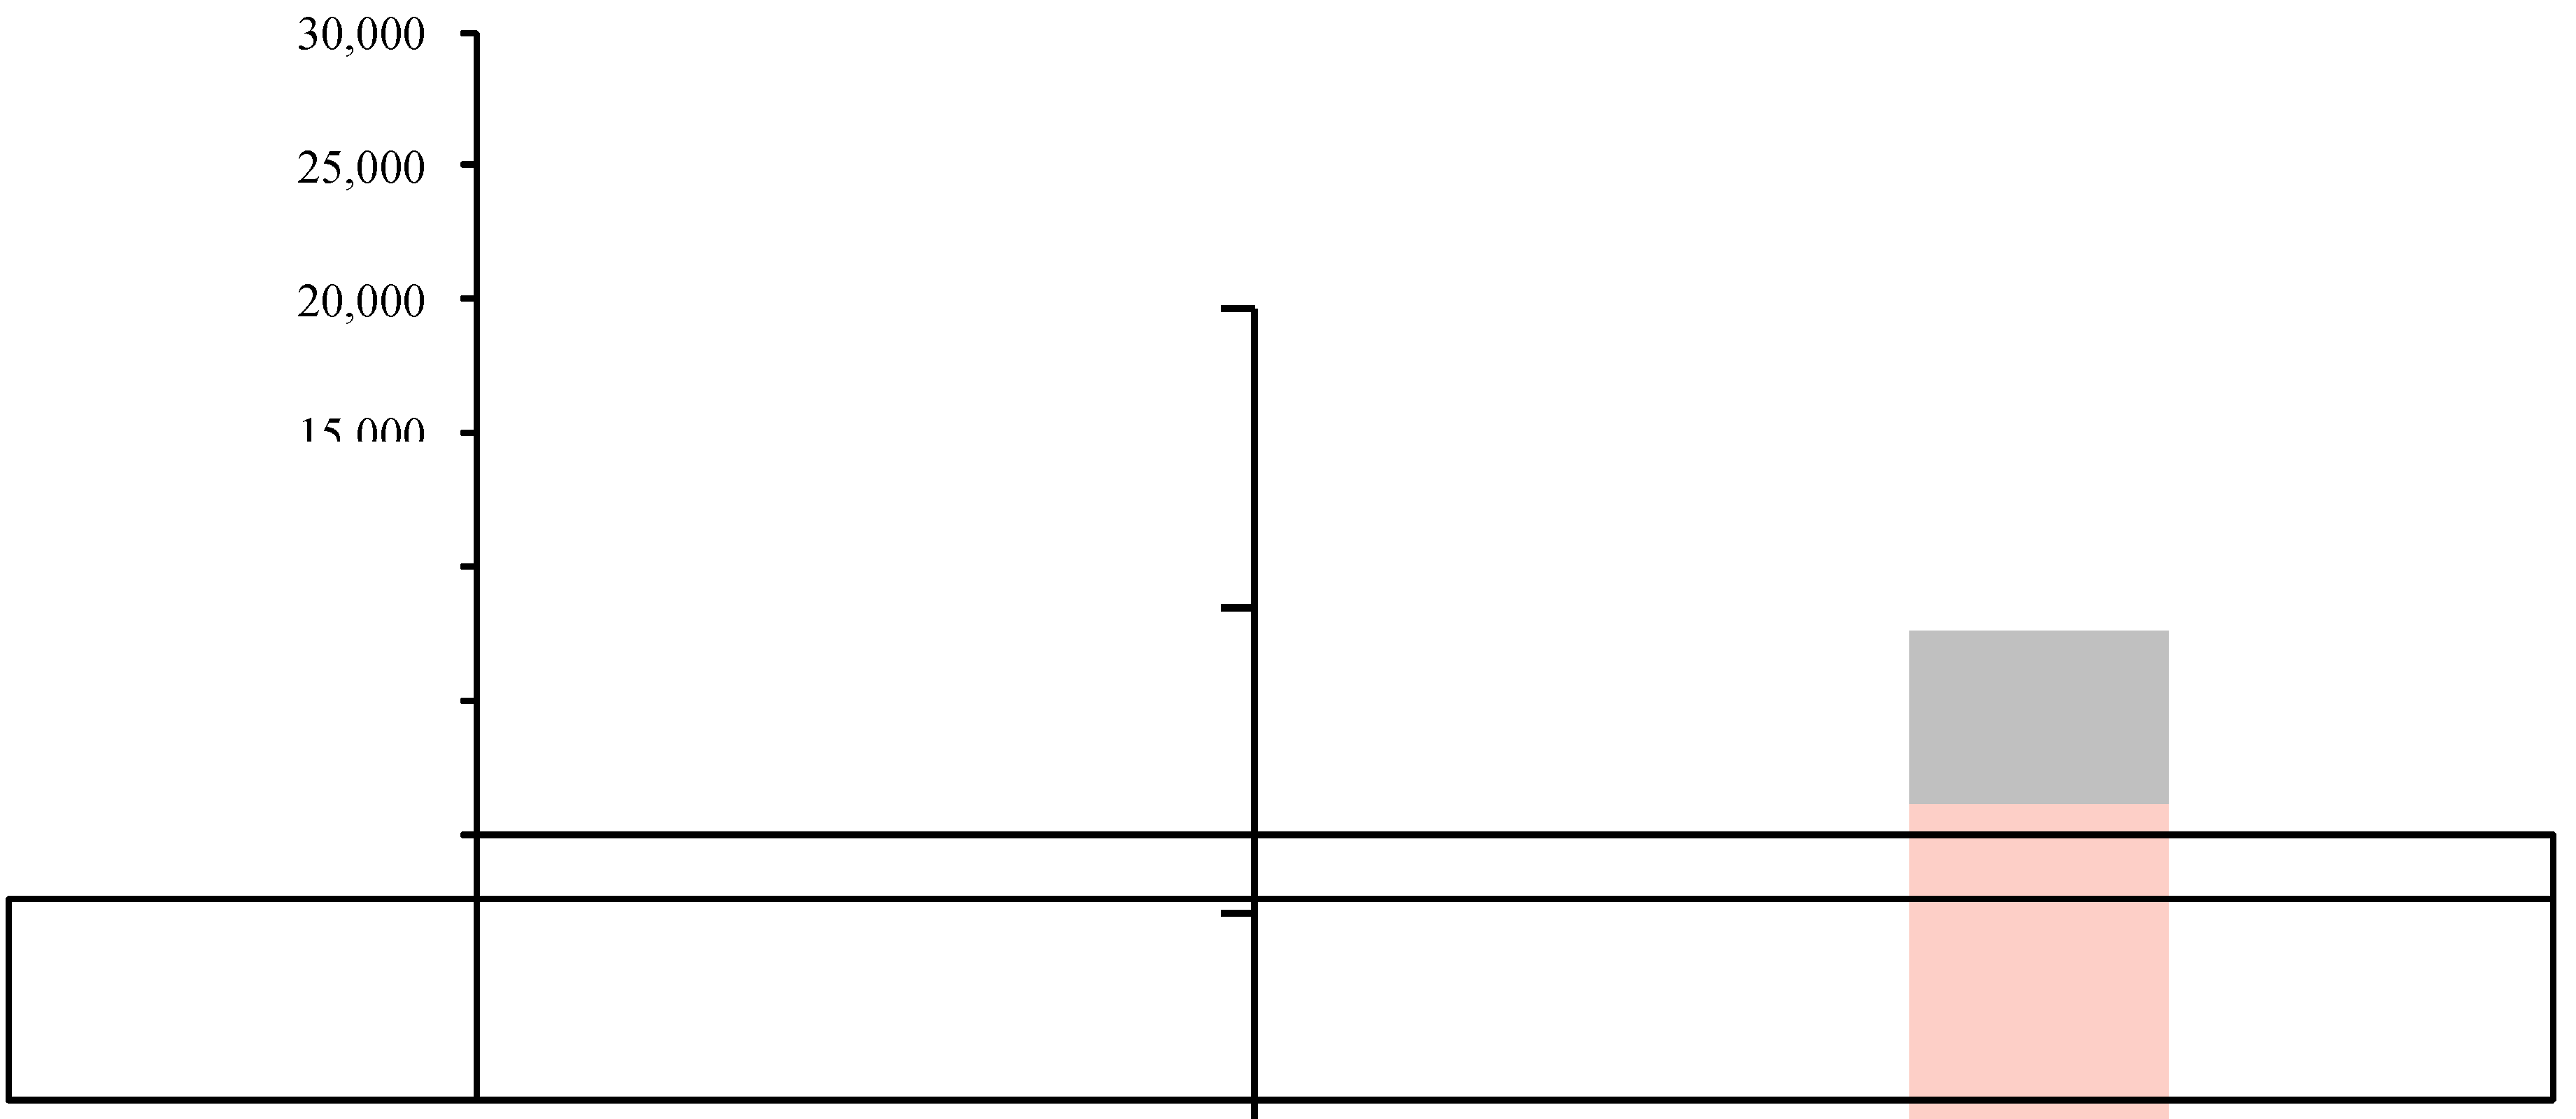
The statistical data for the different vegetation states for 1999, 2004 and 2009 were calculated to display the area over which the
Populus euphratica forest condition has changed (
Figure 5). The decreased and increased change areas in 1999–2004 represented a total of 21,797.97 ha, about twice the amount recorded (11,755.83 ha) between 2004 and 2009. In contrast, between 1999 and 2004, there were more increased areas than decreased ones, but the opposite occurred between 2004 and 2009,
i.e., there were more decreased areas than increased areas.
Figure 5.
Statistical data for Populus euphratica forest patch changes over the different time periods.
Figure 5.
Statistical data for Populus euphratica forest patch changes over the different time periods.
Between 1999 and 2004, the annual change ratios for the decreased and increased areas were 8.31% and 9.34%, respectively, which were both more than the 5.60% and 3.92%, respectively, found in 2004–2009. In 1999–2009, the aggregate increased areas were 8373.86 ha and the decreased areas were 9579.94 ha in size. Between 1999 and 2009, the majority of the forest-change area was dominated by the decreased and unchanged states, which implies a decline in the area of Populus euphratica forests.
3.3. Forest Change Trajectories
All the change trajectories that were combined by a time-to-space conversion matrix in
Table 2 are illustrated in
Figure 6a, which include nine permutations and combinations of the three change states. Therefore, the expression of
Populus euphratica forests change in the time series was converted to diverse codes in the spatial series in order to show the migratory trajectory of
Populus euphratica forests affected by watering between 1999 and 2009.
There were three categories that can be distinguished by a change trend in all nine codes, i.e.: (1) an increasing trend in Codes 1, 2 and 3 (++, +0, 0+); (2) a decreasing trend in Codes 7,8 and 9 (0−, −0, −−); and (3) a dual trend in Codes 4, 5 and 6 (00, +−, −+). The decreasing Codes 7, 8 and 9 were concentrated in the northern area, and the increasing Codes 1, 2 and 3 were relatively fragmented. This showed that the decreasing trend for Populus euphratica forests exhibits more clustering than the increasing trend.
The proportion of the total change areas was 3.15%, 3.94%, 4.48% and 3.60% in Codes 3, 4, 5 and 6 (0+, 00, −+, +−), respectively, which all are less than 5% (
Figure 6b). Codes 1, 2, 7, 8 and 9 (++, +0, 0−, −0, −−) denote the major trend in forest change. The total area in Codes 1, 2, 7, 8 and 9 was 15,746 ha, which was approximately ten times larger than the 1832 ha found in Codes 3, 4, 5 and 6. The total area showing an increasing trend in Codes 1, 2 and 3 was 4844.4 ha, which almost equals the total area (4435.8 ha) showing a decreasing trend in Codes 7, 8 and 9. They were both larger than the total area showing a dual trend (1,266.6 ha). The temporal trajectories for forest change showed that the increasing trend area was larger than the decreasing trend area. This was opposite to the results seen in
Section 3.2. The reason for this contradiction was that the dual trend change area in Codes 4, 5 and 6 (00, +−, −+) was not involved in this comparison, which implied that a decreasing trend was more prominent in the dual trend areas.
Figure 6.
(a) Change trajectory for Populus euphratica forests from 1999 to 2009; (b) statistical data for change area and for various codes.
Figure 6.
(a) Change trajectory for Populus euphratica forests from 1999 to 2009; (b) statistical data for change area and for various codes.
4. Discussion
The method used in this study was effective when applied to a mainly single-vegetation-species area. However, when it was used to monitor vegetation change over the entire watershed, more complicated vegetation classification methods were required to detect change, because vegetation change information is not located in a single view of a satellite image. Furthermore, a larger number of observation dates in the time series would make the time-to-space conversion matrix more complicated and increase uncertainty, because of error propagation.
LUCC is a sensitive indicator that echoes the interactions between human activities and the natural environment. Morisette and Khorram [
56] summarized four types of change on spatial entities,
i.e.: (1) becoming a different category; (2) expanding, shrinking or altering shape; (3) shifting position; and (4) fragmenting or coalescing. Causes of the flux can be natural, anthropogenic or a combination of the two [
46]. In order to detect these spatial entities, you need to know that a change has occurred and what its extent, cause and impacts are.
4.1. Evaluation of the EWCP
The EWCP is an intermittent water conveyance program with various time intervals and seasonal variations. The volume of runoff is also different for each watering event. The cumulatively transferred water volume between 1999 and 2009 was 2.325 × 10
9 m
3. This volume was primarily concentrated in the 1999–2004 period, which accounted for 1766 × 10
6 m
3 or 76% of the total water volume (
Table 4). According to the forest change analysis, the majority of changed areas were also concentrated in the 1999–2004 period. However, considering a time lag, the water conveyances during 1999–2004 period also made impact the forest cover change in 2004–2009 period.
Table 4.
Interpolation of change area and cumulatively transferred water volume. Bold numbers denote already existing data. The rest are derived from interpolation.
Table 4.
Interpolation of change area and cumulatively transferred water volume. Bold numbers denote already existing data. The rest are derived from interpolation.
| Years | Increased Areas (ha) | Decreased Areas (ha) | Cumulatively transferred water volume (106 m3) |
|---|
| 1999–2002 | 5,766.22 | 5,132.76 | 708 |
| 1999–2004 | 11,532.44 | 10,265.52 | 1766 |
| 1999–2006 | 13,953.15 | 13,722.73 | 2048 |
| 1999–2009 | 16,373.86 | 17,179.94 | 2325 |
| 2002–2004 | 5,766.22 | 5,132.76 | 1110 |
| 2002–2006 | 8,186.93 | 8,589.97 | 1340 |
| 2002–2009 | 10,607.63 | 12,047.17 | 1617 |
| 2004–2006 | 2,420.71 | 3,457.21 | 384 |
| 2004–2009 | 4,841.41 | 6,914.41 | 661 |
The relationship between forest change and water conveyance was demonstrated by the correlation analysis. The correlation analysis showed that the increased areas were correlated with the cumulatively transferred water volume (correlation coefficient R = 0.98, p-value <0.01 and coefficient of variation 0.0965 < 10%). The decreased areas were also correlated with the cumulatively transferred water volume (correlation coefficient R = 0.94, p-value <0.01 and coefficient of variation 0.1781 < 20%). In both the increased and decreased areas, water conveyance had a continuous impact on the spatial pattern formation, but there was no significant difference between the impact of water conveyance on the increased areas and the decreased areas.
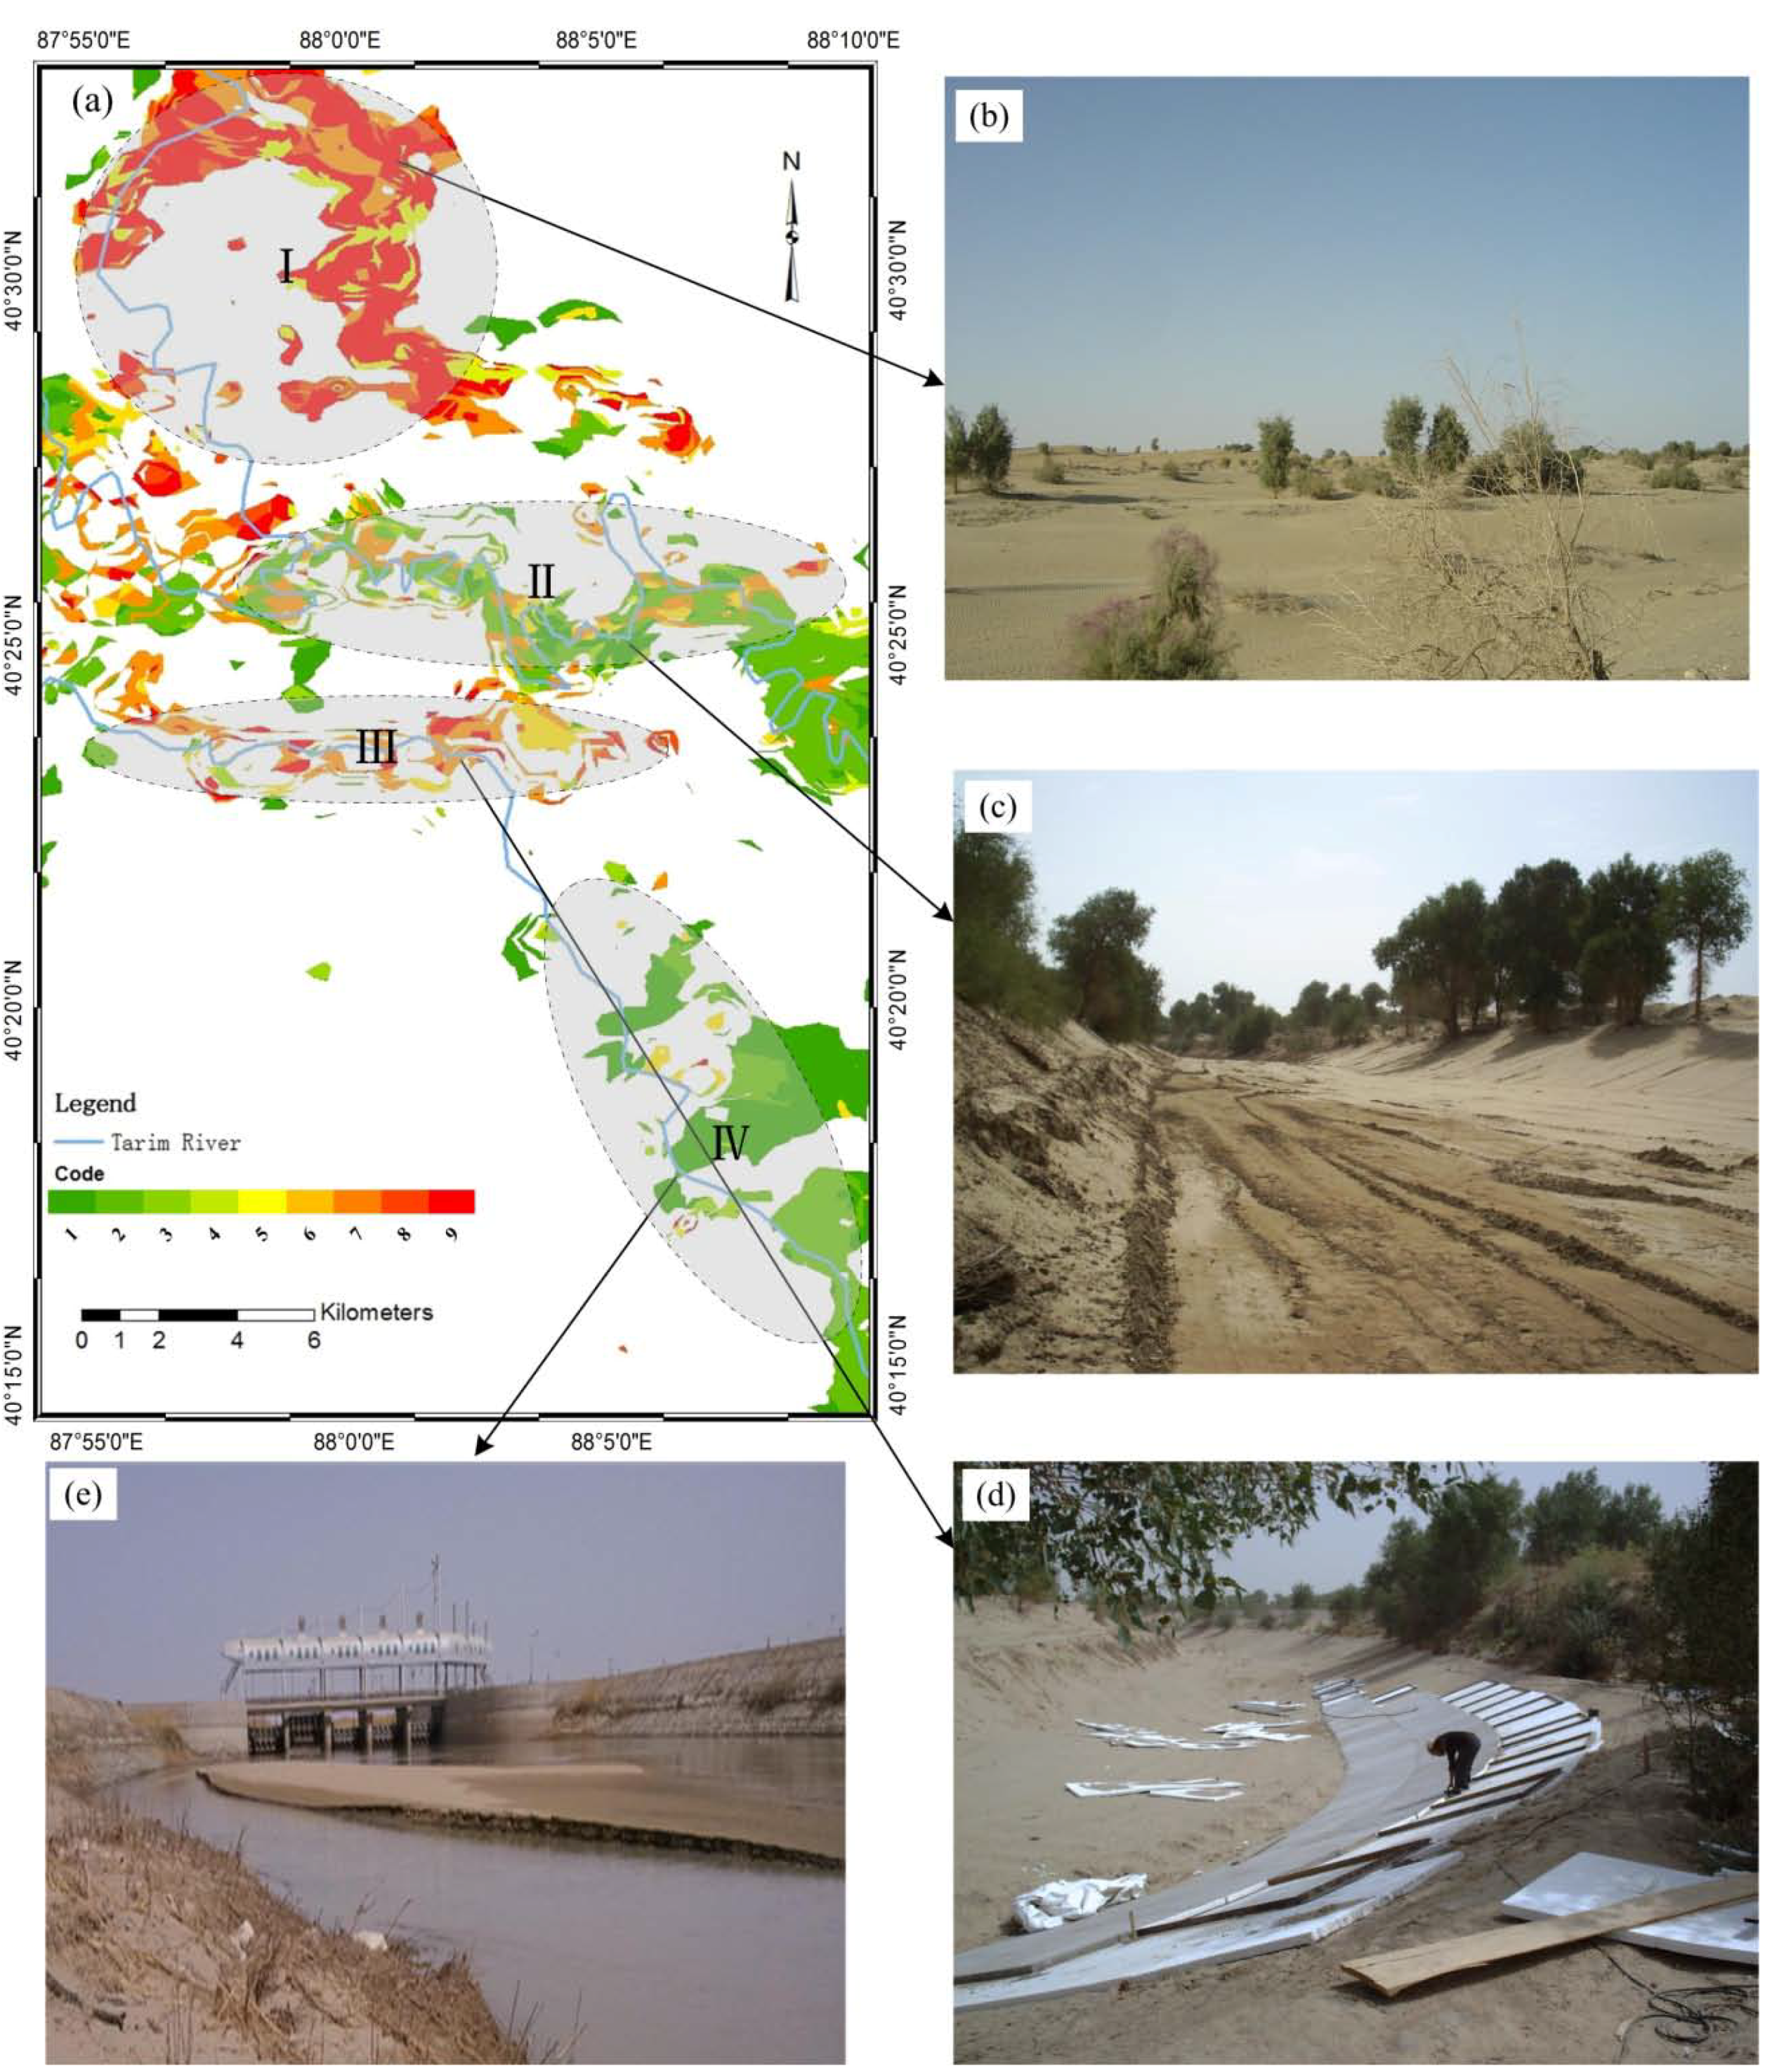
4.2. Field Investigation and Driving Forces
The spatial pattern of the
Populus euphratica forest change was related to the EWCP and other driving forces. Lambin,
et al. [
57] suggested a combination of agent-based systems and narrative perspectives of understanding when approaching place-based research on vegetation cover change. From 2010 to 2012, three field investigations were implemented in two types of districts: Districts I and III and Districts II and IV (
Figure 7a). The principal advantage to dividing districts is that specific range can be used to conduct field investigations.
Based on field investigations and government records for the four districts in the study area, the anthropogenic engineering activities and natural forces were summarized in order to show the driving forces behind the changes. There were multiple anthropogenic engineering activities in each district, but the dominant ones are shown in
Figure 7b–e. The four corresponding anthropogenic activities are: river diversion, converting the river channel from bent to straight, revetment in the riverbank and ecological sluice activity. According to the records, except for the annual river cleanup, there were two primary engineering construction periods between 1999 and 2009: (1) in 2000, before the start of the EWCP, 6.07 km of new water embankment, one regulating sluice, one flood diversion sluice and 635 m of river revetment were constructed; and (2) in 2008, 376.5 m river revetment and partial rebuilding of the water embankment occurred. According to the field survey statistics, the length of dry riverbed in the northern reach (
Figure 7a) is 11.2 km, and supposing the average distance of river overflow flooding is 1.5 km [
30], the area of withered riverbed would be 1,680 ha.
Natural forces, including intrinsic vegetation processes (e.g., succession) and land-use conversion [
46], also cause vegetation change.
Populus euphratica forests are very sensitive to water-table changes. The lateral distance of the affected water table extended to 1050 m from the riverbank after adequate water conveyance [
58]. The change trajectories for
Populus euphratica forests can be explained by the comprehensive influence of these two driving forces (anthropogenic activities and natural forces).
Populus euphratica forests a long way from the river channel had died due to the increased depth of the groundwater under the surface. This explains why degradation had occurred in Regions I and III. The old river was abandoned in Region I, and the covered revetment in the riverbank prevented the penetration of groundwater in Region III. Increasing areas of forest were observed in Region II, because of irrigation by the released water, and in Region IV where ecological sluices were opened to convey water onto the floodplain.
Future research on the entire watershed needs to investigate other factors that influence the spatial forest change pattern, including: regional climate change, runoff yield, agricultural water consumption and anthropogenic activities, such as reservoir and dam construction, groundwater exploitation, wasteland reclamation and farmland restoration.
Figure 7.
(a) Change trajectories for four districts; (b) dried riverbed after river diversion; (c) bent-to-straight river channel; (d) revetment in the riverbank; (e) ecological sluices.
Figure 7.
(a) Change trajectories for four districts; (b) dried riverbed after river diversion; (c) bent-to-straight river channel; (d) revetment in the riverbank; (e) ecological sluices.


