Near-Term Effects of Repeated-Thinning with Riparian Buffers on Headwater Stream Vertebrates and Habitats in Oregon, USA

Abstract
:1. Introduction
2. Methods
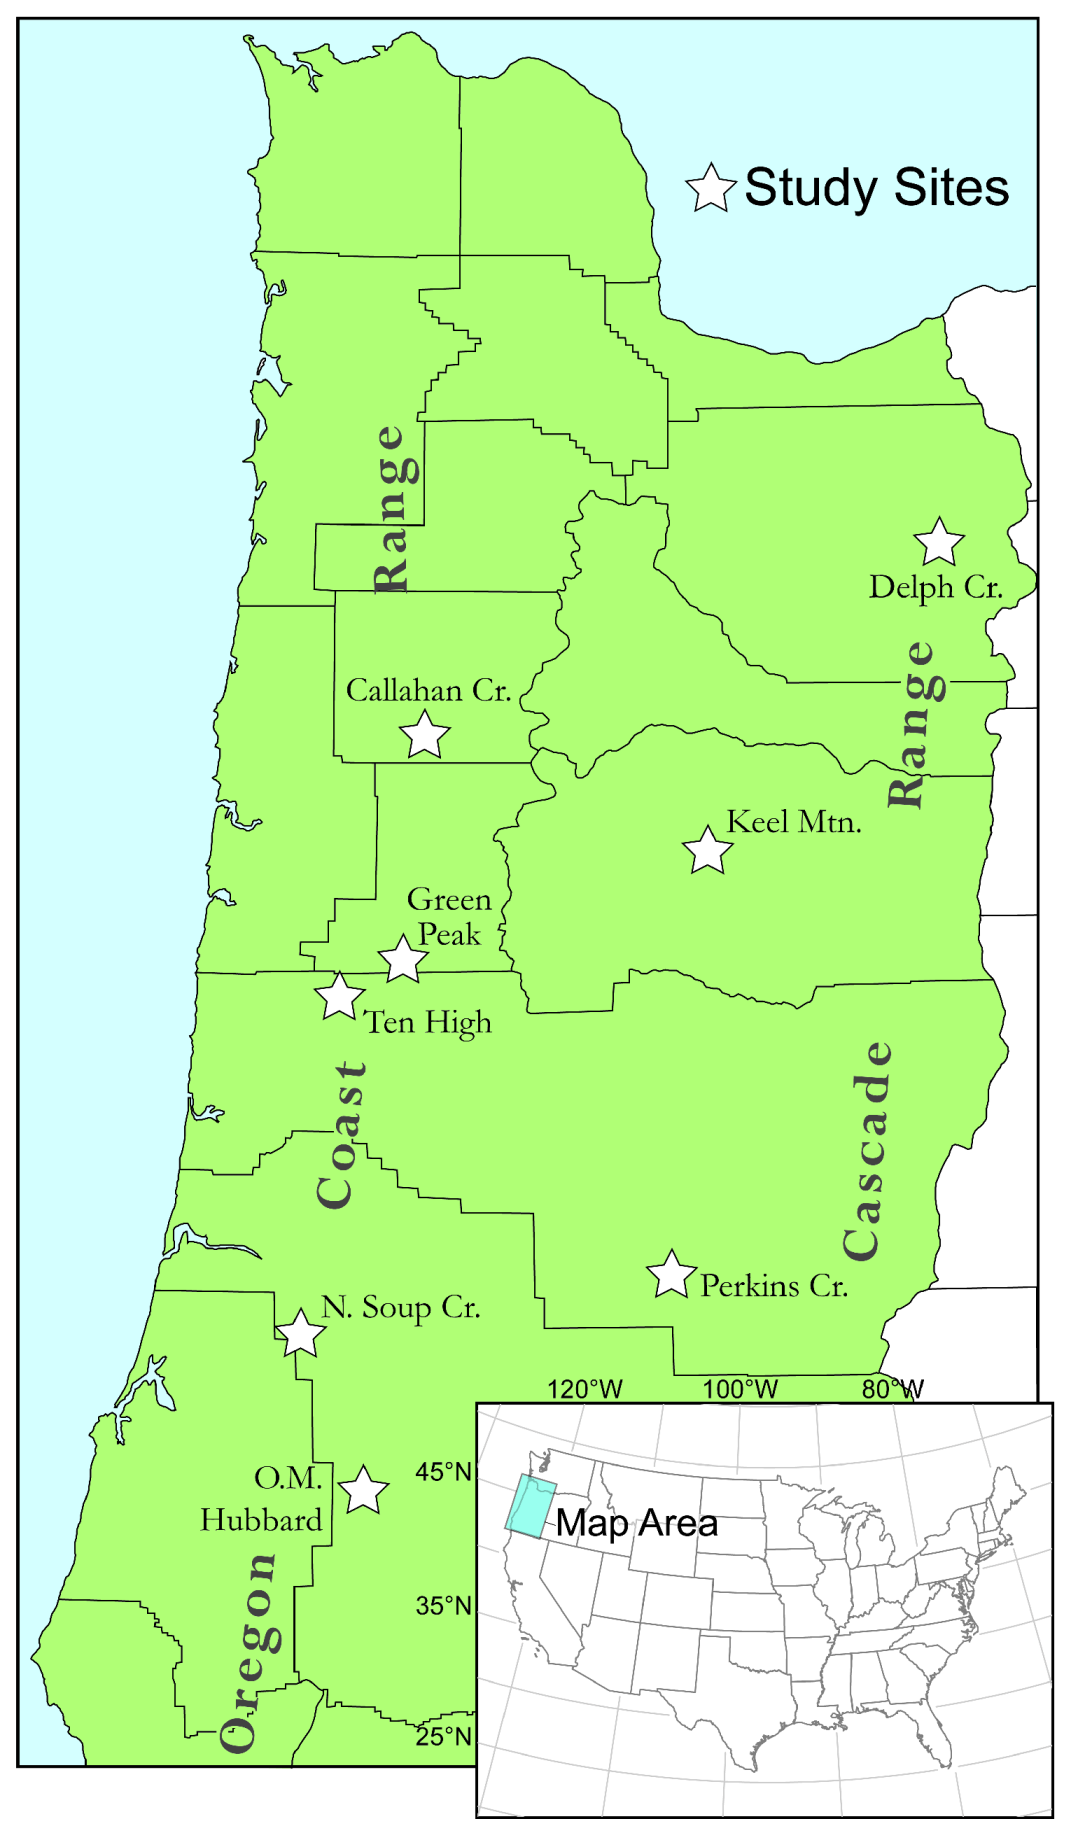
2.1. Study Area

2.2. Experimental Design

| Site | Control | 1Tree | Variable | Streamside | Thin-Through |
|---|---|---|---|---|---|
| Moderate-density upland retention | |||||
| Callahan Creek | 2 | 1 | 2 | 2 | 2 |
| Delph Creek | 2 | 0 | 1 | 1 | 0 |
| Green Peak | 2 | 1 | 1 | 1 | 0 |
| O.M. Hubbard Creek | 3 | 2 | 2 | 0 | 0 |
| Keel Mountain | 2 | 1 | 1 | 1 | 3 |
| Perkins Creek | 2 | 0 | 2 | 2 | 0 |
| N. Soup Creek | 2 | 1 | 1 | 1 | 0 |
| Ten High | 2 | 1 | 3 | 2 | 0 |
| Total | 17 | 7 | 13 | 10 | 5 |
| High-density upland retention | |||||
| Keel Mountain | (2) | 0 | 3 | 0 | 4 |
2.3. Field Methods
2.4. Statistical Analysis
3. Results and Discussion
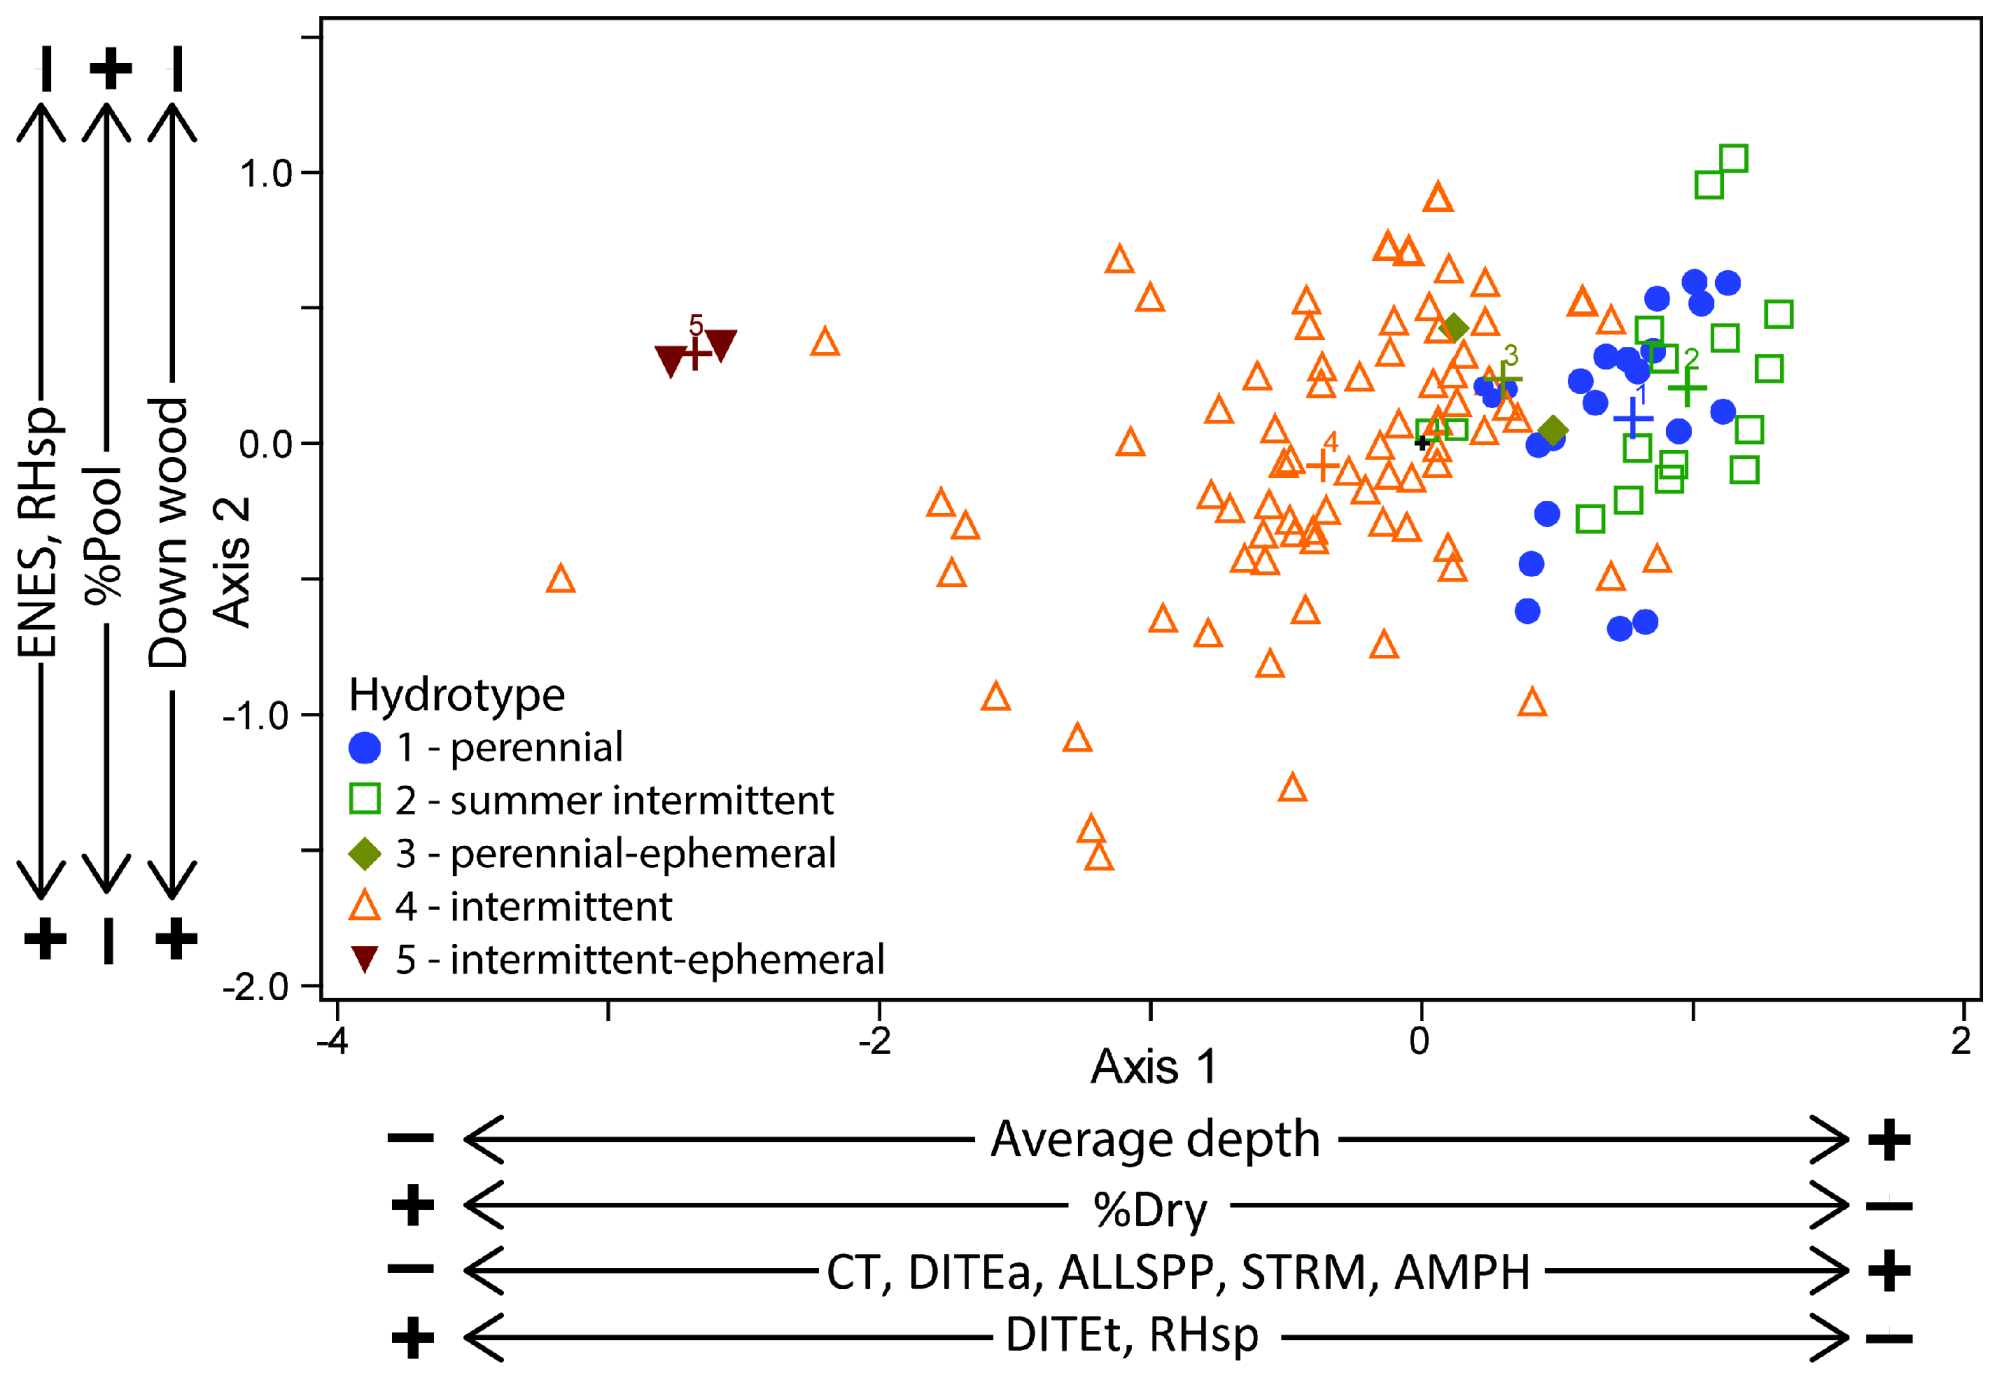
3.1. NMS Ordination

| Reach Characteristics | Correlation with Ordination Axes | |
|---|---|---|
| Axis 1 | Axis 2 | |
| Dimensions of sampled habitat units | ||
| Average width (m) | 0.59 *** | 0.04 |
| Average depth (m) | 0.89 *** | 0.50 *** |
| Pool depth (m) | 0.88 *** | 0.46 *** |
| Riffle depth (m) | 0.81 *** | 0.32 *** |
| Percentage of sampled habitat units | ||
| %Riffle length | −0.33 *** | −0.13 |
| %Riffle area | −0.33 *** | −0.28 *** |
| %Pool length | 0.64 *** | 0.32 *** |
| %Pool area | 0.61 *** | 0.39 *** |
| Percentage cover of substrates (reach scale) | ||
| %Fine | 0.01 | −0.16 * |
| %Small gravel | −0.52 *** | −0.05 |
| %Large gravel | 0.56 *** | 0.22 ** |
| %Cobble | 0.63 *** | 0.11 |
| %Boulders | 0.69 *** | 0.02 |
| %Bedrock | 0.58 *** | −0.02 |
| Reach-scale characteristics | ||
| %Riffle length | 0.42 *** | −0.53 *** |
| %Riffle area | −0.58 *** | −0.74 *** |
| %Pool length | 0.76 *** | 0.73 *** |
| %Pool area | 0.70 *** | 0.79 *** |
| %Dry length | −0.84 *** | 0.04 |
| Pool:riffle (length) | 0.52 *** | 0.75 *** |
| Average length of dry units | −0.80 *** | 0.05 |
| Stream wood (reach-scale) | ||
| Volume in early stages of decay (Classes 1, 2) | −0.51 *** | −0.54 *** |
| Volume in late stages of decay (Classes 3, 4, 5) | −0.36 *** | −0.30 *** |
| Total volume of wood | −0.43 *** | −0.40 *** |
| Species/Group | Correlation with Ordination Axes | |
|---|---|---|
| Axis 1 | Axis 2 | |
| All species combined | 0.40 *** | 0.15 * |
| Fish species | 0.29 *** | 0.18 * |
| Oncorhynchus spp. | 0.22 ** | 0.21 ** |
| O. clarkii | 0.40 *** | 0.23 ** |
| Cottidae spp. | 0.25 *** | 0.15 * |
| Amphibian species | 0.33 *** | 0.04 |
| Stream-breeding amphibians | 0.32 *** | 0.04 |
| A. truei | 0.31 *** | 0.14 |
| D. tenebrosus (aquatic) | 0.42 *** | 0.16 * |
| D. tenebrosus (terrestrial) | −0.26 *** | −0.08 |
| Rhyacotriton spp. | −0.32 *** | −0.35 *** |
| Terrestrial-breeding amphibians | 0.17 * | −0.13 |
| A. ferreus | 0.03 | 0.01 |
| B. wrighti | −0.19 * | −0.15* |
| E. eschscholtzii | −0.16 * | −0.29 *** |
| P. dunni | 0.22 ** | −0.08 |
| P. vehiculum | −0.08 | −0.07 |
| Pond-breeding amphibians | 0.15 * | 0.17 * |
| A. gracile | 0.09 | 0.08 |
| T. granulosa | 0.11 | 0.13 |
| R. aurora | 0.13 | 0.12 |

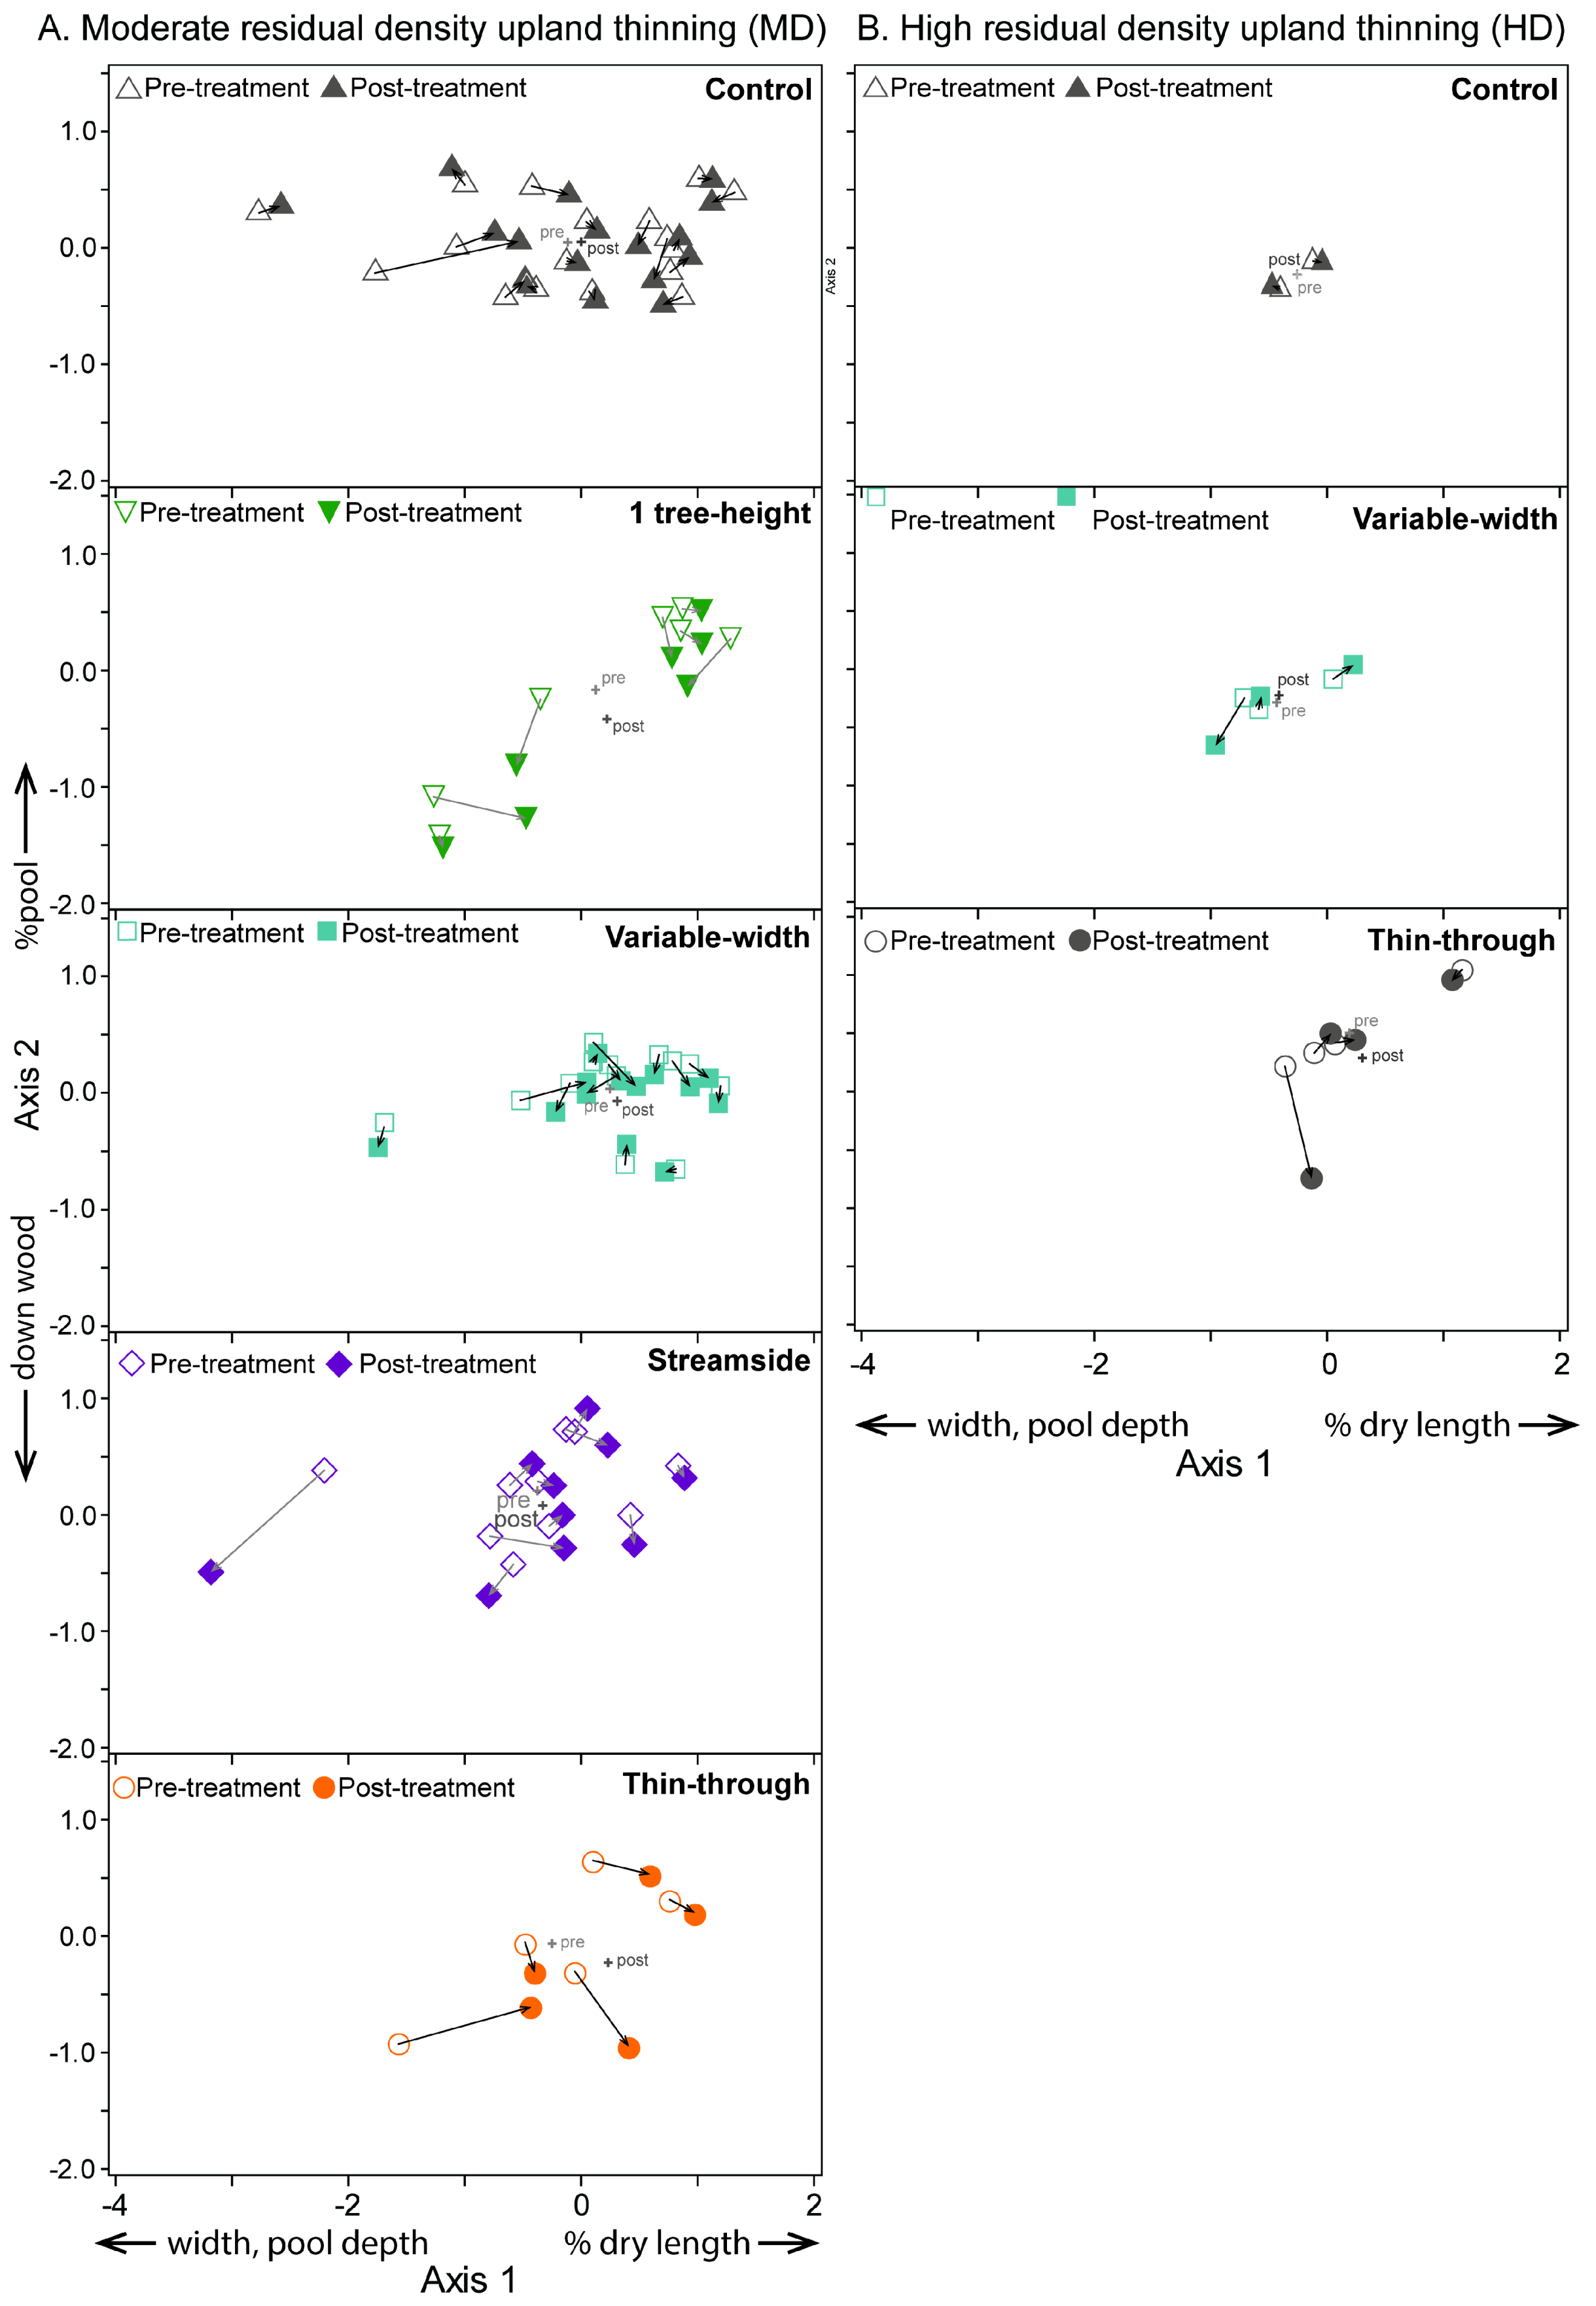
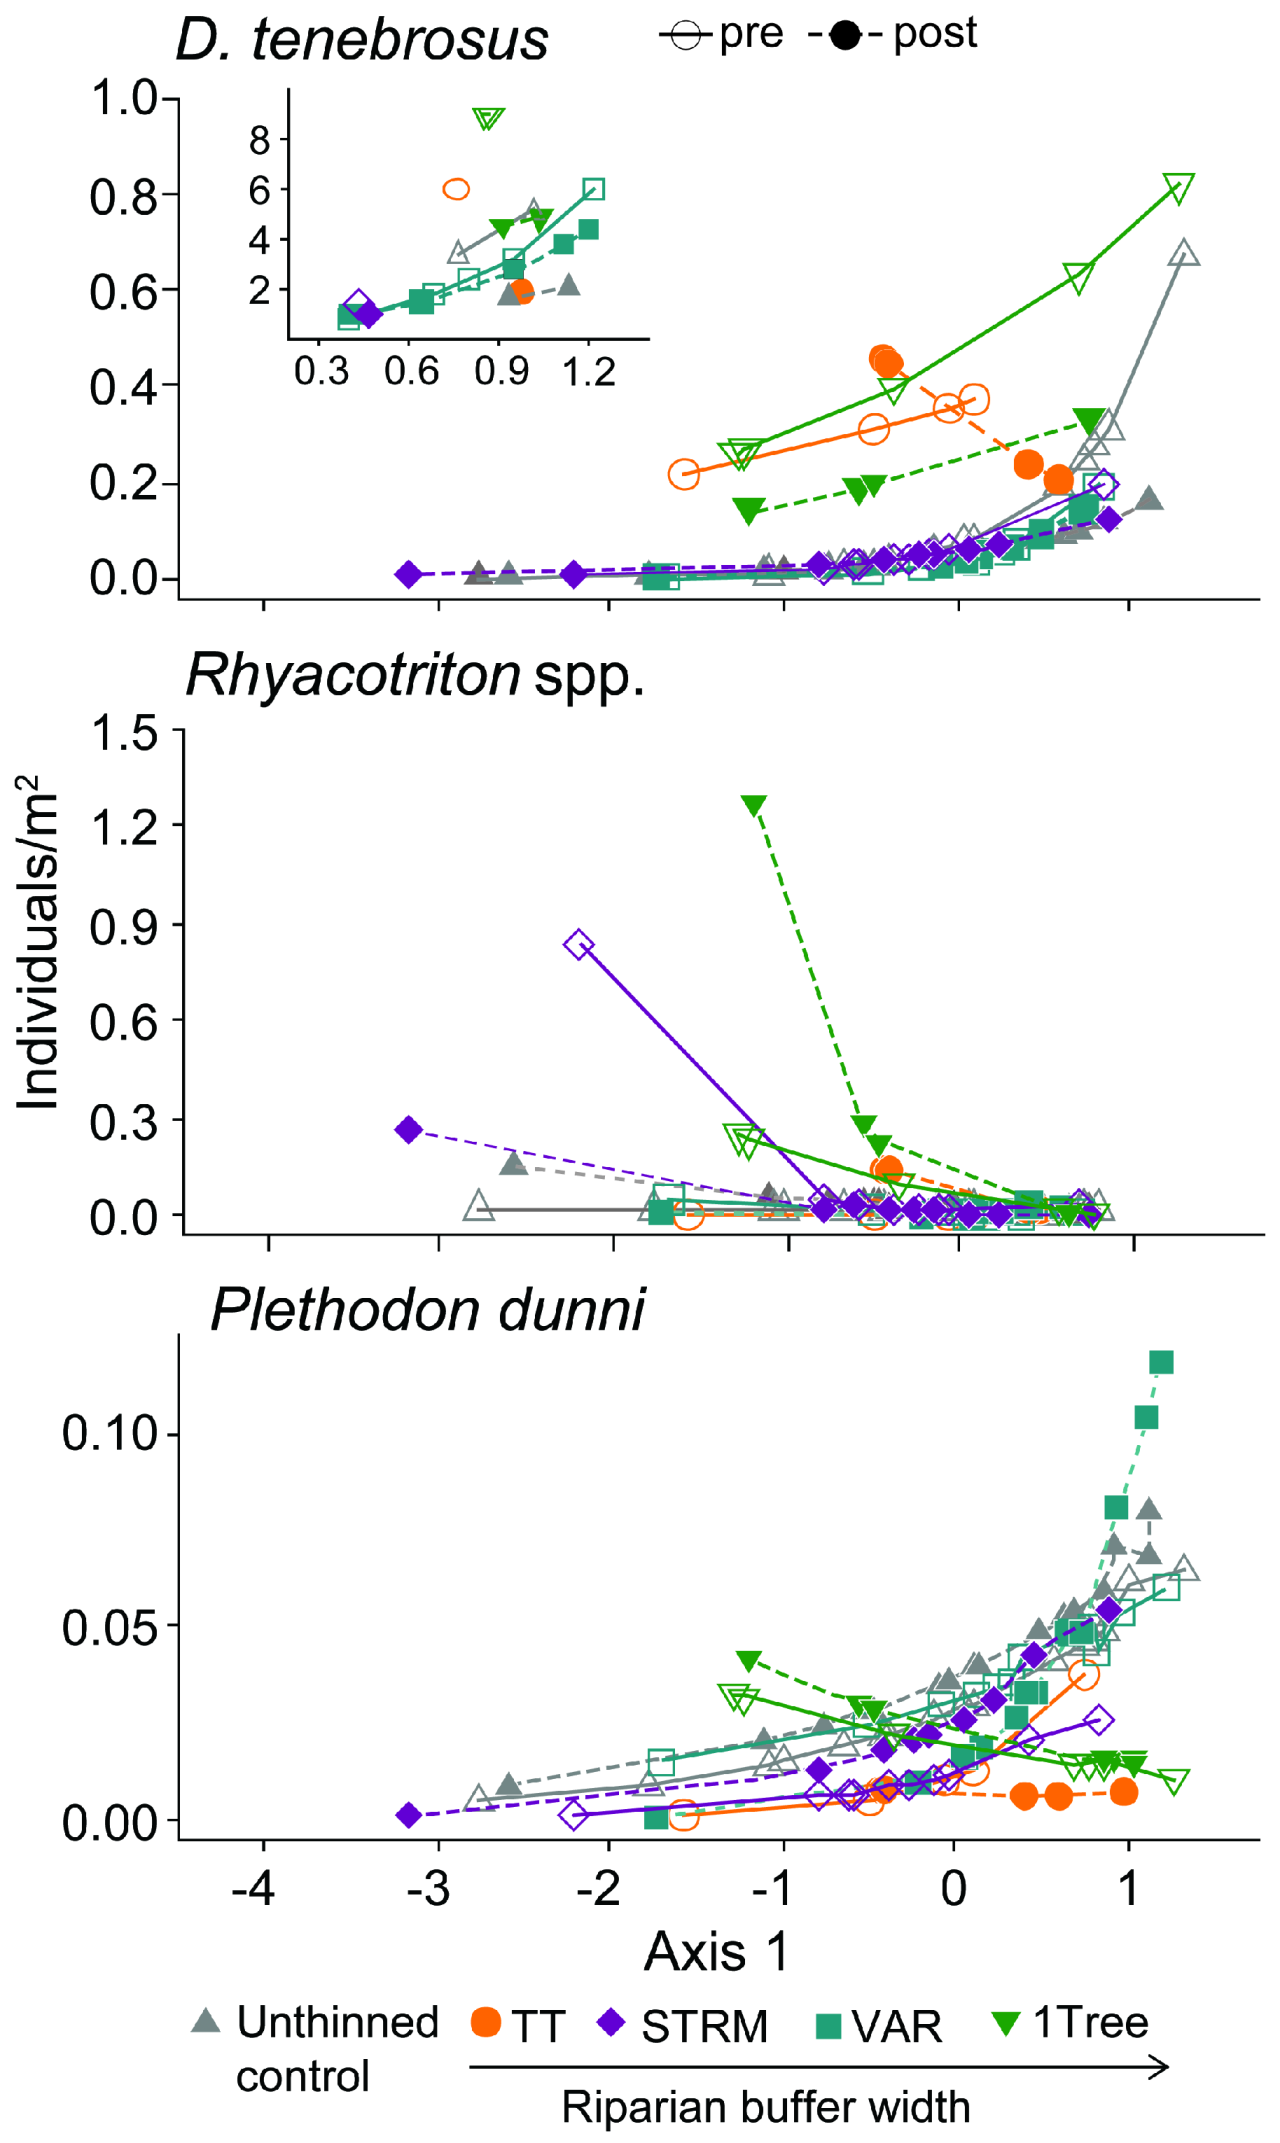
3.2. Moderate-Density Thinning
| Moderate-Density Upland Thinning | High-Density Upland Thinning | |||||||
|---|---|---|---|---|---|---|---|---|
| Effect | DFNum | DFDen | F-Value | Pr > F | DFNum | DFDen | F-Value | Pr > F |
| All species | ||||||||
| Sampling method | 1 | 38 | 32.5 | <0.0001 | 1 | 1 | 6.3 | 0.241 |
| Habitat | 1 | 38 | 0.0 | 0.876 | 1 | 1 | 2.9 | 0.336 |
| Buffer | 4 | 38 | 4.5 | 0.004 | 2 | 1 | 1.2 | 0.544 |
| Habitat × Buffer | 4 | 38 | 3.0 | 0.030 | 2 | 1 | 3.0 | 0.379 |
| Year | 1 | 38 | 0.0 | 0.947 | 1 | 1 | 2.4 | 0.367 |
| Buffer × Year | 4 | 38 | 0.2 | 0.930 | 2 | 1 | 10.3 | 0.215 |
| Habitat × Year | 1 | 38 | 2.2 | 0.149 | 1 | 1 | 61.7 | 0.081 |
| Habitat × Buffer × Year | 4 | 38 | 0.8 | 0.512 | 2 | 1 | 28.1 | 0.132 |
| Amphibians | ||||||||
| Sampling method | 1 | 38 | 21.6 | <0.0001 | 1 | 1 | 6.3 | 0.241 |
| Habitat | 1 | 38 | 0.0 | 0.921 | 1 | 1 | 2.9 | 0.336 |
| Buffer | 4 | 38 | 3.9 | 0.010 | 2 | 1 | 1.2 | 0.544 |
| Habitat × Buffer | 4 | 38 | 3.2 | 0.024 | 2 | 1 | 3.0 | 0.379 |
| Year | 1 | 38 | 0.2 | 0.666 | 1 | 1 | 2.4 | 0.367 |
| Buffer × Year | 4 | 38 | 0.3 | 0.866 | 2 | 1 | 10.3 | 0.215 |
| Habitat × Year | 1 | 38 | 2.6 | 0.117 | 1 | 1 | 61.7 | 0.081 |
| Habitat × Buffer × Year | 4 | 38 | 1.0 | 0.418 | 2 | 1 | 28.1 | 0.132 |
| Stream-breeding amphibians | ||||||||
| Sampling method | 1 | 38 | 46.9 | <0.0001 | 1 | 1 | 15.9 | 0.156 |
| Habitat | 1 | 38 | 0.2 | 0.645 | 1 | 1 | 0.2 | 0.753 |
| Buffer | 4 | 38 | 4.8 | 0.003 | 2 | 1 | 0.7 | 0.653 |
| Habitat × Buffer | 4 | 38 | 2.2 | 0.091 | 2 | 1 | 0.1 | 0.907 |
| Year | 1 | 38 | 0.3 | 0.608 | 1 | 1 | 0.0 | 0.953 |
| Buffer × Year | 4 | 38 | 0.7 | 0.586 | 2 | 1 | 4.9 | 0.304 |
| Habitat × Year | 1 | 38 | 2.5 | 0.126 | 1 | 1 | 1.5 | 0.437 |
| Habitat × Buffer × Year | 4 | 38 | 1.8 | 0.157 | 2 | 1 | 6.9 | 0.260 |
| Terrestrial-breeding amphibians | ||||||||
| Sampling method | 1 | 38 | 1.46 | 0.234 | 1 | 1 | 3.42 | 0.316 |
| Habitat | 1 | 38 | 4.32 | 0.045 | 1 | 1 | 0.2 | 0.732 |
| Buffer | 4 | 38 | 1.16 | 0.343 | 2 | 1 | 0.03 | 0.967 |
| Habitat × Buffer | 4 | 38 | 1.42 | 0.246 | 2 | 1 | 3.47 | 0.355 |
| Year | 1 | 38 | 0.04 | 0.843 | 1 | 1 | 1.32 | 0.456 |
| Buffer × Year | 4 | 38 | 0.75 | 0.566 | 2 | 1 | 0.78 | 0.626 |
| Habitat × Year | 1 | 38 | 0.78 | 0.384 | 1 | 1 | 4.27 | 0.287 |
| Habitat × Buffer × Year | 4 | 38 | 1.32 | 0.280 | 2 | 1 | 1.53 | 0.497 |
| Pond-breeding amphibians | ||||||||
| Sampling method | 1 | 38 | 0.3 | 0.615 | 1 | 1 | 4.5 | 0.280 |
| Habitat | 1 | 38 | 1.5 | 0.225 | 1 | 1 | 2.6 | 0.354 |
| Buffer | 4 | 38 | 0.3 | 0.910 | 2 | 1 | 29.4 | 0.129 |
| Habitat × Buffer | 4 | 38 | 0.5 | 0.773 | 2 | 1 | 4.1 | 0.330 |
| Year | 1 | 38 | 3.6 | 0.066 | 1 | 1 | 20.8 | 0.138 |
| Buffer × Year | 4 | 38 | 0.8 | 0.523 | 2 | 1 | 22.5 | 0.147 |
| Habitat × Year | 1 | 38 | 0.5 | 0.503 | 1 | 1 | 11.2 | 0.185 |
| Habitat × Buffer × Year | 4 | 38 | 0.7 | 0.633 | 2 | 1 | 2.3 | 0.423 |
| Fish | ||||||||
| Sampling method | 1 | 38 | 33.19 | <0.0001 | ||||
| Habitat | 1 | 38 | 1.89 | 0.1777 | ||||
| Buffer | 4 | 38 | 1.23 | 0.315 | ||||
| Habitat × Buffer | 4 | 38 | 1.58 | 0.1994 | ||||
| Year | 1 | 38 | 4.17 | 0.0482 | ||||
| Buffer × Year | 4 | 38 | 0.82 | 0.5195 | ||||
| Habitat × Year | 1 | 38 | 0.19 | 0.6681 | ||||
| Habitat × Buffer × Year | 4 | 38 | 0.48 | 0.7505 | ||||
| Dicamptodon tenebrosus | ||||||||
| Sampling method | 1 | 38 | 17.0 | 0.000 | 1 | 1 | 3.4 | 0.317 |
| Habitat | 1 | 38 | 10.7 | 0.002 | 1 | 1 | 31.5 | 0.112 |
| Buffer | 4 | 38 | 5.8 | 0.001 | 2 | 1 | 8.6 | 0.235 |
| Habitat × Buffer | 4 | 38 | 2.5 | 0.061 | 2 | 1 | 4.9 | 0.305 |
| Year | 1 | 38 | 0.8 | 0.370 | 1 | 1 | 9.2 | 0.203 |
| Buffer × Year | 4 | 38 | 0.5 | 0.775 | 2 | 1 | 0.7 | 0.636 |
| Habitat × Year | 1 | 38 | 2.7 | 0.109 | 1 | 1 | 7.7 | 0.220 |
| Habitat × Buffer × Year | 4 | 38 | 0.3 | 0.908 | 2 | 1 | 9.9 | 0.220 |
| Rhyacotriton spp. | ||||||||
| Sampling method | 1 | 38 | 0.4 | 0.530 | 1 | 1 | 0.0 | 0.921 |
| Habitat | 1 | 38 | 8.7 | 0.006 | 1 | 1 | 0.1 | 0.820 |
| Buffer | 4 | 38 | 3.0 | 0.029 | 2 | 1 | 0.0 | 0.958 |
| Habitat × Buffer | 4 | 38 | 1.7 | 0.177 | 2 | 1 | 0.1 | 0.956 |
| Year | 1 | 38 | 1.9 | 0.176 | 1 | 1 | 5.8 | 0.251 |
| Buffer × Year | 4 | 38 | 1.8 | 0.144 | 2 | 1 | 1.4 | 0.510 |
| Habitat × Year | 1 | 38 | 1.8 | 0.186 | 1 | 1 | 0.0 | 0.965 |
| Habitat × Buffer × Year | 4 | 38 | 2.1 | 0.104 | 2 | 1 | 0.5 | 0.717 |
| Plethodon dunni | ||||||||
| Sampling method | 1 | 38 | 0.1 | 0.769 | 1 | 1 | 1.9 | 0.403 |
| Habitat | 1 | 38 | 5.6 | 0.023 | 1 | 1 | 1.0 | 0.508 |
| Buffer | 4 | 38 | 1.4 | 0.251 | 2 | 1 | 0.8 | 0.626 |
| Habitat × Buffer | 4 | 38 | 3.1 | 0.026 | 2 | 1 | 0.7 | 0.646 |
| Year | 1 | 38 | 0.0 | 0.954 | 1 | 1 | 0.0 | 0.869 |
| Buffer × Year | 4 | 38 | 2.7 | 0.043 | 2 | 1 | 0.6 | 0.674 |
| Habitat × Year | 1 | 38 | 0.4 | 0.559 | 1 | 1 | 0.3 | 0.673 |
| Habitat × Buffer × Year | 4 | 38 | 3.3 | 0.021 | 2 | 1 | 0.0 | 0.996 |

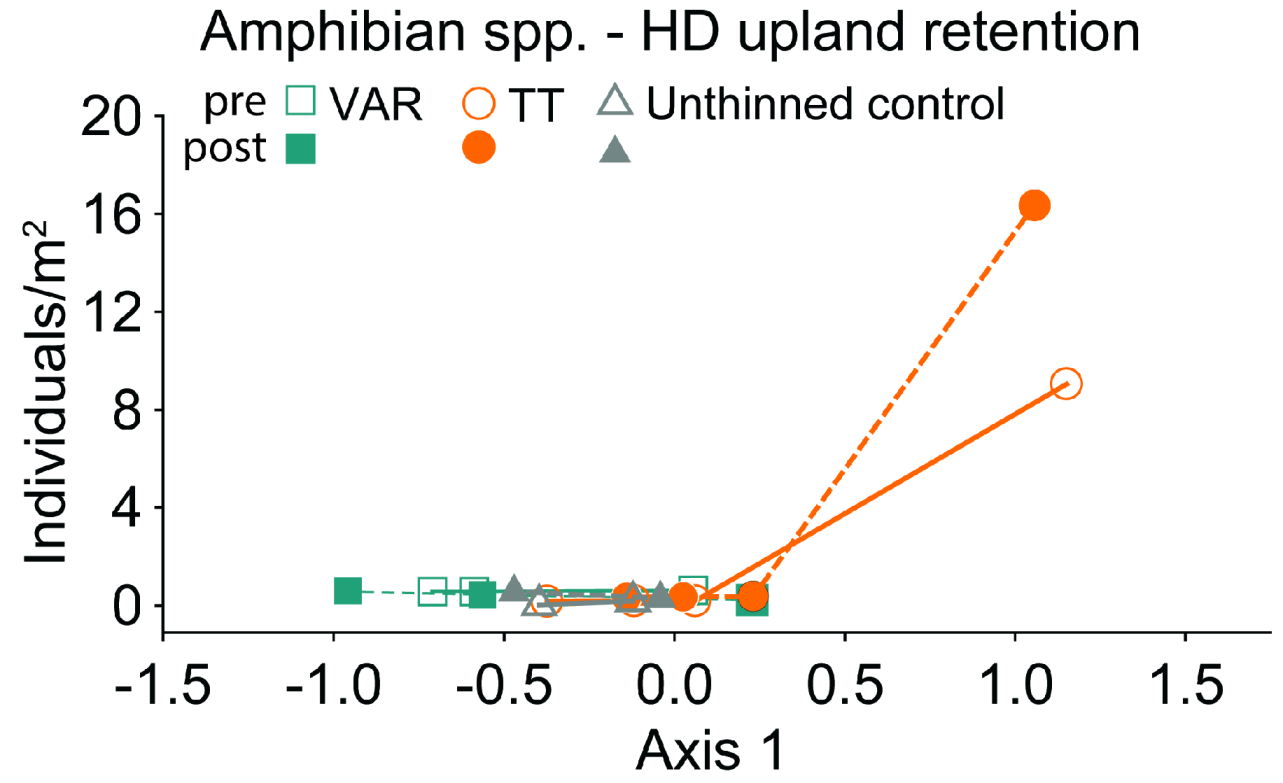
3.3. High-Density Thinning

4. Conclusions

Acknowledgments
Author Contributions
Conflicts of Interest
References
- Stuart, S.N.; Chanson, J.S.; Cox, N.A.; Young, B.E.; Rodrigues, A.S.L.; Fischman, D.L.; Waller, R.W. Status and trends of amphibian declines and extinctions worldwide. Science 2004, 306, 1783–1786. [Google Scholar]
- Hoffmann, M.; Hilton-Taylor, C.; Angulo, A.; Bohm, M.; Brooks, T.M.; Butchart, S.H.M.; Carpenter, K.E.; Chanson, J.; Collen, B.; Cox, N.A.; et al. The impact of conservation on the status of the world’s vertebrates. Science 2010, 330, 1503–1509. [Google Scholar]
- McG Reid, G.; Contreras MacBeath, T.; Csatadi, K. Global challenges in freshwater fish conservation related to public aquariums and the aquarium industry. Int. Zoo Yearb. 2013, 47, 6–45. [Google Scholar]
- IUCN Freshwater Fish Specialist Group. Available online: http://www.iucnffsg.org/freshwater-fishes/major-threats/ (accessed on 24 July 2014).
- Amphibians on the IUCN Red List, Analysis of Data, Habitat Preferences. Available online: http://www.iucnredlist.org/initiatives/amphibians/analysis/habitat (accessed on 24 July 2014).
- Amphibians on the IUCN Red List, Analysis of Data, Major Threats. Available online: http://www.iucnredlist.org/initiatives/amphibians/analysis/major-threats (accessed on 24 July 2014).
- AmphibiaWeb Species Numbers. Available online: http://amphibiaweb.org/amphibian/speciesnums.html (accessed on 24 July 2014).
- Holthausen, R.S.; Sieg, C.H. Effectiveness of alternative management strategies in meeting conservation objectives. In Conservation of Rare or Little-known Species: Biological, Social, and Economic Considerations; Raphael, M.G., Molina, R., Eds.; Island Press: Washington, DC, USA, 2007; pp. 187–235. [Google Scholar]
- Welsh, H.H., Jr.; Ollivier, L.M. Stream amphibians as indicators of ecosystem stress: A case study from California’s redwoods. Ecol. Appl. 1998, 8, 1118–1132. [Google Scholar]
- Welsh, H.H., Jr.; Droege, S. A case for using plethodontid salamanders for monitoring biodiversity and ecosystem integrity of North American forests. Conserv. Biol. 2001, 15, 558–569. [Google Scholar]
- Davic, R.D.; Welsh, H.H., Jr. On the ecological roles of salamanders. Ann. Rev. Ecol. Evol. Syst. 2004, 35, 405–434. [Google Scholar]
- Welsh, H.H., Jr.; Hodgson, G.R. Amphibians as metrics of critical biological thresholds in forested headwater streams of the Pacific Northwest. Freshw. Biol. 2008, 53, 1470–1488. [Google Scholar]
- Best, M.L.; Welsh, H.H., Jr. The trophic role of a forest salamander: impacts on invertebrates, leaf litter retention, and the humification process. Ecosphere 2014, 5, 19. [Google Scholar] [CrossRef]
- Record of Decision on Management of Habitat for Late-successional and Old-growth Forest Related Species within the Range of the Northern Spotted Owl (Northwest Forest Plan); US Department of Agriculture and US Department of Interior: Portland, OR, USA, 1994.
- Lindenmeyer, D.B.; Franklin, J.F. Conserving Forest Biodiversity: A Comprehensive Multiscaled Approach; Island Press: Washington, DC, USA, 2002; p. 351. [Google Scholar]
- Millennium Ecosystem Assessment. Ecosystems and Human Well-being: Biodiversity Synthesis; World Resources Institute: Washington, DC, USA, 2005. Available online: http://www.unep.org/maweb/en/Index.aspx (accessed on 29 July 2014).
- Olson, D.H. Biodiversity: Symposium issue. Northwest. Nat. 2006, 87, 1–85. [Google Scholar]
- Raphael, M.G.; Molina, R. Conservation of Rare or Little-Known Species: Biological, Social, and Economic Considerations; Island Press: Washington, DC, 2007; p. 375. [Google Scholar]
- Smith, N.; Deal, R.; Kline, J.; Blahna, D.; Patterson, T.; Spies, T.A.; Bennett, K. Ecosystem Services as a Framework for Forest Stewardship: Deschutes National Forest Overview; General Technical Report, PNW-GTR-852; US Department of Agriculture, Forest Service, Pacific Northwest Research Station: Portland, OR, USA, 2011; p. 46. [Google Scholar]
- Burton, J.I.; Ares, A.; Olson, D.H.; Puettmann, K.J. Management trade-off between aboveground carbon storage and understory plant species richness in temperate forests. Ecol. Appl. 2014, 23, 1297–1310. [Google Scholar]
- Murphy, M.L.; Heifetz, J.; Johnson, S.W.; Koski, K.V.; Thedinga, J.F. Effects of clear-cut logging with and without buffer strips on juvenile salmonids in Alaskan streams. Can. J. Fish. Aquat. Sci. 1986, 43, 1521–1533. [Google Scholar]
- Demaynadier, P.G.; Hunter, M.L., Jr. The relationship between forest management and amphibian ecology: A review of the North American literature. Environ. Rev. 1995, 3, 230–261. [Google Scholar]
- Naiman, R.J.; Bilby, R.E.; Bisson, P.A. Riparian ecology and management in the Pacific coastal rain forest. BioScience 2000, 50, 996–1011. [Google Scholar]
- Semlitsch, R.D.; Todd, B.D.; Blomquist, S.M.; Calhoun, A.J.K.; Gibbons, J.W.; Gibbs, J.P.; Graeter, G.J.; Harper, E.B.; Hocking, D.J.; Hunter, M.L., Jr.; et al. Effects of timber harvest on Amphibian Populations: Understanding Mechanisms from Forest Experiments. BioScience 2009, 59, 853–862. [Google Scholar]
- Medhurst, R.B.; Wipfli, M.S.; Binckley, C.; Polivka, K.; Hessburg, P.F.; Salter, R.B. Headwater streams and forest management: Does ecoregional context influence logging effects on benthic communities? Hydrobiologia 2010, 641, 71–83. [Google Scholar]
- Johnson, S.L.; Jones, J.A. Stream temperature responses to forest harvest and debris flow in western Cascades, Oregon. Can. J. Fish. Aquat. Sci. 2000, 57, 30–39. [Google Scholar]
- Wilkerson, E.; Hagan, J.M.; Siegel, D.; Whitman, A.A. The effectiveness of different buffer widths for protecting headwater stream temperature in Maine. For. Sci. 2006, 52, 221–231. [Google Scholar]
- Bury, R.B. Low thermal tolerances of stream amphibians in the Pacific Northwest: Implications for riparian and forest management. Appl. Herpetol. 2008, 5, 63–74. [Google Scholar]
- Groom, J.D.; Dent, L.; Madsen, L.J. Stream temperature change detection for state and private forests in the Oregon Coast Range. Water Resour. Res. 2011, 47. [Google Scholar] [CrossRef]
- Groom, J.D.; Dent, L.; Madsen, L.J.; Fleuret, J. Response of western Oregon stream temperatures to contemporary forest management. For. Ecol. Manag. 2011, 262, 1618–1629. [Google Scholar]
- Benda, L.E.; Cundy, T.W. Predicting deposition of debris flows in mountain channels. Can. Geotech. J. 1990, 27, 409–417. [Google Scholar]
- Benda, L.E.; Dunne, T. Stochastic forcing of sediment supply to channel networks from landsliding and debris flows. Water Resour. Res. 1997, 33, 2849–2863. [Google Scholar]
- Benda, L.E.; Dunne, T. Stochastic forcing of sediment routing and storage in channel networks. Water Resour. Res. 1997, 33, 2865–2880. [Google Scholar]
- Rashin, E.B.; Clishe, C.J.; Loch, A.T.; Bell, J.M. Effectiveness of timber harvest practices for controlling sediment related water quality impacts. J. Am. Water Res. Assoc. 2006, 42, 1307–1327. [Google Scholar]
- Stout, B.M., III; Benfield, E.F.; Webster, J.R. ffects of a forest disturbance on shredder production in a southern Appalachian stream. Freshw. Biol. 1993, 29, 59–69. [Google Scholar]
- Wallace, J.B.; Eggert, S.L.; Meyer, J.L.; Webster, R. Multiple trophic levels of a forest stream linked to terrestrial litter inputs. Science 1997, 277, 102–104. [Google Scholar]
- Melody, K.J.; Richardson, J.S. Riparian forest harvesting and its influence on benthic communities of small streams of sub-boreal British Columbia. Can. J. For. Res. 2007, 37, 907–918. [Google Scholar]
- Reeves, G.H.; Burnett, K.M.; McGarry, E.V. Sources of large wood in a pristine watershed in coastal Oregon. Can. J. For. Res. 2003, 33, 1363–1370. [Google Scholar]
- Reeves, G.H. The aquatic conservation strategy of the Northwest Forest Plan: An assessment after ten years. In Northwest Forest Plan—The First 10 Years (1994–2003) Synthesis of Monitoring and Research Results; Haynes, R.W., Bormann, B.T., Lee, D.C., Martin, J.R., Eds.; General Technical Report, PNW-GTR-651; USA Department of Agriculture, Forest Service, Pacific Northwest Research Station: Portland, OR, USA, 2006; pp. 181–217. [Google Scholar]
- Benda, L.; Bigelow, P. On the patterns and processes of wood in northern California streams. Geomorphology 2014, 209, 79–97. [Google Scholar]
- Pollock, M.M.; Beechie, T.J. Does riparian forest restoration thinning enhance biodiversity? The ecological importance of large wood. J. Am. Water Res. Assoc. 2014, 50, 543–559. [Google Scholar]
- Compendium of Forestry Best Management Practices for Controlling Nonpoint Source Pollution in North America; Technical Bulletin No. 966; National Council for Air and Stream Improvement, Inc. (NCASI): Research Triangle Park, NC, USA, 2009; p. 208.
- Gomi, T.; Sidle, R.C.; Richardson, J.S. Understanding processes and downstream linkages of headwater streams. BioScience 2002, 52, 905–916. [Google Scholar]
- Sedell, J.R.; Reeves, G.H.; Burnett, K.M. Development and evaluation of aquatic conservation strategies. J. For. 1994, 92, 28–31. [Google Scholar]
- Naiman, R.J.; Décamps, H. The ecology of interfaces: Riparian zones. Ann. Rev. Ecol. Syst. 1997, 28, 621–658. [Google Scholar]
- Young, K.A. Riparian zone management in the Pacific Northwest: Who’s cutting what? Environ. Manag. 2000, 26, 131–144. [Google Scholar]
- Olson, D.H.; Anderson, P.D.; Frissell, C.A.; Welsh, H.H., Jr.; Bradford, D.F. Biodiversity management approaches for stream riparian areas: Perspectives for Pacific Northwest headwater forests, microclimate and amphibians. For. Ecol. Manag. 2007, 246, 81–107. [Google Scholar]
- Jackson, C.R.; Batzer, D.P.; Cross, S.S.; Haggerty, S.M.; Sturm, C.A. Headwater streams and timber harvest: Channel, macroinvertebrate, and amphibian response and recovery. For. Sci. 2007, 53, 356–370. [Google Scholar]
- Pollett, K.L.; MacCracken, J.G.; MacMahon, J.A. Stream buffers ameliorate the effects of timber harvest on amphibians in the Cascade Range of Southern Washington, USA. For. Ecol. Manag. 2010, 260, 1083–1087. [Google Scholar]
- Peterman, W.E.; Crawford, J.A.; Semlitsch, R.D. Effects of even-aged timber harvest on stream salamanders: Support for the evacuation hypothesis. For. Ecol. Manag. 2011, 262, 2344–2353. [Google Scholar]
- Welsh, H.H., Jr. Frogs, fish and forestry: An integrated watershed network paradigm conserves biodiversity and ecological services. Diversity 2011, 3, 503–530. [Google Scholar]
- Hawkes, V.C.; Gregory, P.T. Temporal changes in the relative abundance of amphibians relative to riparian buffer width in western Washington, USA. For. Ecol. Manag. 2012, 274, 67–80. [Google Scholar]
- Olson, D.H.; Leirness, J.B.; Cunningham, P.G.; Steel, E.A. Riparian buffers and forest thinning: Effects on headwater vertebrates 10 years after thinning. For. Ecol. Manag. 2014, 321, 81–93. [Google Scholar]
- Olson, D.H.; Weaver, G. Vertebrate assemblages associated with headwater hydrology in western Oregon managed forests. For. Sci. 2007, 53, 343–355. [Google Scholar]
- Olson, D.H.; Rugger, C. Preliminary study of the effects of headwater riparian reserves with upslope thinning on stream habitats and amphibians in western Oregon. For. Sci. 2007, 53, 331–342. [Google Scholar]
- Rundio, D.E.; Olson, D.H. Influence of headwater site conditions and riparian buffers on terrestrial salamander response to forest thinning. For. Sci. 2007, 53, 320–330. [Google Scholar]
- Kluber, M.R.; Olson, D.H.; Puettmann, K.J. Amphibian distributions in riparian and upslope areas and their habitat associations on managed forest landscapes of the Oregon Coast Range. For. Ecol. Manag. 2008, 256, 529–535. [Google Scholar]
- Olson, D.H.; Kluber, M.R. Plethodontid salamander distributions in managed forest headwaters in western Oregon, USA. Herpetol. Conserv. Biol. 2014, 9, 76–96. [Google Scholar]
- Anderson, P.D.; Poage, N.J. The Density Management and Riparian Buffer Study: A large-scale silvicultural experiment informing riparian management in the Pacific Northwest, USA. For. Ecol. Manag. 2014, 316, 90–99. [Google Scholar]
- Cissel, J.; Anderson, P.; Berryman, S.; Chan, S.; Olson, D.; Puettmann, K.; Thompson, C. BLM Density Management and Riparian Buffer Study: Establishment Report and Study Plan; USA Geological Survey Scientific Investigations Report 2006–5087; USA Department of Interior: Denver, CO, USA, 2006; p. 144. [Google Scholar]
- Dodson, E.K.; Ares, A.; Puettmann, K.J. Early responses to thinning treatments designed to accelerate late successional forest structure in young coniferous stands of western Oregon, USA. Can. J. For. Res. 2012, 42, 345–355. [Google Scholar]
- Tappeiner, J.C.; Huffman, D.; Marshall, D.; Spies, T.E.; Baily, J.D. Density, ages, and growth rates in old-growth and young-growth forests in coastal Oregon. Can. J. For. Res. 1997, 27, 638–648. [Google Scholar]
- Poage, N.J.; Tappeiner, J.C., II. Long-term patterns of diameter and basal area growth of old-growth Douglas-fir trees in western Oregon. Can. J. For. Res. 2002, 32, 1232–1243. [Google Scholar]
- Franklin, J.F.; Dyrness, C.T. Natural Vegetation of Oregon and Washington; Oregon State University Press: Corvallis, OR, USA, 1988; p. 452. [Google Scholar]
- Hemstrom, M.A.; Logan, S.E. Plant Association and Management Guide: Siuslaw National Forest; USA Department of Agriculture, Forest Service, Pacific Northwest Region, R6-Ecol; 220–1986a; Portland, OR, USA, 1986; p. 121. Available online: ttp://www.fsl.orst.edu/rna/Documents/publications/Plant%20association%20and%20management%20guide%20Siuslaw%20National%20forest.pdf" ext-link-type="uri (accessed on 30 July 2014).
- Ares, A.; Berryman, S.D.; Puettmann, K.J. Understory vegetation response to thinning disturbance of varying complexity in coniferous stands. Appl. Veg. Sci. 2009, 12, 472–487. [Google Scholar]
- Poage, N.J.; Anderson, P.D. Large-scale Silviculture Experiments of Western Oregon and Washington; General Technical Report, PNW-GTR-713; USA Department of Agriculture, Forest Service, Pacific Northwest Region: Portland, OR, USA, 2007; p. 44. [Google Scholar]
- Hankin, D.G.; Reeves, G.H. Estimating total fish abundance and total habitat area in small streams based on visual estimation methods. Can. J. Fish. Aquat. Sci. 1988, 45, 834–844. [Google Scholar]
- ArcGIS Desktop: Release 10; Environmental Systems Research Institute (ESRI): Redlands, CA, USA, 2011.
- Sollins, P. Input and decay of coarse woody debris in coniferous stands in western Oregon and Washington. Can. J. For. Res. 1982, 12, 18–28. [Google Scholar]
- McCune, B.; Grace, J.B. Analysis of Ecological Communities; MjM Software Design: Gleneden Beach, OR, USA, 2002. [Google Scholar]
- McCune, B.; Mefford, M.J. Pc-ord Multivariate Analysis of Ecological Data; Version 6.06; MjM Software: Gleneden Beach, OR, USA, 2011. [Google Scholar]
- SAS; Version 9.3; SAS Institute Inc.: Cary, NC, USA, 2013.
- Olson, D.H.; Nauman, R.S.; Ellenburg, L.L.; Hansen, B.P.; Chan, S.S. Ensatina eschscholtzii nests at a managed forest site in Oregon. Northwest. Nat. 2006, 87, 203–208. [Google Scholar]
- Ellenburg, L.; (USDA Forest Service, Pacific Northwest Research Station, Corvallis, OR, USA). Personal Communication.
- Ruzicka, K.J., Jr.; Olson, D.H.; Puettmann, K.J. The intertwining paths of the Density Management and Riparian Buffer Study and the Northwest Forest Plan. In Density Management in the 21st Century: West Side Story; Anderson, P.D., Ronnenberg, K.L., Eds.; General Technical Report, PNW-GTR-880; USA Department of Agriculture, Forest Service, Pacific Northwest Research Station: Portland, OR, USA, 2013; pp. 10–21. [Google Scholar]
- Blaustein, A.R.; Beatty, J.J.; Olson, D.H.; Storm, R.M. The Biology of Amphibians and Reptiles in Old-Growth Forests in the Pacific Northwest; General Technical Report, PNW-GTR-337; USA Department of Agriculture, Forest Service: Portland, OR, USA, 1995; p. 98. [Google Scholar]
- Howell, B.L.; Maggiulli, N.M. Conservation Assessment for the Cascade Torrent Salamander (Rhyacotriton cascadae); Version 1.0; Interagency Special Status and Sensitive Species Program; USA Department of Agriculture, Forest Service Region 6, USA Department of Interior, Bureau of Land Management: Portland, OR, USA, 2011; p. 48. [Google Scholar]
- Anderson, P.D.; Larson, D.J.; Chan, S.S. Riparian buffer and density management influences on microclimate of young headwater forests of western Oregon. For. Sci. 2007, 53, 254–269. [Google Scholar]
- Rykken, J.; Chan, S.S.; Moldenke, A.R. Headwater riparian microclimate patterns under alternative forest management treatments. For. Sci. 2007, 53, 270–280. [Google Scholar]
- Franklin, J.F.; Forman, R.T. Creating landscape patterns by forest cutting: Ecological consequences and principles. Landsc. Ecol. 1987, 1, 5–18. [Google Scholar]
- Thomas, J.W.; Franklin, J.F.; Gordon, J.; Johnson, K.N. The northwest forest plan: Origins, components, implementation experience, and suggestions for change. Conserv. Biol. 2006, 20, 277–287. [Google Scholar]
- Washington Department of Fish & Wildlife. Washington State Species of Concern Lists. Available online: http://wdfw.wa.gov/conservation/endangered/list/Amphibian/ (accessed on 25 September 2014).
- Oregon Department of Fish and Wildlife. Sensitive Species List (2008). Available online: http://www.dfw.state.or.us/wildlife/diversity/species/docs/SSL_by_taxon.pdf (accessed on 29 October 2014).
- Ruzicka, K.J., Jr.; Olson, D.H.; Puettmann, K.J. Management of riparian buffers: Upslope thinning with downslope impacts. For. Sci. 2014, 60, 881–892. [Google Scholar]
© 2014 by the authors; licensee MDPI, Basel, Switzerland. This article is an open access article distributed under the terms and conditions of the Creative Commons Attribution license (http://creativecommons.org/licenses/by/4.0/).
Share and Cite
Olson, D.H.; Burton, J.I. Near-Term Effects of Repeated-Thinning with Riparian Buffers on Headwater Stream Vertebrates and Habitats in Oregon, USA. Forests 2014, 5, 2703-2729. https://doi.org/10.3390/f5112703
Olson DH, Burton JI. Near-Term Effects of Repeated-Thinning with Riparian Buffers on Headwater Stream Vertebrates and Habitats in Oregon, USA. Forests. 2014; 5(11):2703-2729. https://doi.org/10.3390/f5112703
Chicago/Turabian StyleOlson, Deanna H., and Julia I. Burton. 2014. "Near-Term Effects of Repeated-Thinning with Riparian Buffers on Headwater Stream Vertebrates and Habitats in Oregon, USA" Forests 5, no. 11: 2703-2729. https://doi.org/10.3390/f5112703