Article

Dendrochronological Potential in a Semi-Deciduous Rainforest: The Case of Pericopsis elata in Central Africa

1
Wood Biology Service, Royal Museum for Central Africa, 3080 Tervuren, Belgium
2
Laboratory of Wood Technology, Ghent University, 9000 Ghent, Belgium
*
Author to whom correspondence should be addressed.
Forests 2014, 5(12), 3087-3106; https://doi.org/10.3390/f5123087
Submission received: 3 November 2014 / Revised: 28 November 2014 / Accepted: 28 November 2014 / Published: 12 December 2014

Abstract

:
The long-lived pioneer species Pericopsis elata is one of the rare tropical timbers on the list of the Convention on International Trade of Endangered Species, supporting the need for accurate and reliable growth data. In one planted and one natural forest in the Democratic Republic of Congo, respectively four and 37 Pericopsis stem disks were collected. The tree-ring series of planted trees were used to confirm annual tree-ring formation. For the natural forest, a tree-ring chronology with 24 stem disks ranged from 1852 up to 2008. This chronology was compared with time-series of local precipitation, resulting in a significant correlation with the second half of the rainy season (September–November). This seasonal precipitation was related with sea surface temperatures of the West Indian Ocean. Higher precipitation during El Niño years corresponded with higher tree-ring indices but differences were not significant. In addition, pointer years were rare and did not have a consistent link with extreme climatic conditions. The existence of annual tree rings encourages further tree-ring analyses of P. elata and other flagship timber species in order to further document climate-growth responses and to provide the long-term framework that is needed for sustainable management planning.

1. Introduction

The advantages of tree-ring analyses are well known and multifold. Tree rings provide growth data from the past up to the present [1], enable the exact dating of growth and/or climatic events [2,3] and aid in reconstructing climatic time-series beyond the age of instrumental registration [4,5]. In addition, tree-ring series are used to calculate logging parameters and productivity [6] as well as to estimate growth of carbon stocks [7,8]. Briefly, tree-ring analysis in combination with sound inventory data and density measurements could provide a complete toolbox for estimating sustainable yield, biomass growth, and forest management at the long term [9].
On the other hand, tree-ring analysis in the tropics was longtime believed to be impossible due to a lack of seasonality [10]. Although Worbes [11] looks back on more than a century of successful tropical tree-ring studies, he admits that challenges are still huge and the potential of most tree species remains unknown. If tree-ring research in the tropics were to be separated into two types, the first type deals with general “qualitative” studies on the potential of tree-ring analysis of one or several species within one region [12,13] whereas the second type considers detailed “quantitative” studies on a small number of well-known tree species like Tectona grandis L.f. [14,15] and Cedrela odorata L. [16,17,18]. “Qualitative” tree-ring analyses rely on one of the first features on the feature list of the International Association of Wood Anatomists (IAWA) [19]: the distinctness of tree rings. The study of these wood anatomical structures enables researchers to make a first selection of species with clear tree-ring boundaries, before proceeding with quantitative tree-ring analyses. “Quantitative” tree-ring analyses or dendrochronology implies tree-ring measurements and proper crossdating, meaning that patterns of narrow and wide rings should coincide at least between different radii of one tree, to permit exact dating of the year of formation [20].
Both types of tree-ring studies are often found in tropical South America (e.g., [21,22]) followed by the South East Asian region (e.g., [23,24]). In subtropical to semi-arid Africa, quantitative tree-ring studies are represented by the work of e.g., [25,26,27]. Tarhule and Hughes [12] use wood anatomical features to describe the potential of 70 tree species from semi-arid West Africa.
Especially in tropical Africa, detailed tree-ring analyses are lacking although a lot of qualitative studies have been launched from the 1960s onwards [28,29,30,31]. To our knowledge, the work of Schöngart et al. [4], Worbes et al. [32] and De Ridder et al. [33,34] are the only quantitative tree-ring studies on canopy tree species from Central and West Africa. Recently, Groenendijk et al. [35] studied the dendrochronological potential of 22 commercial tree species from Cameroon. Although 14 out of 22 had clear rings, crossdating was difficult and no tree-ring chronologies could be constructed. Dendrochronology is still in its initial stage in Africa [36] but the potential of tree-ring analyses is enormous across a continent that does not have long climatic time-series and where the impact of global warming and extreme climatic events is largely unknown.
Obviously, the choice of sample species for dendrochronological studies in tropical Africa should be considered carefully. Even though Pericopsis elata (Harms) Meeuwen was only mentioned once as a “species with growth rings” [37], there are numerous reasons to justify its choice. First of all, P. elata is a flagship species of semi-deciduous tropical forests throughout its distribution range, from the Ivory Coast up to the Democratic Republic of Congo (DRC) [38]. Its deciduous character also implies that P. elata is more likely to form tree rings than evergreen species [36]. P. elata is classified as a (long-lived) pioneer light-demanding species [38] and samples were taken close to the upper margin of its climatic distribution, supporting a high climate-sensitivity of the common growth signal [39]. Next to the ecological importance, P. elata is valued for its high-quality wood. Since the 1950s, large-scale exploitation began in West Africa and is still ongoing in Central Africa [38]. In the DRC, the applied minimum logging diameter is set at 60 cm but data describing the management are scarce, including potential solutions to compensate for the deficit of natural regeneration [38]. Due to the reduced stocks of P. elata, the species is now included in the CITES (Convention on International Trade in Endangered Species of Wild Fauna and Flora) Appendix II [40] and called “Endangered A1cd” on the IUCN list [41]. Appendix II-listed species need export and import licenses that are checked by the CITES scientific authorities from exporting and importing countries [38]. In order to better document non-detriment findings, the objective of this paper is: (a) to check if Pericopsis elata has distinct annual tree rings that can be crossdated and (b), to explore growth responses to interannual climate variability and to extreme climatic events (precipitation, sea surface temperatures, and El Niño indices).

2. Material and Methods
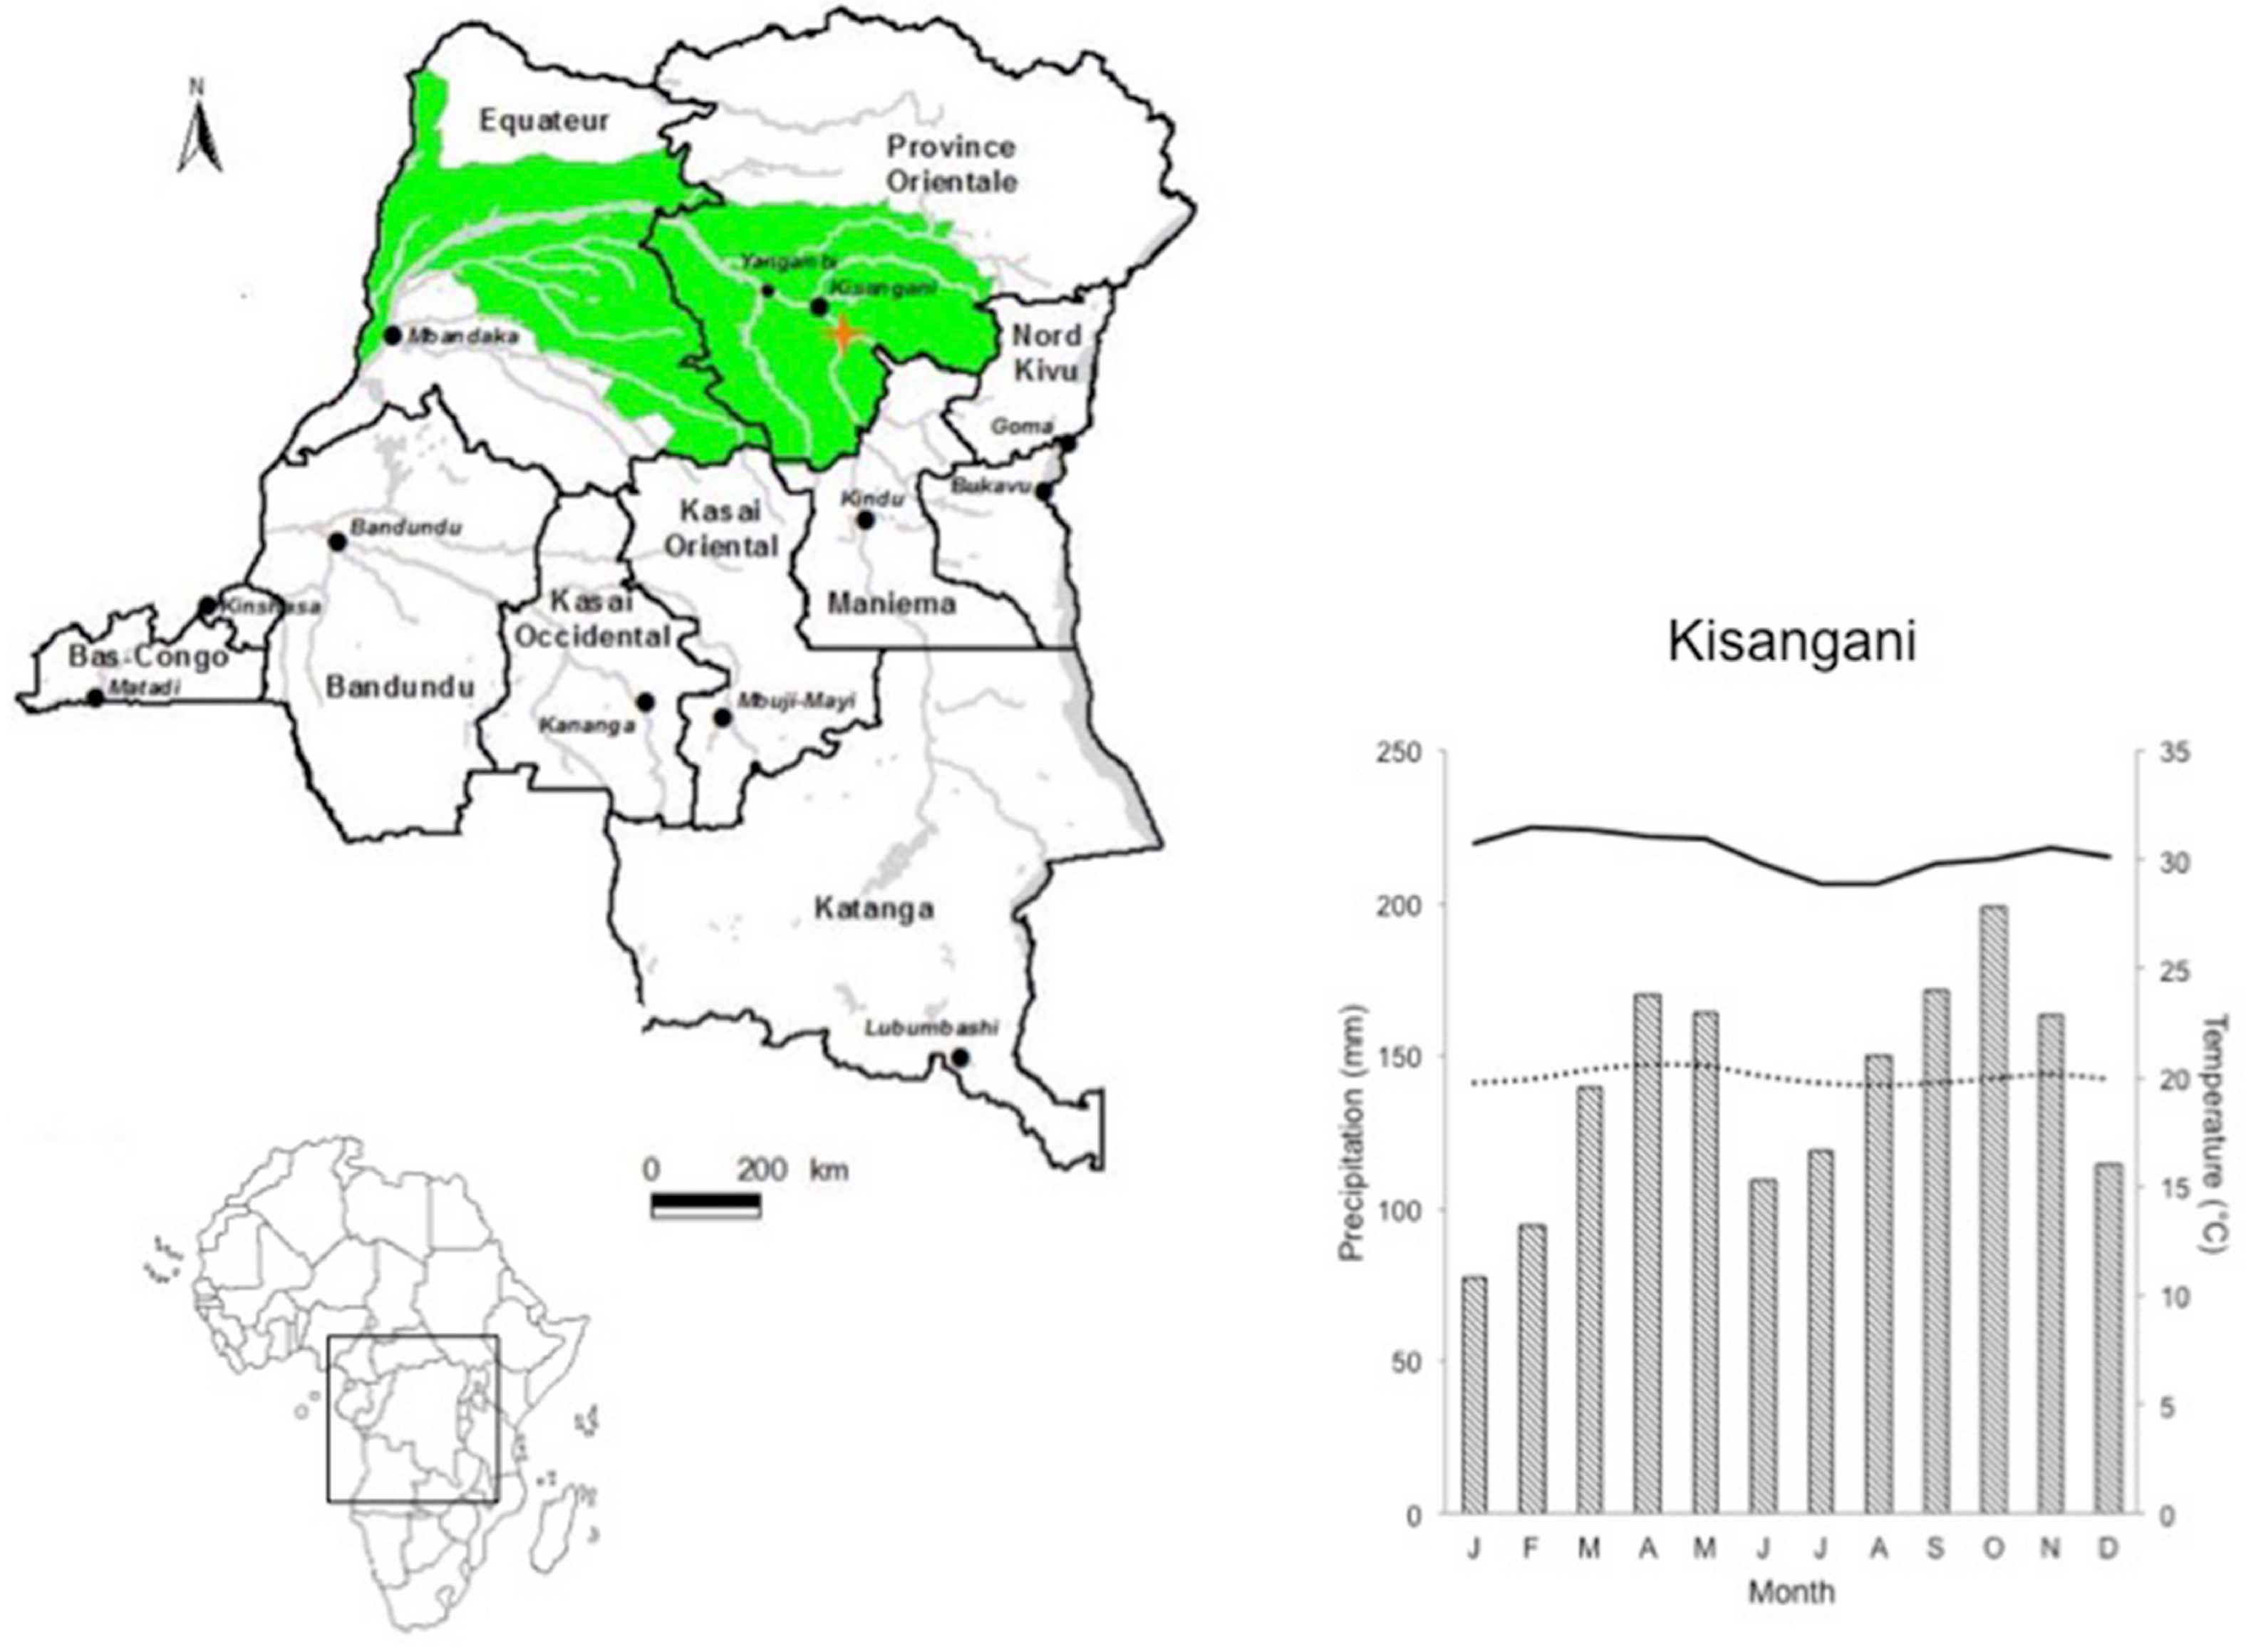
2.1. Sample Area

Natural Congolese forests with P. elata were sampled in the Oriental Province in Biaro (0°14′ N, 25°18′ E), 30 and 100 km southeast of Kisangani and Yangambi (Figure 1), respectively. Those semi-deciduous forests are part of the Guineo-Congolean regional center of endemism [42]. Right next to this natural forest, in Yoko, P. elata trees—planted in the 1950s—were sampled to provide additional proof for the annual character of tree-ring formation. The average annual precipitation, based on data collected between 1908 and 2008 [43] is 1672 mm. In general, there are no dry months according to the definition of Worbes ([17], <60 mm) but January and February have less than 100 mm of precipitation. The rainy season goes from March to November with drier conditions in summer (June–July). Relative humidity is as high as 90% to 95%. Temperatures do not vary a lot with a mean annual temperature of 25.1 °C and with maximum temperatures in February (32.0 °C) and minimum temperatures in August (19.7 °C).
Our study site is situated at about 400 m above sea level (a.s.l.), with only small differences in elevation [44]. Geological substrates are composed of a mixture of sandstone, red clay, marl, and limestone. The upper part of soils have good physical conditions (macro and micro porosity) due to an aggregated structure of elementary constituents, limited chemical fertility (CEC = 2–8 méq per 100 g), marked acidity (pH from 3.5 to 5.5), the presence of exchangeable aluminum and a strong retention of phosphor [45].
Figure 1. Location of the sample area within the African continent and the Democratic Republic of Congo (orange cross, after [46]), along with the climate diagram of Kisangani (1908–2008 for precipitation and 1940–2008 for temperatures; minimum temperature = dashed line and maximum temperature = solid line). Climate data were extracted from the KNMI Climate Explorer [43]. The green area indicates the distribution area of P. elata.
Forests 05 03087 g001

2.2. Sampling Stem Discs

Four and 37 stem discs, respectively, were collected in the planted forest at Yoko and the natural forest of Biaro. Every stem disc corresponds to one tree, but not all stem discs were taken at the same height. If possible, a stem disc was taken at the base of the trunk in order to obtain the maximum number of tree rings. If trunks were damaged at the base, a stem disc was collected higher. Notes on the sampling height are taken and validated during the crossdating process. Stem discs were collected in 2008, transported and subscribed with Tw-numbers in the Tervuren Xylarium of the Royal Museum for Central Africa. Stem discs were superficially disinfected and sanded with a gradually increasing grid from 50 to 1200.

2.3. Tree-Ring Measurements and Chronology Building

In general, all tree rings were marked on three to five radii before measuring. Every tenth ring was followed along the circumference to check if missing or false rings occurred. In case of missing / false rings, individual tree rings were followed to identify the exact location of those tree-ring anomalies. After tree-ring marking, ring widths were measured to the nearest 0.01 mm with a stereomicroscope and a Lintab device with TSAP-Win™ software [47].
After the measurements, the resulting tree-ring series were crossdated at the tree level. This means that tree-ring series are pairwise compared to check for matching patterns of narrow and wide tree rings [20]. If the growth patterns match, an average tree-ring series per tree is made. Those tree-ring series are compared with the other trees from the sample site in order to construct one site chronology with all trees showing a common growth pattern.
Next to visual control and knowledge of the wood anatomical structure of P. elata tree rings, three parameters are taken into account during the crossdating process: the Pearson’s correlation (r), the t-value of Baillie-Pilcher (t_BP, [48]) and the Gleichläufigkeit (Glk, [49]). Individual trees with matching tree-ring series, meaning a t-value and Glk higher than the thresholds (Glk > 60, t_BP > 2.0), were merged into the site chronology. Full details on the applied thresholds can be found in Trouet et al. [26]. Age trends were checked by calculating autocorrelation (AC) of the site chronology. If present, age trends were removed with a one-sided moving average over five years to permit dendroclimatological analysis [48,50]. This type of transformation was created by Baillie & Pilcher [48]. Normalization is achieved by taking log to base e of the residual values [47,48]. The expressed population signal (EPS) indicates how well a restricted sample represents the theoretical population of all Pericopsis trees (threshold of 0.85; [51]).

2.4. Climate-Growth Relationships

Climate-growth relations were divided into two subtypes: (1) relations that are based on the response of P. elata growth to interannual climate variability and (2) relations between extreme years of growth and climate.

2.4.1. Growth Response to Interannual Climate Variability

The final site chronology will be compared with climate at three different scales: with monthly, seasonal and annual precipitation (local), with monthly sea surface temperatures (SSTs) of the surrounding oceans (regional) and with annual ENSO-indices (El Niño-Southern Oscillation; global). Climate data and/or correlation maps were generated with the KNMI Climate Explorer [43,52], covering a period of one century (1908–2008). Relations with periodical precipitation are based on simple correlations with the standardized ring-width indices of the site chronology. Next, correlation maps were made between monthly SST fields on the one hand and growth and precipitation on the other hand. This way, it becomes possible to identify the oceanic regions where the SSTs correlate with precipitation and/or growth. Finally, correlation maps are created between annual SST indices for the Niño3.4 region [53] and gridded for monthly and seasonal precipitation (CRU T.S3.0; [54]). Growth in ‘normal’ and ENSO-years was compared using two sample tests [55] in order to verify if ENSO had a significant influence on the growth of Pericopsis in Central Africa. The definition of Trenberth [56] was used to differentiate ENSO-years.

2.4.2. Pointer Years and Extreme Climate Events

An event year is an extreme narrow or large tree ring within one tree. If such an extreme tree ring width is repeated along several tree-ring series, the year of formation of this tree ring is called a pointer year. A positive pointer year means that growth was extremely high whereas a negative pointer year means that growth was very limited. Pointer years are proven indicators of changes in the environment of trees (climate, management, pollution…) and are calculated using a normalization in a moving window of 5 years [2]:
z i =   x i a v e r a g e ( w i n d o w ) s t d e v ( w i n d o w )
zi = Tree-ring value of the year i after transformation; xi = standardized tree-ring value in the year i average (window) = mean tree-ring width within the window xi-2, xi-1, xi, xi+1, xi+2; stdev (window) = standard deviation of the tree-ring widths within the window xi-2, xi-1, xi, xi+1, xi+2.
Thresholds on zi determine negative and positive event years. All values of zi ≤ −0.75 are defined as negative event years whereas all values of zi > 0.75 are positive event years. If an event year is encountered in 80% of all trees within one site, it is believed to be a pointer year [2].
Pointer years will be compared with extremely dry or wet years. The five wettest and driest years as well as their equivalents for precipitation from September to November were extracted from the climate data. Years with a real dry season of at least 2 months (sensu Worbes [17], monthly precipitation < 60 mm) were added. Within this list of years, the presence of ENSO events was marked as well as growth increases/decreases of the tree-ring chronology (with at least 10%).

3. Results

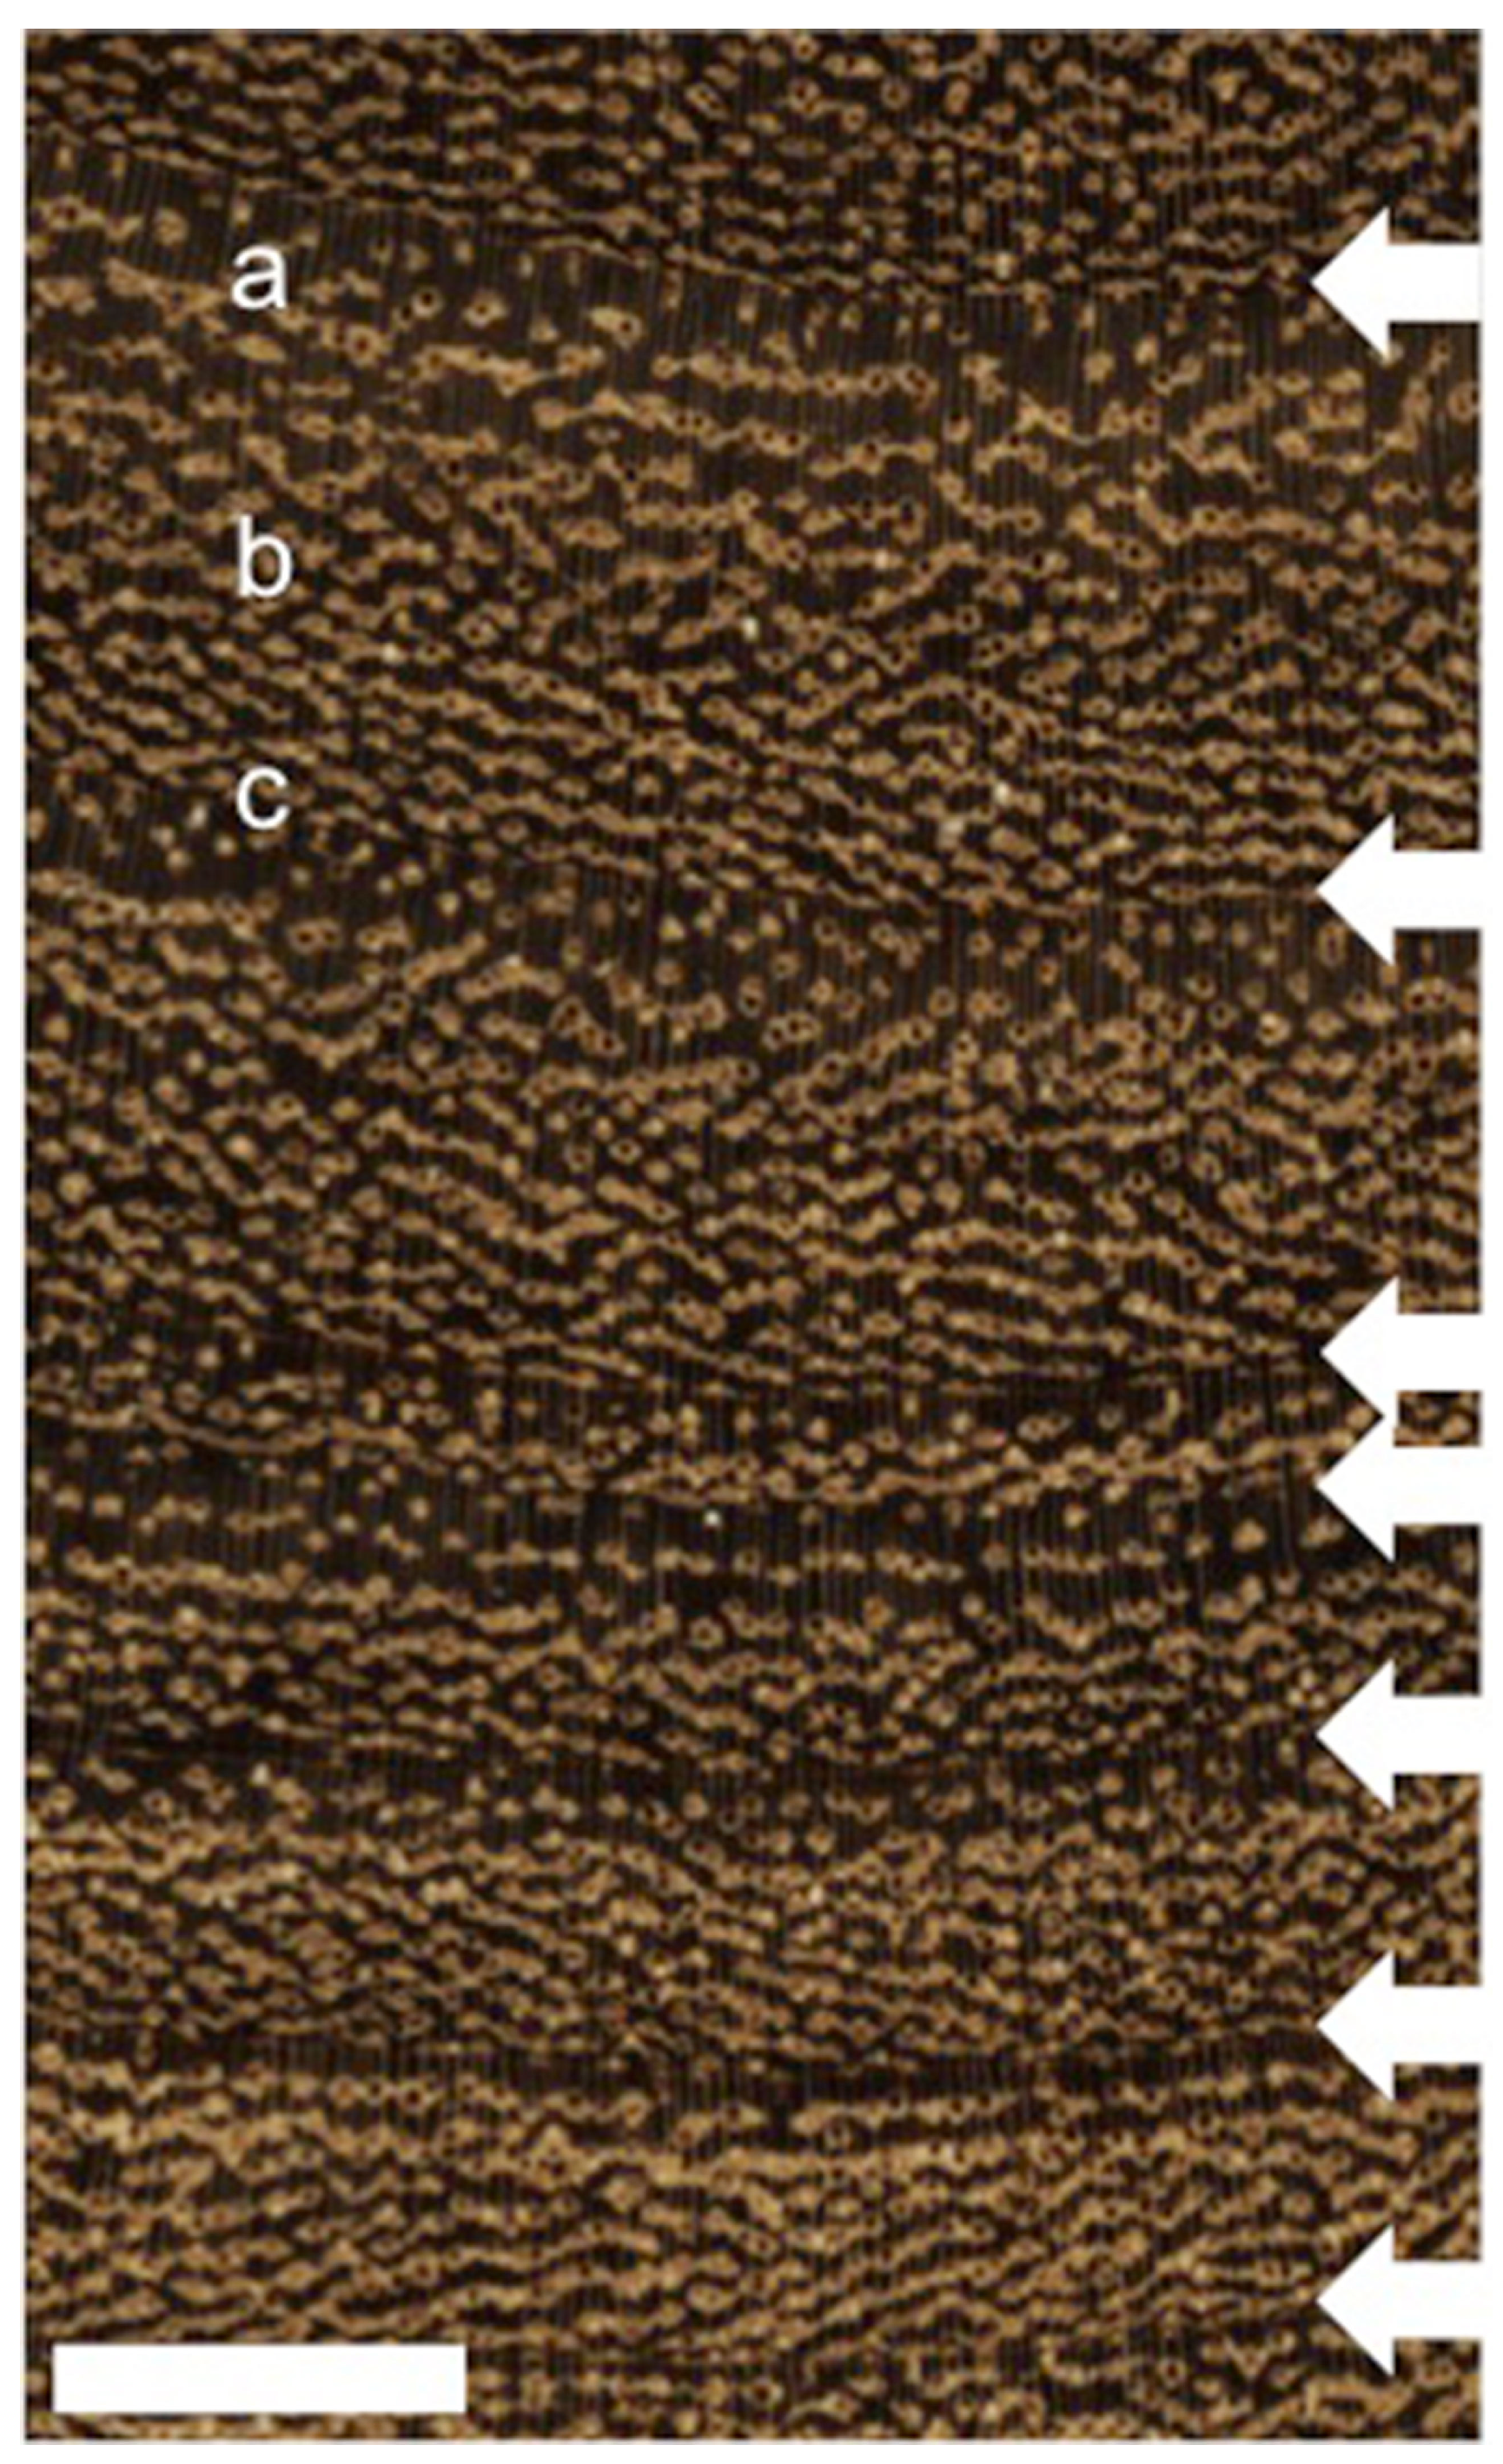
3.1. General Tree-Rings Characteristics of Pericopsis Elata

Distinct tree rings were observed on every stem disc of planted and natural trees. At the start of a tree ring (Figure 2), a zone with lesser vessels and with aliform parenchyma occurs. Afterwards, the density of vessels increases along with the amount of parenchyma that becomes confluent to banded towards the end of a tree ring. At the tree-ring boundary, a thin line of marginal parenchyma can be found although the presence of flattened fibers is more commonly observed. This general wood anatomical structure is mostly found in the middle part of the tree-ring series, when trees grow quite fast. The first juvenile tree rings and the more recent tree rings of mature trees are generally smaller and the gradual evolution of vessel density and aliform to confluent parenchyma is often absent. There, tree-ring distinction is based only on the flattened fibers and the small zone with fewer vessels. This also explains the occurrence of most of the tree-ring anomalies in these parts. False rings are rare but partially missing rings, due to wedging, are found in the outer part of most stem discs.
Figure 2. High-resolution scan of a polished stem disc of Pericopsis elata. The pith is situated at the top, the bark at the bottom of the scan. The white arrows indicate tree-ring boundaries. From above to below, a zone with fewer vessels and aliform parenchyma (a), a zone with more vessels and confluent parenchyma (b) and the tree-ring boundary (c) are visible. The flattened fibers at the tree-ring boundary are hard to distinguish on the scan but marginal parenchyma lines can be noticed in the lower tree rings. The white bar represents 5 mm.
Forests 05 03087 g002

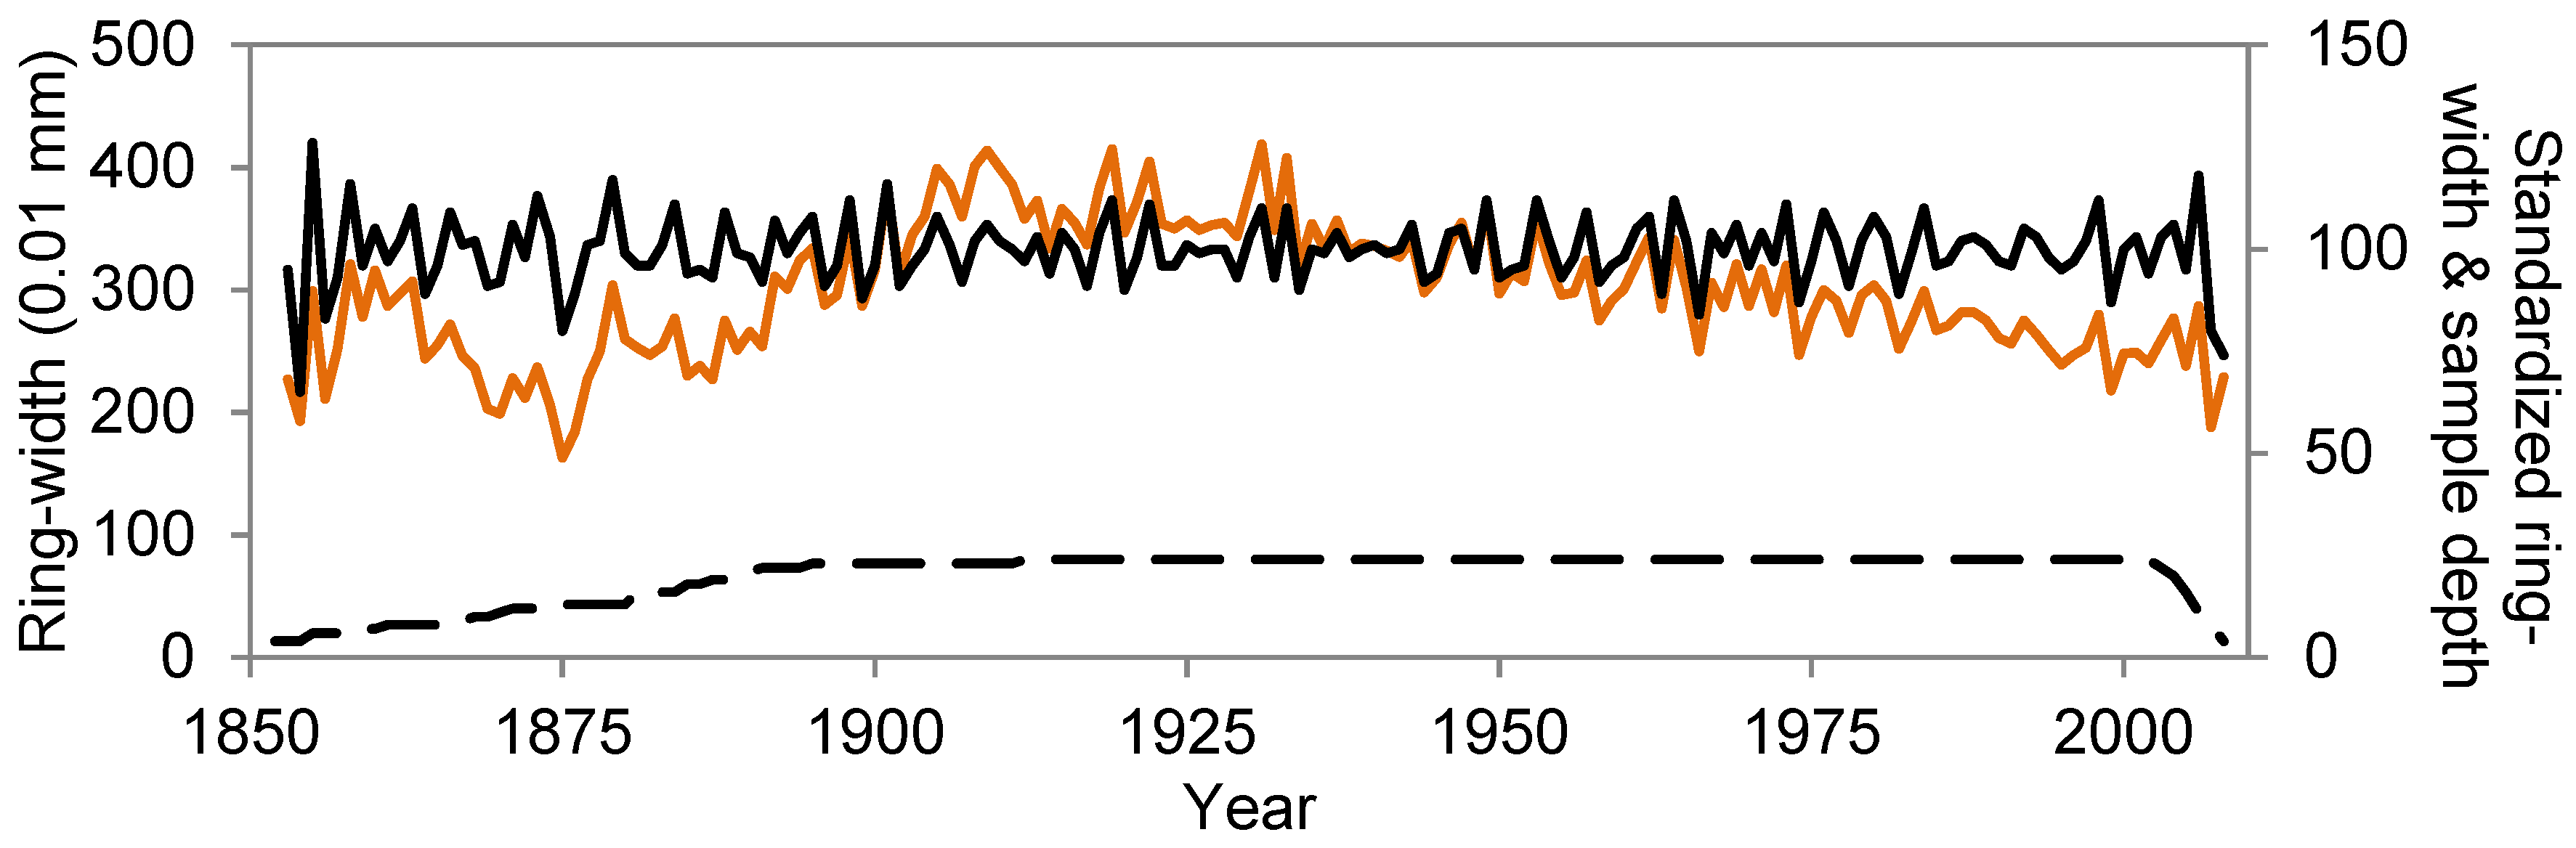
3.2. First Pericopsis Tree-Ring Chronology

The four planted Pericopsis trees were dated back to 1954–1957, similar to the planting period. A difference up to three years was observed but can be attributed to the height of sampling. Because of the young age of the trees (<60 years) and the lack of crossdating between trees, the planted trees were not considered for further chronology building and dendoclimatological analyses.
Concerning the ages of trees from the natural forest, the youngest tree had 97 rings while the oldest one had 199 rings. Based upon the tree-ring measurements and corrections for tree-ring anomalies, 24 stem discs could be crossdated within and between trees, allowing for the construction of the first tree-ring chronology of Pericopsis elata to our knowledge (Figure 3). If tree-ring anomalies are numerous (>five/radius), corrections become difficult, resulting in tree-ring series that do not crossdate sufficiently, even at the tree level. This was the case for 13 stem discs that were rejected for inclusion in the chronology. The final chronology revealed a rather strong age trend (AC, see Table 1) that coincided with the growth patterns described in Section 3.1. This age trend was successfully removed by standardization of the chronology. Although crossdating parameters are not always high (low correlation values, no significant overall Pearson correlation), visual inspection confirmed correct crossdating between the trees. The EPS of the crossdated trees is lower than the threshold of 0.85.
Figure 3. First tree-ring chronology of Pericopsis elata between 1852 and 2008. The upper part of the graph shows the measured (orange line) and standardized (black line) tree-ring chronology. The lower part shows the number of samples included in the chronology throughout time. A threshold of four samples per year is set to guarantee a well-replicated tree-ring chronology.
Forests 05 03087 g003
Table 1. Characteristics of the Pericopsis elata site chronology: the number of samples used and included (total n samples, n samples in chrono), diameter, number of tree rings, timespan, mean growth, autocorrelation (AC), pearson correlation between trees (r), expressed population signal (EPS).
Total n samples37
n samples in chrono24 (65%)
Mean diameter (cm)82 ± 13
Mean number of tree rings137 ± 23
Time span chronology1852–2008 (157 years)
Mean ring width of chronology (mm)2.98 ± 0.54
AC0.78
Pearson r0.10
EPS0.73

3.3. Climate-Growth Relationships

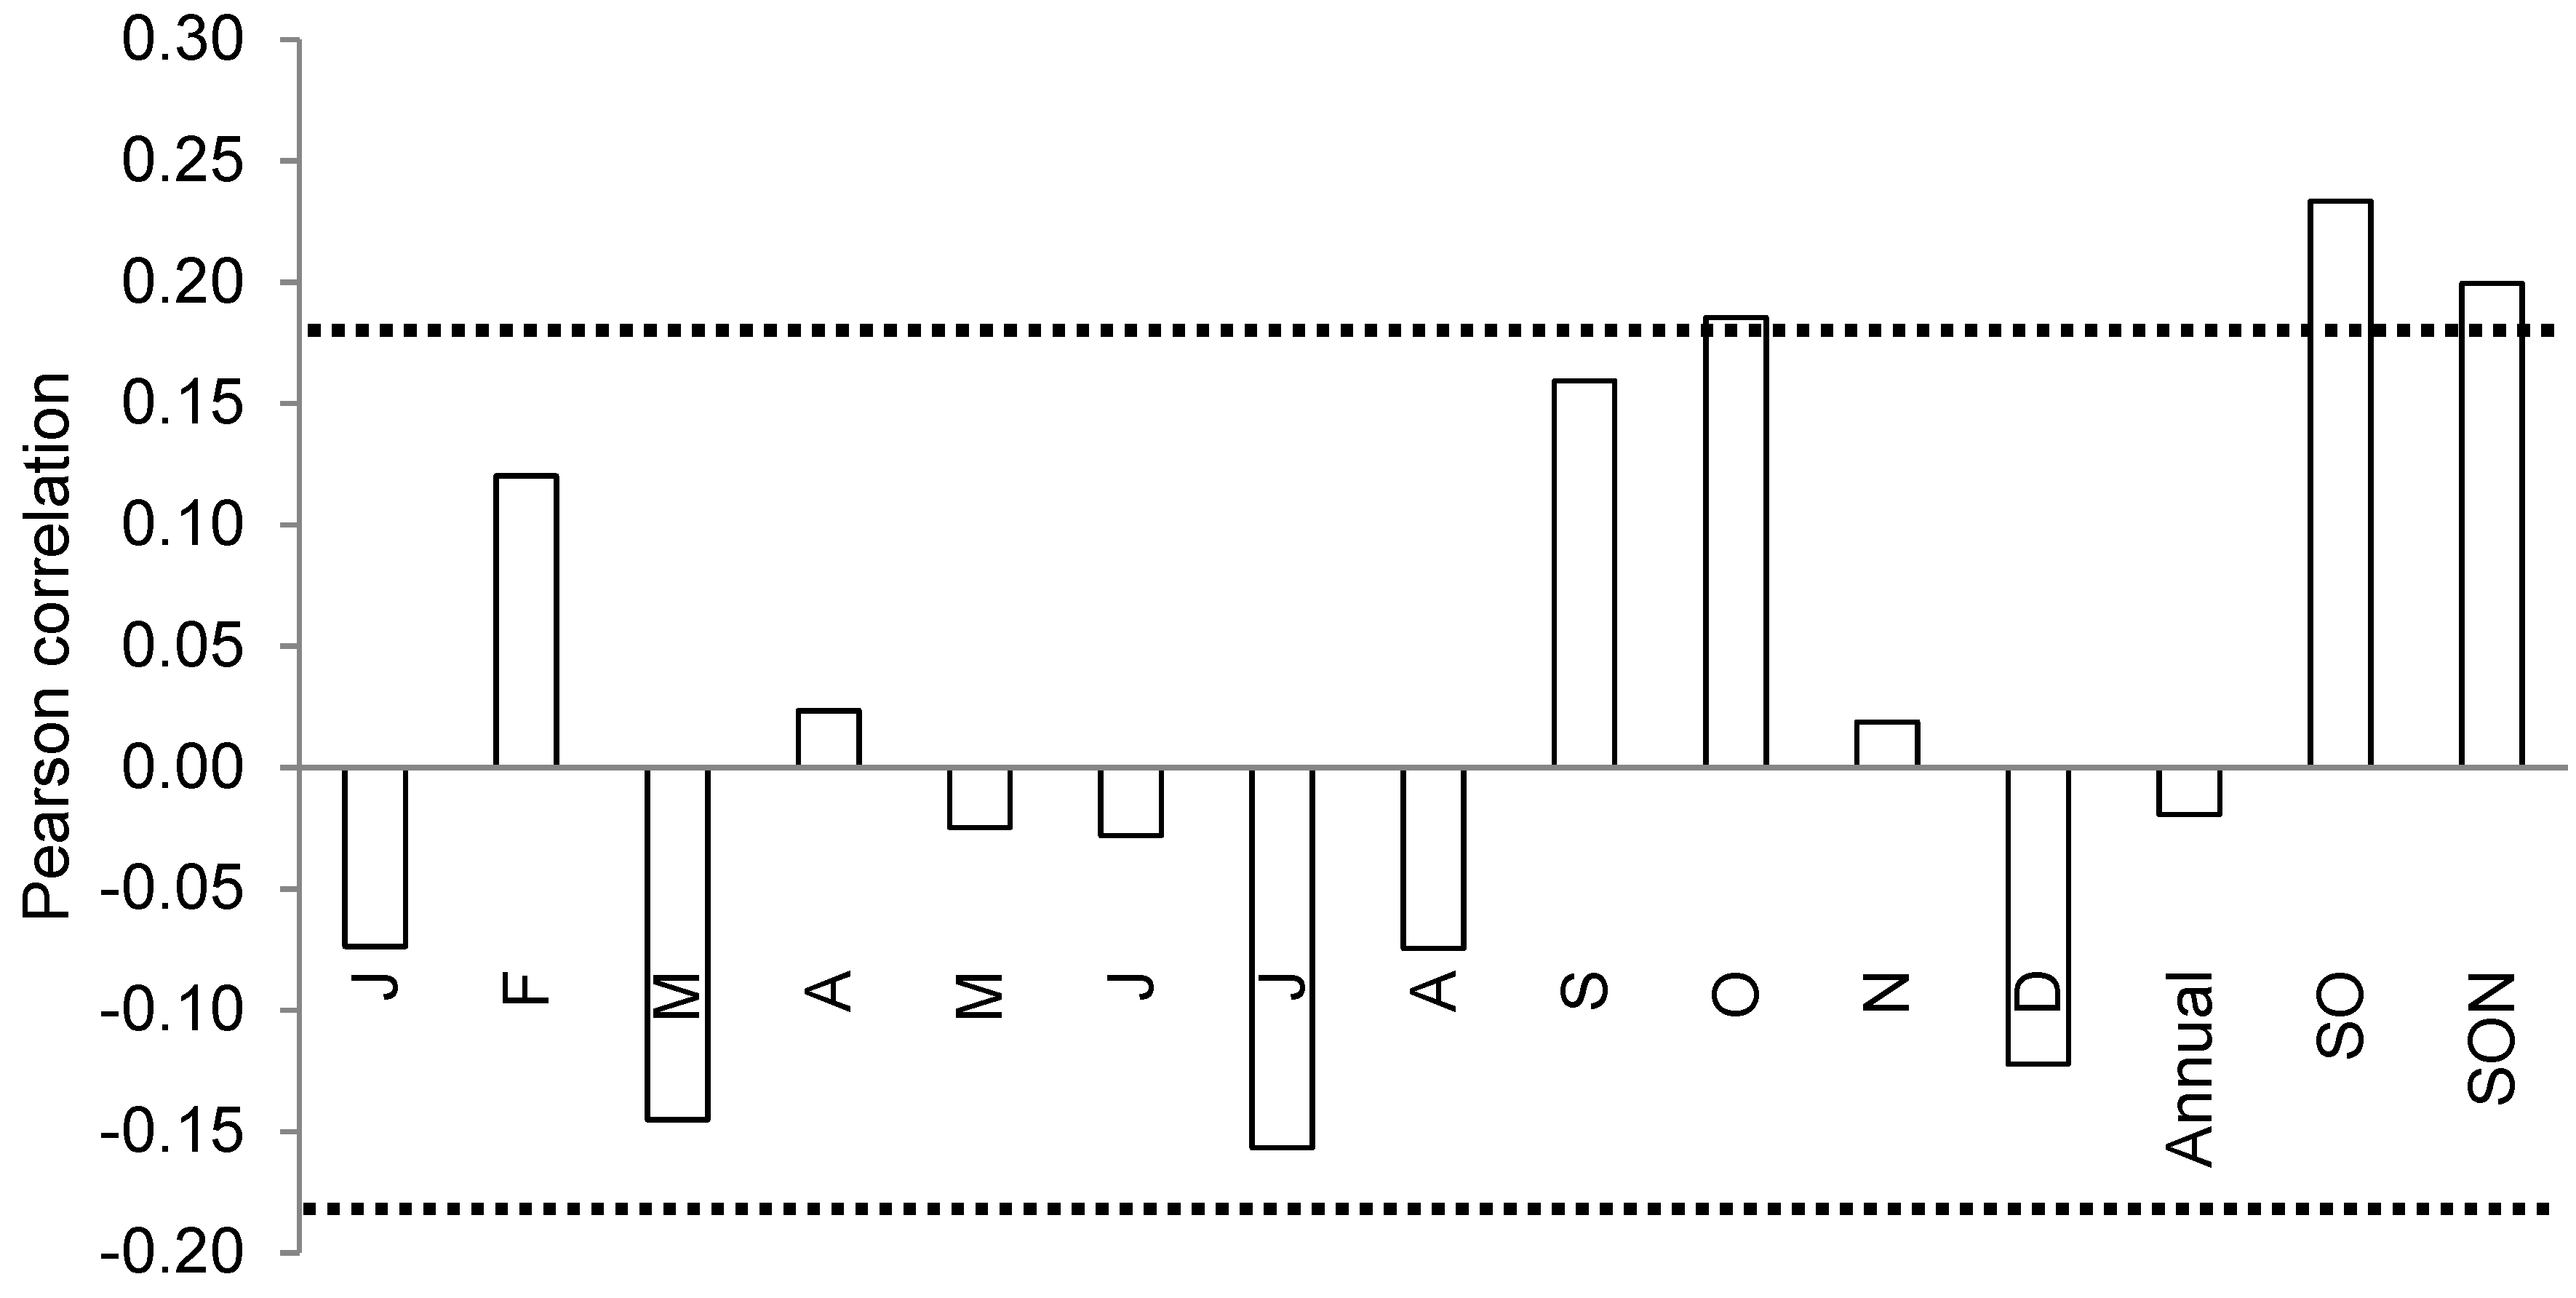
3.3.1. Growth Response to Interannual Climate Variability

At a local scale, the tree-ring chronology correlates positively with October precipitation (p < 0.05) (Figure 4). This correlation becomes stronger when September–October (–November) precipitation is summed. October is the month with the highest precipitation values throughout the year and September and October are the two central months within the second half of the rainy season. Annual precipitation does not correlate with tree-ring indices of P. elata.
Figure 4. Correlation between monthly, seasonal, and annual precipitation and tree-ring indices of Pericopsis elata. The dotted lines represent the p < 0.05 level. All time-series run from 1908 to 2008.
Forests 05 03087 g004
At a regional scale, the precipitation during the second half of the rainy season was correlated to the gridded SSTs of the surrounding ocean regions (Figure 5a). Among the tested combinations of precipitation and SSTs, the combination of October–November precipitation with gridded September–November SSTs showed a positive influence of the SSTs of the West Indian Ocean. Higher SSTs during September–November corresponded with higher precipitation in the second half of the rainy season. However, the influence of SSTs on tree growth of P. elata is only indirect because correlation maps between tree growth and September–November SSTs did not result in significant correlations.
At a global scale, a positive relation was observed between El Niño 3.4 indices and precipitation during the second half of the rainy season (Figure 5b). This means that higher September–November precipitation occurs during positive ENSO years (El Niño years). After the extraction of El Niño and La Niña years, tree-ring indices were organized according to their year of formation. Growth differences were tested with a two-sample t test and although higher tree-ring indices were found during El Niño years, the differences with “normal” years are not significant.
Figure 5. Correlation maps between precipitation, SSTs and El Niño indices. (a) Correlation map between October–November precipitation and gridded September–November SSTs; (b) Correlation map between gridded September–November precipitation and annual El Niño 3.4 time-series. All time-series run from 1908 to 2008. The orange star indicates the sample forest of Pericopsis elata.
Forests 05 03087 g005

3.3.2. Pointer Years and Extreme Climate Events

Using the classical definition of a pointer year [2], no pointer years could be observed. If the threshold for an event year to convert into a pointer year was lowered to 50% presence in the sample trees, three pointer years were found. The year 1973 represents a negative pointer year whereas 1952 and 1963 are positive pointer years (Table 2).
Table 2 shows all extreme climate (first seven columns) and growth data (last three columns). Pointer years are calculated based on individual trees but the tree-ring chronology also reveals higher growth during the positive pointer years and lower growth during the negative pointer years. Still, other years with growth differences of more than 10% are not associated with pointer years. Moreover, the pointer years appear not at all linked with precipitation extreme values, nor with the presence of a “real” dry season [17]. For example, 1914 is an extreme wet year with a wet second half of the rainy season and a really dry season. Understandably, this year is marked by an El Niño event but trees did not react by forming a positive pointer year or an increased ring-width index. On the other hand, all three pointer years are linked with ENSO years. But again, other ENSO years do not provoke pointer years.
Table 2. Overview of the extreme precipitation data, along with the presence of El Niño-Southern Oscillation (ENSO) years. Tree-ring data were used to add pointer years. A growth increase or decrease in the tree-ring chronology of at least 10% was marked for all mentioned pointer years and years with extreme climate conditions. Data for Annual_dry (the five driest years), SON_dry (the five lowest September–November precipitation sums), Annual_wet (the five wettest years), SON_wet (the five highest September–November precipitation sums), Dry_60 (years with two months with <60 mm precipitation), El Niño and La Niña years were extracted for the timespan 1908–2008. Positive (+) and negative (−) pointer years (PY, in bold), along with 10% growth differences within the tree-ring chronology (Chrono-10%/Chrono+10%) were derived from tree-ring data.
YearAnnual_drySON_dryAnnual_wetSON_wetDry_60El NiñoLa NiñaPYChrono − 10%Chrono + 10%
1913X
1914 XXXX
1921X X
1927 X
1929 X
1930X X X
1931 XX
1932 X X
1942 X
1943 X X
1946 X
1947 X
1950 X X
1951X XX
1952 + X
1961 X
1962 X X X
1963 X + X
1967 XX
1971 X X
1972 X X X
1973 X-X
1977 XX
1978 X
1982 XX
1983 XX X
1985 X X
1993 X X
1994 X X
1995 X
1996XX X

4. Discussion

4.1. Growth Patterns and Tree-Ring Chronology of Pericopsis elata

Although P. elata was not yet part of any tree-ring studies, except from one mention within a general species description [37], the presence of tree rings was not unexpected. Within the family of the Fabaceae, several species were marked as “potentially useful” for dendrochronological studies [12]. Other species from the Fabaceae were already crossdated successfully in West Africa [4]. In addition, the common presence of marginal parenchyma in Fabaceae [57] often indicates a clearly marked tree-ring boundary [4,12]. The main difficulties apart from unclear juvenile rings could be related to wedging rings in the outer part of the stem discs. This wedging effect did not consistently occur in slow growing parts between buttresses [11,33,35] but is often observed on the short radii of eccentric stem discs [18].
Next, two methods proved the annual character of tree rings: the analysis of four planted trees and crossdating within and between trees [58]. Visual inspection of the patterns of wide and narrow ring-widths is crucial in the tropics [26,33] because inter-tree correlations are usually rather low. Inter-tree correlations for P. elata are comparable to Terminalia superba Engl. & Diels from the Ivory Coast [33] and Brachystegia spiciformis Benth. from southern Africa [26] but lower than for six tree species in West Africa [4]. This is also reflected in a low EPS, suggesting that further sampling might be necessary to distinguish the common growth signal in relation to climate.
On the other hand, the percentage of trees included in the tree-ring chronology (65%) is similar [16,18] or higher [4] than in other tropical tree-ring studies. Finally, the length of this tree-ring chronology (>150 years) is quite remarkable for a long-lived pioneer species of which the oldest tree in the sample set was about 200 years. Most tree-ring chronologies from the tropics range between 50 [33] to 110 years [16,59] or up to 150 years in semiarid southern Africa [26]. Only in one study [4], three out of six species from Ivory Coast produced tree-ring chronologies of at least 200 years. The presence of a long Pericopsis tree-ring chronology and extended time-series of interpolated climate data [43] enable the study of climate/growth relationships within a timeframe of one century, likely compensating for the inferior EPS.

4.2. Climate-Growth Response of Pericopsis Elata

Contrary to most other studies [16,18,33], growth of P. elata does not correlate with precipitation during the whole or the beginning of the rainy season. Correlations with precipitation during the second part of the rainy season exist but are limited [59,60]. In Panama [60], this late precipitation response was related to a short dry season just before the period of significant correlations, while in the DRC [59], two understory species had deeper root systems that permitted to use soil water during the first months of the rainy season. There is no literature available on the root system of P. elata but superficial root systems were encountered during several fieldwork campaigns (Nils Bourland, pers. comm.). However, the rainy season appears slightly divided into two periods (March–May, August–November) with two dry summer months in-between. In addition, October and September are the two wettest months of the year, possibly explaining the significant correlations with growth within those months. Phenological data are available from southeast Cameroon (similar precipitation patterns) [61], showing a peak in leaf shedding and flushing in resp. February and March. In Yangambi (100 km from our sample area), leaf fall is limited to 1 to 3 weeks and mostly occurs in March. Thus, leaf flushing and September–November precipitation appear not to be related. Dendrometer studies in combination with monthly microcores are recommended to study in further detail the link between wood formation and precipitation.
In addition, the work of Balas et al. [62] suggests that the precipitation variability in Central Africa might be remarkably complex compared to the rest of the continent, where interannual variability is coherent over very large sectors. This complexity relates to the multitude of factors influencing the region: the Indian and Atlantic Oceans, the intertropical convergence zone (ITCZ) and the African easterly jet. Presumably, the influence of the Atlantic decreases eastward whereas the influence of the Indian Ocean increases eastward. The influence of the ITCZ changes seasonally as this zone migrates through the region and a mid-level easterly jet influences the region much of the year [62]. Although precipitation might appear bimodal, no real dry months were found (from a dendrochronological point of view, sensu Worbes [17]) and a detailed climate study [62] also confirmed that the seasonal cycle is less pronounced in the sample area than in the western equatorial zone (Region 3 in [62]). This pseudo-bimodal precipitation pattern is also supported by the almost complete absence of double rings.
Subsequently, the relation between SST anomalies and precipitation was studied. Correlation maps showed that the SSTs of the West Indian Ocean were significantly related with late-rainy season precipitation. This is in accordance with the results of Balas et al. [62] who observed a growing importance of the western Indian Ocean in controlling rainfall variability in the late summer/early fall. Again, the factors governing interannual rainfall variability in this specific equatorial region (Region 5 in [62]) are complex and strongly depend on the season. The sign of SST anomalies of the Indian Ocean is the most important during September to November but the Atlantic influence is more important during the two drier periods (July–August, December–February). This complex interaction between rainfall and SSTs might partially explain why no direct correlation was found between growth and SSTs, in contrary to two other studies in West and Central Africa [4,33]. Both studies were performed in other climatic regions with a more pronounced control of rainfall variability by the Atlantic Ocean and the Gulf of Guinea.
Ultimately, El Niño 3.4 time-series were correlated with (grouped) monthly precipitation values, resulting in higher September-November precipitation during El Niño years. Actually, the El Niño phenomenon appears to be a major factor in rainfall variability in equatorial Africa during boreal summer and fall [62]. Detailed monthly responses to El Niño indices were modeled [63] and revealed that responses of precipitation around Biaro are negative during summer (June–August) and switch signs during fall (October–December). Growth indices increased during El Niño years but were not significantly higher, contrary to growth indices of T. superba [33]. Our results appear to confirm the results of Schöngart et al. [4] but in that case, the influence of El Niño was only present outside the growing season. Again, the complexity of the African equatorial region is not fully documented nor understood [63]. On the other hand, the common signal of the current tree-ring chronology might be slightly too weak to result in highly significant correlations with climate in general.
Therefore, we extracted different extreme years, climatic as well as growth-related. Although the method of pointer years [2] is well known, this technique has remained generally restricted to the temperate regions [64], except for one study in the dry tropics of Ethiopia [65]. Temperate trees have complete catalogues of tree-ring data and can respond to a lot more limiting factors than tropical trees, causing pointer years. For instance, 64 pointer years over 405 years of pine chronologies were identified on the Iberian Peninsula [66]. In our case, only three pointer years came out, after we lowered the threshold for a pointer year to 50% presence in the sample trees. Apart from the relation with positive and negative ENSO years, local precipitation extremes and pointer years were not linked. The low number of pointer years might be caused by the lower common signal in the population of sample trees or by the absence of limiting factors. Pointer years appear to be influenced by global climate phenomena like ENSO although the number of ENSO years is much higher than the number of pointer years. More samples, also from other tropical species, are necessary to document the role of pointer years. For now, the classical analysis of correlating interannual climate data with tree-ring chronologies appears the preferred method to check relations between growth and climate in tropical Africa.

5. Conclusions and Perspectives

Using planted trees and successful crossdating proved the dendrochronological potential of P. elata. Although inter-tree correlations of tree-ring series are low, relations between interannual growth, local and regional climate variability exist and could be used for climate reconstruction beyond instrumental registration [5]. More samples could not only increase the common growth/climate signal, they could also be used as temporal growth data for sustainable forest management [6,34]. Complementary, sound inventory data of the tree species are necessary to connect minimum logging diameters and rotation ages with the standing stock, ingrowth, mortality, and regeneration data. Finally, estimates of tree ages can also aid the dating of disturbances that permit the installation of P. elata forest stands [67].
Based on the promising tree-ring chronology of this CITES listed flagship species, other commercial and/or threatened tree species could also be selected for dendrochronological studies. Genera like Afzelia [4,35], Entandrophragma [32,35], Brachystegia [35], Daniellia [4,35], and Terminalia [32,33,35] are all found in tropical Africa and satisfy at least two conditions for successful dendrochronological studies: deciduousness, long-lived pioneer species, member of the Fabaceae, presence of marginal parenchyma, and/or crossdating possibilities. We recommend to focus on these mostly light-demanding species because they make up for the majority of the harvested and traded wood volumes in Africa, this way playing a crucial role within future sustainable forest planning [68].

Acknowledgments

The authors wish to thank the different teams of our local partners for administrative and technical support: the University of Kinshasa (including ERAIFT), the University of Kisangani, WWF Belgium, WWF DRC and INERA. We are indebted to Stijn Willen (Ghent University) for his invaluable help in sanding all disks. Financial support was provided by the Belgian Development Cooperation through the XYLADATE (RA14N3XYLADATE) project. This publication is the result of the research project XYLAREDD (AG/LL/165), implemented and financed within the framework of the AGORA program, supervised by the Belgian Federal Science Policy.

Author Contributions

All authors contributed extensively to this project. Maaike De Ridder checked the tree-ring measurements, performed all analyses, and took the lead in the writing process. Benjamin Toirambe did the fieldwork, marked and measured all tree rings, and provided literature references. Jan van den Bulcke helped with the interpretation of the tree-ring analyses and the construction of the correlation maps with the Climate Explorer. Nils Bourland has studied the ecology of Pericopsis and assisted actively during the writing process by providing structure and a vast body of literature for the introduction and discussion. Joris van Acker and Hans Beeckman are the heads of the two collaborating laboratories. Hans Beeckman is coordinator of both XYLAREDD and XYLADATE of which this publication is part. Joris van Acker and Hans Beeckman made suggestions on the structure of this article, assisted in the interpretation of the results, and, along with the other co-authors, they revised the first drafts of this manuscript.

Conflicts of Interest

The authors declare no conflict of interest.

References and Notes

  1. Zuidema, P.A.; Baker, P.J.; Groenendijk, P.; Schippers, P.; van der Sleen, P.; Vlam, M.; Sterck, F. Tropical forests and global change: Filling knowledge gaps. Trends Plant Sci. 2013, 18, 413–419. [Google Scholar] [PubMed]
  2. Schweingruber, F.H.; Eckstein, D.; Serre-Bachet, F.; Bräker, O.U. Identification, presentation and interpretation of event years and pointer years in dendrochronology. Dendrochronologia 1990, 8, 9–38. [Google Scholar]
  3. Baker, P.J.; Bunyavejchewin, S.; Oliver, C.D.; Ashton, P.M.S. Disturbance history and historical stand dynamics of a seasonal tropical forest in western Thailand. Ecol. Monogr. 2005, 75, 317–343. [Google Scholar] [CrossRef]
  4. Schöngart, J.; Orthmann, B.; Hennenberg, K.J.; Porembski, S.; Worbes, M. Climate-growth relationships of tropical tree species in West Africa and their potential for climate reconstruction. Glob. Change Biol. 2006, 12, 1139–1150. [Google Scholar] [CrossRef]
  5. Therrell, M.D.; Stahle, D.W.; Ries, L.P.; Shugart, H.H. Tree-ring reconstructed rainfall variability in Zimbabwe. Clim. Dyn. 2006, 26, 677–685. [Google Scholar] [CrossRef]
  6. Schöngart, J. Growth-oriented logging (GOL): A new concept towards sustainable forest management in the vàrzea floodplains. For. Ecol. Manag. 2008, 256, 46–58. [Google Scholar] [CrossRef]
  7. Schöngart, J.; Arieira, J.; Fortes, C.F.; de Arruda, E.C.; da Cunha, C.N. Age-related and stand-wise estimates of carbon stocks and sequestration in the aboveground coarse wood biomass of wetland forests in the northern Pantanal, Brazil. Biogeosciences 2011, 8, 3407–3421. [Google Scholar] [CrossRef]
  8. Babst, F.; Moss, A.M.; Szejner, P.; Bouriaud, O.; Klesse, S.; Roden, J.; Ciais, P.; Poulter, B.; Frank, D.; Moore, D.J.P.; Trouet, V. A tree-ring perspective on the terrestrial carbon cycle. Oecologia. 2014. Available online: http://www.wsl.ch/fe/landschaftsdynamik/dendroclimatology/Publikationen/Babst_etal_Dendrochronologia_2014 (accessed on 28 October 2014). [CrossRef]
  9. De Ridder, M. Tree-ring analysis and stem biomass estimation of Limba (Terminalia superba Engl. & Diels) in the framework of sustainable forest management. Ph.D. Thesis, Ghent University, Ghent, Belgium, 26 June 2013. [Google Scholar]
  10. Schweingruber, F.H. Tree Rings: Basics and Applications of Dendrochronology, 1st ed.; Kluwer Academic Publishers: Dordrecht, the Netherlands, 1988. [Google Scholar]
  11. Worbes, M. One hundred years of tree-ring research in the tropic—A brief history and an outlook on future challenges. Dendrochronologia 2002, 20, 217–231. [Google Scholar] [CrossRef]
  12. Tarhule, A.; Hughes, M.K. Tree-ring research in semi-arid West Africa: Need and potential. Tree-Ring Res. 2002, 58, 31–46. [Google Scholar]
  13. Mbow, C.; Chhin, S.; Sambou, B.; Skole, D. Potential of dendrochronology to assess annual rates of biomass productivity in savanna trees of West Africa. Dendrochronologia 2013, 31, 41–51. [Google Scholar] [CrossRef]
  14. Pumijumnong, N. Dendrochronology in Southeast Asia. Trees. 2013. Available online: https://www.researchgate.net/profile/Nathsuda_Pumijumnong/publications (accessed on 28 October 2014). [CrossRef]
  15. Shah, S.K.; Bhattacharyya, A.; Chaudhury, V. Reconstruction of June-September precipitation based on tree-ring data of teak (Tectona grandis L.) from Hoshangabad, Madhya Pradesh, India. Dendrochronologia 2007, 25, 57–64. [Google Scholar] [CrossRef]
  16. Dünisch, O.; Montoia, V.R.; Bauch, J. Dendroecological investigations of Swietenia macrophylla King and Cedrela odorata L. (Meliaceae) in the central Amazon. Trees 2003, 17, 244–250. [Google Scholar]
  17. Worbes, M. How to measure growth dynamics in tropical trees. A review. IAWA J. 1995, 16, 337–351. [Google Scholar] [CrossRef]
  18. Brienen, R.J.W.; Zuidema, P.A. Relating tree growth to rainfall in Bolivian rain forests: A test for six species using tree ring analysis. Oecologia 2005, 146, 1–12. [Google Scholar] [CrossRef] [PubMed]
  19. Wheeler, E.A.; Baas, P.; Gasson, P.E. IAWA list of microscopic features for hardwood identification. IAWA J. 1989, 10, 219–332. [Google Scholar] [CrossRef]
  20. Douglass, A.E. Crossdating in dendrochronology. J. For. 1941, 39, 824–831. [Google Scholar]
  21. Bräuning, A.; Volland-Voigt, F.; Burchardt, I.; Ganzhi, O.; Nauss, T.; Peters, T. Climatic control of radial growth of Cedrela Montana in a humid mountain rainforest in southern Ecuador. Erdkunde 2009, 63, 337–345. [Google Scholar] [CrossRef]
  22. Worbes, M. Annual growth rings, rainfall-dependent growth and long-term growth patterns of tropical trees from the Caparo Forest Reserve in Venezuela. J. Ecol. 1999, 87, 391–403. [Google Scholar] [CrossRef]
  23. Pumijumnong, N.; Eckstein, D.; Sass, U. Tree-ring research on Tectona grandis in northern Thailand. IAWA J. 1995, 16, 385–392. [Google Scholar] [CrossRef]
  24. Berlage, H.P. Over het verband tusschen de dikte der jaarringen van Djatiboomen (Tectona grandis L.f.) en den regenval of Java. Tectona 1931, 24, 939–953. [Google Scholar]
  25. Krepkowski, J.; Bräuning, A.; Gebrekirstos, A. Growth dynamics and potential for cross-dating and multi-century climate reconstruction of Podocarpus falcatus in Ethiopia. Dendrochronologia 2012, 30, 257–265. [Google Scholar] [CrossRef]
  26. Trouet, V.; Esper, J.; Beeckman, H. Climate-growth relationships of Brachystegia spiciformis from the miombo woodland in south central Africa. Dendrochronologia 2010, 28, 161–171. [Google Scholar] [CrossRef]
  27. David, E.T.; Chhin, S.; Skole, D. Dendrochronological potential and productivity of tropical tree species in western Kenya. Tree-ring Res. 2014, 70, 119–135. [Google Scholar] [CrossRef]
  28. Détienne, P.; Mariaux, A. La périodicité de formation des cernes dans le bois d’okoumé. Bois For. Trop. 1970, 131, 37–50. [Google Scholar]
  29. Détienne, P.; Mariaux, A. Nature et périodicité des cernes dans le bois de Niangon. Bois For. Trop. 1975, 159, 29–37. [Google Scholar]
  30. Détienne, P.; Mariaux, A. Nature et périodicité des cernes dans le bois de samba. Bois For. Trop. 1976, 169, 29–35. [Google Scholar]
  31. Détienne, P.; Mariaux, A. Nature et périodicité des cernes dans les bois rouges de méliacées africaines. Bois For. Trop. 1977, 175, 52–61. [Google Scholar]
  32. Worbes, M.; Staschel, R.; Roloff, A.; Junk, W.J. Tree ring analysis reveals age structure, dynamics and wood production of a natural forest stand in Cameroon. For. Ecol. Manag. 2003, 173, 105–123. [Google Scholar] [CrossRef]
  33. De Ridder, M.; Trouet, V.; van den Bulcke, J.; Hubau, W.; van Acker, J.; Beeckman, H. A tree-ring based comparison of Terminalia superba climate-growth relationships in West and Central Africa. Trees 2013, 27, 1225–1238. [Google Scholar] [CrossRef]
  34. De Ridder, M.; van den Bulcke, J.; van Acker, J.; Beeckman, H. Tree-ring analysis of an African long-lived pioneer species as a tool for sustainable forest management. For. Ecol. Manag. 2013, 304, 417–426. [Google Scholar] [CrossRef]
  35. Groenendijk, P.; Sass-Klaassen, U.; Bongers, F.; Zuidema, P.A. Potential of tree-ring analysis in a wet tropical forest: A case study on 22 commercial tree species in Central Africa. For. Ecol. Manag. 2014, 323, 65–78. [Google Scholar] [CrossRef]
  36. Gebrekirstos, A.; Bräuning, A.; Sass-Klaassen, U.; Mbow, C. Opportunities and applications of dendrochronology in Africa. Curr. Opin. Environ. Sustain. 2014, 6, 48–53. [Google Scholar] [CrossRef]
  37. Kukachka, B.F. Krokodua—Afrormosia elata Harms, Leguminosae (Papilionaceae); Foreign Wood Series; Department of Agriculture, Forest Service: Washington, DC, USA, 1960. [Google Scholar]
  38. Bourland, N.; Kouadio, Y.L.; Fousséni, F.; Lejeune, P.; Doucet, J.-L. Ecology and management of Pericopsis elata (Harms) Meeuwen (Fabaceae) populations: A review. Biotechnol. Agron. Soc. Environ. 2012, 16, 486–498. [Google Scholar]
  39. Cook, E.R.; Kairiukstis, L.A. Methods of Dendrochronology. Applications in the Environmental Sciences, 1st ed.; Kluwer Academic Publishers: Dordrecht, The Netherlands, 1990. [Google Scholar]
  40. Abensperg-Traun, M. CITES, sustainable use of wild species and incentive-driven conservation in developing countries, with an emphasis on Southern Africa. Biol. Conserv. 2009, 142, 948–963. [Google Scholar] [CrossRef]
  41. IUCN. IUCN Red List of Threatened Species; IUCN Species Survival Commission: Gland, Switzerland, 2001. [Google Scholar]
  42. White, F. The Vegetation of Africa, 1st ed; UNESCO: Gland, Switzerland, 1983. [Google Scholar]
  43. Van Oldenborgh, G.J.; Burgers, G. Searching for decadal variations in ENSO precipitation teleconnections. Geophys. Res. Lett. 2005, 32, L15701. [Google Scholar] [CrossRef]
  44. Boyemba, F.B. Ecologie de Pericopsis elata (Harms) Van Meeuwen (Fabaceae), arbre de forêt tropicale africaine à repartition agrégée. Ph.D. Thesis, Université Libre de Bruxelles, Brussels, Belgium, 2011. [Google Scholar]
  45. Calembert, J. Gestion des sols en Regions Chaudes, 1st ed.; Faculté Universitaire des Sciences Agronomiques: Gembloux, Belgium, 1995. [Google Scholar]
  46. Dickson, B.; Mathew, P.; Mickleburgh, S.; Oldfield, S.; Pouakouyou, D.; Suter, J. An Assessment of the Conservation Status, Management and Regulation of the Trade in Pericopsis elata, 1st ed.; Fauna and Flora International: Cambridge, UK, 2005. [Google Scholar]
  47. Rinn, F. TSAP-WinTM User Reference, 1st ed.; Rinntech: Heidelberg, Switzerland, 2003. [Google Scholar]
  48. Baillie, M.G.L.; Pilcher, J.R. A simple program for tree-ring research. Tree-Ring Bull. 1973, 33, 7–14. [Google Scholar]
  49. Eckstein, D.; Bauch, J. Beitrag zur Rationalisierung eines dendrochronologischen Verfahrens und zur Analyse seiner Aussagesicherheit. Forstwissenschaft Centralblatt 1969, 88, 230–250. [Google Scholar] [CrossRef]
  50. Fritts, H.C. Tree Rings and Climate, 1st ed.; Academic Press: London, UK, 1976. [Google Scholar]
  51. Wigley, T.M.L.; Briffa, K.R.; Jones, P.D. On the average value of correlated time series with applications in dendroclimatology and hydrometeorology. J. Clim. Appl. Meteorol. 1984, 23, 201–213. [Google Scholar] [CrossRef]
  52. Trouet, V.; van Oldenborgh, G.J. KNMI Climate Explorer: A web-based research tool for high-resolution paleoclimatology. Tree-Ring Res. 2013, 69, 3–13. [Google Scholar] [CrossRef]
  53. Trenberth, K.E.; Stepaniak, D.P. Indices of El Niño evolution. J. Clim. 2001, 14, 1697–1701. [Google Scholar] [CrossRef]
  54. Mitchell, T.D.; Jones, P.D. An improved method of constructing a database of monthly climate observations and associated high-resolution grids. Int. J. Clim. 2005, 25, 693–712. [Google Scholar] [CrossRef]
  55. Schöngart, J.; Junk, W.J.; Piedade, M.T.F.; Ayres, J.M.; Hütterman, A.; Worbes, M. Teleconnection between tree growth in the Amazonian floodplains and the El Niño-Southern Oscillation effect. Glob. Change Biol. 2004, 10, 683–692. [Google Scholar] [CrossRef]
  56. Trenberth, K.E. The definition of El Niño. Bull. Amer. Meteor. Soc. 1997, 78, 2771–2777. [Google Scholar] [CrossRef]
  57. Worbes, M.; Fichtler, E. Wood anatomy and tree-ring structure and their importance for tropical dendrochronology. In Amazonian Floodplain Forests: Ecophysiology, Biodiversity and Sustainable Management, 1st ed.; Junk, W.J., Piedade, M.T.F., Wittmann, F., Schöngart, J., Parolin, P., Eds.; Springer: Heidelberg, Switzerland, 2010; pp. 14–35. [Google Scholar]
  58. Stahle, D.W. Useful strategies for the development of tropical tree-ring chronologies. IAWA J. 1999, 20, 249–253. [Google Scholar] [CrossRef]
  59. Couralet, C.; Sterck, F.J.; Sass-Klaassen, U.; van Acker, J.; Beeckman, H. Species-specific growth responses to climate variations in understory trees of a Central African rain forest. Biotropica 2010, 42, 503–511. [Google Scholar] [CrossRef]
  60. Devall, M.S.; Parresol, B.R.; Wright, J.S. Dendroecological analysis of Cordia alliodora, Pseudobombax septenatum and Annona spraguei in Central Panama. IAWA J. 1995, 16, 411–424. [Google Scholar] [CrossRef]
  61. Bourland, N.; Kouadio, Y.L.; Lejeune, P.; Sonké, B.; Philippart, J.; Daïnou, K.; Fousséni, F.; Doucet, J.-L. Ecology of Pericopsis elata (Fabaceae), an endangered timber species in southeastern Cameroon. Biotropica 2012, 44, 840–847. [Google Scholar] [CrossRef]
  62. Balas, N.; Nicholson, S.E.; Klotter, D. The relationship of rainfall variability in West Central Africa to sea-surface temperature fluctuations. Int. J. Clim. 2007, 27, 1335–1349. [Google Scholar] [CrossRef]
  63. Camberlin, P.; Janicot, S.; Poccard, I. Seasonality and atmospheric dynamics of the teleconnection between African rainfall and tropical sea-surface temperature: Atlantic vs. ENSO. Int. J. Clim. 2001, 21, 973–1005. [Google Scholar] [CrossRef]
  64. Neuwirth, B.; Schweingruber, F.H.; Winiger, M. Spatial patterns of central European pointer years from 1901 to 1971. Dendrochronologia 2007, 24, 79–89. [Google Scholar]
  65. Wils, T.H.G.; Sass-Klaassen, U.G.W.; Eshetu, Z.; Bräuning, A.; Gebrekirstos, A.; Couralet, C.; Robertson, I.; Touchan, R.; Koprowski, M.; Conway, D.; Briffa, K.R.; Beeckman, H. Dendrochronology in the dry tropics: the Ethiopian case. Trees 2011, 25, 345–354. [Google Scholar] [CrossRef]
  66. Génova, M. Extreme pointer years in tree-ring records of Central Spain as evidence of volcanic eruptions (Huaynaputina, Peru, 1600 AC) and other climatic events. Clim. Past Discuss. 2011, 7, 4223–4259. [Google Scholar] [CrossRef]
  67. Bourland, N.; Cerisier, F.; Daïnou, K.; Smith, A.L.; Hubau, W.; Beeckman, H.; Brostaux, Y.; Fayolle, A.; Biwolé, A.B.; Fousséni, F.; et al. How tightly linked are Pericopsis elata (Fabaceae) patches to anthropogenic disturbances in south-eastern Cameroon? Implications for sustainable forest management. Forests 2014. submitted. [Google Scholar]
  68. Bourland, N. Dynamique d’une espèce ligneuse héliophile longévive dans un monde changeant: le cas de Pericopsis elata (Harms) Meeuwen (Fabaceae) au sud-est du Cameroun. Ph.D. Thesis, Université de Liège/Gembloux Agro-Bio Tech, Gembloux, Belgium, 6 December 2013. [Google Scholar]

