Estimating Single-Tree Crown Biomass of Norway Spruce by Airborne Laser Scanning: A Comparison of Methods with and without the Use of Terrestrial Laser Scanning to Obtain the Ground Reference Data


Abstract
:1. Introduction
2. Materials and Methods
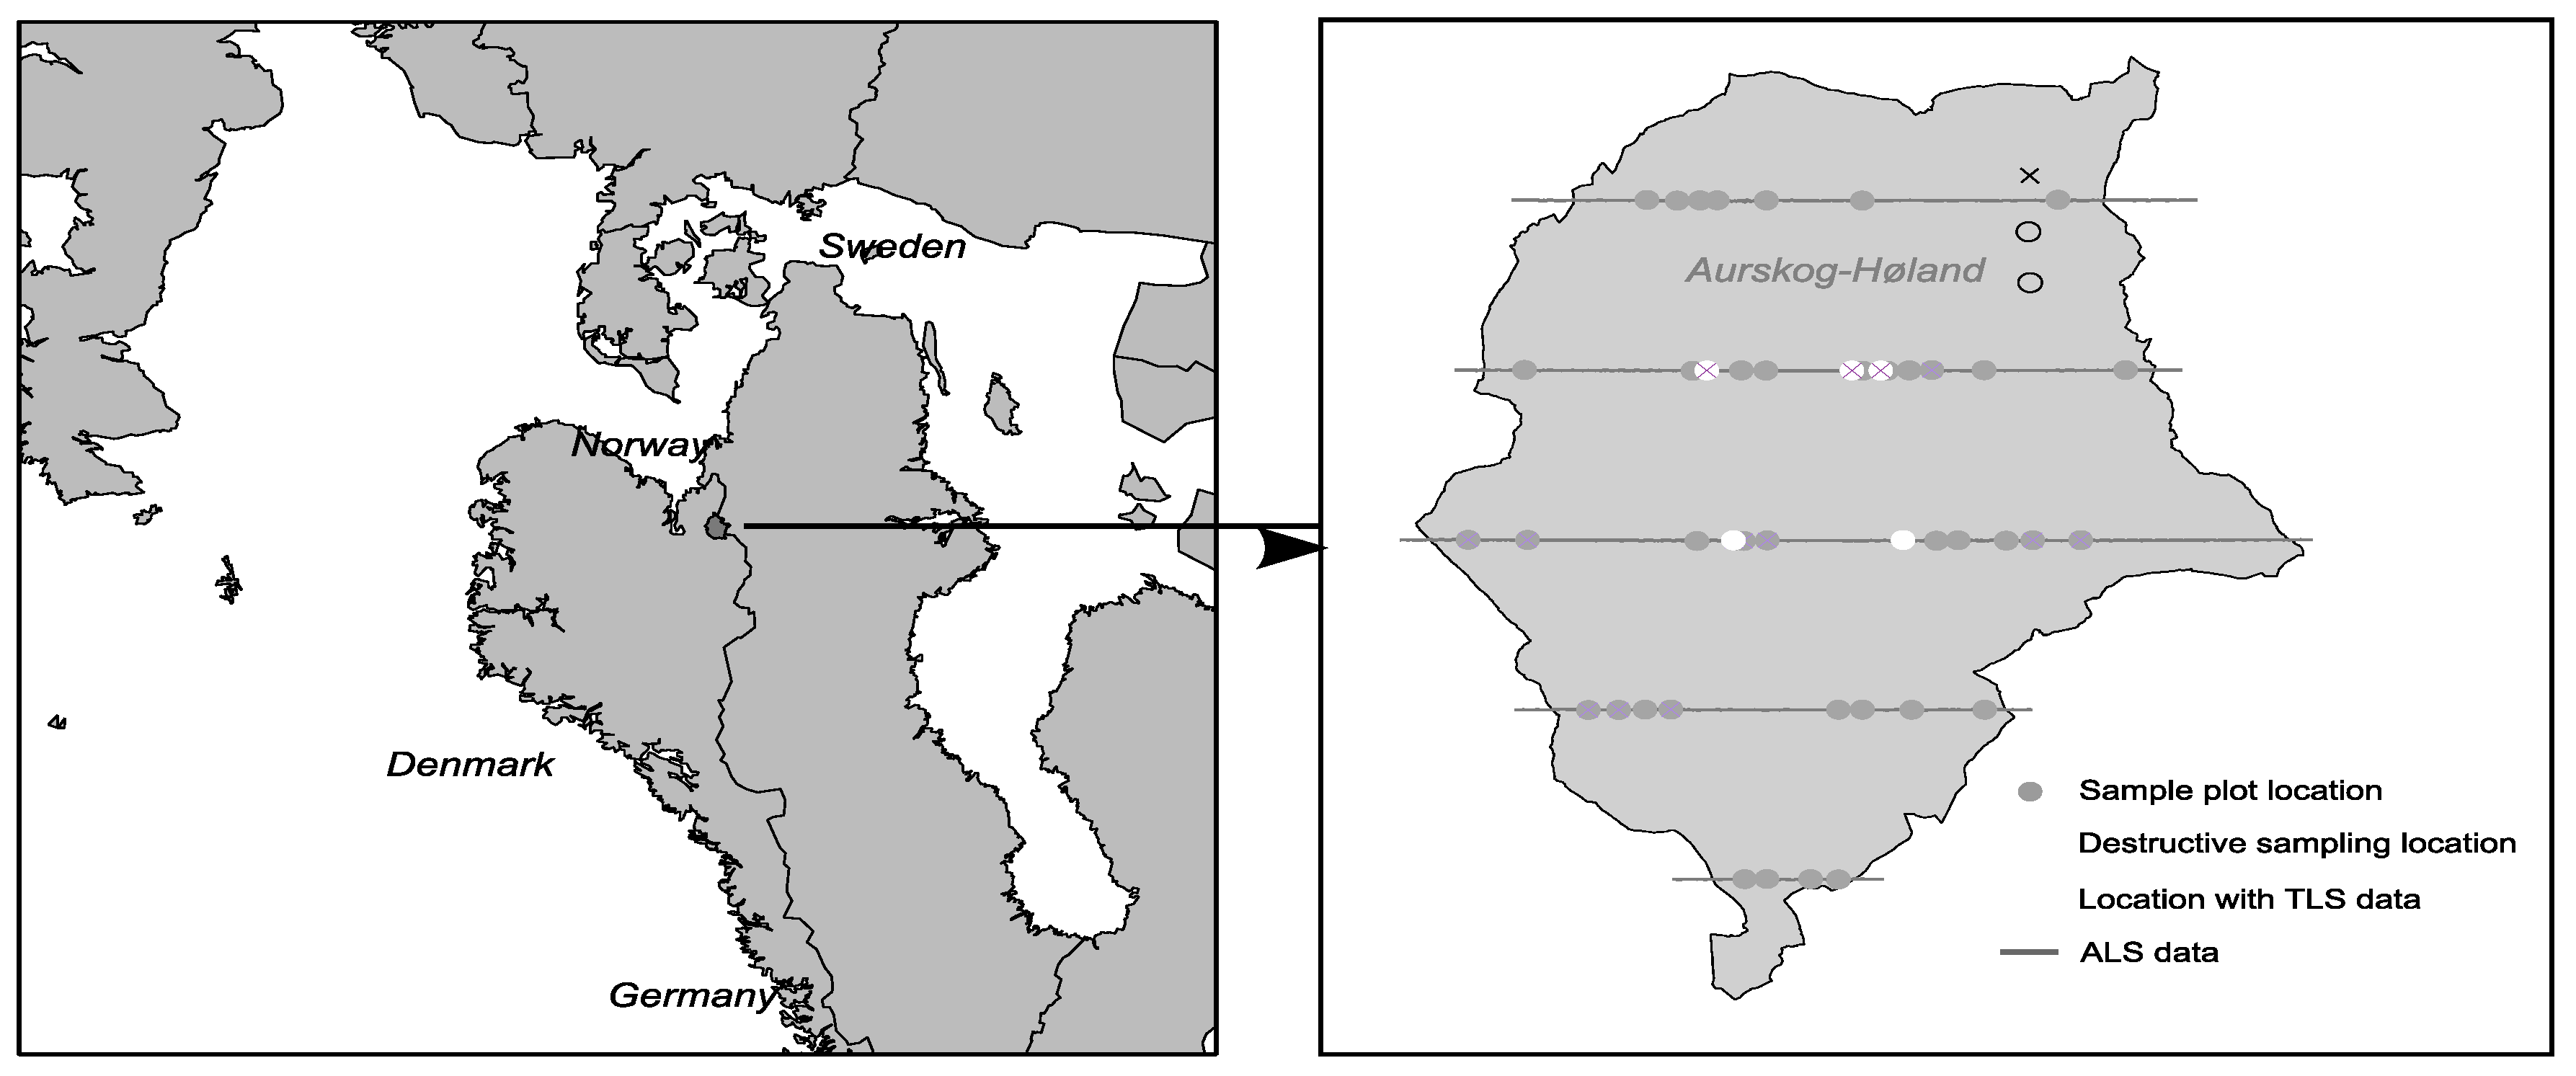
2.1. Study Area

2.2. Forest Inventory: Stratification
2.3. Field Data

| DBH (cm) | BR (kg) | n | |||||
|---|---|---|---|---|---|---|---|
| min | max | mean | min | max | mean | ||
| TLS model training dataset | 9.7 | 39.8 | 22.2 | 8.9 | 152.3 | 60.7 | 29 |
| ALS model training dataset | 7.1 | 37.7 | 19.6 | - | - | - | 68 |
| Validation dataset | 16.6 | 40.3 | 25.4 | 28.6 | 163.2 | 75.7 | 17 |
2.3.1. Sample Plot Data
2.3.2. Destructive Sampling Data
2.4. Laser Scanner Data
2.4.1. ALS Data
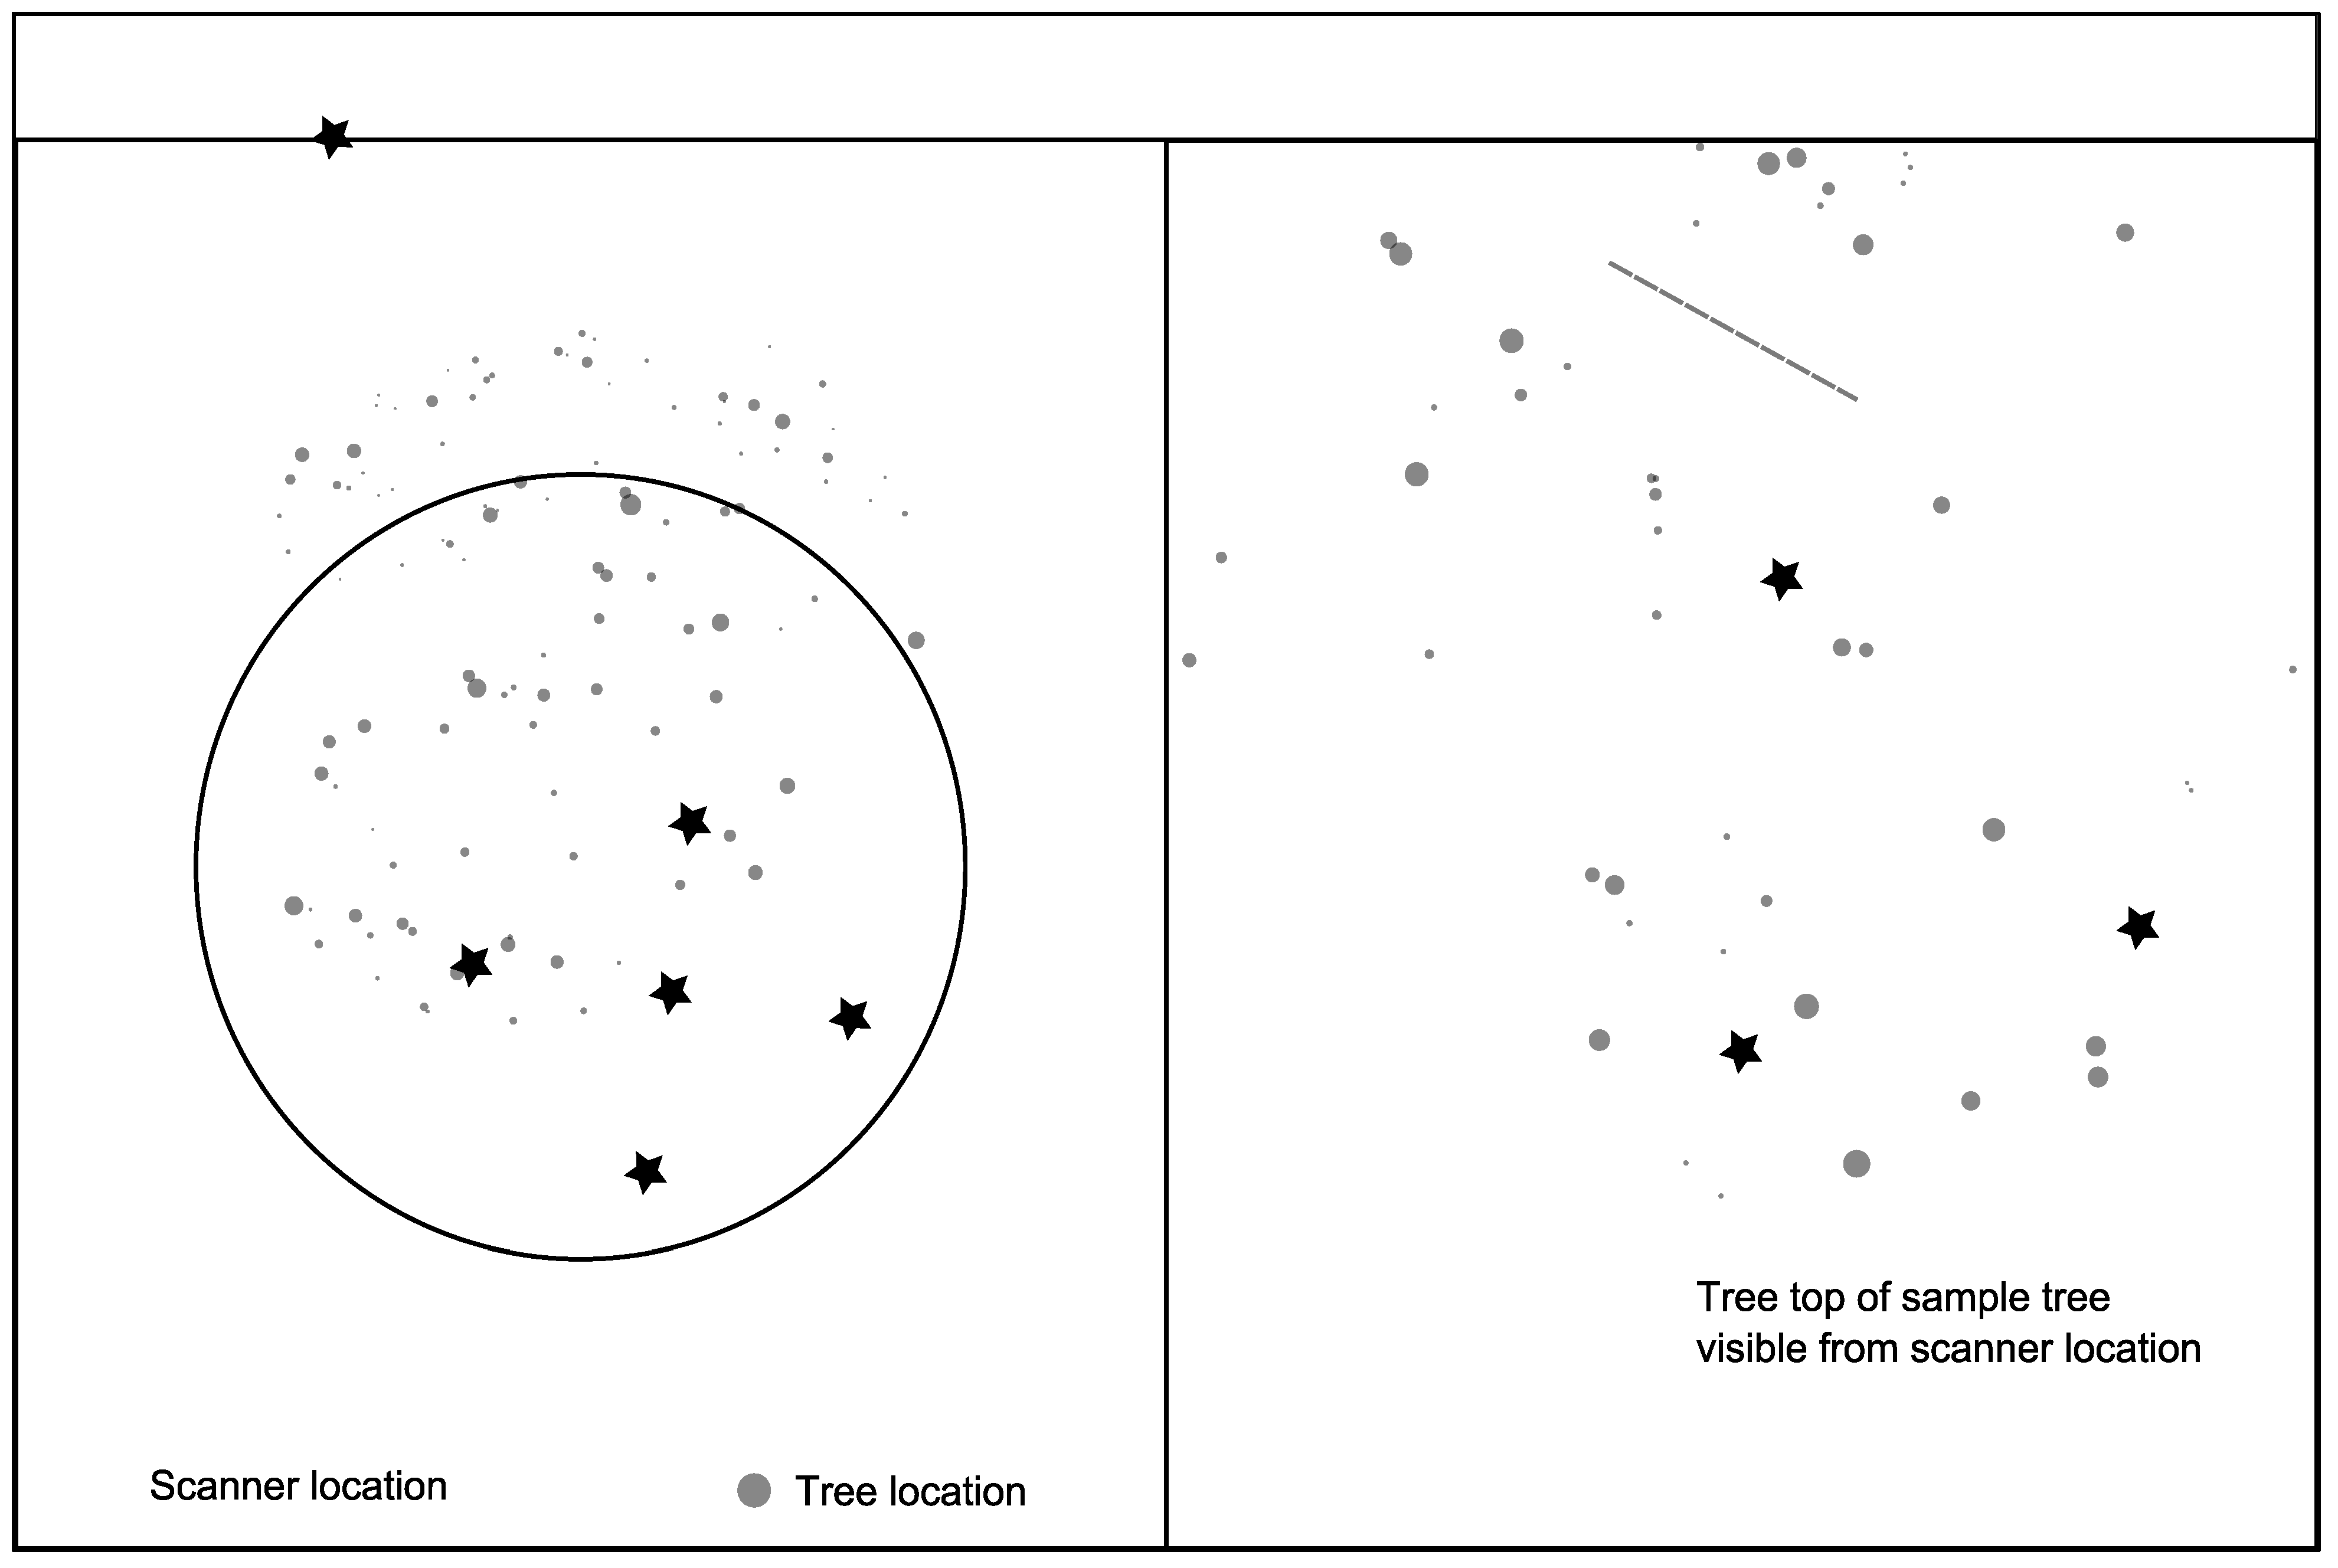
2.4.2. TLS Data

2.5. Calculations and Analysis

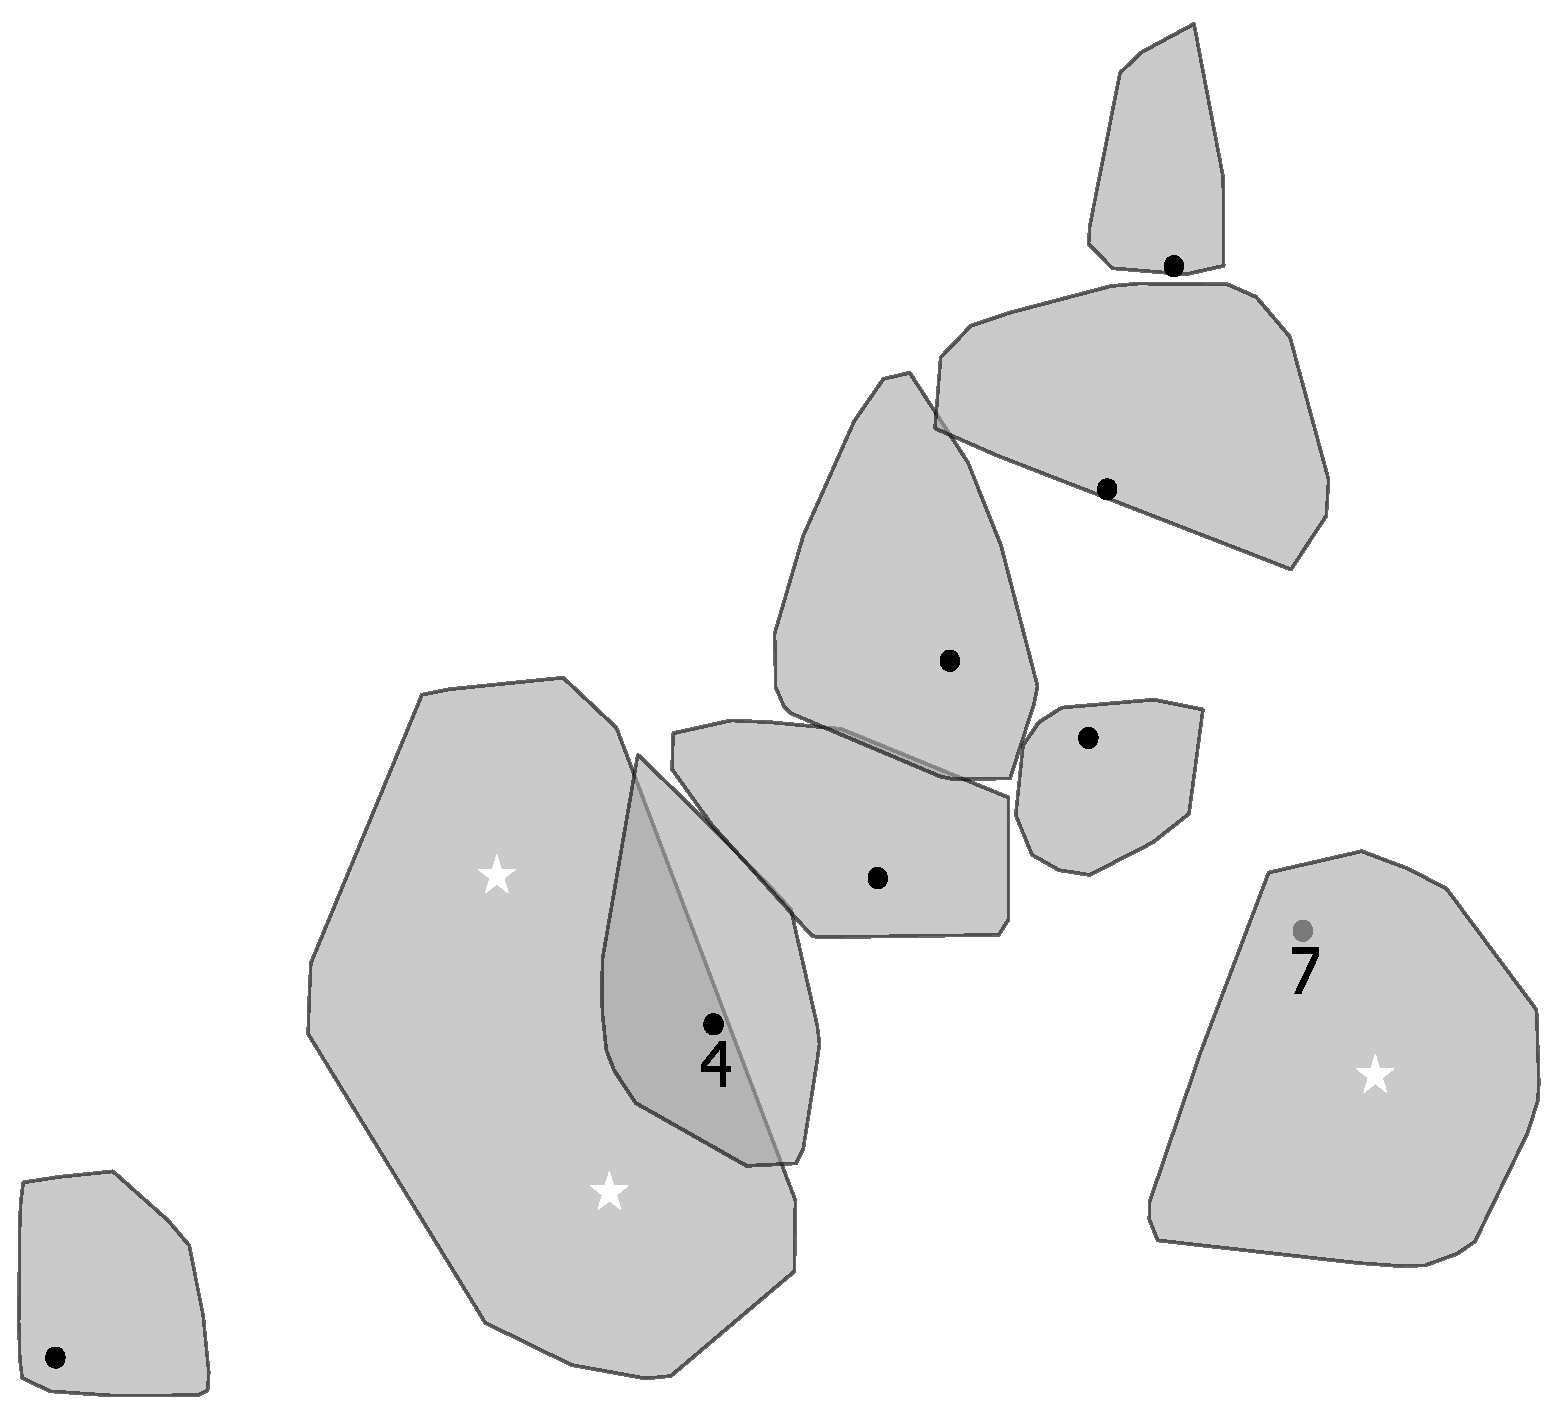
2.5.1. Single-Tree Segmentation

- Field measured trees were linked to ALS-derived crown segments if the field measured stem positions were inside the segment.
- Since the procedure allows for overlapping segments, a field tree with a position inside more than one segment would be connected to the segment with the shortest distance from its centroid to the field tree position.
- ALS model training data: only trees with one single field measured tree position within a segment were used.
- Validation data: If more than one field measured tree was inside a segment the sum of the crown biomass for all the field trees positioned inside, the segment was used as the reference crown biomass.
- Validation data: Segments encompassing trees that were not destructively sampled were excluded from the validation dataset, since the reference biomass was not known for the whole segment.
2.5.2. ALS-Derived Variables
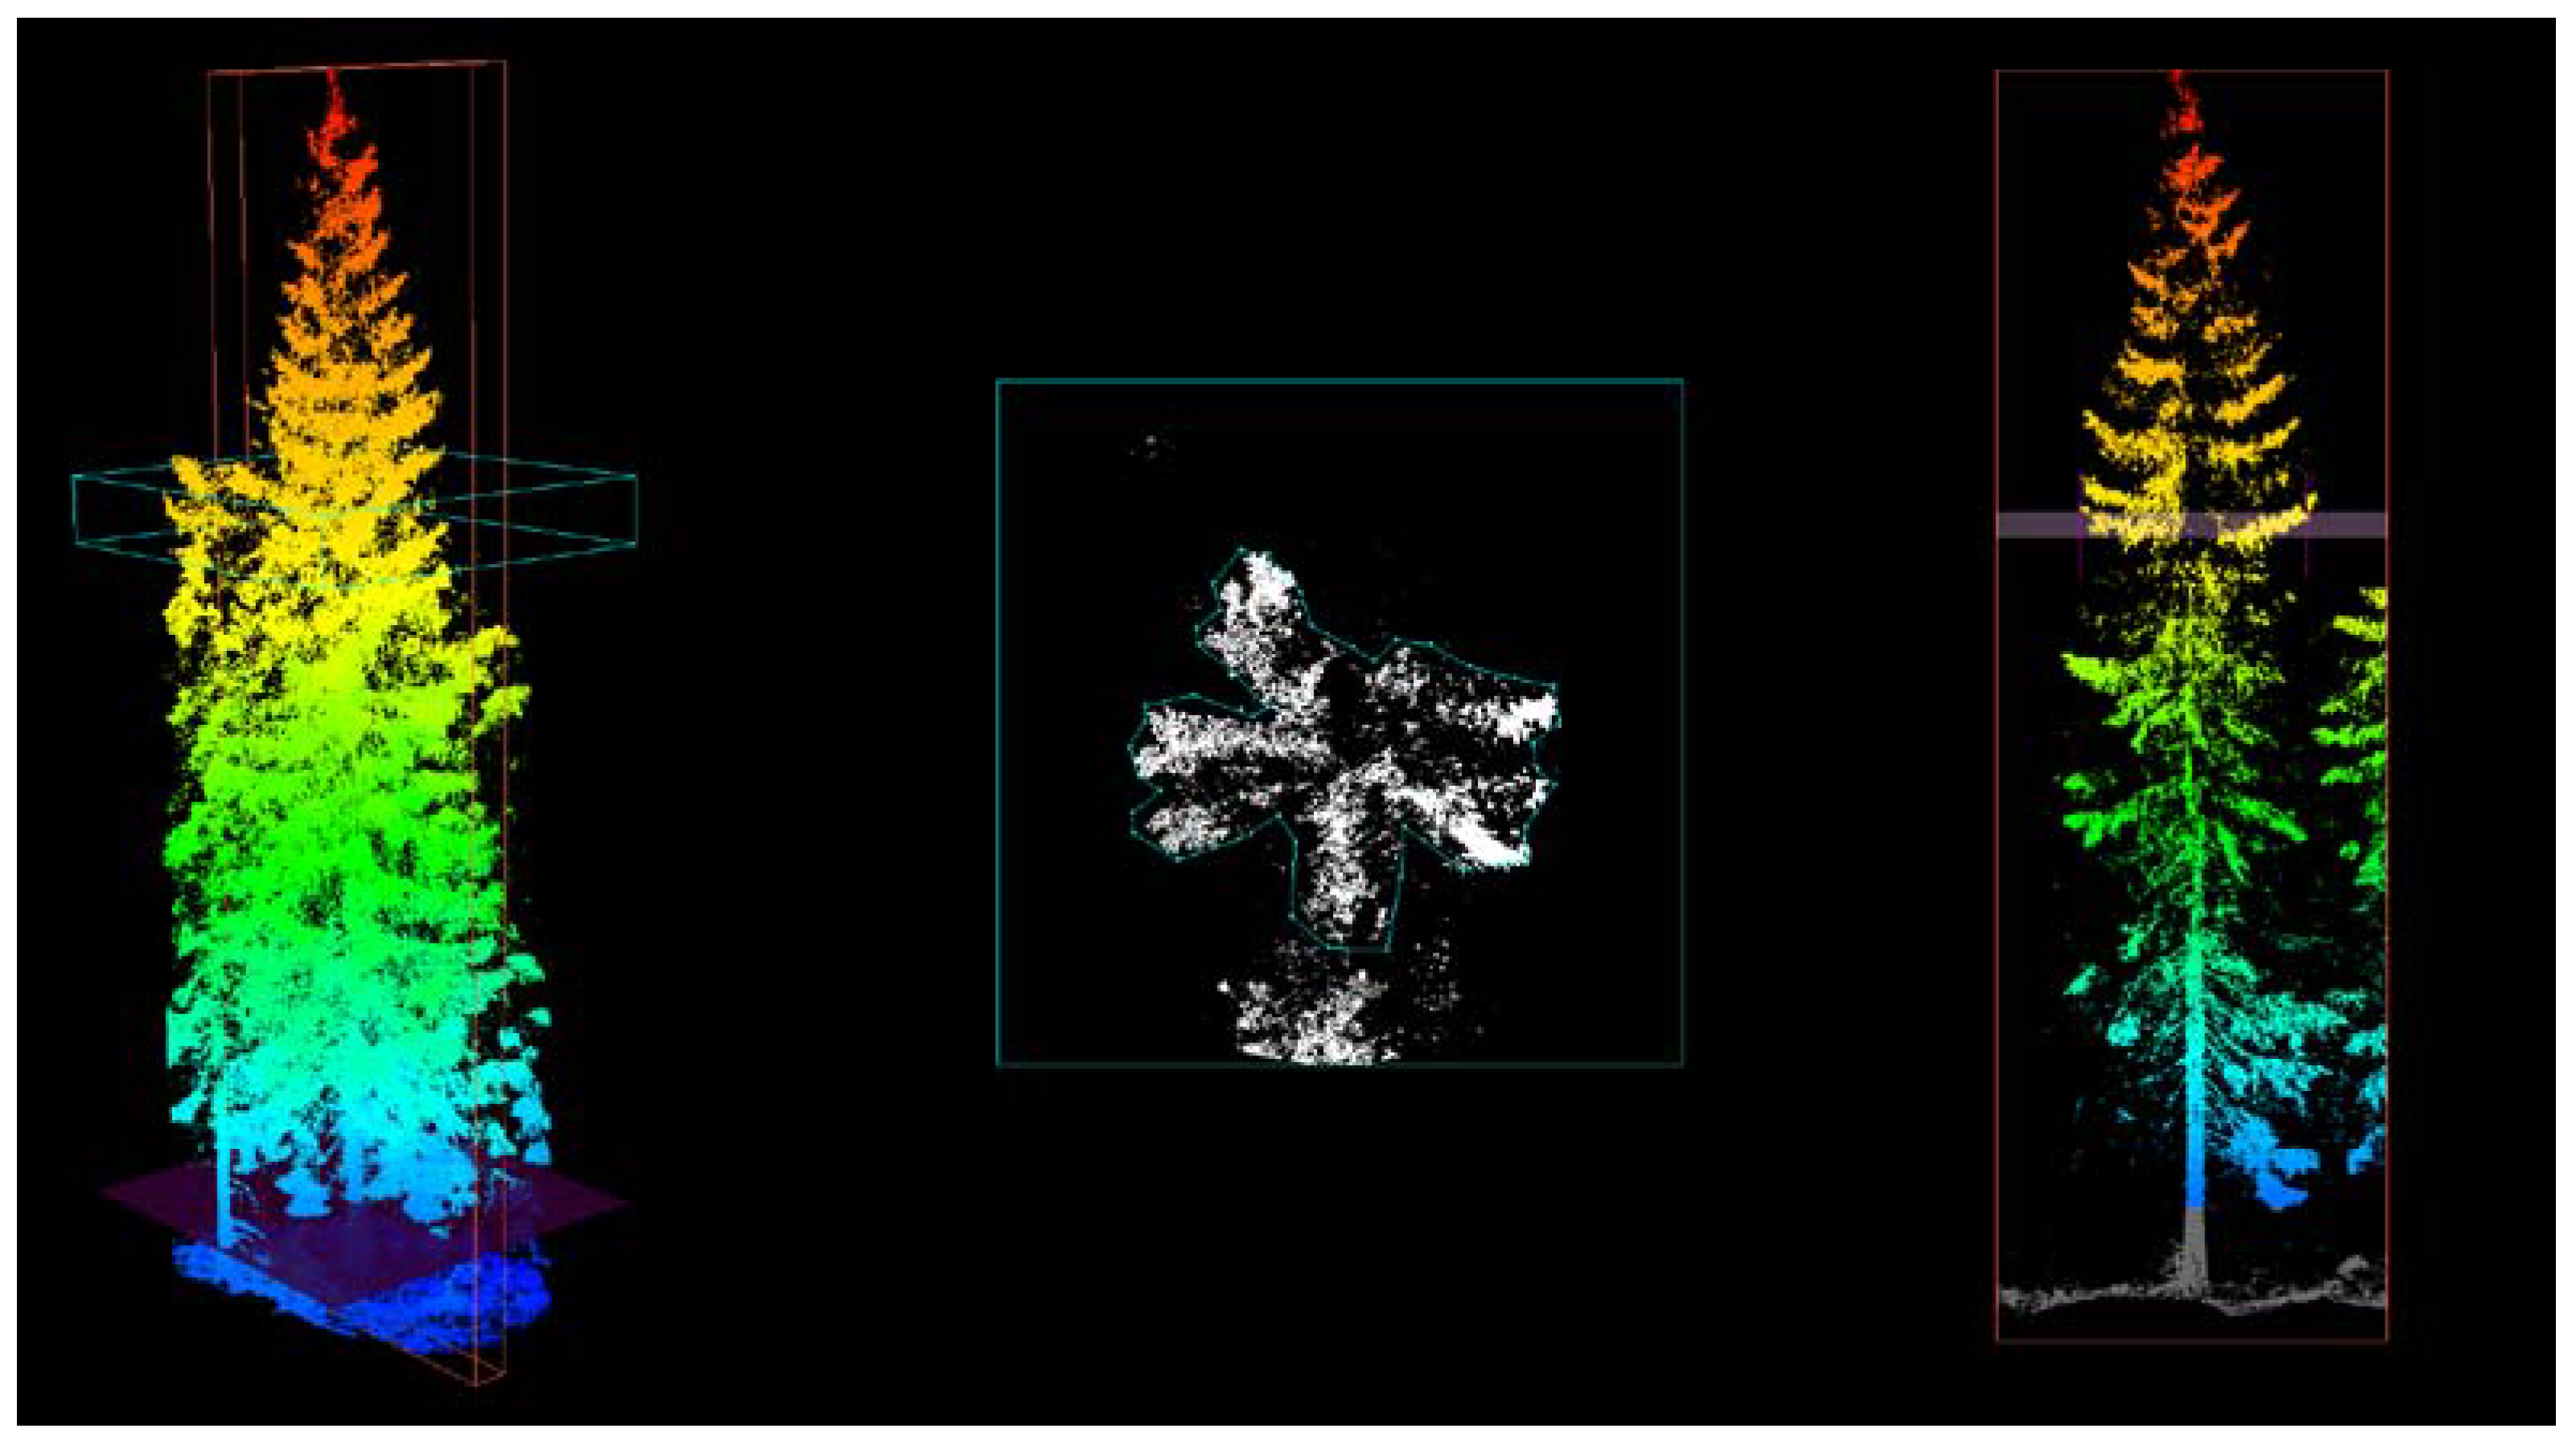
2.5.3. TLS-Derived Variables

| Variable | Description |
|---|---|
| CRlength | Crown length. Vertical distance from the crown base height to the highest laser echo assigned to the tree. |
| CRA10,..,80 | Crown projection area. Area of the crown projection measured at heights corresponding to 10, 20, 40, 60 and 80 percent of the crown length. |
| CRAsum | Crown projection area sum. The sum of the area of the crown projection measurements at heights corresponding to 10, 20, 40, 60 and 80 percent of the crown length. |
| CRW10,..,80 | Crown width. The crown width measured at heights corresponding to 10, 20, 40, 60 and 80 percent of the crown length. |
| CRWsum | Crown width sum. The sum of the crown width measurements at heights corresponding to 10, 20, 40, 60 and 80 percent of the crown length. |
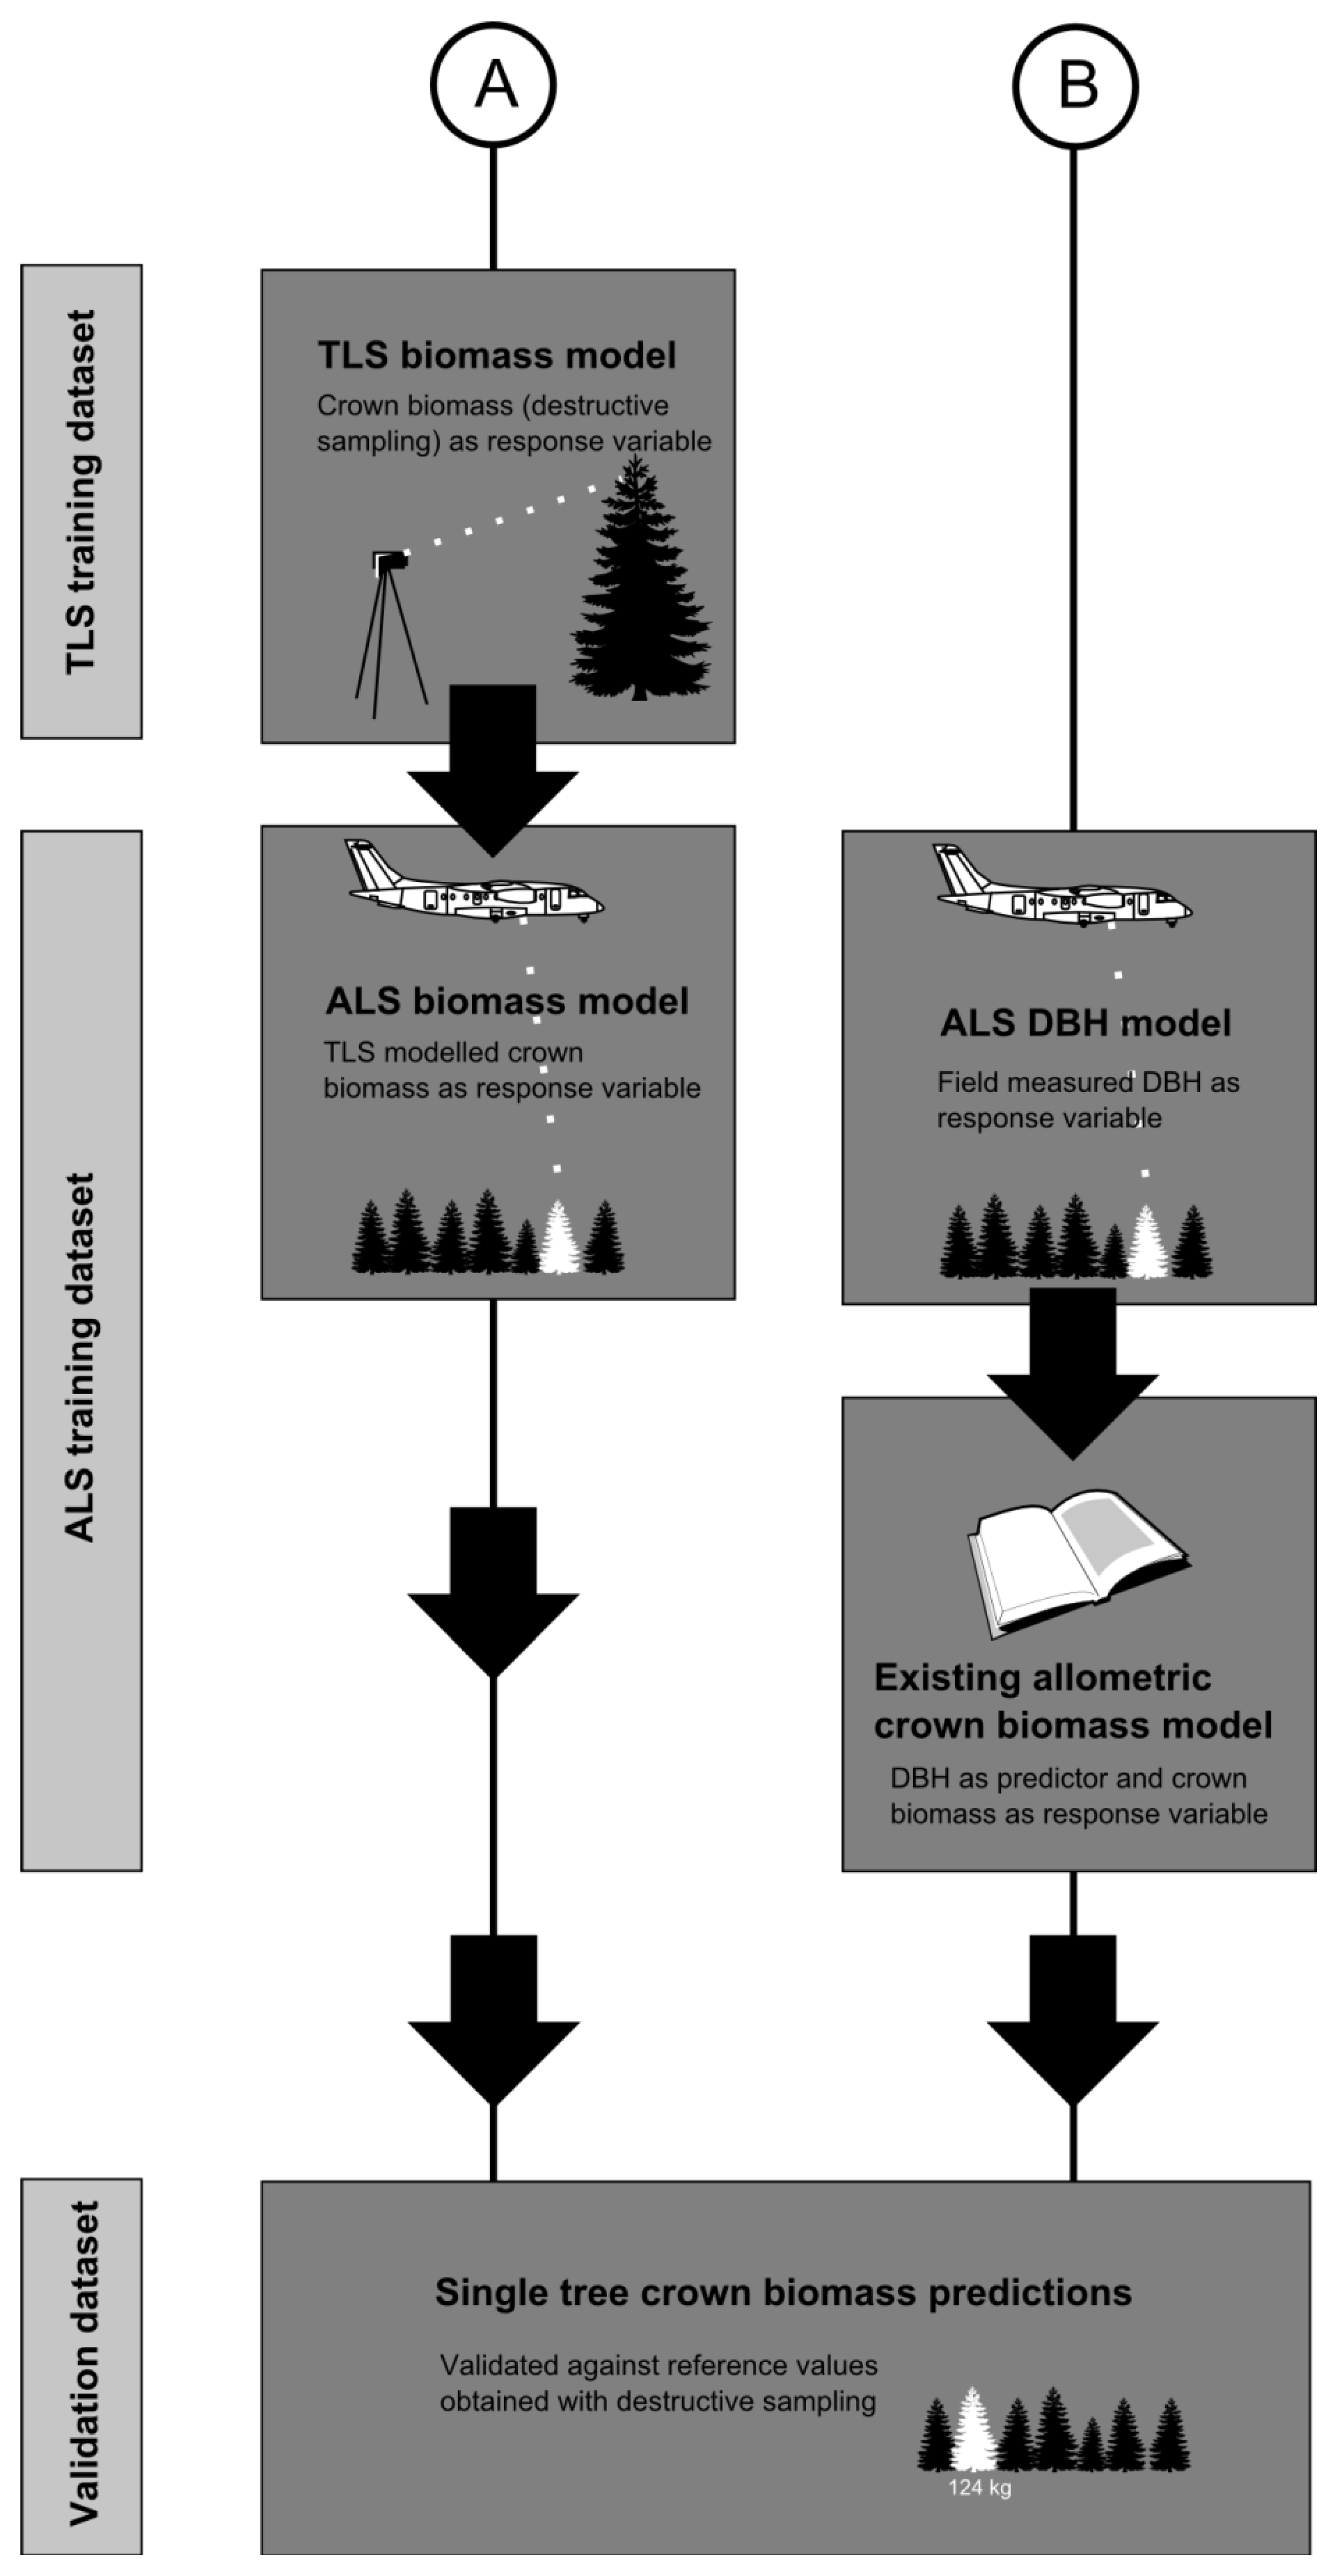
2.5.4. Crown Biomass Predicted Using TLS to Obtain the Reference Values

2.5.5. Crown Biomass Predicted Using an Existing Allometric Model


2.5.6. Final Validation

 is the predicted crown biomass, and:

3. Results
| Variable | Relative score |
|---|---|
| CRAsum | 89 |
| CRWsum | 69 |
| CRA10 | 53 |
| CRA40 | 52 |
| CRA20 | 45 |
| CRW40 | 16 |
| CRlength | 12 |
| CRW60 | 10 |
| CRW10 | 7 |
| CRA60 | 6 |
| CRW20 | 5 |
| CRW80 | 2 |
| CRA80 | 1 |
| Model fit | Validation | |||
|---|---|---|---|---|
| Predictor variables | R2 | RMSE% | bias% | |
| A | CRvol | 0.50 | 32.4 | 10.2 ns |
| B | Hmax + CRdiam a | — b | 35.1 | −4.3 ns |
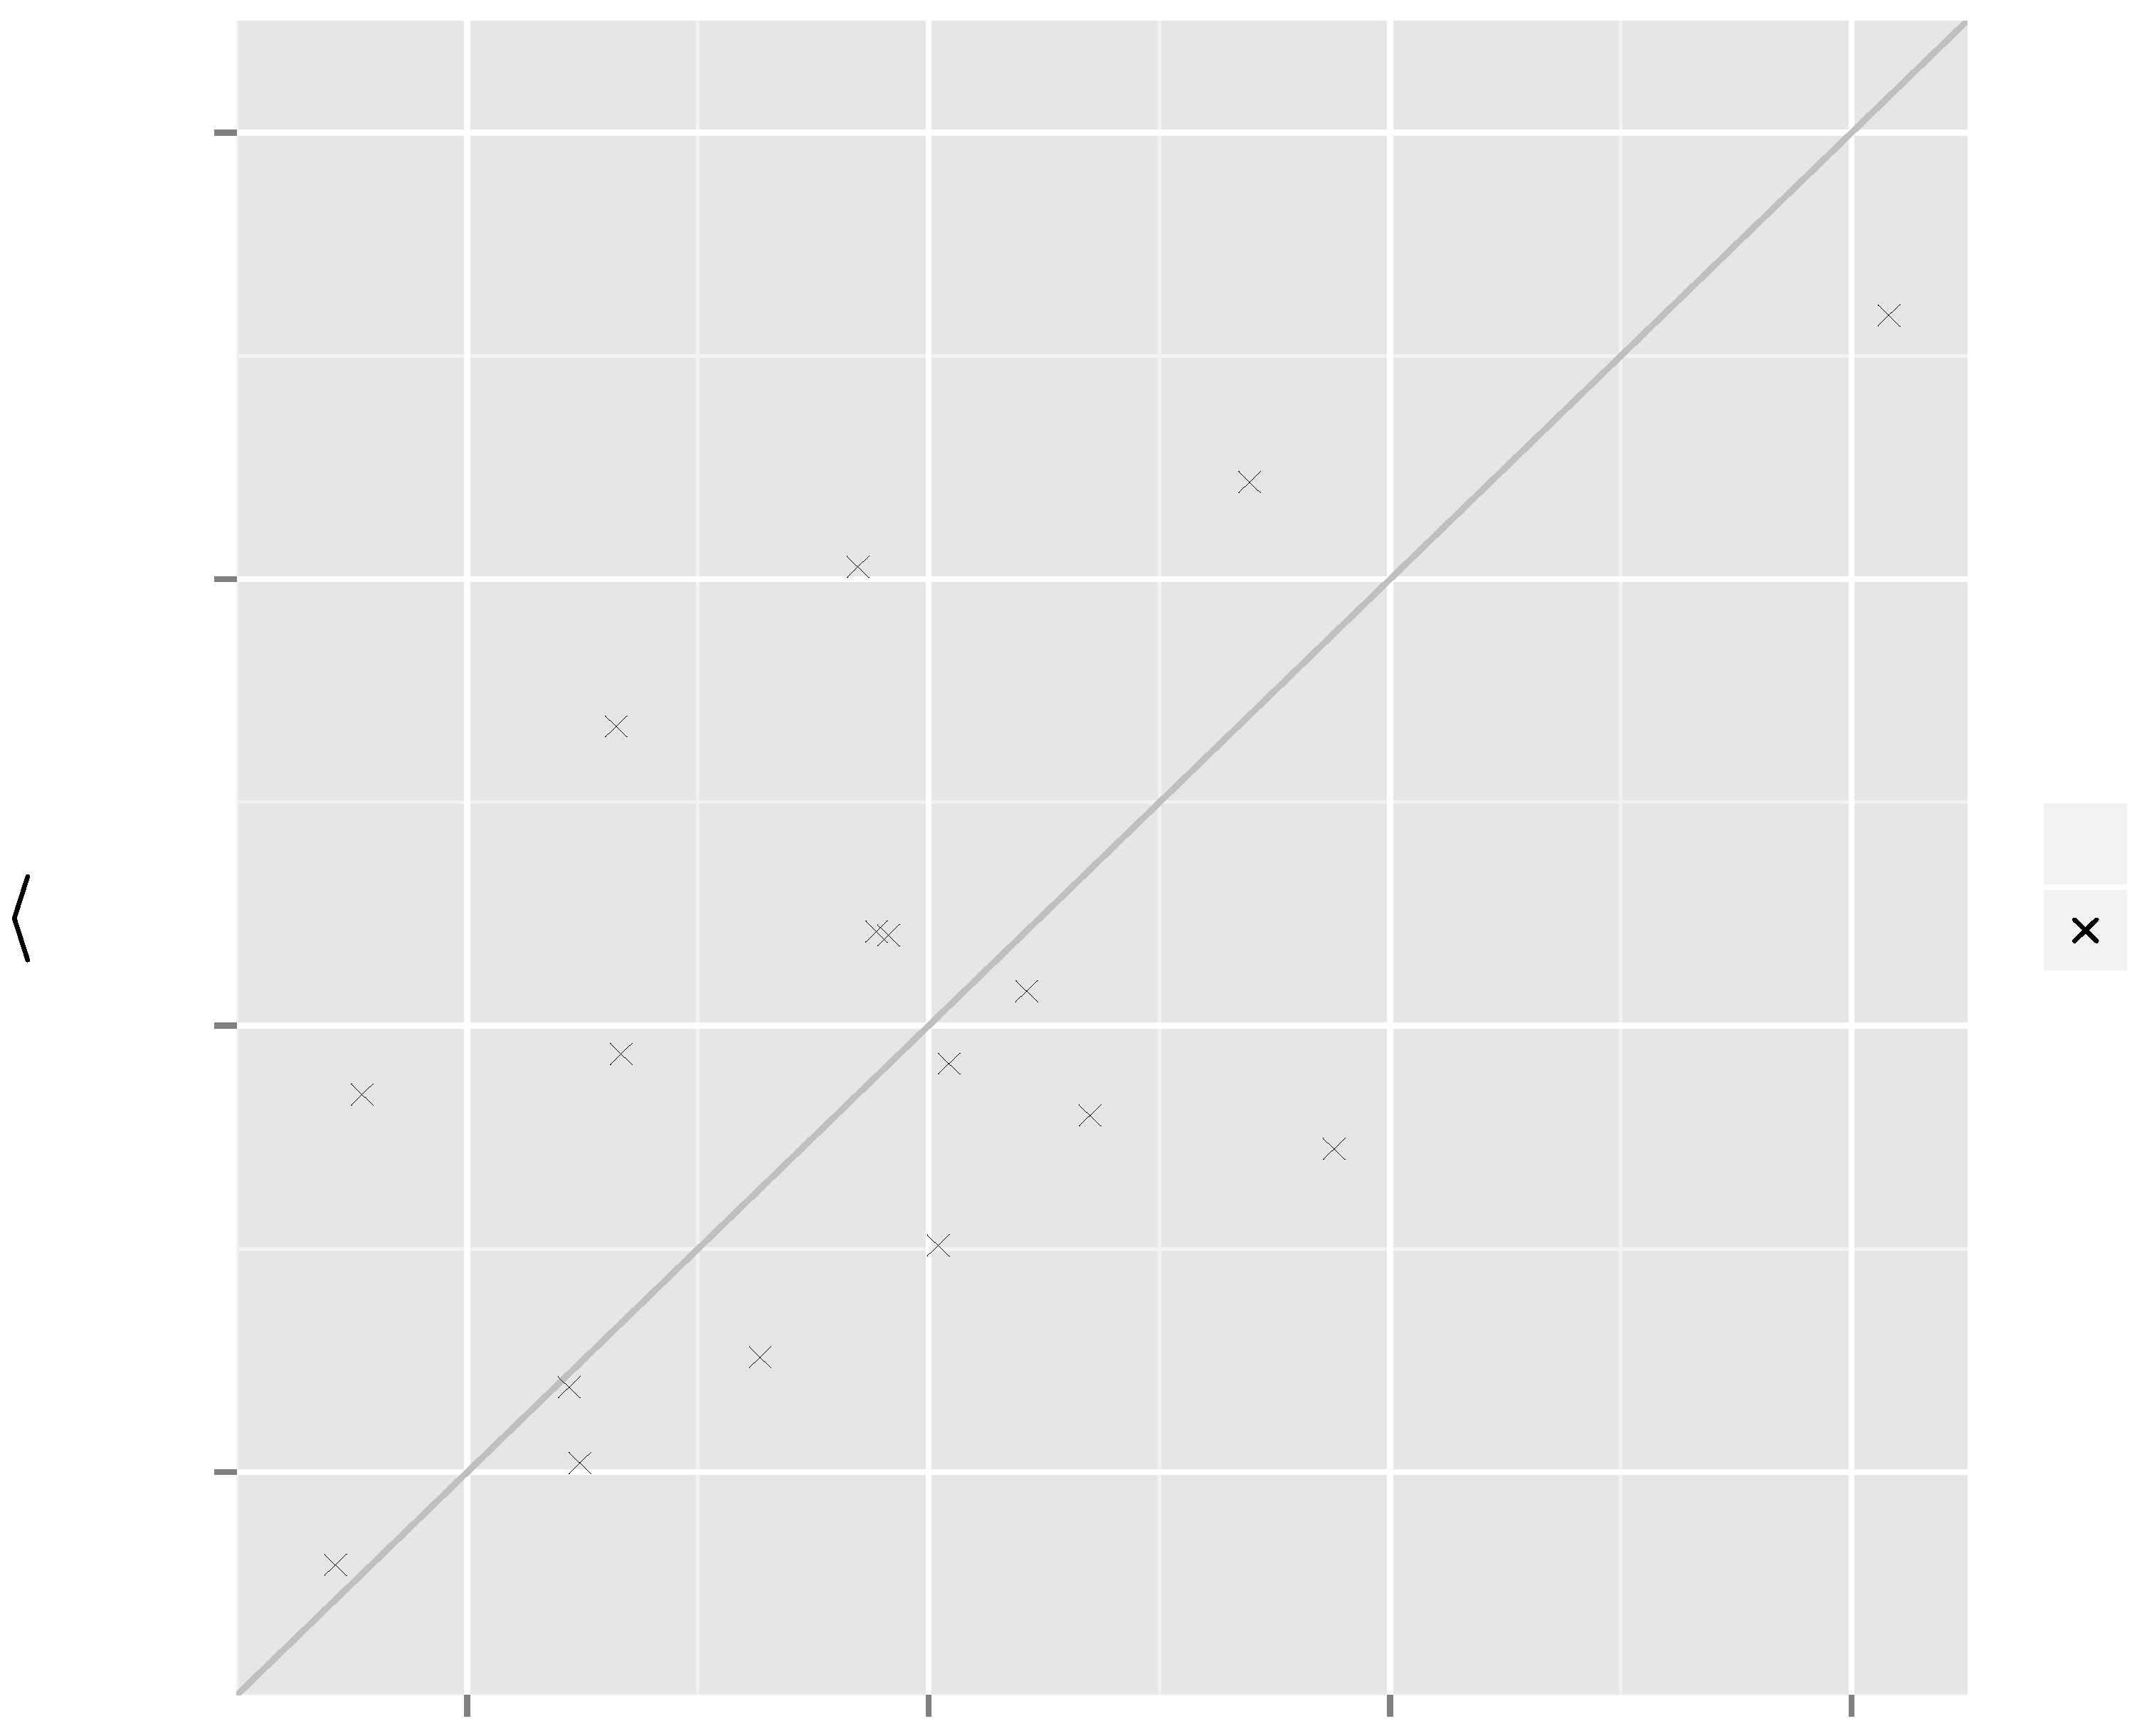
) versus ground reference crown biomass (BR) in the validation of the two approaches for the prediction of crown biomass.
) versus ground reference crown biomass (BR) in the validation of the two approaches for the prediction of crown biomass. 
| Model | β0 | β1 | β2 |
|---|---|---|---|
| | 9.59208 | 0.73589 | - |
| | −3.90421 | 2.83414 | 0.93242 |
4. Discussion
5. Conclusions
Acknowledgments
Conflicts of Interest
References
- Maltamo, M.; Packalén, P.; Kallio, E.; Kangas, J.; Uuttera, J.; Heikkilä, J. Airborne laser scanning based stand level management inventory in Finland. In Proceedings of the Silvilaser 2011, Hobart, Australia, 16–19 October 2011.
- Næsset, E. Predicting forest stand characteristics with airborne scanning laser using a practical two-stage procedure and field data. Remote Sens. Environ. 2002, 80, 88–99. [Google Scholar] [CrossRef]
- Hyyppä, J.; Kelle, O.; Lehikoinen, M.; Inkinen, M. A segmentation-based method to retrieve stem volume estimates from 3-D tree height models produced by laser scanners. IEEE Trans. Geosci. Remote Sens. 2001, 39, 969–975. [Google Scholar] [CrossRef]
- Persson, A.; Holmgren, J.; Söderman, U. Detecting and measuring individual trees using an airborne laser scanner. Photogramm. Eng. Remote Sens. 2002, 68, 925–932. [Google Scholar]
- Solberg, S.; Næsset, E.; Bollandsås, O.M. Single Tree Segmentation Using Airborne Laser Scanner Data in a Structurally Heterogeneous Spruce Forest. Photogramm. Eng. Remote Sens. 2006, 72, 1369–1378. [Google Scholar] [CrossRef]
- Ene, L.; Næsset, E.; Gobakken, T. Single tree detection in heterogeneous boreal forests using airborne laser scanning and area-based stem number estimates. Int. J. Remote Sens. 2012, 33, 5171–5193. [Google Scholar] [CrossRef]
- Straub, C.; Koch, B. Estimating Single Tree Stem Volume of Pinus sylvestris Using Airborne Laser Scanner and Multispectral Line Scanner Data. Remote Sens. 2011, 3, 929–944. [Google Scholar] [CrossRef]
- Popescu, S.C. Estimating biomass of individual pine trees using airborne lidar. Biomass Bioenergy 2007, 31, 646–655. [Google Scholar] [CrossRef]
- Vauhkonen, J. Estimating crown base height for Scots pine by means of the 3D geometry of airborne laser scanning data. Int. J. Remote Sens. 2010, 31, 1213–1226. [Google Scholar] [CrossRef]
- Roberts, S.D.; Dean, T.J.; Evans, D.L.; McCombs, J.W.; Harrington, R.L.; Glass, P.A. Estimating individual tree leaf area in loblolly pine plantations using LiDAR-derived measurements of height and crown dimensions. For. Ecol. Manag. 2005, 213, 54–70. [Google Scholar] [CrossRef]
- Hauglin, M.; Dibdiakova, J.; Gobakken, T.; Næsset, E. Estimating single-tree branch biomass of Norway spruce by airborne laser scanning. ISPRS J. Photogramm. Remote Sens. 2013, 79, 147–156. [Google Scholar]
- Kankare, V.; Räty, M.; Yu, X.; Holopainen, M.; Vastaranta, M.; Kantola, T.; Hyyppä, J.; Hyyppä, H.; Alho, P.; Viitala, R. Single tree biomass modelling using airborne laser scanning. ISPRS J. Photogramm. Remote Sens. 2013, 85, 66–73. [Google Scholar] [CrossRef]
- Simonse, M.; Aschoff, T.; Spiecker, H.; Thies, M. Automatic Determination of Forest Inventory Parameters Using Terrestrial Laserscanning. In Proceedings of the ScandLaser Scientific Workshop on Airborne Laser Scanning of Forests, Umeå, Sweden, 3–4 September 2003; pp. 251–257.
- Bienert, A.; Scheller, S.; Keane, E.; Mohan, F.; Nugent, C. Tree Detection and Diameter Estimations by Analysis of Forest Terrestrial Laser Scanner Point Clouds. In Proceedings of the ISPRS Commission III Workshop 36, part 3, Espoo, Finland, 12–14 September 2007; pp. 50–55.
- Lovell, J.L.; Jupp, D.L.B.; Newnham, G.J.; Culvenor, D.S. Measuring tree stem diameters using intensity profiles from ground-based scanning lidar from a fixed viewpoint. ISPRS J. Photogramm. Remote Sens. 2011, 66, 46–55. [Google Scholar] [CrossRef]
- Moskal, L.M.; Zheng, G. Retrieving forest inventory variables with Terrestrial Laser Scanning (TLS) in urban heterogeneous forest. Remote Sens. 2012, 4, 1–20. [Google Scholar] [CrossRef]
- Yao, T.; Yang, X.; Zhao, F.; Wang, Z.; Zhang, Q.; Jupp, D.; Lovell, J.; Culvenor, D.; Newnham, G.; Ni-Meister, W.; et al. Measuring forest structure and biomass in New England forest stands using Echidna ground-based lidar. Remote Sens. Environ. 2011, 115, 2965–2974. [Google Scholar] [CrossRef]
- Holopainen, M.; Vastaranta, M.; Kankare, V.; Räty, M.; Vaaja, M.; Liang, X.; Yu, J.; Hyyppä, H.; Hyyppä, R. Biomass estimation of individual trees using stem and crown diameter TLS measurements. In Proceedings of the ISPRS Workshop on Laser Scanning, Calgary, AB, Canada, 29–31 August 2011; Volume XXXIII.
- Hauglin, M.; Astrup, R.; Gobakken, T.; Næsset, E. Estimating single-tree branch biomass of Norway spruce with terrestrial laser scanning using voxel-based and crown dimension features. Scand. J. For. Res. 2013, 28, 456–469. [Google Scholar] [CrossRef]
- Kankare, V.; Holopainen, M.; Vastaranta, M.; Puttonen, E.; Yu, X.; Hyyppä, J.; Vaaja, M.; Hyyppä, H.; Alho, P. Individual tree biomass estimation using terrestrial laser scanning. ISPRS J. Photogramm. Remote Sens. 2013, 75, 64–75. [Google Scholar] [CrossRef]
- Hauglin, M.; Gobakken, T.; Lien, V.; Bollandsås, O.M.; Næsset, E. Estimating potential logging residues in a boreal forest by airborne laser scanning. Biomass Bioenergy 2012, 36, 356–365. [Google Scholar] [CrossRef]
- Boudreau, J.; Nelson, R.F.; Margolis, H.A.; Beaudoin, A.; Guindon, L.; Kimes, D.S. Regional aboveground forest biomass using airborne and spaceborne LiDAR in Québec. Remote Sens. Environ. 2008, 112, 3876–3890. [Google Scholar] [CrossRef]
- Næsset, E.; Gobakken, T. Estimation of above- and below-ground biomass across regions of the boreal forest zone using airborne laser. Remote Sens. Environ. 2008, 112, 3079–3090. [Google Scholar] [CrossRef]
- Zianis, D.; Muukkonen, P.; Mäkipää, R.; Mencuccini, M. Biomass and Stem Volume Equations for Tree Species in Europe. Silva Fenn. 2005, 1–63. [Google Scholar]
- Marklund, L.G. Biomass functions for pine, spruce and birch in Sweden; Swedish University of Agricultural Sciences: Umeå, Sweden, 1988. [Google Scholar]
- Næsset, E.; Gobakken, T.; Solberg, S.; Gregoire, T.G.; Nelson, R.; Ståhl, G.; Weydahl, D. Model-assisted regional forest biomass estimation using LiDAR and InSAR as auxiliary data: A case study from a boreal forest area. Remote Sens. Environ. 2011, 115, 3599–3614. [Google Scholar] [CrossRef]
- Maltamo, M.; Bollandsås, O.M.; Vauhkonen, J.; Breidenbach, J.; Gobakken, T.; Næsset, E. Comparing different methods for prediction of mean crown height in Norway spruce stands using airborne laser scanner data. Forestry 2010, 83, 257–268. [Google Scholar] [CrossRef]
- Hasegawa, H.; Yoshimura, T. Estimation of GPS positional accuracy under different forest conditions using signal interruption probability. J. For. Res. 2007, 12, 1–7. [Google Scholar] [CrossRef]
- Andersen, H.-E.; Clarkin, T.; Winterberger, K.; Strunk, J. An Accuracy Assessment of Positions Obtained Using Survey- and Recreational-Grade Global Positioning System Receivers across a Range of Forest Conditions within the Tanana Valley of Interior Alaska. West. J. Appl. For. 2009, 24, 128–136. [Google Scholar]
- Næsset, E. Point accuracy of combined pseudorange and carrier phase differential GPS under forest canopy. Can. J. For. Res. 1999, 29, 547–553. [Google Scholar] [CrossRef]
- Breidenbach, J.; Næsset, E.; Lien, V.; Gobakken, T.; Solberg, S. Prediction of species specific forest inventory attributes using a nonparametric semi-individual tree crown approach based on fused airborne laser scanning and multispectral data. Remote Sens. Environ. 2010, 114, 911–924. [Google Scholar] [CrossRef]
- Axelsson, P. DEM generation form laser scanner data using adaptive TIN models. Int. Arch. Photogramm. Remote Sens. 2000, XXXIII, 110–117. [Google Scholar]
- Vauhkonen, J.; Ene, L.; Gupta, S.; Heinzel, J.; Holmgren, J.; Pitkanen, J.; Solberg, S.; Wang, Y.; Weinacker, H.; Hauglin, K.M.; et al. Comparative testing of single-tree detection algorithms under different types of forest. Forestry 2012, 85, 27–40. [Google Scholar] [CrossRef]
- Carr, J.C.; Beatson, R.K.; Cherrie, J.B.; Mitchell, T.J.; Fright, W.R.; McCallum, B.C.; Evans, T.R. Reconstruction and Representation of 3D Objects with Radial Basis Functions. In Proceedings of the 28th Annual Conference on Computer Graphics and Interactive Techniques, Los Angeles, CA, USA, 12–17 August 2001; ACM Press: New York, NY, USA, 2001; pp. 67–76. [Google Scholar]
- R Development Core Team. R: A Language and Environment for Statistical Computing; R Foundation for Statistical Computing: Vienna, Austria, 2011. [Google Scholar]
- Breiman, L. Random Forests. Mach. Learn. 2001, 45, 5–32. [Google Scholar] [CrossRef]
- Hastie, T.; Tibshirani, R.; Friedman, J. The Elements of Statistical Learning: Data Mining, Inference, and Prediction, 2nd ed.; Springer: New York, NY, USA, 2009. [Google Scholar]
- Lindberg, E.; Holmgren, J.; Olofsson, K.; Olsson, H. Estimation of stem attributes using a combination of terrestrial and airborne laser scanning. Eur. J. For. Res. 2012, 131, 1917–1931. [Google Scholar] [CrossRef]
© 2014 by the authors; licensee MDPI, Basel, Switzerland. This article is an open access article distributed under the terms and conditions of the Creative Commons Attribution license (http://creativecommons.org/licenses/by/3.0/).
Share and Cite
Hauglin, M.; Gobakken, T.; Astrup, R.; Ene, L.; Næsset, E. Estimating Single-Tree Crown Biomass of Norway Spruce by Airborne Laser Scanning: A Comparison of Methods with and without the Use of Terrestrial Laser Scanning to Obtain the Ground Reference Data. Forests 2014, 5, 384-403. https://doi.org/10.3390/f5030384
Hauglin M, Gobakken T, Astrup R, Ene L, Næsset E. Estimating Single-Tree Crown Biomass of Norway Spruce by Airborne Laser Scanning: A Comparison of Methods with and without the Use of Terrestrial Laser Scanning to Obtain the Ground Reference Data. Forests. 2014; 5(3):384-403. https://doi.org/10.3390/f5030384
Chicago/Turabian StyleHauglin, Marius, Terje Gobakken, Rasmus Astrup, Liviu Ene, and Erik Næsset. 2014. "Estimating Single-Tree Crown Biomass of Norway Spruce by Airborne Laser Scanning: A Comparison of Methods with and without the Use of Terrestrial Laser Scanning to Obtain the Ground Reference Data" Forests 5, no. 3: 384-403. https://doi.org/10.3390/f5030384