Article

Soil Carbon Dynamics in Residential Lawns Converted from Appalachian Mixed Oak Stands

Department of Forest Resources and Environmental Conservation (0324), 228 Cheatham Hall, Virginia Tech, 310 West Campus Drive Blacksburg, Blacksburg, VA 24061, USA
*
Author to whom correspondence should be addressed.
Forests 2014, 5(3), 425-438; https://doi.org/10.3390/f5030425
Submission received: 7 January 2014 / Revised: 4 March 2014 / Accepted: 5 March 2014 / Published: 19 March 2014
(This article belongs to the Special Issue Forest and Wood Vegetation Carbon Stores and Sequestration)

Abstract

:
The conversion of unmanaged forest land to homesites dominated by managed turfgrass lawns continues to increase and has large potential impacts on biogeochemical cycling. The conversion process from forest into mowed turfgrass involves a major disturbance to soil properties and shift in ecological conditions, which could affect soil physical, chemical and biological properties, including carbon sequestration. We conducted a study on 64 residential properties, ranging from 5 to 52 years since development, to compare soil carbon content, bulk density, temperature, and moisture, between lawns and the surrounding forests from which they were converted. Homeowners were surveyed on lawn management practices and environmental attitudes, and the relationships between these and soil properties were investigated. Soil bulk density was significantly higher in the upper 10 cm of lawns compared to adjacent forest (35% higher at 0–5 cm and 15.6% higher at 5–10 cm). Total soil C content to 30 cm of lawn (6.5 kg C m−2) and forest (7.1 kg C m−2) marginally differed (p = 0.08), and lawns contained significantly greater C (0.010 g C cm−3) than forests (0.007 g C cm−3) at the 20–30 cm soil depth (p = 0.0137). In the lawns, there was a positive relationship between time since development and surface (0–5 cm) C concentration (p = 0.04), but a negative relationship at 20–30 cm (p = 0.03). Surface soils also exhibited a positive correlation between fertilization frequency and C (p = 0.0005) content. Lawn management intensity (fertilizer and pesticide use) increased with environmental commitment. Homeowners with a higher environmental commitment had lawns with greater soil carbon levels. Our results indicate that converting unmanaged Appalachian hardwood forest into managed, turfgrass-dominated residential landscapes may affect C depth distribution, but results in little change in total soil carbon sequestration in the upper 30 cm.

1. Introduction

Urban development of forested land causes dramatic, long-term changes in soil properties, vegetation composition, management intensity, and impervious surface area [1,2]. As a result, urbanization can significantly alter biogeochemical cycles and other ecosystem processes [3]. Due to rapid urbanization throughout North America, interest in the effects of urban transformation on soil productivity, carbon (C) cycling and C sequestration has increased [4,5,6], The North American C cycle is directly and indirectly influenced by urban development patterns, and future efforts to reduce C emissions require an accurate model of C storage in these settings [7].
While much is known about the effects of interconversion of natural (e.g., forests, grasslands, and wetlands) and agricultural ecosystems on soil organic carbon (SOC) dynamics [8,9], little is known about the effects of conversion to urban land uses. Enhancement of SOC in urban soils has the potential to provide both direct and indirect benefits to urban inhabitants, including increased vegetative productivity and reduction of soil and air pollutants [6]. Understanding the factors that influence C dynamics following conversion of natural ecosystems to urban landscapes is critical to the conservation of SOC.
Conversion of non-urban lands to urban uses is rapidly occurring, increasing impacts to C cycling and other ecosystem processes. Urban land area in the United States is currently greater than 3% [10] and is projected to increase to 8.1% by 2050 [11]. Beyond major metropolitan areas, exurban development, or “rural sprawl” is an increasingly important land development pattern characterized as being distant from metropolitan urban centers, driven by natural amenities, and dominated by large residential parcels greater than 0.4 ha. Highly dispersed, low-density development now occupies 38 million ha [10], which is 15 times more land area than higher density uses [4], and has a substantial impact on fragmentation of natural systems and alteration of ecosystem processes [4]. Residential developments in rural areas often convert forest directly to intensively managed ornamental landscaping, potentially affecting regional SOC. Forest soils and associated biomass are known to be important C-sequestering systems [12]; therefore, converting forests to residential landscapes will have large impacts on biogeochemical systems, and the effect of conversion on SOC and total C storage needs to be quantified.
Conversion of native ecosystems to urban development may cause an initial decline in C stocks, but post-conversion management could facilitate recovery and eventually increase SOC beyond that of the native systems [1,13,14,15]. SOC is a function of organic matter additions due to net primary production and losses due to microbial respiration, both of which are dependent on moisture and temperature. Native SOC concentrations are spatially variable due to differences in climate and ecosystem. Quantifying gains or losses due to urban transformation must account for: (1) SOC characteristics of the background ecosystem; (2) modifications to SOC that occur during development; and (3) post-development cover type and management intensity [16].
A complete assessment of the impact that urbanization has upon soil C storage and cycling would require an evaluation of the numerous cover types found in urban areas (e.g., turfgrass, remnant forest, urban tree canopy, wetland, impervious surface). In this study we focused on turfgrass, since it is a prominent feature due to its abundance, and unlike capped, impervious surfaces, the often high- intensity management of turf can continue to modify carbon stores. It is estimated that there are over 16 million ha of managed turfgrass lawns in the United States [4,17], and private residential lawns account for 80% of this managed lawn area [18]. Turfgrass management inputs (e.g., irrigation, fertilization, mowing, and pesticides) aimed at improving turf appearance and health consequentially increase net primary productivity, resulting in a high rate of root turnover and leaf clipping addition [19]. Although residential lawns receive inputs similar to agricultural systems, they are disturbed less frequently, thereby minimizing losses of SOC [20]. On average, turfgrass is a C-sequestering system [19], although C emissions are highly variable depending on management (e.g., mowing and fertilizer use), which may more than offset C fixation [21].
Studies of turfgrass in golf courses and residential areas have estimated mean soil C contents of 10 to 15 kg m−2 to 1-m depth [1,16,19]. Under high-intensity management, C is sequestered at rates of up to 0.91 kg m–2 yr−1 and will accumulate until reaching steady state in 30 to 50 years [19,22]. Due to intensive lawn management, SOC concentrations found in urban residential areas across the United States show less variability than unmanaged natural ecosystems [1]. Pouyat et al. [16] found similar SOC contents between urban residential soils in humid, temperate Baltimore, MD, and arid, continental Denver, CO. In contrast, the native forest ecosystems in Baltimore had 60% higher SOC to a depth of 20 cm relative to the shortgrass steppe ecosystems in Denver. These landscape- and regional-scale comparisons have documented the baseline effects of converting native vegetation to turfgrass, but do not adequately explain the effects of management on intraregional variability [17,23].
Previous studies of urban SOC have established the basic factors affecting C storage and flux in turfgrass ecosystems [17,19,22] as well as quantified SOC contents found in residential urban areas [1,7,16,24,25]. However, we are aware of no study that has investigated the relationship between homeowner management practices and the content and accumulation rate of SOC following conversion of forest to residential lawn. Given that the rate at which urban ecosystems store or emit C following conversion depends largely on the effects of individual practices implemented at the parcel scale [7,20,26], connecting SOC to management intensities and practices is key to understanding the variability of SOC response to conversion.
The scope of the current study was exurban, residential, turfgrass-dominated landscapes established on previously mixed-oak forested lands in the Valley and Ridge physiographic province of southwest Virginia. Our objectives were to: (1) determine soil carbon to a depth of 30 cm in converted lawns and adjacent forests; (2) relate soil C content to site-specific biophysical factors; and (3) relate lawn management practices of property owners to observed patterns in soil C content.

2. Experimental Section

2.1. Site Selection

Study sites were selected in exurban residential areas in mixed-oak forest lands in the Valley and Ridge physiographic province of Montgomery County and Roanoke County, Virginia. Average annual precipitation in Montgomery and Roanoke Counties is 1060 mm and 1044 mm, with mean annual temperatures of 11.9 °C and 13.2 °C, respectively. Average frost-free period ranges from 117 to 185 days. Soils in this province generally form from shale, siltstone, and sandstone parent materials and are characterized by a high coarse fragment content and shallow depths to bedrock (as shallow as 20 cm). Forest soils comprise well-drained silt loam texture to 10–20 cm depth, with increase in clay content at lower depths. Soil pH ranges from 4.8 to 5.2, and organic matter from 2% to 3%. Soils in the study area were most commonly mapped as the Berks-Weikert and Tumbling-Urban land complexes [27]. Forests consist mainly of oak (Quercus alba, Q. prinus, Q. velutina, and Q. coccinea) with some hickory (Carya glabra and C. alba), red maple (Acer rubrum), and yellow-poplar (Liriodendron tulipifera) forming the overstory; flowering dogwood (Cornus florida), sourwood (Oxydendrum arboreum), and blackgum (Nyssa sylvatica) often found in the mid-story; Vaccinium species and mountain laurel (Kalmia latifolia) in the understory; and infrequent downy rattlesnake plantain (Goodyera pubescens) in an otherwise sparse herbaceous layer. Average stand age on the study sites was ca. 100 years, with mean basal area of 10.7 m2 ha−1 (Table 1).
The experimental unit was defined as a single-family residential parcel that possessed a substantial turfgrass lawn (>75 m2) and was situated adjacent to native forest from which the parcel had been developed. A recruitment letter that included a document outlining the purpose of the project and a request to participate, a response card to indicate willingness was sent to owners of parcels that appeared suitable for the study. Of 325 letters sent, 147 residents responded that they were willing to participate and 26 indicated that they were not, resulting in a response rate of 53%. Parcels for which the current owner could not account for lawn care practices for a minimum of the preceding five years were immediately disqualified from the candidate pool.
Once the list of candidate parcels was compiled, a field survey was conducted to determine the suitability of individual parcels for inclusion in the study. Field criteria for parcel selection included extent of lawn area (>75 m2), proximity to remnant forest (an area of forest is found within the parcel boundary), and degree of disturbance of the native land form. The confounding nature of variable site development was minimized by sampling portions of the lawn where minimal modification of the natural landform was observed. Identification of such sites required finding areas where the contour of the land under the lawn matched the contour of the surrounding forest, indicating that only the forest O horizon had been altered followed by grass seeding upon the residual O or A horizon. This determination was facilitated on many parcels by the presence of remnant forest trees within lawn areas whose trunk flare exposure served as a visual gauge of the extent of soil removal and/or filling that had occurred during site development. Based on these criteria, 64 parcels out of the 147 prospects were selected for the study. Homes were constructed between 1958 and 2005, and average year of construction was 1986.
Table 1. Tree measurement data for mixed oak forests and adjacent residential lawns (grouped by subdivision) located in the Valley and Ridge physiographic province of southwest Virginia. Each value is the mean of all sample plots (n) for each landscape type within each subdivision.
Subdivision (n)Basal Area (m2/ha)Tree Height (m)Trees per HectareBasal Area of Most Common Tree Species (m2/ha)
Brush Mountain
Forest (5)132389Quercus alba (10.1); Q. prinus (1.2); Q. coccinea (1.0)
Lawn (5)22036Q. prinus (3.4); Q. alba (0.9); N. sylvatica (0.1)
Cherokee Hills
Forest (4)1324111Acer rubrum (3.2); Q. prinus (2.7); N. sylvatica (1.7)
Lawn (4)91840Q. alba (14.1); Q. prinus (7.5); Carya alba (0.6)
DeerCroft
Forest (5)152469Q. prinus (8.8); Q. alba (2.7); C. alba (1.5)
Lawn (5)92255Q. prinus (0.4); Q. alba (1.2); C. glabra (2.0)
Forest Hill
Forest (2)142553Q. alba (8.9); Q. rubra (2.2); Liriodendron tulipifera (2.6)
Lawn (6)92541Q. alba (1.3); Q. rubra (0.2); L. tulipifera (0.9)
Glenvar Heights
Forest (8)42575A. rubrum (1.4); Q. alba (0.9); Q. coccinea (0.5)
Lawn (11)32551Q. rubra (0.4); Q. alba (2.2); Q. prinus (0.2)
Laurel Ridge
Forest (14)1321113Q. prinus (4.6); A.rubrum (2.3); Pinus rigida (2.0)
Lawn (14)101986Q. prinus (3.5); Q. rubra (1.0); N. sylvatica (0.4)
Mossy Spring
Forest (2)82781Q. alba (2.5); C. alba (0.4); Q. rubra (0.2)
Lawn (3)62558L. tulipifera (1.2); C. alba (0.4); Q. alba (0.8)
Oilwell Road
Forest (8)823109A. rubrum (1.9); Q. prinus (1.4); Q. alba (1.4)
Lawn (8)52075Q. alba (1.2); A. rubrum (0.8); Q. rubra (0.2)
Preston Forest
Forest (5)1023101Q. prinus (5.1); Q. coccinea (1.2); Q. alba (1.0)
Lawn (6)71930Q. prinus (3.0); A. rubrum (1.8); Q. alba (1.8)
Entire Study Area
Forest (57)112489Q. alba (3.2); Q. prinus (2.4); A. rubrum (0.8)
Lawn (64)72152Q. alba (1.6); Q. prinus (1.2); A. rubrum (0.2)

2.2. Field Measurements

A total of 64 parcels were sampled between May and July 2010. Two measurement plots were established on each parcel: one in the lawn and one in the adjacent forest stand. Placement of lawn and forest plots required finding areas that were representative of the prevailing landscape and minimally influenced by attributes of the adjacent land use (e.g., yard waste stockpile areas in the forest). Major considerations when establishing the lawn plot included proximity to the house (where maximum levels of soil profile disturbance likely occurred), septic field, impervious surfaces, and forest edge (no closer than 4 m from plot center). When positioning the forest plot, the forest area around the house was carefully observed in order to identify a representative forest area that was undisturbed. Areas where yard waste (e.g., leaves) had been raked into the adjacent forest edge and areas where the forest had been managed for aesthetics (e.g., clearing and thinning of the understory) were avoided during plot placement. In most instances, the forest plot was situated at the same aspect, elevation, and slope position as the adjacent lawn plot. Aspect azimuth measured in degrees was transformed using Beers Transformation [28], in which degrees are assigned to a number ranging from 0.00–2.00, with 0 being southwest (the hottest, driest aspect) and 2 being northeast (the coolest, most moist aspect).
At the center of each lawn and forest plot, four 5-cm diameter sequential soil cores (0–5 cm, 5–10 cm, 10–20 cm, and 20–30 cm depths) were collected using a slide hammer sampler (AMS Soil Core Sampler, America Falls, ID) for measurement of soil bulk density. Next, a 3-cm diameter push-tube sampler was used to collect four soil subsamples 1 m away from the plot center in the cardinal directions. Each push tube sample was divided into four depth increments (0–5 cm, 5–10 cm, 15–20 cm, and 25–30 cm). The four subsamples for each depth increment were composited and mixed on site. On seven parcels, a single forest remnant was sampled only once for two or three adjacent lawns. In these cases, the forested area was immediately between adjacent lawns that had similar aspect and slope.
Forest vegetation was recorded using a 200-m2 circular plot centered on each bulk density sampling location. All trees greater than 5 cm in diameter at breast height (1.3 m) were tallied by species and trunk diameter. In lawns, trees were visually categorized as residual forest trees or transplanted landscape trees. Additionally, the following site variables were measured at each plot: distance and azimuth to the dripline of nearest tree(s) in the lawnscape; height of nearest trees; distance and azimuth to the house; slope aspect; slope grade; distance and azimuth to the septic field (where applicable); and turfgrass density (low density, with bare spots; medium density, no bare spots; high density).

2.3. Laboratory Measurements

Bulk density soil samples were first oven-dried at 105 °C for 24 h, then passed through a 2-mm sieve to remove coarse fragments and woody debris. Total mass of soil and coarse fragments (>2 mm) were recorded and divided by the sampled volume to calculate bulk density. The composited soil subsamples collected with the push tube were air-dried for 24 h, passed through a 2-mm sieve, and hand-sorted to remove visible root fragments using tweezers. A 1-g sample was then collected from each processed subsample and oven-dried at 105 °C for at least 24 h prior to being analyzed for C and N concentration (%) by dry combustion (Vario Max, Elementar Americas, Trenton, NJ, USA). C content (g/cm3) was then determined by C concentration and soil bulk density for each depth. A portion of each composited subsample from the 0–10 cm depth was sent to the Virginia Tech Soil Testing Laboratory for analysis of pH, cation exchange capacity, soluble salts, and extractable nutrients (P, K, Ca, Fe, B, and Al) [29].

2.4. Survey of Lawn Management Practices

Property owners were surveyed about lawn management practices on their parcels over the previous five years. Participants had the choice of completing the survey on a website or paper form. The survey asked a series of questions regarding the homeowner’s lawn care practices, including questions about fertilization, pesticide use, irrigation, and aeration frequency. For each question, participants chose from a list the response that described how they manage their lawn. An example of a question included in the survey was, “Do you apply fertilizer to your lawn?” to which the participant could choose, “Never” “Once Per Year” “Spring & Fall” or “Three or More Times Per Year” These data were assigned an ordinal category of 1 to 4, with 1 describing the least intensive and 4 describing the most intensive fertilization regime. Data on fertilization and other management practices were combined to derive a management intensity score ranging from 1 (lowest management) to 3 (highest management). In addition to lawn care questions, the survey contained 11 questions about the homeowner’s environmental attitudes utilizing the environmental commitment (EC) scale devised by Davis et al. [30]. This EC survey included questions such as “I feel strongly linked to the environment” and “I feel committed to keeping the best interests of the environment in mind”. Each item was measured using an ordinal scale from to 1 to 7, with 1 = “strongly disagree”, 4 = “neutral” and 7 = “strongly agree”. All items were then averaged to create a summated mean EC score.

2.5. Data Analysis

All statistical analyses were performed using JMP 9 software system (SAS Institute, Cary, NC, USA). Pearson’s correlation was used to examine relationships between property characteristics such as age since conversion or management intensity, and soil properties. Paired t-tests were used to compare C concentrations and content and bulk density between adjacent forest and lawn. To meet model assumptions of normality and homogeneity of variance, dependent variables were transformed where needed prior to statistical analysis. For survey data, a two-step cluster analysis was conducted using SPSS (IBM Corporation) with combinations of management practices (e.g., fertilization, pesticide use, aeration) in order to identify groups of parcel owners with similar responses to management questions. High-quality clustering schemes are indicated by the level of cohesion and separation as well as the balance of the resulting clusters. The highest-quality clustering group contained only the variables pesticide and fertilizer with level of separation and cohesion >0.5. The self-reported and retrospective information about homeowner’s EC was used to test for relationships among reported management practices and soil properties.

3. Results and Discussion

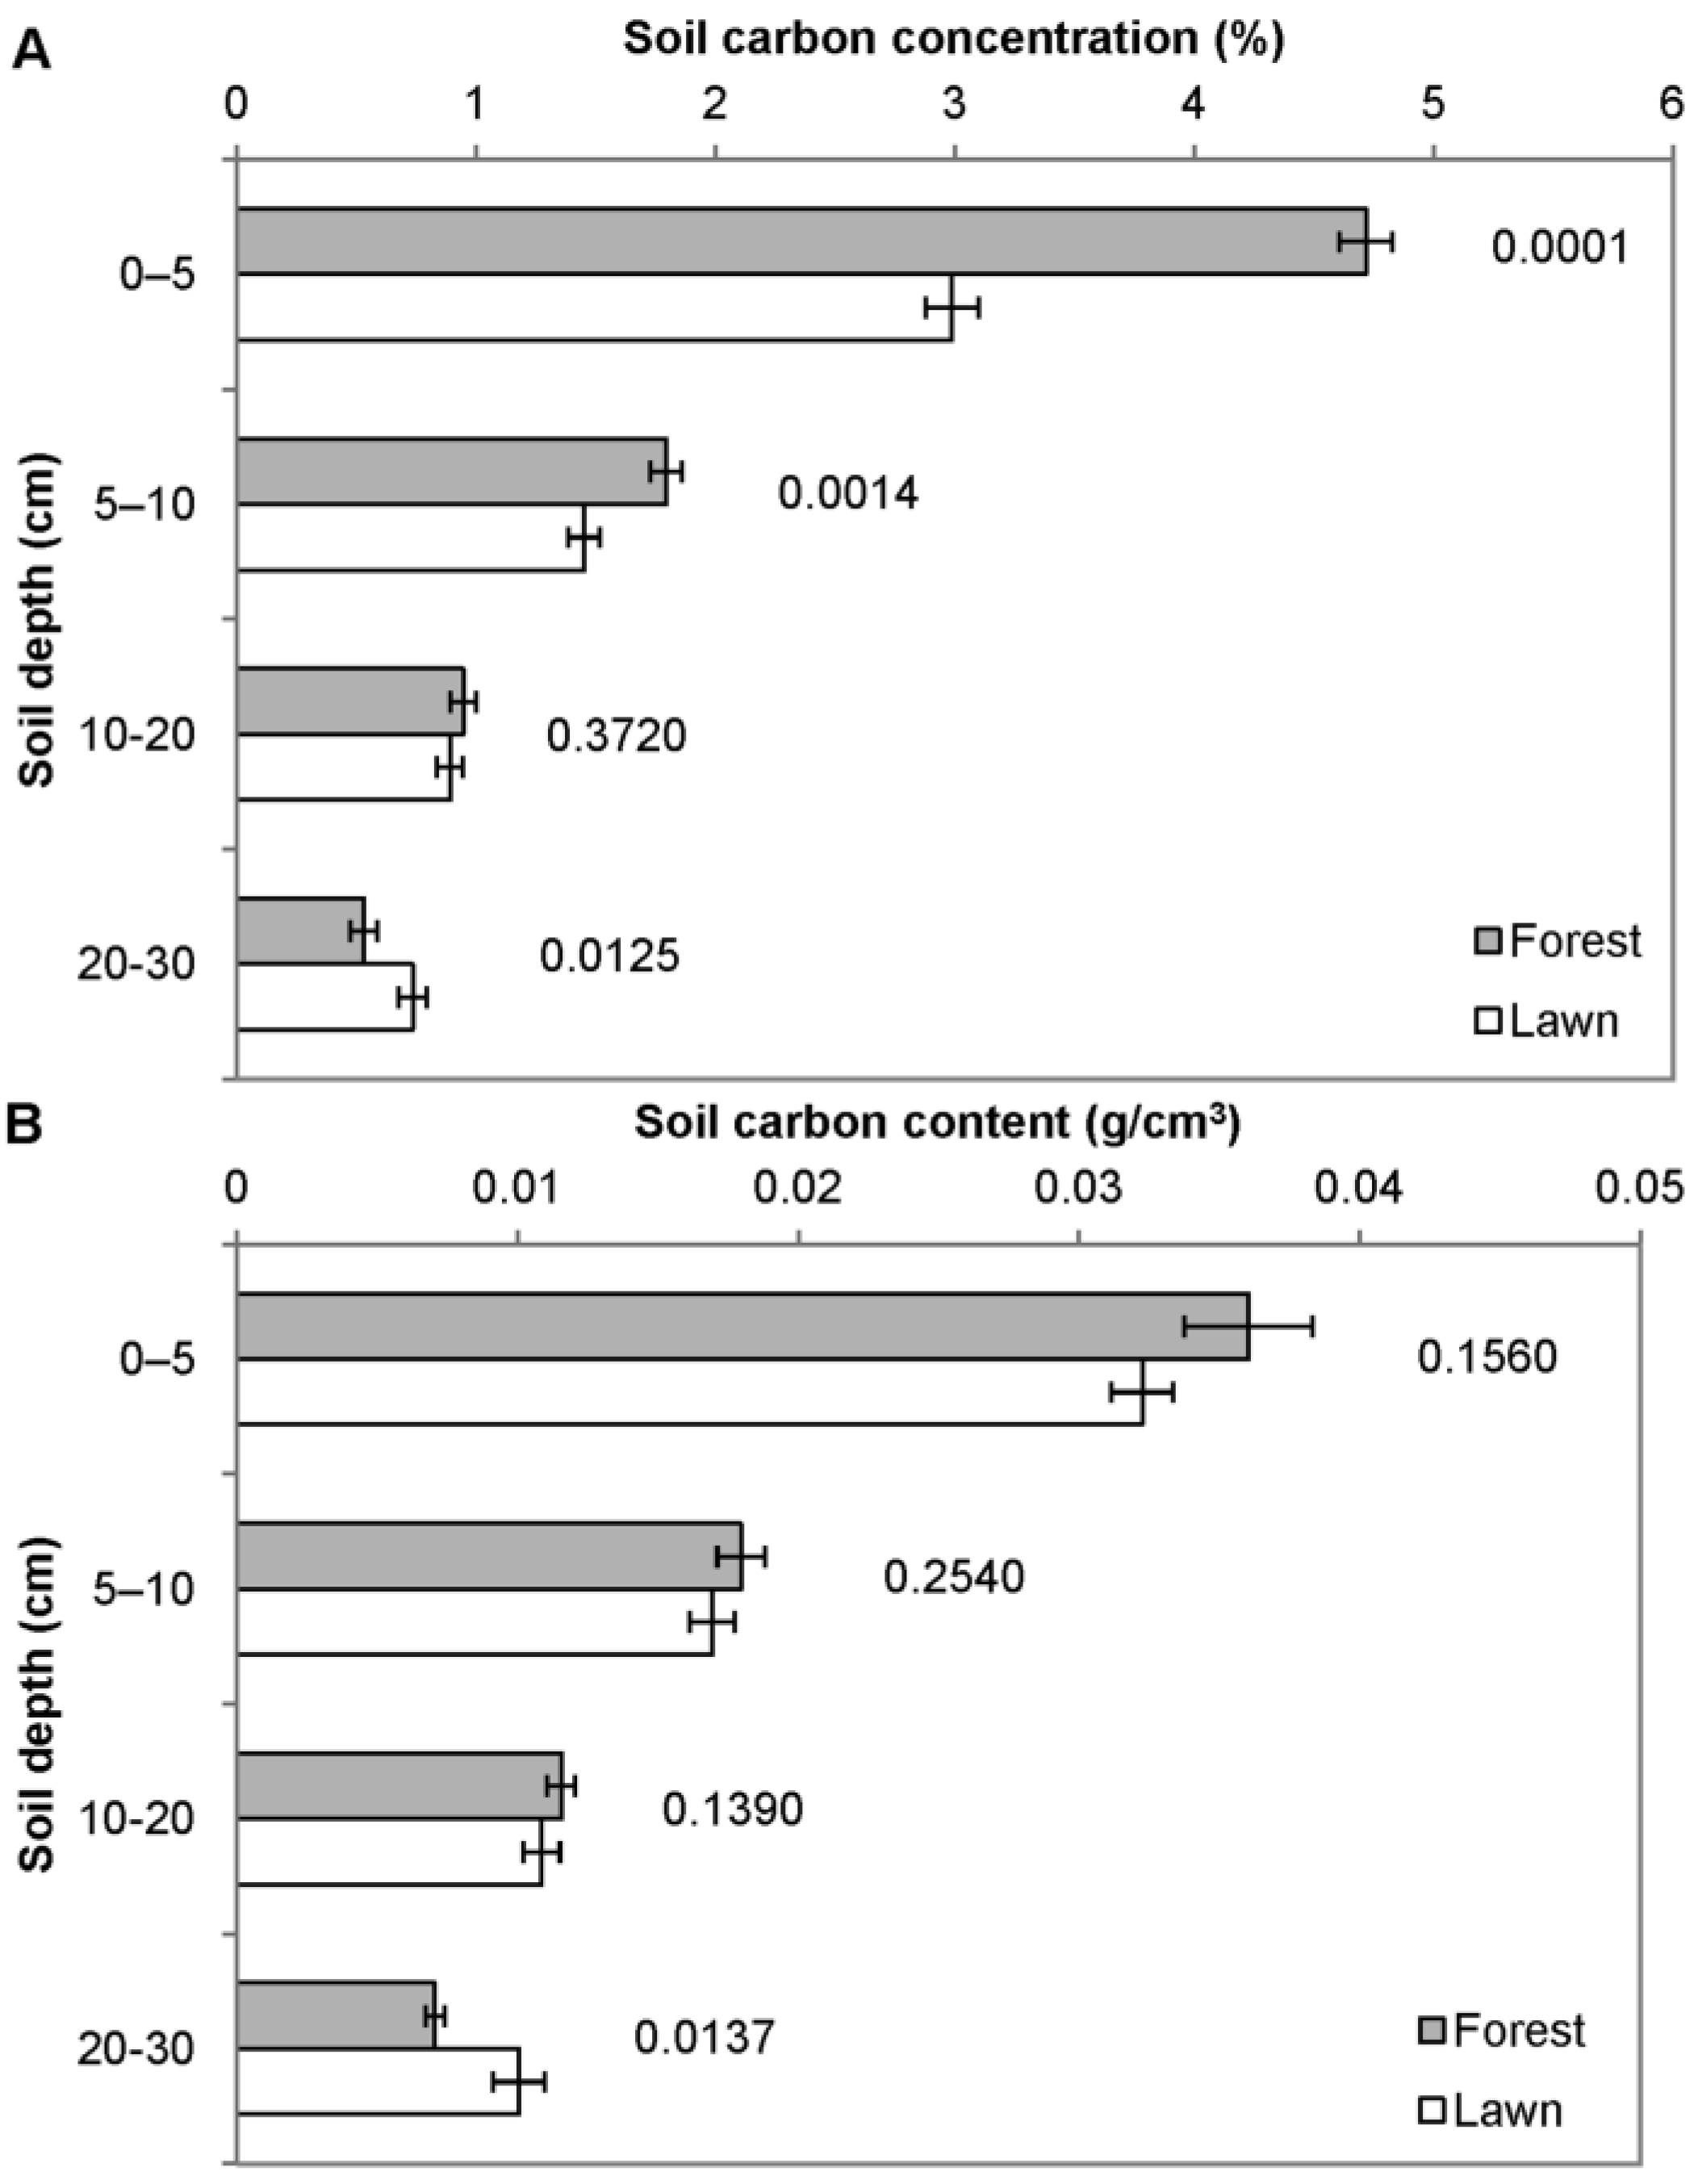
3.1. Carbon Storage in Lawns and Adjacent Forest

Soil C concentrations were higher in forest soils at the 0–5 cm (p < 0.0001) and 5–10 cm (p = 0.0014) depths, while lawn soils had greater C concentrations at the 20–30 cm depth (p = 0.0125) (Figure 1a). There was a positive relationship between C concentration in the lawn and time since development at the 0–5 cm depth (r = 0.268, p = 0.04) (Figure 2). Total soil C content to 30 cm in lawns (6.5 kg C/m2) and forests (7.1 kg C/m2) marginally differed (p = 0.08); however, lawn soils contained significantly greater C than forest soil at the 20–30 cm depth (0.010 vs. 0.007 g C/cm3, p = 0.0137), (Figure 1b).
Figure 1. Mean soil C concentration (A) and content (B) with SE shown at four soil depths in mixed oak forests and adjacent residential lawns in the Valley and Ridge physiographic province of southwest Virginia. P-values are indicated to the right of each landcover comparison.
Forests 05 00425 g001
Figure 2. Correlation between soil carbon concentration in the upper 0–5 cm of lawn soil and time since land development for residential parcels developed in mixed oak forests in the Valley and Ridge physiographic province of southwest Virginia (p = 0.0352).
Forests 05 00425 g002
There was a positive relationship between fertilization frequency and C content in soil under lawns at the 0–5 cm depth (r = 0.423, p = 0.0005) (Figure 3). The relationship between C content in lawn soil and parcel age was weak across all depth intervals. There was a marginal positive relationship at the 0–5 cm depth (p = 0.12) and a marginal negative relationship at the 20–30 cm depth (p = 0.08). There was no significant relationship between lawn soil carbon content and slope, aspect, or soil pH at any soil depth interval.
Figure 3. Correlation between C content in the upper 0–5 cm of lawn soil and the lawn fertilization frequency reported by homeowners for residential parcels developed in mixed oak forests in the Valley and Ridge physiographic province of southwest Virginia. Fertilization effect was highly significant (p = 0.005).
Forests 05 00425 g003

3.2. Other Soil and Turf Variables

Forest soils had a significantly higher C:N ratio than lawn soils at all depth intervals except 20–30 cm (Table 2). Lawn soils had significantly higher bulk density at 0–5 cm and 5–10 cm depths, but did not differ at deeper depths (Table 2). There was a positive relationship between forest C and N contents at the 0–5 cm depth (p = 0.05), a positive relationship between C content and C:N ratio (p < 0.0001) and N content (p = 0.05) at the 5–10 cm depth, a positive relationship between C content and C:N ratio at the 10–20 cm depth (p < 0.0001), and a positive relationship between C content and C:N ratio (p < 0.0001), N content (p = 0.03), bulk density (p = 0.005), and pH (p = 0.04) at the 20–30 cm depth. Fertilization frequency reported by homeowners showed a strong positive correlation with turfgrass density (p = 0.0003).
Table 2. Average carbon-nitrogen ratio and bulk density measured at four soil depths in mixed oak forests and adjacent residential lawns in the Valley and Ridge physiographic province of southwest Virginia. Lower sample size with greater soil depth is due to encountering bedrock or buried stones with core sampler at depth.
Carbon/Nitrogen RatioBulk Density (g/cm3)
Soil Depth (cm)nForestLawnp-valuenForestLawnp-value
0–56221.813.60.0001640.811.100.0001
5–106222.414.90.0001631.021.180.0001
10–206118.414.50.0002591.261.260.9733
20–305514.313.50.3845441.371.400.6505

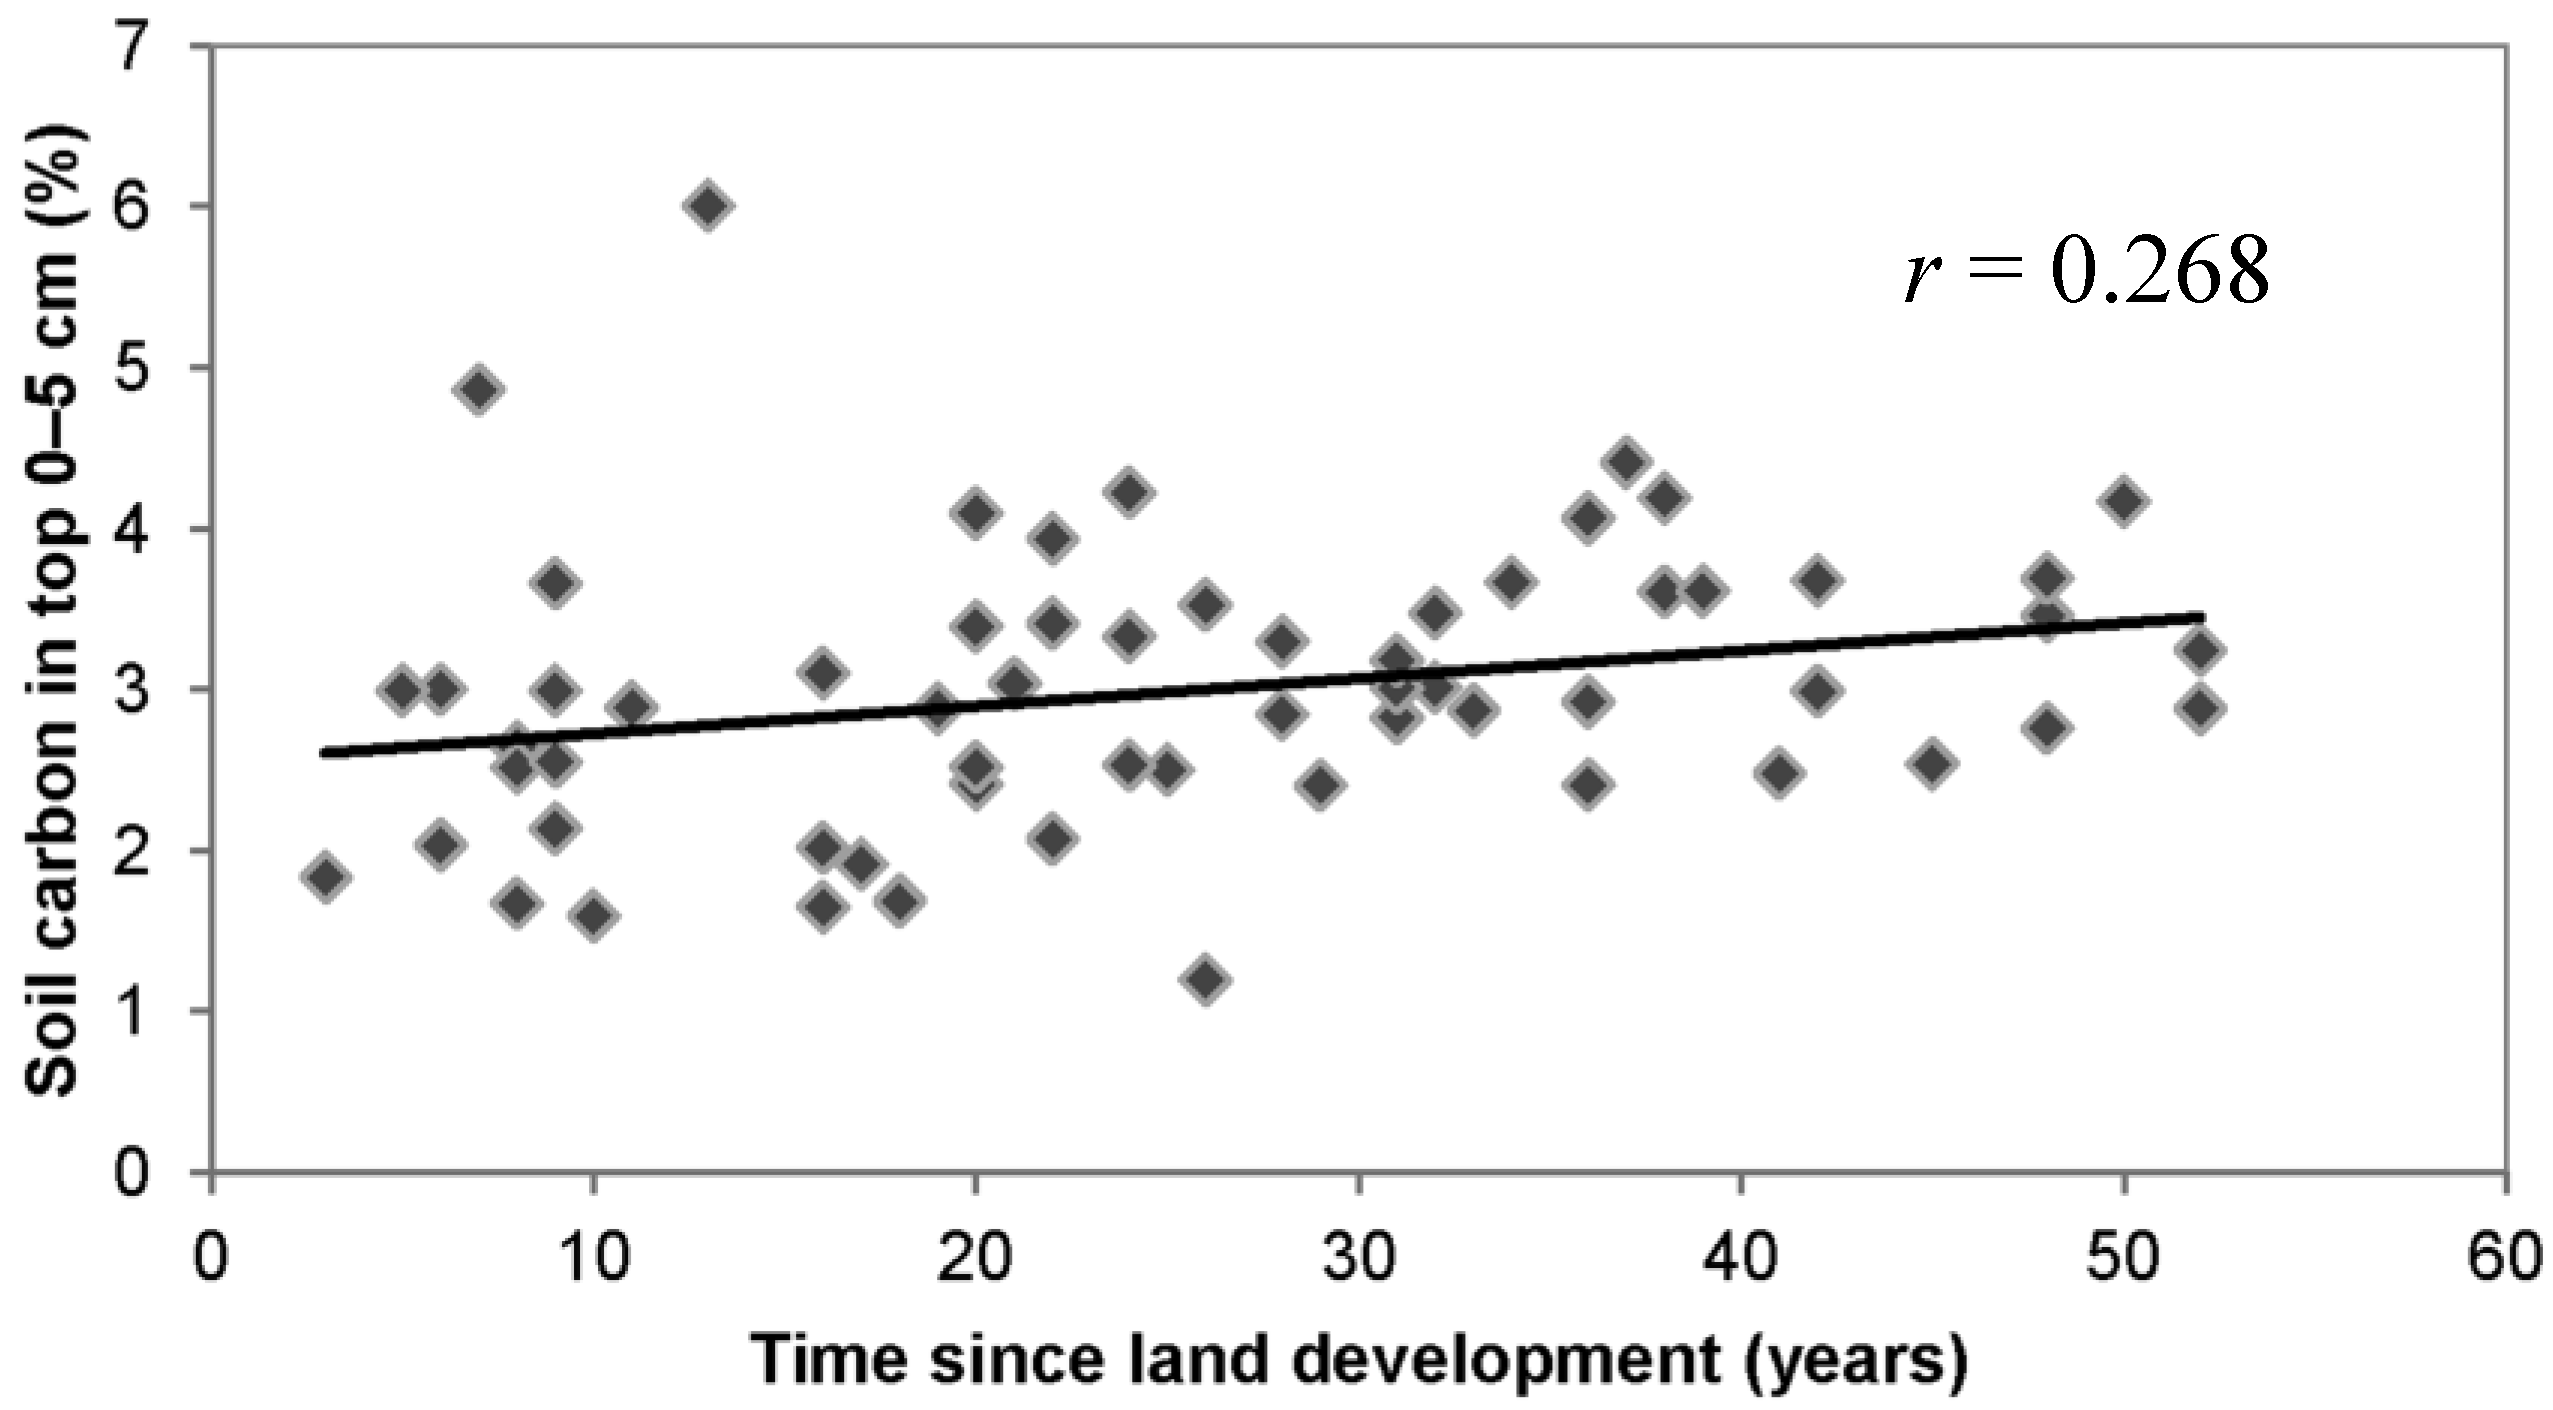
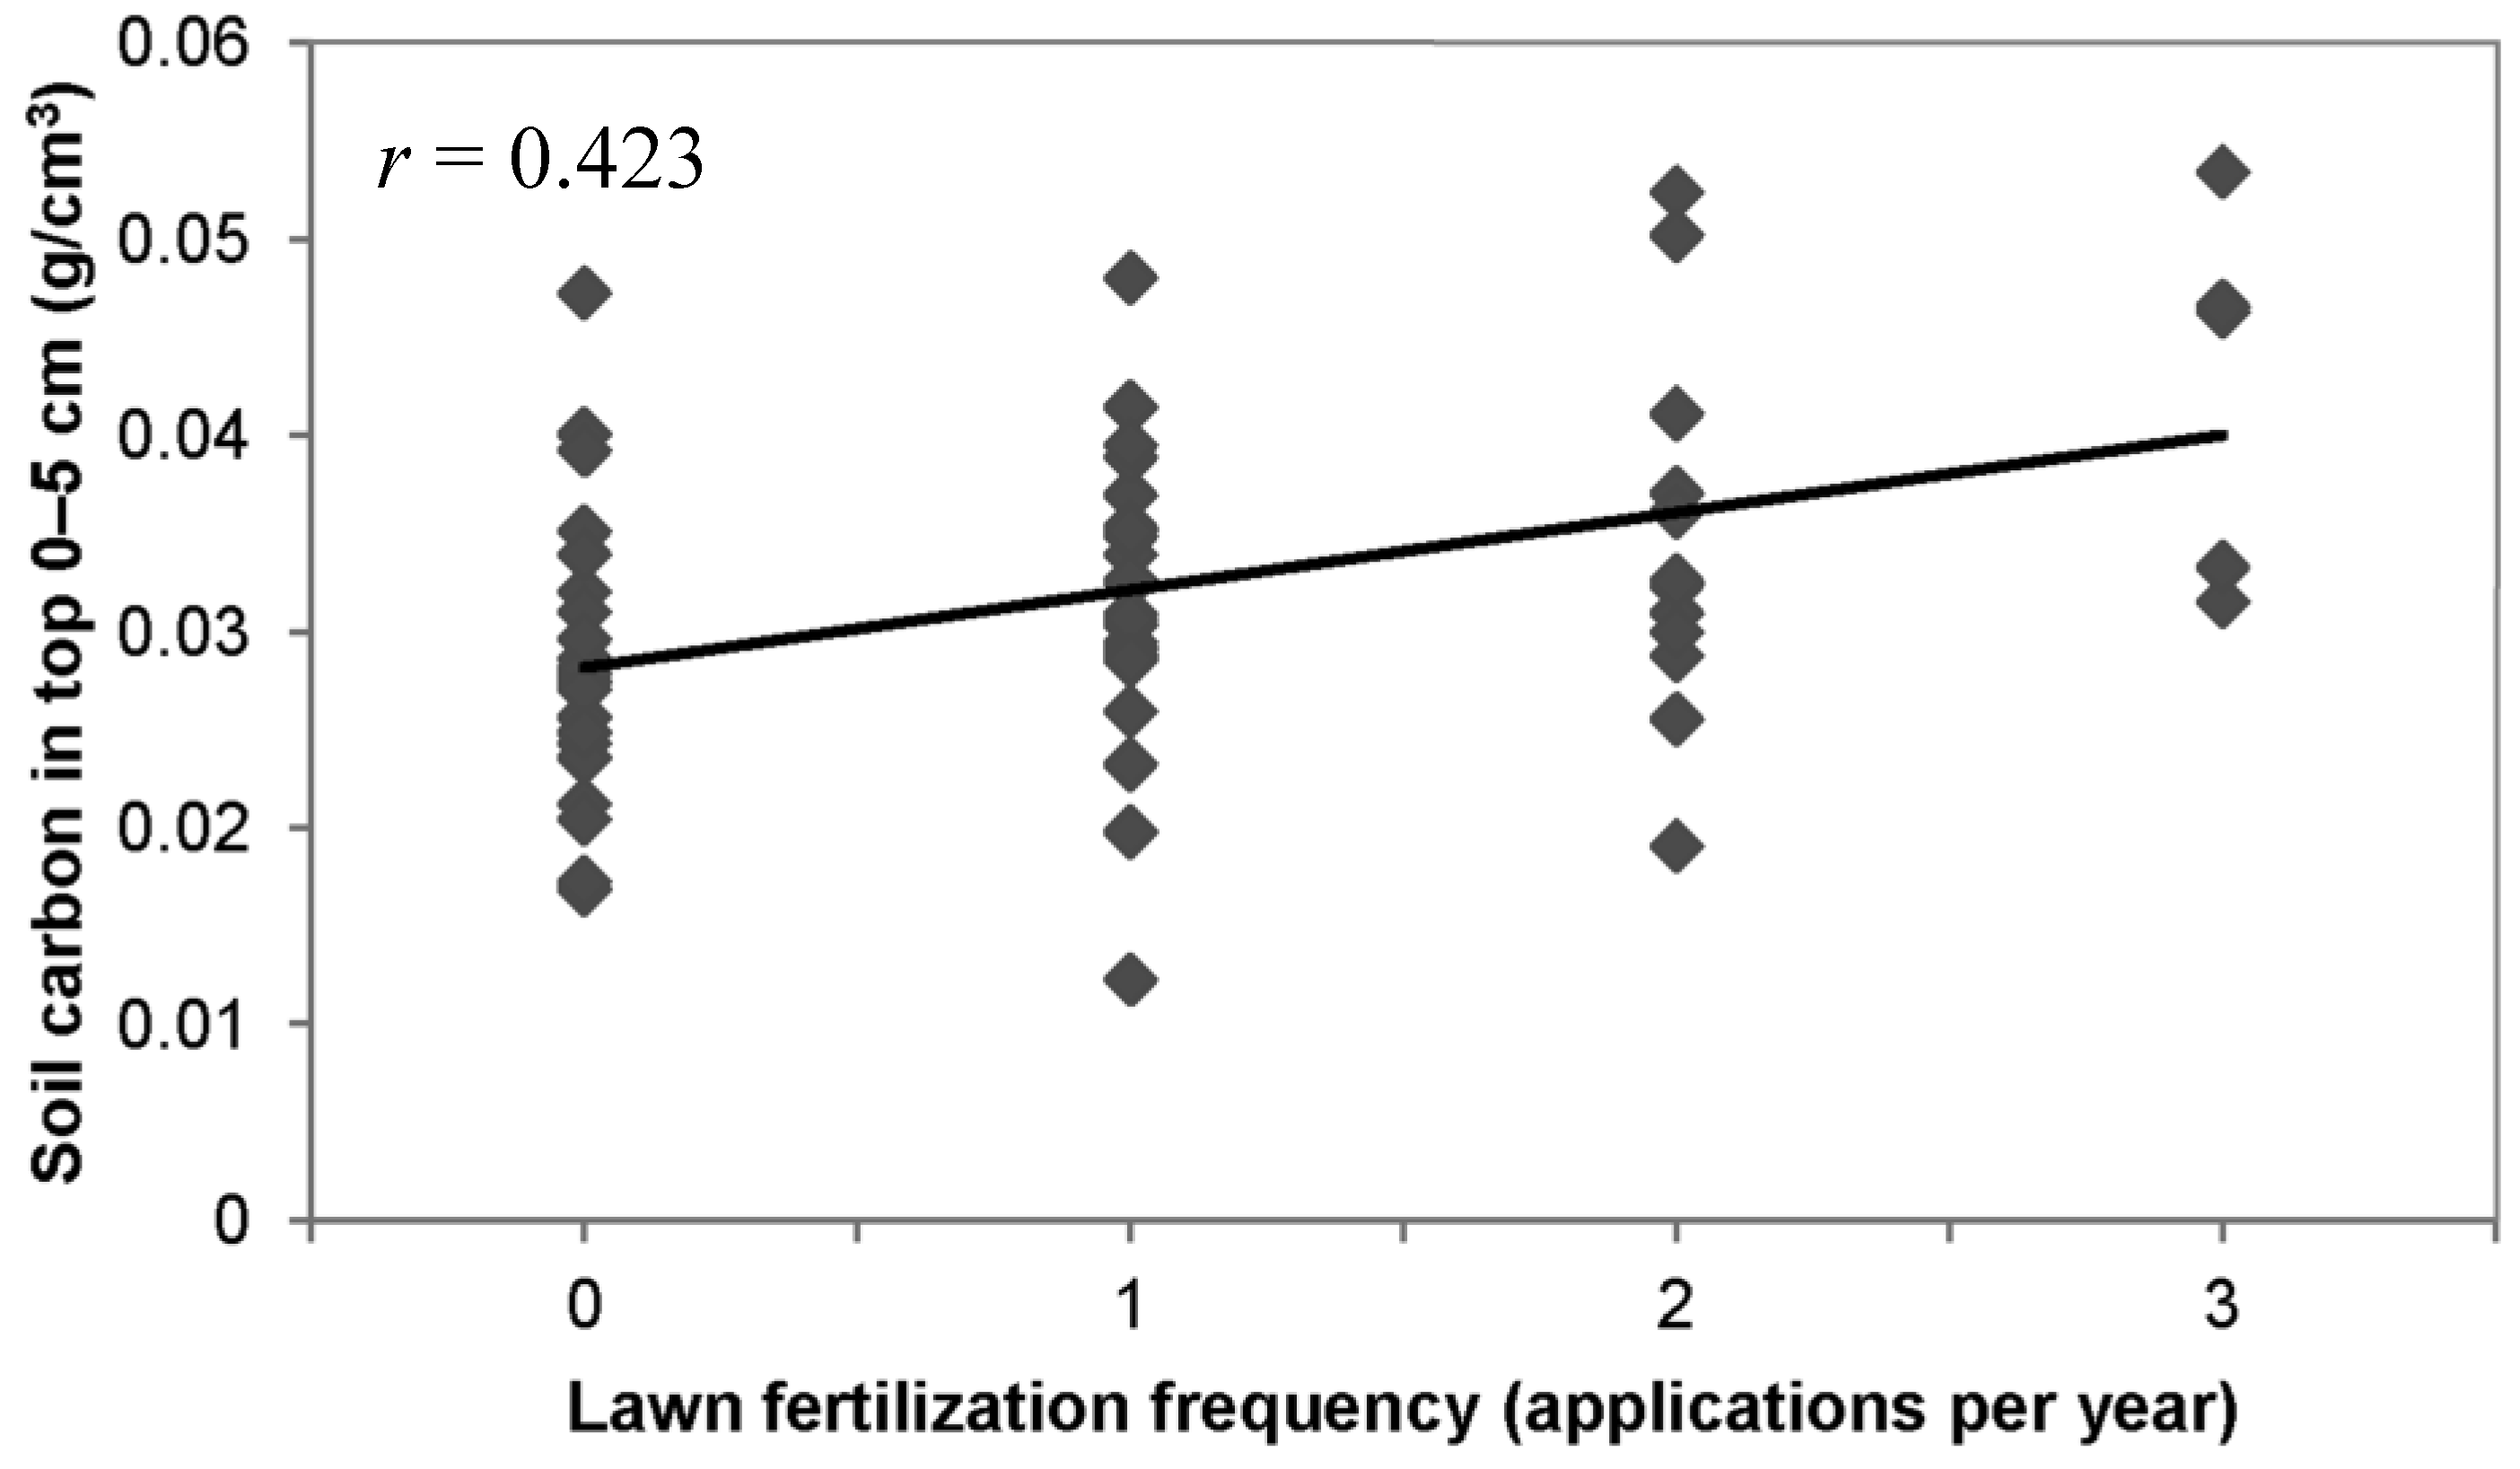
3.3. Lawn Management Practices, Owner Environmental Attitudes, and Soil Carbon

There was a positive relationship (p = 0.024) between overall environmental commitment (EC) score and level of management intensity (fertilizer and pesticide use). EC scores averaged 5.75, 5.90, and 6.24 in the low, medium, and high management intensities, respectively. There were also significant positive relationships between soil carbon concentration and EC at all soil depths except 5–10 cm (p = 0.91, 0.012, and 0.025 at 0–5, 10–20, and 20–30 cm, respectively). Carbon density was also positively correlated with EC at the 10–20 (p = 0.070) and 20–30 cm depths (p = 0.059).

3.4. Discussion

Total soil C content to 30 cm depth of lawn (6.5 kg C/m2) and forest (7.1 kg C/m2) marginally differed (p = 0.08); however, lawn soils contained significantly greater C than forest soils at the 20–30 cm depth (0.010 vs. 0.007 g C cm−3, p = 0.0137). These results support previous comparisons by Pouyat et al. [1,16], and Raciti et al. [31], which found comparable levels of SOC in lawns and nearby forests in the northeastern and mid-Atlantic US The difference in depth distribution between forest and lawn is supported by Pouyat et al. [16], where nearby forest soil was found to have a greater proportion of C in the top 20 cm than residential lawns, lawn C being more evenly distributed across greater depths. This deeper distribution of C in turfgrass systems is attributed to the deeper soil depths attained by fine root mass in managed turfgrass, as well as natural grassland systems than by fine tree roots in a forest setting [32]. During sample collection, grass roots were observed to depths of up to 30 cm, while fine tree roots were concentrated in the top 10 cm.
The relationship between C concentration and time since development in lawn soils at the 0–5 cm depth (p = 0.04) suggests that lawn soil C may be increasing with time; however, there was no significant trend between C content and time. Raciti et al. [31] also observed a lack of significant C accrual with property age in parcels transformed from forest. Compaction in the upper 0–10 cm of lawns, which likely resulted from site development, also had an impact on comparisons of forest and lawn C content. Lawns had significantly lower C concentrations than forests at 0–10 cm, but due to their significantly increased bulk density, their C content did not differ from that of forests.
Based on the homeowner survey, we found a positive correlation between reported lawn fertilization frequency and lawn C content (p = 0.0005) in the top 0–5 cm of soil. Singh [33] observed the same phenomenon in a controlled lawn study in which higher levels of fertilization resulted in a faster rate of SOC accrual in the top 0–6 cm. Fertilization enhances vegetation productivity; therefore, belowground C additions are also enhanced. Fertilization is also known to decrease heterotrophic soil respiration, and over time this could lead to greater soil C accumulation. Gough and Seiler [34] and Tyree et al. [35] both observed decreased heterotrophic respiration in loblolly pine (Pinus taeda L.) seedlings following fertilization. Bowden et al. [36] observed the same phenomenon in a deciduous forest, with microbial respiration rates reduced by 41% during the growing season in fertilized plots. Similarly, Johnson et al. [37] found that fertilization reduced heterotrophic respiration in grasslands. How changes in heterotrophic respiration may impact soil carbon content is complex and depends on the nature of the organic matter being consumed by the microbial community [38] and decreased microbial activity in the long-term may not necessarily be positive for soil productivity [39]. The addition or removal of cut grass clippings could also have an impact on C contents in turfgrass soils; however, this was not found to be a significant variable in our study.
Our results indicate that there is a connection between homeowners’ environmental attitudes and lawn management practices. Interestingly, homeowners with a higher EC used more pesticides and fertilizer, which of course may or may not be good for the environment. EC was also related to both lawn carbon concentration and content, likely as a result of the fertilizer and pesticide increasing lawn productivity, as we did find turfgrass density strongly related to fertilization. Mangiafico et al. [40] found that New Jersey homeowners with higher environmental concerns did not have better lawn horticultural practices, suggesting that strong environmental values do not translate into better horticultural practices or knowledge. In our case, homeowners with greater EC scores did care for their lawns more. Other surveys have found that homeowners place high value on environmental issues, but also value aesthetically attractive lawns [41,42]. Heavy pesticide and fertilizer use may not always be good practice. Sewell et al. [41] found that only 3% of respondents had ever tested their soils, even though 91% applied fertilizer at least once a year. As a result many lawns may be over fertilized.
We found only a marginally significant difference in soil C storage between unmanaged mixed oak forests (7.1 kg C m−2) and residential turfgrass systems (6.5 kg C m−2) in the Valley and Ridge physiographic province of southwest Virginia. Lawns did have a more uniform C distribution across depths, and there was a trend of increasing C concentration with time. However, soil is only one terrestrial ecosystem C reservoir; carbon is also contained in above- and below-ground biomass (plant and animal). Forest ecosystems of the United States contain approximately 52 billion metric tons of C, 59% in soils (to a depth of 1 m), 31% in trees, 9% in litter, and 1% in understory vegetation [43]. Jo and McPherson [21] found that C storage in grass, turfgrass stubble, and roots accounted for 0.5%–0.7% of C; trees and shrubs accounted for 10.6%–20.8%; and soil storage accounted for 78.7%–88.7% of total C stored in an urban residential area. Besides measuring the C uptake and loss associated with vegetation and soils, accounting for the C sequestration of a given land use includes measurement of C losses associated with management. Unmanaged forest land requires no management input, while residential lawns are constantly maintained during the growing season. Management activities, including mowing and application of fertilizer and pesticides, result in direct and indirect emissions of CO2. Jo and McPherson [21] quantified C gains and losses associated with turfgrass and found that mowing of lawns returns 1 to 5 times of their sequestered C to the atmosphere annually.

4. Conclusions

Converting unmanaged Appalachian hardwood forest into managed, turfgrass-dominated residential landscapes may affect C depth distribution, but results show little change in total soil carbon sequestration in the upper 30 cm. Carbon concentration, but not content, also increased in lawns with time since conversion. Homeowners who believe they are more committed to the environment managed their lawns more intensely and had lawns with increased lawn C content.

Conflicts of Interest

The authors declare no conflict of interest.

References

  1. Pouyat, R.V.; Yesilonis, I.D.; Russel-Anelli, J.; Neerchal, N. Soil chemical and physical properties that differentiate urban land-use and cover types. Soil Sci. Soc. Am. J. 2006, 71, 1010–1019. [Google Scholar]
  2. Scharenbroch, B.C.; Lloyd, J.E.; Johnson-Maynard, J.L. Distinguishing urban soils with physical, chemical, and biological properties. Pedobiologia 2005, 49, 283–296. [Google Scholar] [CrossRef]
  3. Lorenz, K.; Lal, R. Biogeochemical C and N cycles in urban soils. Environ. Int. 2009, 35, 1–8. [Google Scholar] [CrossRef]
  4. Brown, D.G.; Johnson, K.M.; Loveland, T.R.; Theobald, D.M. Rural land use trends in the coterminus United States, 1950–2000. Ecol. Appl. 2005, 15, 1851–1863. [Google Scholar] [CrossRef]
  5. Beyer, L.; Blume, H.P.; Elsner, D.C.; Willnow, A. Soil organic matter and microbial activity in urban soils. Sci. Total Environ. 1995, 168, 267–278. [Google Scholar] [CrossRef]
  6. Lal, R. Soil carbon sequestration impacts on global climate change and food security. Science 2004, 304, 1623–1627. [Google Scholar] [CrossRef]
  7. Pataki, D.E.; Alig, R.J.; Fung, A.S.; Golubiewski, N.E.; Kennedy, C.A.; McPherson, E.G.; Nowak, D.J.; Pouyat, R.V.; Lankoa, P.R. Urban ecosystems and the North American carbon cycle. Glob. Chang. Biol. 2006, 12, 1–11. [Google Scholar] [CrossRef]
  8. Lal, R. Soil erosion impact on agronomic productivity and environment quality. Crit. Rev. Plant Sci. 1998, 17, 319–464. [Google Scholar] [CrossRef]
  9. Post, W.M.; Kwon, K.C. Soil carbon sequestration and land-use change: Processes and potential. Glob. Chang. Biol. 2000, 6, 317–327. [Google Scholar] [CrossRef]
  10. Lubowski, R.; Vesterby, M.; Bucholtz, S.; Baez, A.; Roberts, M. Major Uses of Land in the United States, 2002. USDA ERS Economic Information Bulletin No. EIB-14. 2006. Available online: http://www.ers.usda.gov/Publications/EIB14 (accessed on 31 July 2012).
  11. Nowak, D.J. Institutionalizing urban forestry as a “biotechnology” to improve environmental quality. Urban For. Urban Green. 2006, 5, 93–100. [Google Scholar] [CrossRef]
  12. Curtis, P.S.; Hanson, P.J.; Bolstad, P.; Barford, C.; Randolph, J.C.; Schmid, H.P.; Wilson, K.B. Biometric and eddy-covariance based estimates of annual carbon. Agric. For. Meterology 2002, 113, 3–19. [Google Scholar] [CrossRef]
  13. Pouyat, R.V.; Pataki, D.E.; Belt, K.T.; Groffman, P.M.; Hom, J.; Band, L.E. Effects of Urban Land-use Change on Biogeochemical Cycles. In Terrestrial Ecosystems in a Changing World; Canadell, J.G., Pataki, D.E., Pitelka, L.F., Eds.; Springer-Verlag: Berlin, Germany, 2007; pp. 45–58. [Google Scholar]
  14. Pickett, S.T.A.; Cadenasso, M.L.; Grove, J.M.; Groffman, P.M.; Band, L.E.; Boone, C.G.; Burch, W.R., Jr.; Grimmond, S.B.; Hom, J.; Jenkins, J.C.; et al. Beyond urban legends: An emerging framework of urban ecology, as illustrated by the Baltimore Ecosystem Study. BioScience 2008, 58, 139–150. [Google Scholar] [CrossRef]
  15. Golubiewski, N.E. Urbanization increases grassland carbon pools: Effects of landscaping in Colorado’s front range. Ecol. Appl. 2006, 16, 555–571. [Google Scholar] [CrossRef]
  16. Pouyat, R.V.; Yesilonis, I.D.; Golubiewski, N.E. A comparison of soil organic carbon between residential turf grass and native soil. Urban Ecosyst. 2009, 12, 45–62. [Google Scholar] [CrossRef]
  17. Milesi, C.; Running, S.W.; Elvidge, C.E.; Dietz, J.B.; Tuttle, B.T.; Nemani, R.R. Mapping and modeling the biogeochemical cycling of turf grasses in the United States. Environ. Manag. 2005, 36, 426–438. [Google Scholar] [CrossRef]
  18. Bormann, F.H.; Balmori, D.; Geballe, G.T. Redesigning the American Lawn: A Search for Environmental Harmony, 2nd ed.; Yale University Press: New Haven, CT, USA, 2001. [Google Scholar]
  19. Qian, Y.; Follett, R.F. Assessing soil carbon sequestration in turfgrass systems using long-term soil testing data. Agron. J. 2002, 94, 930–935. [Google Scholar] [CrossRef]
  20. Kaye, J.P.; Groffman, P.M.; Grimm, N.B.; Baker, L.A.; Pouyat, R.V. A distinct urban biogeochemistry? Trends Ecol. Evol. 2006, 21, 192–199. [Google Scholar] [CrossRef]
  21. Jo, H.-K.; McPherson, E.G. Carbon storage and flux in urban residential greenspace. J. Environ. Manag. 1995, 45, 109–133. [Google Scholar] [CrossRef]
  22. Bandaranayake, W.; Qian, Y.L.; Parton, W.J.; Ojima, D.S.; Follett, R.F. Estimation of soil organic carbon changes in turfgrass systems using the century model. Agron. J. 2002, 95, 558–563. [Google Scholar]
  23. Qian, Y.L.; Bandaranayake, W.; Parton, W.J.; Mecham, B.; Harivandi, M.A.; Mosier, A.R. Long-term effects of clipping and nitrogen management in turfgrass on soil organic carbon and nitrogen dynamics—The CENTURY model simulation. J. Environ. Qual. 2003, 32, 1694–1700. [Google Scholar] [CrossRef]
  24. Pouyat, R.V.; Groffman, D; Yesilonis, I.D.; Hernandez, L. Soil carbon pools and fluxes in urban ecosystems. Environ. Pollut. 2002, 116, S107–S118. [Google Scholar] [CrossRef]
  25. Pouyat, R.V.; Russell-Anell, J.; Yesilonis, I.D.; Groffman, P.M. Soil Carbon in Urban Forest Ecosystem. In The Potential of U.S. Forest Soils to Sequester Carbon and Mitigate the Greenhouse Effect; Kimble, J.K., Lal, R., Birdsey, R.A., Heath, L.S., Eds.; CRC Press: Boca Raton, FL, USA, 2003. [Google Scholar]
  26. Pickett, S.T.A.; Cadenasso, M.L.; Grove, J.M.; Nikon, C.H.; Pouyat, E.V.; Zipperer, W.C.; Constanza, B. Urban ecological systems. Linking terrestrial ecological, physical, and socioeconomic components of metropolitan areas. Annu. Revi. Ecol. Syst. 2001, 32, 127–157. [Google Scholar] [CrossRef]
  27. Web Soil Survey. USDA Natural Resources Conservation Service. Available online: http://websoilsurvey.nrcs.usda.gov/ (accessed on 5 March 2011).
  28. Beers, T.W.; Dress, P.E.; Wensel, L.C. Aspect transformation in site productivity research. J. For. 1966, 64, 691–692. [Google Scholar]
  29. Maguire, R.; Heckendorn, S. Explanation of Soil Tests. Virginia Cooperative Extension Publication 452–701. Available online: http://pubs.ext.vt.edu/452/452-701/452-701.html (accessed on 13 March 2014).
  30. Davis, J.L.; Green, J.D.; Reed, A. Interdependence with the environment: Commitment, interconnectedness, and environmental behavior. J. Environ. Psychol. 2009, 29, 173–180. [Google Scholar] [CrossRef]
  31. Raciti, S.M.; Groffman, P.M.; Jenkins, J.C.; Pouyat, R.V.; Fahey, T.J.; Pickett, S.T.A.; Cadenasso, M.L. Accumulation of carbon and nitrogen in residential soils with different land use histories. Ecosystems 2011, 14, 287–297. [Google Scholar] [CrossRef]
  32. Jobaggy, E.G.; Jackson, B. The vertical distribution of soil organic carbon and its relation to climate and vegetation. Ecol. Appl. 2000, 10, 423–436. [Google Scholar] [CrossRef]
  33. Singh, M.H. Soil Organic Carbon Pools in Turfgrass Systems of Ohio. Ph.D. Thesis, The Ohio State University, Columbus, OH, USA, 2007. [Google Scholar]
  34. Gough, C.M.; Seiler, J.R. Below ground carbon dynamics in loblolly pine (Pinus taeda) immediately following diammonium phosphate fertilization. Tree Physiol. 2004, 24, 845–851. [Google Scholar] [CrossRef]
  35. Tyree, M.C.; Seiler, J.R.; Fox, T.R. The effects of fertilization on soil respiration in two-year-old Pinus taeda L. clones. For. Sci. 2008, 54, 21–30. [Google Scholar]
  36. Bowden, R.D.; Davidson, E.; Savage, K.; Arabia, C.; Steudler, P. Chronic nitrogen additions reduce total soil respiration and microbial respiration in temperate forest soils at the Harvard Forest. For. Ecol. Manag. 2004, 196, 43–56. [Google Scholar] [CrossRef]
  37. Johnson, D.; Leake, J.R.; Read, D.J. Liming and nitrogen fertilization affects phosphatase activities, microbial biomass and mycorrhizal colonization in upland grassland. Plant Soil 2005, 271, 157–164. [Google Scholar] [CrossRef]
  38. Trumbore, S.E.; Czimczik, C.I. An uncertain future for soil carbon. Science 2008, 321, 1455–1456. [Google Scholar] [CrossRef]
  39. Janzen, H.H. The soil carbon dilemma: Shall we hoard it or use it? Soil Biol. Biochem. 2006, 38, 419–424. [Google Scholar] [CrossRef]
  40. Mangiafico, S.S.; Obropta, C.C.; Rossi-Griffin, E. Demographic factors influence environmental values: A lawn-care survey of homeowners in New Jersey. J. Ext. 2012. Available online: http://www.joe.org/joe/2012february/rb6.php (accessed on 13 March 2014).
  41. Sewell, S.; McCallister, D.; Gaussoin, R.; Wortmann, C. Lawn management practices and perceptions of residents in 14 sandpit lakes of Nebraska. J. Ext. 2010. Available online: http://www.joe.org/joe/2010april/rb4.php (accessed on 13 March 2014).
  42. Hefner, S.G.; Robertson, C.; Coulter, A.; Stevens, G. Engaging citizens to urban nutrient planning of lawns within a nutrient sensitive watershed. J. Ext. 2009. Available online: http://www.joe.org/joe/2009august/iw5.php (accessedon 13 March 2014).
  43. Birdsey, R.A. Carbon Storage and Accumulation in United States Forest Ecosystems; USDA Forest Service: Washington, DC, USA, 1992. [Google Scholar]

