Understory Structure and Vascular Plant Diversity in Naturally Regenerated Deciduous Forests and Spruce Plantations on Similar Clear-Cuts: Implications for Forest Regeneration Strategy Selection

Abstract
:
1. Introduction
2. Materials and Methods
2.1. Study Area
2.2. Field Investigation and Data Collection
2.3. Statistical Analysis


3. Results
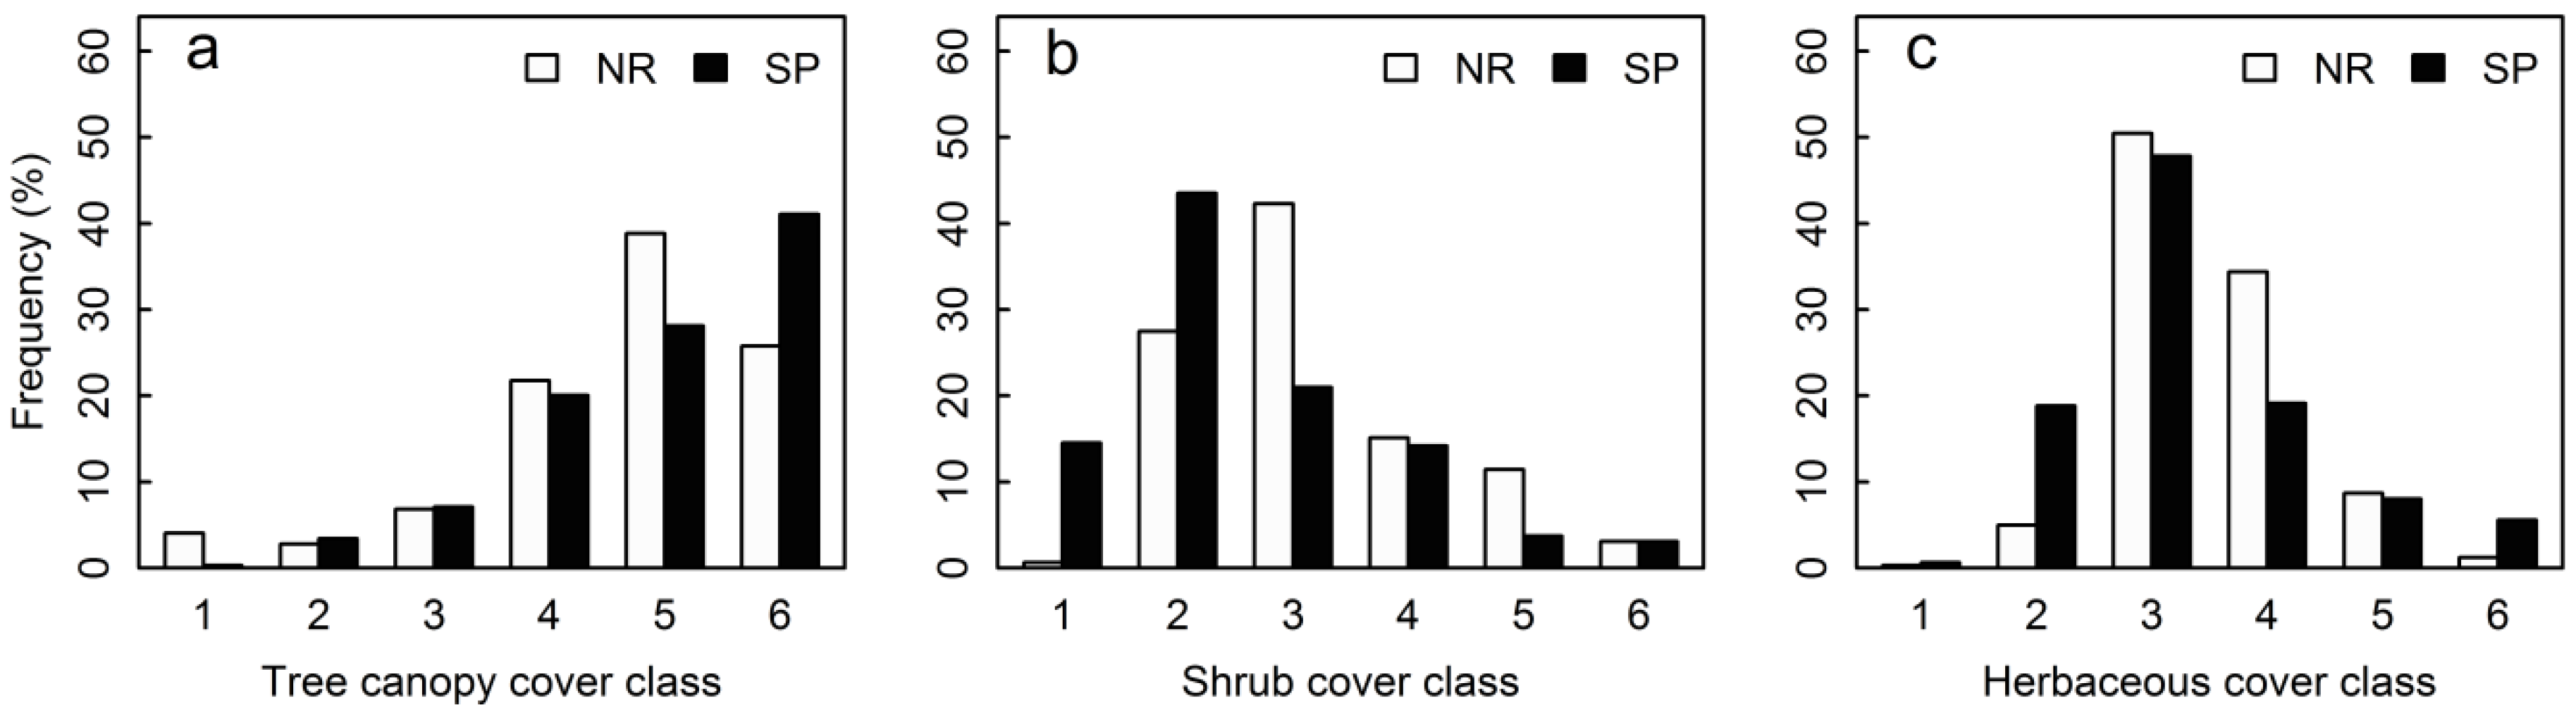
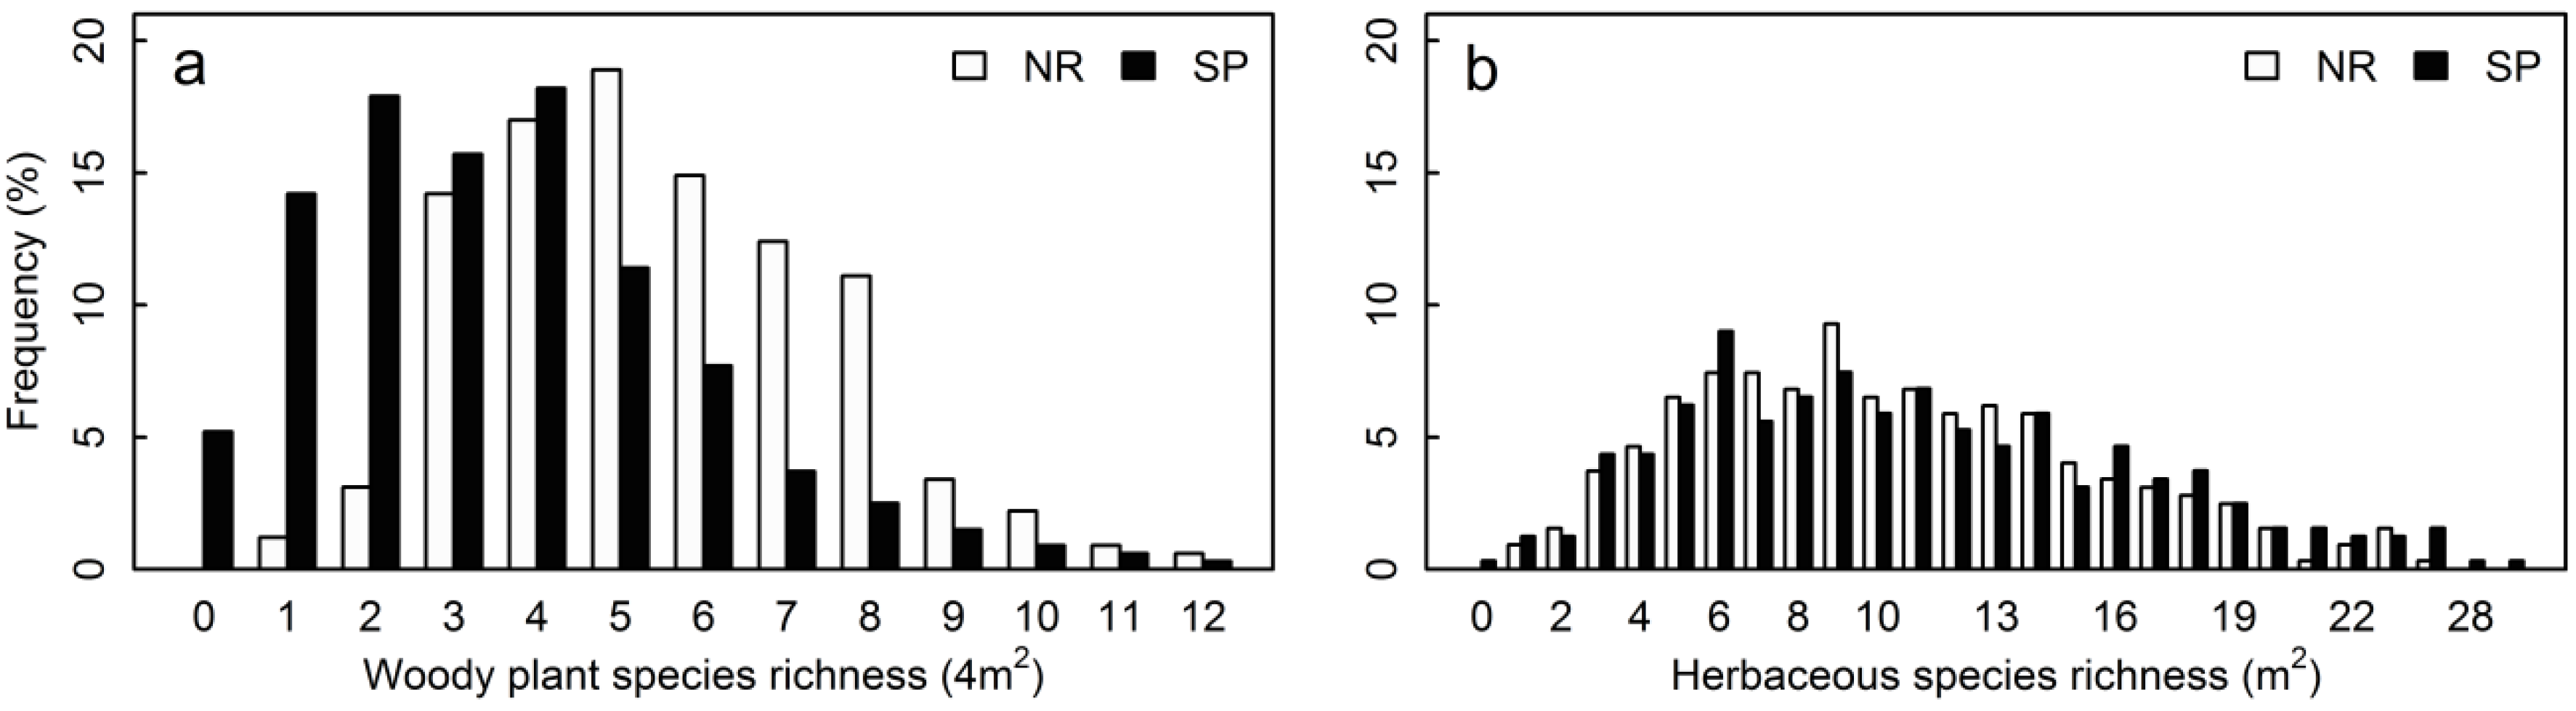
3.1. Structural Parameters

| Stands | Parameters | NR | SP | Estimate | Z | Pr (>|z|) |
|---|---|---|---|---|---|---|
| Nested 2 m × 2 m shrub quadrats | Tree canopy cover (%) | 57.42 ± 1.43 | 63.80 ± 1.41 | 0.100 | 9.91 | <0.001 |
| Shrub cover (%) * | 21.96 ± 1.27 | 14.36 ± 1.18 | −0.424 | −22.51 | <0.001 | |
| Average shrub height (cm) | 72.69 ± 2.83 | 67.47 ± 4.10 | −0.025 | −2.657 | 0.008 | |
| Shrub stem density (4 m2) | 31.51 ± 1.33 | 20.65 ± 1.53 | −0.399 | −25.33 | <0.001 | |
| Woody plant species richness (4 m2) | 5.48 ± 0.12 | 3.53 ± 0.13 | −0.440 | −11.59 | <0.001 | |
| Nested 1 m × 1 m herbaceous quadrats | Tree canopy cover (%) | 60.47 ± 1.55 | 66.38 ± 1.50 | 0.085 | 8.63 | <0.001 |
| Shrub cover (%) * | 21.80 ± 1.34 | 16.43 ± 1.39 | −0.284 | −15.677 | <0.001 | |
| Herbaceous cover (%) | 27.18 ± 1.01 | 24.42 ± 1.30 | −0.112 | −7.199 | <0.001 | |
| Average herb height (cm) | 14.81 ± 0.37 | 8.93 ± 0.27 | −0.421 | −17.61 | <0.001 | |
| Herbaceous shoot density (1 m2) | 58.98 ± 2.41 | 64.86 ± 4.00 | 0.273 | 26.05 | <0.001 | |
| Herbaceous species richness (1 m2) | 10.40 ± 0.28 | 10.88 ± 0.31 | 0.045 | 1.878 | 0.0603 |
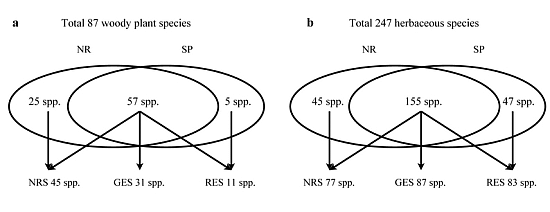
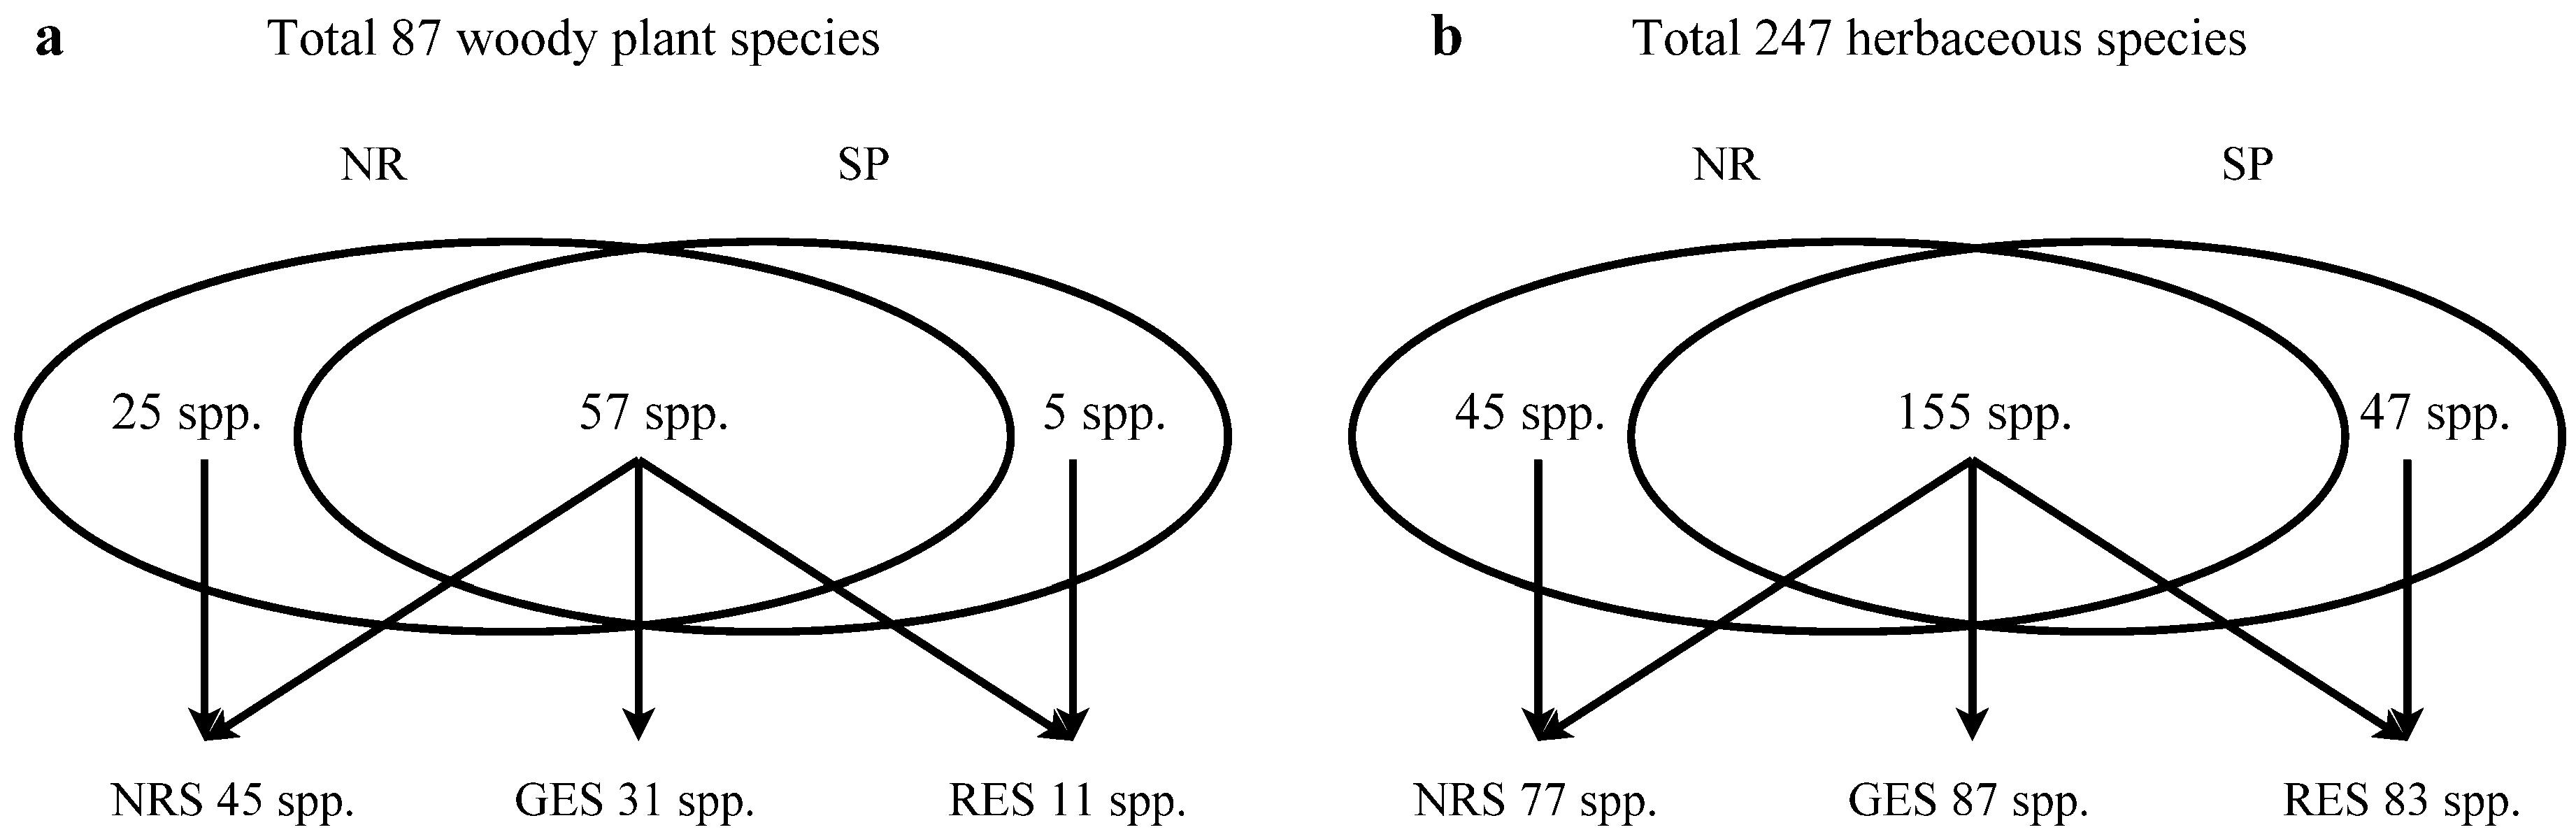
3.2. Understory Species Richness and Composition

3.3. Species Groups
| Growth-forms | Parameters | NR | SP | Estimate | Z | Pr (>|z|) |
|---|---|---|---|---|---|---|
| Tree seedlings | Presence (absence) | 260 (64) | 213 (111) | −0.886 | −4.510 | <0.001 |
| Cover (%) | 4.06 ± 0.50 | 2.63 ± 0.45 | −0.437 | −9.916 | <0.001 | |
| Average height (cm) | 70.24 ± 5.25 | 40.07 ± 4.28 | −0.529 | −47.82 | <0.001 | |
| Density (stems/4 m2) | 4.89 ± 0.35 | 2.96 ± 0.26 | −0.492 | −11.993 | <0.001 | |
| Species richness (4 m2) | 1.65 ± 0.07 | 1.03 ± 0.06 | −0.474 | −6.790 | <0.001 | |
| Total species richness | 28 | 21 | ||||
| Shrubs | Presence (absence) | 323 (1) | 292 (32) | −3.795 | −3.510 | <0.001 |
| Cover (%) | 11.72 ± 0.78 | 8.70 ± 0.94 | −0.288 | −11.553 | <0.001 | |
| Average height (cm) | 65.52 ± 2.88 | 59.76 ± 4.23 | −0.049 | −4.869 | <0.001 | |
| Density (stems/4 m2) | 26.69 ± 1.33 | 17.80 ± 1.51 | −0.380 | −22.25 | <0.001 | |
| Species richness (4 m2) | 3.81 ± 0.10 | 2.76 ± 0.11 | −0.323 | −7.341 | <0.001 | |
| Total species richness | 54 | 41 | ||||
| Ferns | Presence (absence) | 287 (37) | 184 (140) | −3.845 | −9.159 | <0.001 |
| Cover (%) | 8.88 ± 0.57 | 5.06 ± 0.49 | −0.546 | −17.589 | <0.001 | |
| Average height (cm) | 14.95 ± 0.65 | 6.45 ± 0.49 | −0.762 | −28.787 | <0.001 | |
| Density (shoots/m2) | 13.27 ± 0.71 | 7.48 ± 0.61 | −0.495 | −19.218 | <0.001 | |
| Species richness (1 m2) | 1.68 ± 0.06 | 0.93 ± 0.05 | −0.579 | −8.070 | <0.001 | |
| Total species richness | 22 | 12 | ||||
| Forbs | Presence (absence) | 323 (1) | 321 (3) | −0.006 | −0.004 | 0.997 |
| Cover (%) | 17.54 ± 0.83 | 18.23 ± 1.23 | 0.042 | 2.236 | 0.0254 | |
| Average height (cm) | 13.18 ± 0.37 | 8.31 ± 0.28 | −0.370 | −14.81 | <0.001 | |
| Density (shoots/m2) | 40.90 ± 1.84 | 52.86 ± 3.76 | 0.456 | 37.20 | <0.001 | |
| Species richness (1 m2) | 7.85 ± 0.23 | 8.95 ± 0.28 | 0.140 | 5.153 | <0.001 | |
| Total species richness | 159 | 167 | ||||
| Graminoids | Presence (absence) | 176 (148) | 175 (149) | 0.005 | 0.032 | 0.975 |
| Cover (%) | 1.70 ± 0.23 | 1.24 ± 0.17 | −0.314 | −4.772 | <0.001 | |
| Average height (cm) | 10.63 ± 0.77 | 7.46 ± 0.51 | −0.296 | −11.018 | <0.001 | |
| Density (shoots/m2) | 4.81 ± 0.47 | 4.51 ± 0.38 | 0.058 | 1.537 | 0.124 | |
| Species richness (1 m2) | 0.88 ± 0.06 | 0.95 ± 0.06 | 0.085 | 1.030 | 0.303 | |
| Total species richness | 20 | 23 |
3.4. Relationships of the Tree Canopy Cover with the Structure and Species Richness of Understory Shrubs
3.5. Relationships of the Tree Canopy Cover and Understory Shrubs with the Structures and Species Richness of Understory Herbs
| Dependent Variables | NR | SP | ||||
|---|---|---|---|---|---|---|
| Estimate | Z | Pr (>|z|) | Estimate | Z | Pr (>|z|) | |
| Total shrub layer cover (%) | −0.013 | −6.084 | <0.001 | −0.022 | −7.086 | <0.001 |
| Total shrub layer height (cm) | −0.002 | −1.226 | 0.22 | −0.013 | −4.618 | <0.001 |
| Total shrub density (stems/4 m2) | −0.002 | −1.415 | 0.157 | −0.008 | −3.488 | <0.001 |
| Woody plant species richness (4 m2) | −0.001 | −1.001 | 0.315 | −0.000 | −0.225 | 0.822 |
| Tree seedling cover (%) | −0.009 | −2.136 | 0.033 | −0.025 | −3.515 | <0.001 |
| Tree seedling average height (cm) | −0.008 | −1.575 | 0.115 | −0.017 | −2.257 | 0.024 |
| Tree seedling species richness (4 m2) | −0.001 | −0.772 | 0.440 | −0.001 | −0.344 | 0.730 |
| Shrub cover (%) | −0.004 | −1.614 | 0.107 | −0.018 | −5.584 | <0.001 |
| Shrub average height (cm) | −0.003 | −1.594 | 0.111 | −0.012 | −3.228 | 0.001 |
| Shrub density (stems/4 m2) | −0.003 | −1.748 | 0.08 | −0.007 | −2.644 | 0.008 |
| Shrub species richness (4 m2) | −0.001 | −0.628 | 0.530 | −0.002 | −1.048 | 0.294 |
| Dependent Variable | Explanations Variable | NR | SP | ||||
|---|---|---|---|---|---|---|---|
| Estimate | Z | Pr (>|z|) | Estimate | Z | Pr (>|z|) | ||
| Herbaceous cover | Tree canopy cover | −0.002 | −0.747 | 0.455 | −0.014 | −7.203 | <0.001 |
| Herbaceous cover | Shrub cover | −0.001 | −0.308 | 0.758 | −0.011 | −3.819 | <0.001 |
| Herbaceous average height | Tree canopy cover | −0.000 | −0.177 | 0.86 | −0.003 | −2.436 | 0.015 |
| Herbaceous average height | Shrub cover | −0.002 | −1.309 | 0.299 | −0.001 | −0.749 | 0.454 |
| Herbaceous shoot density | Tree canopy cover | −0.001 | −0.747 | 0.455 | −0.014 | −6.746 | <0.001 |
| Herbaceous shoot density | Shrub cover | −0.002 | −0.801 | 0.423 | −0.011 | −3.678 | <0.001 |
| Herbaceous species richness | Tree canopy cover | −0.001 | −0.873 | 0.383 | −0.004 | −3.744 | <0.001 |
| Herbaceous species richness | Shrub cover | −0.002 | −1.912 | 0.056 | −0.001 | −0.890 | 0.374 |
| Fern shoot density | Tree canopy cover | 0.002 | 0.679 | 0.497 | −0.014 | −6.746 | <0.001 |
| Fern shoot density | Shrub cover | 0.001 | 0.131 | 0.896 | −0.011 | −3.678 | <0.001 |
| Forbs cover | Tree canopy cover | −0.003 | −0.832 | 0.405 | −0.013 | −5.753 | <0.001 |
| Forbs cover | Shrub cover | −0.003 | −0.603 | 0.546 | −0.010 | −2.955 | 0.003 |
| Forbs average height | Tree canopy cover | 0.001 | 0.440 | 0.66 | −0.003 | −2.276 | 0.023 |
| Forbs average height | Shrub cover | −0.001 | −0.461 | 0.645 | −0.000 | −0.121 | 0.904 |
| Forbs shoot density | Tree canopy cover | −0.002 | −0.980 | 0.327 | −0.015 | −6.546 | <0.001 |
| Forbs shoot density | Shrub cover | −0.002 | −0.601 | 0.548 | −0.012 | −3.933 | <0.001 |
| Forbs species richness | Tree canopy cover | −0.001 | −0.795 | 0.427 | −0.003 | −3.551 | <0.001 |
| Forbs species richness | Shrub cover | −0.001 | −0.729 | 0.466 | −0.003 | −1.725 | 0.085 |
| Graminoids cover | Tree canopy cover | −0.007 | −1.077 | 0.282 | −0.0108 | −2.728 | 0.006 |
| Graminoids cover | Shrub cover | −0.022 | −2.111 | 0.035 | −0.024 | −3.494 | <0.001 |
| Gramindoids average height | Tree canopy cover | −0.001 | −0.090 | 0.928 | −0.006 | −2.334 | 0.020 |
| Gramindoids average height | Shrub cover | −0.016 | −1.339 | 0.181 | −0.008 | −1.724 | 0.085 |
| Gramindois shoot density | Tree canopy cover | −0.001 | −0.151 | 0.880 | −0.014 | −3.551 | <0.001 |
| Graminoids shoot density | Shrub cover | −0.013 | −1.566 | 0.117 | −0.021 | −3.316 | 0.001 |
| Graminoids species richness | Tree canopy cover | −0.003 | −0.888 | 0.375 | −0.006 | −2.334 | 0.020 |
| Graminoids species richness | Shrub cover | −0.009 | −1.729 | 0.084 | −0.008 | −1.724 | 0.085 |
4. Discussion
4.1. Understory Vascular Plant Species Diversity
4.2. Structure of Tree Canopy Cover and Understory Vegetation, and Their Correlations
5. Conclusions and Implications
Acknowledgments
Author Contributions
Conflicts of Interest
References
- Halpern, C.B.; Spies, T.A. Plant species diversity in natural and managed forests of the Pacific Northwest. Ecol. Appl. 1995, 5, 913–934. [Google Scholar] [CrossRef]
- Thomas, S.C.; Halpern, C.B.; Falk, D.A.; Liguori, D.A.; Austin, K.A. Plant diversity in managed forests: Understory responses to thinning and fertilization. Ecol. Appl. 1999, 9, 864–879. [Google Scholar] [CrossRef]
- Felton, A.; Knight, E.; Wood, J.; Zammit, C.; Lindenmayer, D. A meta-analysis of fauna and flora species richness and abundance in plantations and pasture lands. Biol. Conserv. 2010, 143, 545–554. [Google Scholar] [CrossRef]
- Hart, S.A.; Chen, H.Y.H. Understory vegetation dynamics of North American boreal forests. Crit. Rev. Plant Sci. 2006, 25, 381–397. [Google Scholar] [CrossRef]
- Chavez, V.; Macdonald, S.E. Partitioning vascular understory diversity in mixedwood boreal forests: The importance of mixed canopies for diversity conservation. For. Ecol. Manag. 2012, 271, 19–26. [Google Scholar] [CrossRef]
- Nilsson, M.C.; Wardle, D.A. Understory vegetation as a forest ecosystem driver: Evidence from the northern Swedish boreal forest. Front. Ecol. Environ. 2005, 3, 421–428. [Google Scholar] [CrossRef]
- O’Brien, M.J.; O’Hara, K.L.; Erbilgin, N.; Wood, D.L. Overstory and shrub effects on natural regeneration processes in native Pinus radiata stands. For. Ecol. Manag. 2007, 240, 178–185. [Google Scholar] [CrossRef]
- Parker, W.C.; Pitt, D.G.; Morneault, A.E. Influence of woody and herbaceous competition on microclimate and growth of eastern white pine (Pinus strobus L.) seedlings planted in a central Ontario clearcut. For. Ecol. Manag. 2009, 258, 2013–2025. [Google Scholar] [CrossRef]
- Schmiedinger, A.; Kreyling, J.; Steinbauer, M.J.; Macdonald, S.E.; Jentsch, A.; Beierkuhnlein, C. A continental comparison indicates long-term effects of forest management on understory diversity in coniferous forests. Can. J. For. Res. 2012, 42, 1239–1252. [Google Scholar] [CrossRef]
- Barbier, S.; Gosselin, F.; Balandier, P. Influence of tree species on understory vegetation diversity and mechanisms involved—A critical review for temperate and boreal forests. For. Ecol. Manag. 2008, 254, 1–15. [Google Scholar] [CrossRef]
- Brockerhoff, E.; Jactel, H.; Parrotta, J.; Quine, C.; Sayer, J. Plantation forests and biodiversity: Oxymoron or opportunity? Biodivers. Conserv. 2008, 17, 925–951. [Google Scholar] [CrossRef]
- Bremer, L.; Farley, K. Does plantation forestry restore biodiversity or create green deserts? A synthesis of the effects of land-use transitions on plant species richness. Biodiver. Conserv. 2010, 19, 3893–3915. [Google Scholar] [CrossRef]
- Liu, Q. Ecological Research on Subalpine Coniferous Forests in China; Sichuan University Press: Chengdu, China, 2002; pp. 1–132. [Google Scholar]
- Europe, F. UNECE and FAO (2011) State of Europe’s forests 2011. In Status and Trends in Sustainable Forest Management in Europe; Food and Agriculture Organization of the United Nations: Rome, Italy, 2011. [Google Scholar]
- Levine, J.M. Species diversity and biological invasions: Relating local process to community pattern. Science 2000, 288, 852–854. [Google Scholar] [CrossRef]
- Aubin, I.; Messier, C.; Bouchard, A. Can plantations develop understory biological and physical attributes of naturally regenerated forests? Biol. Conserv. 2008, 141, 2461–2476. [Google Scholar] [CrossRef] [Green Version]
- Ramovs, B.V.; Roberts, M.R. Response of plant functional groups within plantations and naturally regenerated forests in southern New Brunswick, Canada. Can. J. For. Res. 2005, 35, 1261–1276. [Google Scholar] [CrossRef]
- Humphrey, J.W.; Davey, S.; Peace, A.J.; Ferris, R.; Harding, K. Lichens and bryophyte communities of planted and semi-natural forests in Britain: The influence of site type, stand structure and deadwood. Biol. Conserv. 2002, 107, 165–180. [Google Scholar] [CrossRef]
- Armstrong, A.; Van Hensbergen, H. Impacts of afforestation with pines on assemblages of native biota in South Africa. South Afr. For. J. 1996, 175, 35–42. [Google Scholar]
- Barlow, J.; Gardner, T.A.; Araujo, I.S.; Avila-Pires, T.C.; Bonaldo, A.B.; Costa, J.E.; Esposito, M.C.; Ferreira, L.V.; Hawes, J.; Hernandez, M.M.; et al. Quantifying the biodiversity value of tropical primary, secondary, and plantation forests. Proc. Natl. Acad. Sci. USA 2007, 104, 18555–18560. [Google Scholar] [CrossRef]
- Matthews, S.; O’Connor, R.; Plantinga, A.J. Quantifying the impacts on biodiversity of policies for carbon sequestration in forests. Ecol. Econ. 2002, 40, 71–87. [Google Scholar] [CrossRef]
- Nagaike, T.; Hayashi, A.; Kubo, M.; Abe, M.; Arai, N. Plant species diversity in a managed forest landscape composed of Larix kaempferi plantations and abandoned coppice forests in central Japan. For. Sci. 2006, 52, 324–332. [Google Scholar]
- Wang, H.F.; Lencinas, M.V.; Friedman, C.R.; Wang, X.K.; Qiu, J.X. Understory plant diversity assessment of Eucalyptus plantations over three vegetation types in Yunnan, China. New For. 2011, 42, 101–116. [Google Scholar] [CrossRef]
- Bao, W.K.; Zhang, Y.L.; Wang, Q.; Bai, W.Q.; Zheng, D. Plant composition and biodiversity along an age sequence of artificial forest restoration on subalpine cutovers in the eastern Tibetan Plateau. Acta Phtoecol. Sinca 2002, 26, 330–338. [Google Scholar]
- Strong, W.L. Tree canopy effects on understory species abundance in high-latitude Populus tremuloides stands, Yukon, Canada. Community Ecol. 2011, 12, 89–98. [Google Scholar] [CrossRef]
- Hurst, J.; Allen, R. A Permanent Plot Method for Monitoring Indigenous Forests-Expanded Manual, version 4; Landcare Res. Contract rep. LC0708/028; Manaaki Whennua—Landcare Research: Christchurch, New Zealand, 2007. [Google Scholar]
- Kohl, M.; Scott, C.T. Analysis of cluster sampling in extensive forests surveys. Allg. Forst Jagdztg. 1994, 165, 101–106. [Google Scholar]
- Zuur, A.F.; Ieno, E.N.; Smith, G.M. Analysing Ecological Data; Springer: New York, USA, 2007. [Google Scholar]
- Otto, R.; Garcia-del-Rey, E.; Mendez, J.; Maria Fernandez-Palacios, J. Effects of thinning on seed rain, regeneration and understory vegetation in a Pinus canariensis plantation (Tenerife, Canary Islands). For. Ecol. Manag. 2012, 280, 71–81. [Google Scholar] [CrossRef]
- Bolker, B.M.; Brooks, M.E.; Clark, C.J.; Geange, S.W.; Poulsen, J.R.; Stevens, M.H.H.; White, J.-S.S. Generalized linear mixed models: A practical guide for ecology and evolution. Trends Ecol. Evol. 2009, 24, 127–135. [Google Scholar] [CrossRef]
- Abrahamson, I.L.; Nelson, C.R.; Affleck, D.L.R. Assessing the performance of sampling designs for measuring the abundance of understory plants. Ecol. Appl. 2011, 21, 452–464. [Google Scholar] [CrossRef]
- Yang, Y.B. Alpine Forest Fegeneration Management Handbook; Sichuan Publishing House of Science and Technology: Chengdu, China, 1985. [Google Scholar]
- Shi, L.X.; Wang, J.X.; Su, Y.M.; Hou, G.W. Early succession of vegetation on the clear-cuts in Miyaluo forest district in Western Sichuan. Acta Phytoecol. Gebotanica Sin. 1988, 12, 306–313. [Google Scholar]
- Flora Popularis Republicae Sinicae; Flora of China Editorial Committee (Ed.) Science Press: Beijing, China; Volume 1–82, pp. 1959–2004.
- Bates, D. lme4: An R Package for Fitting and Analyzing Linear, Nonlinear and Generalized Linear Mixed Models. Available online: http://lme4.r-forge.r-project.org (accessed on 26 September 2007).
- Sarkar, D. Lattice: Multivariate Data Visualization with R. Springer: New York. Available online: http://lmdvr.r-forge.r-project.org (accessed on 22 November 2008).
- Bates, D.; Maechler, M. Matrix: Sparse and Dense Matrix Classes and Methods. Available online: http://CRAN.R-project.org/package=Matrix (accessed on 26 March 2013).
- Burton, J.I.; Zenner, E.K.; Frelich, L.E.; Cornett, M.W. Patterns of plant community structure within and among primary and second-growth northern hardwood forest stands. For. Ecol. Manag. 2009, 258, 2556–2568. [Google Scholar] [CrossRef]
- Bao, W.K.; Lei, B.; Pang, X.Y.; Yan, X.L.; Jia, Y. Species composition and synusia structure of ground bryophyte communities under different aged spruce plantations and primary forest in the upper reaches of the Dadu River, Sichuan. Biodivers. Sci. 2009, 17, 201–209. [Google Scholar]
- Decocq, G.; Aubert, M.; Dupont, F.; Alard, D.; Saguez, R.; Wattez-Franger, A.; De Foucault, B.; Delelis-Dusollier, A.; Bardat, J. Plant diversity in a managed temperate deciduous forest: Understorey response to two silvicultural systems. J. Appl. Ecol. 2004, 41, 1065–1079. [Google Scholar] [CrossRef]
- Yan, X.L.; Bao, W.K. Bryophyte species composition and community development during early natural recovery progress on cutovers. Biodivers. Sci. 2008, 16, 110–117. [Google Scholar]
Appendix
| Forest Type | NR (n = 12) | SP (n = 12) | p-value |
|---|---|---|---|
| Altitude (m) | 3094 ± 73 | 3219 ± 64 | p = 0.073 |
| Aspect class | 3.1 ± 0.81 | 4.0 ± 0.7 | p = 0.347 |
| Slope inclination (°) | 39.3 ± 1.5 | 30.6 ± 1.0 | p = 0.419 |
| Time since clear-cutting | 31.9 ± 2.9 | 32.4 ± 2.6 | p = 0.438 |
| Species Name | Frequency | Estimate | Z | Pr (>|z|) | FTD | Growth Form | |
|---|---|---|---|---|---|---|---|
| NR | SP | ||||||
| Present only in Naturally Regenerated Forests | |||||||
| Berberis polyantha Hemsl. | 8 | 0 | - | - | - | NRS | S |
| Caragana boisi Lam. | 2 | 0 | - | - | - | NRS | S |
| Caragana tangutica Maxim.ex Kom. | 16 | 0 | - | - | - | NRS | S |
| Euonymus sanguineus Loes. | 5 | 0 | - | - | - | NRS | S |
| Helwingia sp. | 1 | 0 | - | - | - | NRS | S |
| Hydrangea bretschneideri Dipp. | 2 | 0 | - | - | - | NRS | T |
| Isodon dawoensis Hand.-Mazz. | 4 | 0 | - | - | - | NRS | S |
| Litsea chunii W.C. Cheng | 4 | 0 | - | - | - | NRS | T |
| Lonicera rupicola J.D. Hook. & Thomson | 1 | 0 | - | - | - | NRS | S |
| Maddenia hypoxantha Koehne | 10 | 0 | - | - | - | NRS | T |
| Malus hupehensis (Pamp.) Rehd. | 7 | 0 | - | - | - | NRS | T |
| Picea likiangensis var. rubescens Rehd. & E.H.Wilson | 11 | 0 | - | - | - | NRS | T |
| Pinus densata Masters | 16 | 0 | - | - | - | NRS | T |
| Populus adenopoda Maxim. | 3 | 0 | - | - | - | NRS | T |
| Rhododendron sp. | 3 | 0 | - | - | - | NRS | S |
| Rubus parvifolius L. | 13 | 0 | - | - | - | NRS | S |
| Salix luctuosa H. Léveillé | 19 | 0 | - | - | - | NRS | S |
| Salix paraplesia C.K. Schneider | 3 | 0 | - | - | - | NRS | S |
| Schisandra sphenanthera Rehd.& E.H. Wilson | 5 | 0 | - | - | - | NRS | S |
| Sorbaria arborea C.K. Schneider | 1 | 0 | - | - | - | NRS | S |
| Spiraea japonica L. | 4 | 0 | - | - | - | NRS | S |
| Spiraea schneideriana Rehd. | 13 | 0 | - | - | - | NRS | S |
| Stachyurus chinensis Franchet | 1 | 0 | - | - | - | NRS | S |
| Tilia chinensis Maxim. | 5 | 0 | - | - | - | NRS | T |
| Tsuga chinensis (Franchet) E. Pritzel | 10 | 0 | - | - | - | NRS | T |
| Present only in reforested spruce plantations | |||||||
| Cotinus coggygria Scopoli | 0 | 1 | - | - | - | RES | S |
| Lonicera ferdinandii Franchet | 0 | 2 | - | - | - | RES | S |
| Picea asperata Masters | 0 | 18 | - | - | - | RES | T |
| Cotoneaster silvestrii Pamp. | 0 | 20 | - | - | - | RES | S |
| Sorbus setschwanensis (C.K. Schneid.) Koehne | 0 | 20 | - | - | - | RES | T |
| Ubiquitous | |||||||
| Abies fabri (Masters) Craib | 5 | 1 | −1.8 | −1.498 | 0.134 | GES | T |
| Abies fargesii var.faxoniana (Rehd. & E.H. Wilson) Tang S. Liu | 8 | 4 | −0.728 | −1.052 | 0.293 | GES | T |
| Abies sp. | 42 | 34 | −0.263 | −1.028 | 0.304 | GES | T |
| Acer davidii subsp. grosseri (Pax) P.C. de Jong | 3 | 1 | −1.196 | −0.985 | 0.325 | GES | T |
| Actinidia leptophylla C.Y. Wu | 64 | 60 | −0.091 | −0.434 | 0.664 | GES | S |
| Berberis aggregate C.K. Schneider | 26 | 27 | 0.042 | 0.142 | 0.887 | GES | S |
| Berberis dasystachya Maxim. | 2 | 2 | −0.002 | -0.001 | 0.999 | GES | S |
| Betula albo-sinensis Burk. | 48 | 43 | −0.138 | −0.596 | 0.551 | GES | T |
| Cerasus trichostoma (Koehne) T.T. Yu & C.L. Li | 46 | 39 | −0.211 | −0.874 | 0.382 | GES | T |
| Cotoneaster adpressus Bois | 3 | 2 | −0.463 | −0.409 | 0.682 | GES | S |
| Cotoneaster ambiguous Rehd. & E.H. Wilson | 4 | 2 | −0.706 | −0.749 | 0.454 | GES | S |
| Cotoneaster apiculatus Rehd. & E.H. Wilson | 2 | 1 | −0.745 | −0.577 | 0.564 | GES | S |
| Daphne tangutica Maxim. | 11 | 9 | −0.223 | −0.459 | 0.646 | GES | S |
| Detuzia sp. | 3 | 4 | 0.304 | 0.352 | 0.725 | GES | S |
| Hippophae rhamnoides L. | 5 | 1 | −1.772 | −1.422 | 0.155 | GES | S |
| Lonicera hispida Pallas ex Schultes | 6 | 1 | −1.819 | −1.463 | 0.144 | GES | S |
| Lonicera tangutica Maxim. | 42 | 58 | 0.396 | 1.764 | 0.078 | GES | S |
| Lonicera trichosantha Bureau & Franchet | 12 | 12 | −0.000 | -0.001 | 0.999 | GES | S |
| Lonicera webbiana Wallich ex Candolle | 7 | 10 | 0.380 | 0.718 | 0.473 | GES | S |
| Ribes maximowiczianum Komarov | 18 | 20 | 0.131 | 0.361 | 0.718 | GES | S |
| Rosa graciliflora Rehd. & E.H. Wilson | 32 | 43 | 0.355 | 1.385 | 0.166 | GES | S |
| Rosa omeiensis Rolfe | 32 | 30 | −0.088 | −0.316 | 0.752 | GES | S |
| Rubus pileatus Focke | 2 | 1 | −0.699 | −0.570 | 0.569 | GES | S |
| Rubus xanthocarpus Bureau & Franche | 11 | 5 | −1.09 | −1.699 | 0.089 | GES | S |
| Salix rehderiana C.K. Schneider | 4 | 6 | 0.422 | 0.569 | 0.569 | GES | T |
| Salix wallichiana Andersson | 8 | 8 | −0.002 | −0.003 | 0.997 | GES | T |
| Sibiraea angustata (Rehder) Hand.-Mazz. | 4 | 6 | 0.456 | 0.662 | 0.508 | GES | S |
| Sorbus hupehensis C.K. Schneider | 2 | 7 | 1.412 | 1.649 | 0.099 | GES | T |
| Spiraea cantoniensis Loureiro | 12 | 11 | −0.099 | −0.215 | 0.83 | GES | S |
| Spiraea myrtilloides Rehder | 7 | 13 | 0.702 | 1.228 | 0.219 | GES | S |
| Viburnum sp. | 9 | 17 | 0.739 | 1.635 | 0.102 | GES | S |
| More frequent in naturally regenerated forest stands relative to reforested spruce plantations | |||||||
| Acer maximowiczii Pax | 61 | 10 | −2.487 | −6.308 | <0.001 | NRS | T |
| Acer pictum subsp. mono (Maxim.) H. Ohashi | 25 | 5 | −1.946 | −3.610 | <0.001 | NRS | T |
| Arundinaria faberi Rendle | 131 | 80 | −1.427 | −5.822 | <0.001 | NRS | S |
| Berchemia floribunda (Wallich) Brongniart | 12 | 2 | −1.902 | −2.232 | 0.026 | NRS | S |
| Betula platyphylla Sukaczev | 12 | 3 | −1.487 | −2.151 | 0.032 | NRS | T |
| Cornus hemsleyi C.K. Schneider & Wangerin | 63 | 6 | −3.615 | −6.552 | <0.001 | NRS | T |
| Cotoneaster acuminatus Lindley | 44 | 1 | −4.22 | −3.962 | <0.001 | NRS | S |
| Cotoneaster glabratus Rehd. & E.H. Wilson | 13 | 1 | −3.045 | −2.631 | 0.009 | NRS | S |
| Eleutherococcus giraldii (Harms) Nakai | 81 | 38 | −1.173 | −4.874 | <0.001 | NRS | S |
| Euonymus porphyreus Loes. | 60 | 41 | −0.517 | −2.210 | 0.027 | NRS | S |
| Euonymus sp. | 125 | 100 | −0.427 | −2.342 | 0.019 | NRS | S |
| Hydrangea xanthoneura Diels | 19 | 3 | −2.052 | −3,040 | 0.002 | NRS | T |
| Malus kansuensis (Batalin) C.K. Schneider | 10 | 1 | −2.430 | −2.017 | 0.044 | NRS | T |
| Padus obtusata (Koehne) T.T. Yu & T.C. Ku | 14 | 2 | −2.060 | −2.504 | 0.012 | NRS | T |
| Ribes glaciale Wallich | 17 | 4 | −1.581 | −2.618 | 0.009 | NRS | S |
| Ribes tenue Janczewski | 30 | 8 | −1.489 | −3.528 | <0.001 | NRS | S |
| Rubus pungens Cambessèdes | 126 | 68 | −1.020 | −5.385 | <0.001 | NRS | S |
| Smilax menispermoidea A. de Candolle | 66 | 24 | −1.356 | −4.989 | <0.001 | NRS | S |
| Smilax stans Maxim. | 91 | 63 | −0.563 | −2.820 | 0.005 | NRS | S |
| Sorbus rehderiana Koehne | 76 | 53 | −0.523 | −2.445 | 0.0145 | NRS | T |
| More frequent in reforested spruce plantation stands relative to naturally regenerated forests | |||||||
| Cotoneaster acutifolius Turczaninow | 5 | 43 | 2.639 | 4.980 | <0.001 | RES | S |
| Philadelphus purpurascens (Koehne) Rehder | 1 | 11 | 2.562 | 2.266 | 0.024 | RES | S |
| Picea sp. | 10 | 42 | 1.661 | 4.391 | <0.001 | RES | T |
| Quercus aquifolioides Rehd. & E.H. Wilson | 8 | 27 | 1.660 | 3.532 | <0.001 | RES | T |
| Ribes himalense Royle ex Decaisne | 11 | 27 | 1.155 | 2.858 | 0.004 | RES | S |
| Rubus phoenicolasius Maxim. | 1 | 14 | 3.200 | 2.790 | 0.005 | RES | S |
| Species Name | Frequency | Estimate | Z | Pr (>|z|) | FTD | Growth Form | |||||||||||||||
|---|---|---|---|---|---|---|---|---|---|---|---|---|---|---|---|---|---|---|---|---|---|
| NR | SP | ||||||||||||||||||||
| Present only in naturally regenerated forests | |||||||||||||||||||||
| Aceratorchis tschiliensis Schltr. | 1 | 0 | - | - | - | NRS | FB | ||||||||||||||
| Aconitum brunneum Hand.-Mazz. | 1 | 0 | - | - | - | NRS | FB | ||||||||||||||
| Adenophora stricta subsp. aurita (Franchet) D.Y. Hong & S. Ge | 6 | 0 | - | - | - | NRS | FB | ||||||||||||||
| Adiantum flabellulatum L. | 1 | 0 | - | - | - | NRS | FN | ||||||||||||||
| Ajuga sp. | 1 | 0 | - | - | - | NRS | FB | ||||||||||||||
| Artemisia princeps Pamp. | 12 | 0 | - | - | - | NRS | FB | ||||||||||||||
| Athyrium dentigerum (Wallich ex C.B. Clarke) Mehra & Bir | 1 | 0 | - | - | - | NRS | FN | ||||||||||||||
| Carex chinensis Retzius | 6 | 0 | - | - | - | NRS | GM | ||||||||||||||
| Chamaesium paradoxum H. Wolff | 12 | 0 | - | - | - | NRS | FB | ||||||||||||||
| Clinopodium polycephalum (Vaniot) C.Y. Wu & Hsuan ex P.S. Hsu | 1 | 0 | - | - | - | NRS | FB | ||||||||||||||
| Clintonia udensis Trautvetter & C.A. Meyer | 9 | 0 | - | - | - | NRS | FB | ||||||||||||||
| Corydalis impatiens (Pallas) Fischer | 7 | 0 | - | - | - | NRS | FB | ||||||||||||||
| Corydalis sp. | 2 | 0 | - | - | - | NRS | FB | ||||||||||||||
| Cyrtomium sp. | 2 | 0 | - | - | - | NRS | FN | ||||||||||||||
| Cystopteris montana (Lamarck) Bernhardi ex Desvaux | 8 | 0 | - | - | - | NRS | FN | ||||||||||||||
| Delphinium tongolense Franchet, | 1 | 0 | - | - | - | NRS | FB | ||||||||||||||
| Elymus tangutorum (Nevski) Hand.-Mazz. | 2 | 0 | - | - | - | NRS | GM | ||||||||||||||
| Equisetum arvense L. | 1 | 0 | - | - | - | NRS | FN | ||||||||||||||
| Foeniculum vulgare (L.) Miller | 2 | 0 | - | - | - | NRS | FB | ||||||||||||||
| Goodyera yunnanensis Schlechte | 1 | 0 | - | - | - | GES | FB | ||||||||||||||
| Isodon flabelliformis (C.Y. Wu) H. Hara | 4 | 0 | - | - | - | NRS | FB | ||||||||||||||
| Kingdonia uniflora I.B. Balfour & W.W. Smith | 2 | 0 | - | - | - | NRS | FB | ||||||||||||||
| Lepisorus contortus (Christ) Ching | 1 | 0 | - | - | - | NRS | FN | ||||||||||||||
| Lepisorus pseudonudus Ching | 1 | 0 | - | - | - | NRS | FN | ||||||||||||||
| Lilium nepalense D. Don | 14 | 0 | - | - | - | NRS | FB | ||||||||||||||
| Listera puberula var. maculate (T. Tang et F.T. Wang) S.C. Chen et Y.B. Luo | 1 | 0 | - | - | - | NRS | FB | ||||||||||||||
| Lunathyrium sp. | 3 | 0 | - | - | - | NRS | FN | ||||||||||||||
| Morina nepalensis var.alba (Hand.-Mazz.) Y.C. Tang | 1 | 0 | - | - | - | NRS | FB | ||||||||||||||
| Ophiopogon intermedius D. Don | 9 | 0 | - | - | - | NRS | FB | ||||||||||||||
| Osmorhiza aristata (Thunberg) Rydberg | 3 | 0 | - | - | - | NRS | FB | ||||||||||||||
| Panax pseudo-ginseng Wall. | 1 | 0 | - | - | - | NRS | FB | ||||||||||||||
| Paris polyphylla Smith | 5 | 0 | - | - | - | NRS | FB | ||||||||||||||
| Phymatopteris shensiensis (Christ) Pic. | 3 | 0 | - | - | - | NRS | FN | ||||||||||||||
| Platanthera chlorantha (Custer) Reichenbach | 1 | 0 | - | - | - | NRS | FB | ||||||||||||||
| Polemonium coeruleum L. | 1 | 0 | - | - | - | NRS | FB | ||||||||||||||
| Polystichum herbaceum Ching & Z.Y. Liu | 1 | 0 | - | - | - | NRS | FN | ||||||||||||||
| Primula fasciculate I.B. Balfour & Kingdon-Ward | 4 | 0 | - | - | - | NRS | FB | ||||||||||||||
| Pteris sp. | 3 | 0 | - | - | - | NRS | FN | ||||||||||||||
| Rodgersia podophylla A. Gray | 40 | 0 | - | - | - | NRS | FB | ||||||||||||||
| Saxifraga sp. | 1 | 0 | - | - | - | NRS | FB | ||||||||||||||
| Sedum angustum Maxim. | 1 | 0 | - | - | - | NRS | FB | ||||||||||||||
| Spodiopogon ramosus Keng | 1 | 0 | - | - | - | NRS | GM | ||||||||||||||
| Thalictrum javanicum Blume | 5 | 0 | - | - | - | NRS | FB | ||||||||||||||
| Tiarella polyphylla D. Don | 2 | 0 | - | - | - | NRS | FB | ||||||||||||||
| Tipularia szechuanica Schlechter | 1 | 0 | - | - | - | NRS | FB | ||||||||||||||
| Present only in reforested spruce plantations | |||||||||||||||||||||
| Actaea asiatica Wallich | 0 | 1 | - | - | - | RES | FB | ||||||||||||||
| Adenophora liliifolioides Pax & K. Hoffmann | 0 | 8 | - | - | - | RES | FB | ||||||||||||||
| Agrimonia pilosa Ledebour | 0 | 6 | - | - | - | RES | FB | ||||||||||||||
| Allium sp. | 0 | 2 | - | - | - | RES | FB | ||||||||||||||
| Anaphalis sp. | 0 | 3 | - | - | - | RES | FB | ||||||||||||||
| Anemone demissa J.D. Hooker & Thomson | 0 | 2 | - | - | - | RES | FB | ||||||||||||||
| Artemisia lancea Vaniot | 0 | 2 | - | - | - | RES | FB | ||||||||||||||
| Aster diplostephioides (Candolle) Bentham ex C.B. Clarke | 0 | 10 | - | - | - | RES | FB | ||||||||||||||
| Astragalus mahoschanicus Hand.-Mazz. | 0 | 5 | - | - | - | RES | FB | ||||||||||||||
| Bupleurum longicaule de Candolle | 0 | 3 | - | - | - | RES | FB | ||||||||||||||
| Carex breviculmis R. Brown | 0 | 3 | - | - | - | RES | GM | ||||||||||||||
| Carex dimorpholepis Steudel | 0 | 1 | - | - | - | RES | GM | ||||||||||||||
| Carex ovatispiculata F.T. Wang & Y.L. Chang ex S. Yun Liang | 0 | 6 | - | - | - | RES | GM | ||||||||||||||
| Carpesium sp. | 0 | 3 | - | - | - | RES | FB | ||||||||||||||
| Comastoma cyananthiflorum (Franchet) Holub | 0 | 12 | - | - | - | RES | FB | ||||||||||||||
| Silene baccifera (L.) Roth | 0 | 1 | - | - | - | RES | FB | ||||||||||||||
| Elymus strictus (Keng) S.L. Chen | 0 | 3 | - | - | - | RES | GM | ||||||||||||||
| Euphorbia sp. | 0 | 12 | - | - | - | RES | FB | ||||||||||||||
| Euphrasia pectinata Tenore | 0 | 2 | - | - | - | RES | FB | ||||||||||||||
| Gueldenstaedtia verna (Georgi) Borissova | 0 | 4 | - | - | - | NRS | FB | ||||||||||||||
| Gymnadenia orchidis Lindle | 0 | 1 | - | - | - | RES | FB | ||||||||||||||
| Inula japonica Thunberg | 0 | 12 | - | - | - | RES | FB | ||||||||||||||
| Leontopodium haplophylloides Hand.-Mazz. | 0 | 1 | - | - | - | RES | FB | ||||||||||||||
| Ligularia virgaurea (Maxim.) Mattfeld ex Rehder & Kobuski | 0 | 3 | - | - | - | RES | FB | ||||||||||||||
| Lotus corniculatus L. | 0 | 11 | - | - | - | RES | FB | ||||||||||||||
| Medicago lupulina L. | 0 | 3 | - | - | - | RES | FB | ||||||||||||||
| Melica przewalskyi Roshevitz | 0 | 5 | - | - | - | RES | GM | ||||||||||||||
| Pedicularis chenocephala Diels | 0 | 16 | - | - | - | RES | FB | ||||||||||||||
| Pedicularis superba Franchet ex Maxim. | 0 | 2 | - | - | - | RES | FB | ||||||||||||||
| Pleione sp. | 0 | 1 | - | - | - | RES | FB | ||||||||||||||
| Polygonatum franchetii Hua | 0 | 2 | - | - | - | RES | FB | ||||||||||||||
| Potentilla lineata Treviranus | 0 | 19 | - | - | - | RES | FB | ||||||||||||||
| Primula sp. | 0 | 2 | - | - | - | RES | FB | ||||||||||||||
| Rumex nepalensis Sprengel | 0 | 22 | - | - | - | RES | FB | ||||||||||||||
| Sanicula elata Buchanan-Hamilton ex D. Don | 0 | 2 | - | - | - | RES | FB | ||||||||||||||
| Saussurea epilobioides Maxim. | 0 | 20 | - | - | - | RES | FB | ||||||||||||||
| Saussurea nigrescens Maxim. | 0 | 4 | - | - | - | RES | FB | ||||||||||||||
| Saussurea polycephala Hand.-Mazz. | 0 | 2 | - | - | - | RES | FB | ||||||||||||||
| Silene himalayensis (Rohrbach) Majumdar | 0 | 5 | - | - | - | RES | FB | ||||||||||||||
| Stellera chamaejasme L. | 0 | 1 | - | - | - | RES | FB | ||||||||||||||
| Stipa penicillata Hand.-Mazz. | 0 | 1 | - | - | - | RES | GM | ||||||||||||||
| Tibetia himalaica (Baker) H.P. Tsui | 0 | 2 | - | - | - | RES | FB | ||||||||||||||
| Trollius ranunculoides Hemsley | 0 | 5 | - | - | - | RES | FB | ||||||||||||||
| Veronica szechuanica Batalin | 0 | 3 | - | - | - | RES | FB | ||||||||||||||
| Vicia pseudorobus Fisch. et C.A. Mey | 0 | 14 | - | - | - | RES | FB | ||||||||||||||
| Viola yunnanfuensis W. Becker | 0 | 6 | - | - | - | RES | FB | ||||||||||||||
| Woodsia andersonii (Beddome) Christ | 0 | 1 | - | - | - | RES | FN | ||||||||||||||
| Ubiquitous | |||||||||||||||||||||
| Aconitum scaposum Franchet | 7 | 1 | −2.082 | −1.783 | 0.075 | GES | FB | ||||||||||||||
| Aconitum sinomontanum Nakai | 2 | 3 | 0.462 | 0.455 | 0.649 | GES | FB | ||||||||||||||
| Aconitum sp. | 10 | 14 | 0.415 | 0.883 | 0.377 | GES | FB | ||||||||||||||
| Acronema tenerum (de Candolle) Edgeworth | 6 | 3 | −0.704 | −0.923 | 0.356 | GES | FB | ||||||||||||||
| Adenophora potaninii Korshinsky | 3 | 8 | 1.166 | 1.613 | 0.107 | GES | FB | ||||||||||||||
| Adoxa moschatellina L. | 7 | 14 | 1.003 | 1.848 | 0.065 | GES | FB | ||||||||||||||
| Agrostis clavata Trinius | 20 | 23 | 0.172 | 0.510 | 0.610 | GES | GM | ||||||||||||||
| Ainsliaea henryi Diels | 8 | 17 | 0.918 | 1.948 | 0.051 | GES | FB | ||||||||||||||
| Aletris glabra Bureau & Franchet | 1 | 1 | 0.003 | 0.002 | 0.998 | GES | FB | ||||||||||||||
| Allium cyaneum Regel | 1 | 1 | 0.003 | 0.002 | 0.998 | GES | FB | ||||||||||||||
| Allium ovalifolium Hand.-Mazz. | 4 | 8 | 1.031 | 1.445 | 0.149 | GES | FB | ||||||||||||||
| Anaphalis margaritacea (L.) Bentham & J.D. Hooker | 1 | 6 | 1.926 | 1.464 | 0.143 | GES | FB | ||||||||||||||
| Anemone rivularis Buchanan-Hamilton ex de Candolle | 60 | 63 | 0.086 | 0.387 | 0.699 | GES | FB | ||||||||||||||
| Aquilegia ecalcarata Maxim. | 23 | 14 | −0.547 | −1.484 | 0.138 | GES | FB | ||||||||||||||
| Artemisia sp. | 1 | 3 | 1.165 | 0.889 | 0.374 | GES | FB | ||||||||||||||
| Aster ageratoides | 24 | 19 | −0.340 | −0.921 | 0.357 | GES | FB | ||||||||||||||
| Aster smithianus Hand.-Mazz. | 15 | 22 | 0.633 | 1.527 | 0.127 | GES | FB | ||||||||||||||
| Botrychium lunaria (L.) Swartz | 1 | 1 | 0.003 | 0.002 | 0.998 | GES | FN | ||||||||||||||
| Brachypodium sylvaticum (Hudson) P. Beauvois | 14 | 15 | 0.079 | 0.200 | 0.842 | GES | GM | ||||||||||||||
| Caltha palustris L. | 3 | 1 | −1.110 | −0.849 | 0.396 | GES | FB | ||||||||||||||
| Carex asperifructus Kükenthal | 15 | 10 | −0.475 | −1.058 | 0.290 | GES | GM | ||||||||||||||
| Carex doniana Sprengel | 17 | 25 | 0.441 | 1.308 | 0.191 | GES | GM | ||||||||||||||
| Chamerion angustifolium (L.) Holub | 3 | 8 | 1.150 | 1.519 | 0.129 | GES | FB | ||||||||||||||
| Cimicifuga foetida L. | 19 | 18 | −0.062 | −0.173 | 0.863 | GES | FB | ||||||||||||||
| Circaea alpina L. | 73 | 75 | 0.053 | 0.262 | 0.793 | GES | FB | ||||||||||||||
| Clematis montana Buchanan-Hamilton ex de Candolle | 73 | 70 | −0.081 | −0.373 | 0.709 | GES | FB | ||||||||||||||
| Clematis sp. | 2 | 1 | −0.705 | −0.483 | 0.629 | GES | FB | ||||||||||||||
| Clinopodium gracile (Bentham) Matsumura | 10 | 10 | 0.002 | 0.004 | 0.997 | GES | FB | ||||||||||||||
| Corydalis curviflora Maxim. | 5 | 6 | 0.199 | 0.287 | 0.774 | GES | FB | ||||||||||||||
| Daucus carota L. | 1 | 2 | 0.699 | 0.570 | 0.569 | GES | FB | ||||||||||||||
| Delphinium caeruleum Jacquemont | 4 | 2 | −0.772 | −0.784 | 0.433 | GES | FB | ||||||||||||||
| Dendranthema indicum (L.) Des Moul. | 10 | 14 | 0.384 | 0.853 | 0.394 | GES | FB | ||||||||||||||
| Diphylleia sinensis H.L. Li | 2 | 1 | −0.705 | −0.483 | 0.629 | GES | FB | ||||||||||||||
| Disporum bodinieri (H. Léveillé & Vaniot) F.T. Wang & T. Tang | 12 | 7 | −0.675 | −1.234 | 0.217 | GES | FB | ||||||||||||||
| Epipactis mairei Schlechter | 1 | 2 | 0.710 | 0.485 | 0.628 | GES | FB | ||||||||||||||
| Festuca elata Keng ex E.B. Alexeev | 45 | 50 | 0.190 | 0.756 | 0.450 | GES | GM | ||||||||||||||
| Geranium platyanthum Duthie | 61 | 55 | −0.213 | −0.845 | 0.398 | GES | FB | ||||||||||||||
| Geranium pseudo-farreri Z.M. Tan | 3 | 6 | 0.903 | 1.110 | 0.267 | GES | FB | ||||||||||||||
| Geum aleppicum Jacquin | 2 | 6 | 1.446 | 1.535 | 0.125 | GES | FB | ||||||||||||||
| Heracleum scabridum Franchet | 5 | 6 | 0.207 | 0.297 | 0.767 | GES | FB | ||||||||||||||
| Lactuca graciliflora de Candolle | 22 | 12 | −0.722 | −1.816 | 0.069 | GES | FB | ||||||||||||||
| Laportea bulbifera (Siebold & Zuccarini) Weddell | 15 | 7 | −0.888 | −1.771 | 0.077 | GES | FB | ||||||||||||||
| Ligularia sagitta (Maxim.) Mattfeld ex Rehder & Kobuski | 3 | 2 | −0.471 | −0.457 | 0.648 | GES | FB | ||||||||||||||
| Lunathyrium shennongense Ching | 8 | 7 | −0.119 | −0.214 | 0.830 | GES | FN | ||||||||||||||
| Luzula effusa Buchenau | 8 | 3 | −1.047 | −1.349 | 0.177 | GES | GM | ||||||||||||||
| Lysimachia sp. | 7 | 4 | −0.629 | −0.879 | 0.379 | GES | FB | ||||||||||||||
| Maianthemum henryi (Baker) LaFrankie | 14 | 9 | −0.577 | −1.141 | 0.254 | GES | FB | ||||||||||||||
| Notopterygium incisum C.C. Ting ex H.T. Chang | 31 | 32 | 0.063 | 0.221 | 0.825 | GES | FB | ||||||||||||||
| Oenanthe sp. | 8 | 11 | 0.372 | 0.720 | 0.472 | GES | FB | ||||||||||||||
| Paeonia anomala subsp. veitchii (Lynch) D.Y. Hong & K.Y. Pan | 6 | 4 | −0.436 | −0.557 | 0.577 | GES | FB | ||||||||||||||
| Panax pseudoginseng var. bipinnatifidus (Seem.) Li | 11 | 11 | −0.004 | −0.008 | 0.994 | GES | FB | ||||||||||||||
| Parasenecio roborowskii (Maxim.) Y.L. Chen | 37 | 24 | −0.555 | −1.870 | 0.062 | GES | FB | ||||||||||||||
| Parnassia delavayi Franchet, | 2 | 4 | 0.843 | 0.867 | 0.386 | GES | FB | ||||||||||||||
| Pedicularis kansuensis Maxim. | 2 | 1 | −0.782 | −0.575 | 0.565 | GES | FB | ||||||||||||||
| Pedicularis rudis Maxim. | 2 | 2 | 0.002 | 0.002 | 0.998 | GES | FB | ||||||||||||||
| Pedicularis sp. | 9 | 2 | −1.671 | −1.902 | 0.057 | GES | FB | ||||||||||||||
| Phlomis megalantha Diels | 14 | 9 | −0.580 | −1.150 | 0.250 | GES | FB | ||||||||||||||
| Picris hieracioides L. | 26 | 20 | −0.340 | −0.952 | 0.341 | GES | FB | ||||||||||||||
| Poa chalarantha Keng ex L. Liu | 6 | 7 | 0.194 | 0.310 | 0.757 | GES | GM | ||||||||||||||
| Poa lithophila Keng ex L. Liu | 1 | 1 | 0.003 | 0.002 | 0.998 | GES | GM | ||||||||||||||
| Poa nubigena Keng ex L. Liu | 5 | 6 | 0.197 | 0.296 | 0.767 | GES | GM | ||||||||||||||
| Polygonum cyanandrum Diels | 13 | 10 | −0.352 | −0.728 | 0.467 | GES | FB | ||||||||||||||
| Polygonum macrophyllum D. Don | 10 | 10 | 0.003 | 0.005 | 0.996 | GES | FB | ||||||||||||||
| Polystichum brachypterum (Kuntze) Ching | 2 | 1 | −0.676 | −0.463 | 0.644 | GES | FN | ||||||||||||||
| Primula kialensis Franchet | 2 | 4 | 0.991 | 1.049 | 0.294 | GES | FB | ||||||||||||||
| Primula moupinensis Franchet | 2 | 3 | 0.416 | 0.425 | 0.671 | GES | FB | ||||||||||||||
| Primula odontocalyx (Franchet) Pax | 2 | 4 | 0.744 | 0.769 | 0.442 | GES | FB | ||||||||||||||
| Pteridium revolutum (Blume) Nakai | 5 | 13 | 0.997 | 1.781 | 0.075 | GES | FN | ||||||||||||||
| Pternopetalum heterophyllum Hand.-Mazz. | 31 | 29 | −0.083 | −0.291 | 0.771 | GES | FB | ||||||||||||||
| Rorippa elata (J.D. Hooker & Thomson) Hand-Mazz. | 16 | 13 | −0.235 | −0.541 | 0.589 | GES | FB | ||||||||||||||
| Rumex acetosa L. | 2 | 2 | 0.002 | 0.001 | 0.999 | GES | FB | ||||||||||||||
| Salvia cynica Dunn | 34 | 37 | 0.120 | 0.450 | 0.653 | GES | FB | ||||||||||||||
| Salvia maximowicziana Hemsley | 26 | 17 | −0.700 | −1.713 | 0.087 | GES | FB | ||||||||||||||
| Salvia przewalskii Maxim. | 7 | 11 | 0.487 | 0.933 | 0.351 | GES | FB | ||||||||||||||
| Sambucus adnata Wallich ex Candolle | 15 | 16 | 0.071 | 0.183 | 0.855 | GES | FB | ||||||||||||||
| Saussurea retroserrata Y.L. Chen & S. Yun Liang | 8 | 4 | −0.726 | −1.101 | 0.271 | GES | FB | ||||||||||||||
| Scutellaria hypericifolia H. Léveillé | 5 | 2 | −1.053 | −1.116 | 0.265 | GES | FB | ||||||||||||||
| Sedum tatarinowii | 6 | 3 | −0.868 | −1.095 | 0.274 | GES | FB | ||||||||||||||
| Sinopodophyllum hexandrum (Royle) T.S. Ying | 12 | 18 | 0.468 | 1.141 | 0.254 | GES | FB | ||||||||||||||
| Stellaria chinensis Regel | 19 | 19 | −0.001 | −0.003 | 0.997 | GES | FB | ||||||||||||||
| Stellaria sp. | 10 | 18 | 0.665 | 1.538 | 0.124 | GES | FB | ||||||||||||||
| Thalictrum finetii B. Boivin | 1 | 3 | 1.979 | 0.744 | 0.457 | GES | FB | ||||||||||||||
| Thalictrum oligandrum Maxim. | 14 | 24 | 0.642 | 1.741 | 0.082 | GES | FB | ||||||||||||||
| Triosteum himalayanum Wallic | 4 | 10 | 1.073 | 1.276 | 0.202 | GES | FB | ||||||||||||||
| Valeriana officinalis L. | 16 | 27 | 0.643 | 1.844 | 0.065 | GES | FB | ||||||||||||||
| Valeriana tangutica Batalin | 1 | 5 | 1.771 | 1.422 | 0.155 | GES | FB | ||||||||||||||
| Vicia cracca L. | 1 | 7 | 2.245 | 1.882 | 0.060 | GES | FB | ||||||||||||||
| More frequent in naturally regenerated forest stands relative to reforested spruce plantations | |||||||||||||||||||||
| Adiantum davidii Franchet | 52 | 32 | −0.696 | −2.584 | 0.010 | NRS | FN | ||||||||||||||
| Adiantum pedatum L. | 16 | 1 | −3.814 | −3.239 | 0.001 | NRS | FN | ||||||||||||||
| Allium ovalifolium var.cordifolium (J.M. Xu) J.M. Xu | 47 | 6 | −2.589 | −5.393 | <0.001 | NRS | FB | ||||||||||||||
| Aruncus sylvester Kosteletzky ex Maxim. | 30 | 6 | −1.814 | −3.817 | <0.001 | NRS | FB | ||||||||||||||
| Asplenium pekinense Hance | 9 | 2 | −1.696 | −1.986 | 0.047 | NRS | FN | ||||||||||||||
| Bromus plurinodes Keng ex Keng f. | 33 | 20 | −0.667 | −2.061 | 0.039 | NRS | GM | ||||||||||||||
| Cardamine impartiens L. | 9 | 1 | −2.289 | −2.013 | 0.044 | NRS | FB | ||||||||||||||
| Carex huolushanensis P.C. Li | 12 | 2 | −1.881 | −2.162 | 0.031 | NRS | GM | ||||||||||||||
| Carex lehmanii Drejer | 18 | 3 | −2.916 | −3.274 | 0.001 | NRS | GM | ||||||||||||||
| Carex sp. | 54 | 29 | −0.838 | −3.125 | 0.002 | NRS | GM | ||||||||||||||
| Carpesium divaricatum Siebold & Zuccarini | 86 | 54 | −0.715 | −3.358 | 0.001 | NRS | FB | ||||||||||||||
| Cystopteris moupinensis Franchet | 122 | 90 | −0.774 | −3.501 | <0.001 | NRS | FN | ||||||||||||||
| Deyeuxia scabrescens (Grisebach) Munro ex Duthie | 9 | 1 | −2.397 | −1.962 | 0.049 | NRS | GM | ||||||||||||||
| Dryopteris rosthornii (Diels) C. Christensen | 43 | 8 | −1.924 | −4.701 | <0.001 | NRS | FN | ||||||||||||||
| Dryopteris sinofibrillosa Ching | 43 | 16 | −1.176 | −3.676 | <0.001 | NRS | FN | ||||||||||||||
| Galium paradoxum Maxim. | 52 | 33 | −0.569 | −2.276 | 0.023 | NRS | FB | ||||||||||||||
| Geranium pylzowianum Maxim. | 33 | 8 | −1.834 | −4.123 | <0.001 | NRS | FB | ||||||||||||||
| Hackelia brachytuba (Diels) I.M. Johnston | 74 | 20 | −2.022 | −6.406 | <0.001 | NRS | FB | ||||||||||||||
| Impatiens delavayi Franchet, | 15 | 2 | −2.292 | −2.717 | 0.007 | NRS | FB | ||||||||||||||
| Impatiens dicentra Franchet ex J.D. Hooker | 73 | 14 | −2.180 | −6.547 | <0.001 | NRS | FB | ||||||||||||||
| Ligularia przewalskii (Maxim.) Diels | 19 | 2 | −2.662 | −3.152 | 0.002 | NRS | FB | ||||||||||||||
| Maianthemum tatsienense (Franchet) LaFrankie | 23 | 10 | −0.929 | −2.289 | 0.022 | NRS | FB | ||||||||||||||
| Notoseris gracilipes Shih | 28 | 4 | −2.374 | −3.946 | <0.001 | NRS | FB | ||||||||||||||
| Ophiopogon bodinieri H. Léveillé | 60 | 7 | −3.154 | −6.584 | <0.001 | NRS | FB | ||||||||||||||
| Oxalis acetosella L. | 25 | 7 | −1.513 | −3.237 | 0.001 | NRS | FB | ||||||||||||||
| Parasenecio deltophyllus (Maxim.) Y.L. Chen | 36 | 20 | −0.710 | −2.307 | 0.021 | NRS | FB | ||||||||||||||
| Parasenecio forrestii W.W. Smith & J. Small | 31 | 18 | −0.703 | −2.125 | 0.034 | NRS | FB | ||||||||||||||
| Pseudocystopteris subtriangularis (Hook.) Ching | 213 | 125 | −1.430 | −7.616 | <0.001 | NRS | FN | ||||||||||||||
| Pyrola calliantha Andres | 11 | 2 | −1.949 | −2.339 | 0.019 | NRS | FB | ||||||||||||||
| Rubia cordifolia L. | 133 | 103 | −0.458 | −2.617 | 0.009 | NRS | FB | ||||||||||||||
| Streptopus obtusatus Fassett | 110 | 52 | −1.311 | −5.894 | <0.001 | NRS | FB | ||||||||||||||
| Thalictrum petaloideum L. | 11 | 3 | −1.605 | −2.258 | 0.024 | NRS | FB | ||||||||||||||
| More frequent in reforested spruce plantation stands relative to naturally regenerated forests | |||||||||||||||||||||
| Anaphalis lacteal Maxim. | 39 | 71 | 0.920 | 3.767 | <0.001 | RES | FB | ||||||||||||||
| Angelica biserrata (R.H. Shan & C.Q. Yuan) C.Q. Yuan & R.H. Shan | 2 | 10 | 1.909 | 2.204 | 0.028 | RES | FB | ||||||||||||||
| Artemisia annua L. | 3 | 27 | 2.525 | 3.909 | <0.001 | RES | FB | ||||||||||||||
| Artemisia tangutica Pamp. | 2 | 20 | 2.540 | 3.232 | 0.001 | RES | FB | ||||||||||||||
| Cardamine hirsute L. | 10 | 31 | 1.463 | 3.543 | <0.001 | RES | FB | ||||||||||||||
| Cardamine tangutorum O.E. Schulz | 56 | 112 | 1.898 | 6.438 | <0.001 | RES | FB | ||||||||||||||
| Carex capilliformis Franchet | 11 | 39 | 1.706 | 4.376 | <0.001 | RES | GM | ||||||||||||||
| Carpesium cernuum L. | 9 | 65 | 2.856 | 6.695 | <0.001 | RES | FB | ||||||||||||||
| Chrysosplenium griffithii J.D. Hooker & Thomson | 4 | 14 | 1.567 | 2.498 | 0.013 | RES | FB | ||||||||||||||
| Clematis pogonandra Maxim. | 29 | 53 | 1.018 | 3.439 | 0.001 | RES | FB | ||||||||||||||
| Deyeuxia pyramidalis (Host) Veldkam | 3 | 21 | 2.916 | 3.997 | <0.001 | RES | GM | ||||||||||||||
| Epilobium fangii C.J. Chen | 5 | 33 | 2.251 | 4.314 | <0.001 | RES | FB | ||||||||||||||
| Epilobium fastigiatoramosum Nakai, | 11 | 37 | 1.434 | 3.858 | <0.001 | RES | FB | ||||||||||||||
| Epilobium tibetanum Haussknecht | 27 | 44 | 0.592 | 2.214 | 0.027 | RES | FB | ||||||||||||||
| Epipactis helloborine (L.) Crantz. | 1 | 10 | 2.467 | 2.096 | 0.036 | RES | FB | ||||||||||||||
| Fragaria vesca L. | 66 | 123 | 1.133 | 5.565 | <0.001 | RES | FB | ||||||||||||||
| Galium trifidum L. | 15 | 41 | 1.263 | 3.774 | <0.001 | RES | FB | ||||||||||||||
| Geranium nepalense Sweet | 7 | 38 | 2.180 | 4.67 | <0.001 | RES | FB | ||||||||||||||
| Halenia elliptica D. Don | 13 | 30 | 0.961 | 2.712 | 0.007 | RES | FB | ||||||||||||||
| Impatiens apsotis J.D. Hooke | 5 | 18 | 1.346 | 2.501 | 0.012 | RES | FB | ||||||||||||||
| Lobelia nummularia Lamarck | 3 | 16 | 1.941 | 2.768 | 0.006 | RES | FB | ||||||||||||||
| Pedicularis labordei Vaniot ex Bonati | 2 | 10 | 1.808 | 2.156 | 0.031 | RES | FB | ||||||||||||||
| Phlomis umbrosa Turczaninow | 3 | 13 | 1.723 | 2.473 | 0.013 | RES | FB | ||||||||||||||
| Plantago depressa Willdenow | 2 | 23 | 3.411 | 3.909 | <0.001 | RES | FB | ||||||||||||||
| Poa annua L. | 4 | 25 | 2.681 | 4.138 | <0.001 | RES | GM | ||||||||||||||
| Polygonatum verticillatum (L.) Allioni | 12 | 41 | 1.686 | 4.394 | <0.001 | RES | FB | ||||||||||||||
| Polygonum viviparum L. | 90 | 122 | 0.576 | 3.092 | 0.002 | RES | FB | ||||||||||||||
| Primula palmate Hand.-Mazz. | 28 | 45 | 2.274 | 4.016 | <0.001 | RES | FB | ||||||||||||||
| Ranunculus japonicas Thunberg | 2 | 23 | 3.243 | 3.914 | <0.001 | RES | FB | ||||||||||||||
| Ranunculus tanguticus (Maxim.) Ovczinnikov | 2 | 32 | 3.585 | 4.432 | <0.001 | RES | FB | ||||||||||||||
| Sanicula hacquetioides Franchet | 2 | 48 | 4.395 | 5.247 | <0.001 | RES | FB | ||||||||||||||
| Stellaria vestita Kurz | 12 | 40 | 1.436 | 4.032 | <0.001 | RES | FB | ||||||||||||||
| Trigonotis tibetica (C.B. Clarke) I.M. Johnston | 8 | 24 | 1.291 | 2.909 | 0.004 | RES | FB | ||||||||||||||
| Veronica vandellioides Maxim. | 10 | 27 | 1.120 | 2.835 | 0.005 | RES | FB | ||||||||||||||
| Vicia unijuga A. Braun | 4 | 22 | 1.979 | 3.345 | 0.001 | RES | FB | ||||||||||||||
| Viola biflora L. | 47 | 74 | 1.019 | 3.646 | <0.001 | RES | FB | ||||||||||||||
© 2014 by the authors; licensee MDPI, Basel, Switzerland. This article is an open access article distributed under the terms and conditions of the Creative Commons Attribution license (http://creativecommons.org/licenses/by/3.0/).
Share and Cite
Fang, Z.; Bao, W.; Yan, X.; Liu, X. Understory Structure and Vascular Plant Diversity in Naturally Regenerated Deciduous Forests and Spruce Plantations on Similar Clear-Cuts: Implications for Forest Regeneration Strategy Selection. Forests 2014, 5, 715-743. https://doi.org/10.3390/f5040715
Fang Z, Bao W, Yan X, Liu X. Understory Structure and Vascular Plant Diversity in Naturally Regenerated Deciduous Forests and Spruce Plantations on Similar Clear-Cuts: Implications for Forest Regeneration Strategy Selection. Forests. 2014; 5(4):715-743. https://doi.org/10.3390/f5040715
Chicago/Turabian StyleFang, ZhiQiang, WeiKai Bao, XiaoLi Yan, and Xin Liu. 2014. "Understory Structure and Vascular Plant Diversity in Naturally Regenerated Deciduous Forests and Spruce Plantations on Similar Clear-Cuts: Implications for Forest Regeneration Strategy Selection" Forests 5, no. 4: 715-743. https://doi.org/10.3390/f5040715