Communication

Outlook for the Next Generation’s Precision Forestry in Finland

by
Markus Holopainen
1,2,*,
Mikko Vastaranta
1,2 and
Juha Hyyppä
2,3
1
Department of Forest Sciences, University of Helsinki, FI-00014 Helsinki, Finland
2
Centre of Excellence in Laser Scanning Research, Finnish Geodetic Institute, FI-02431 Masala, Finland
3
Department of Remote Sensing and Photogrammetry, Finnish Geodetic Institute, FI-02431 Masala, Finland
*
Author to whom correspondence should be addressed.
Forests 2014, 5(7), 1682-1694; https://doi.org/10.3390/f5071682
Submission received: 9 April 2014 / Revised: 30 May 2014 / Accepted: 2 July 2014 / Published: 15 July 2014
(This article belongs to the Special Issue Applications of Remote Sensing to Forestry)

Abstract

:
During the past decade in forest mapping and monitoring applications, the ability to acquire spatially accurate, 3D remote-sensing information by means of laser scanning, digital stereo imagery and radar imagery has been a major turning point. These 3D data sets that use single- or multi-temporal point clouds enable a wide range of applications when combined with other geoinformation and logging machine-measured data. New technologies enable precision forestry, which can be defined as a method to accurately determine characteristics of forests and treatments at stand, sub-stand or individual tree level. In precision forestry, even individual tree-level assessments can be used for simulation and optimization models of the forest management decision support system. At the moment, the forest industry in Finland is looking forward to next generation’s forest inventory techniques to improve the current wood procurement practices. Our vision is that in the future, the data solution for detailed forest management and wood procurement will be to use multi-source and -sensor information. In this communication, we review our recent findings and describe our future vision in precision forestry research in Finland.

1. Introduction

1.1. Background

In Finland, intensive small-scale forestry is practiced mainly in privately owned forests. There are over 700,000 forest owners, and the size of the average forest holding is only 25 hectares. Wood raw material stocks and flows have to be allocated precisely in these circumstances. Thus, from the wood buyer’s and also the forest owner’s point of view, the profitability of forestry is dependent upon accurate forest resource information, because detailed forest information is required to optimize and allocate various forest-management tasks and loggings. During the past decade in forest mapping and monitoring applications, the possibility of acquiring spatially accurate, 3D remote-sensing information by means of airborne laser scanning (ALS) has been a major turning point. Currently, forest inventory attributes are derived using an area-based approach (ABA) where low-density (~0.5 pulses per m2) ALS data are used to generalize field-measured inventory attributes over an entire inventory area. This approach has succeeded in replacing traditional stand-wise field inventories (SWFIs). In Finnish SWFI practices, every stand has been visited by a forest planner, and forest inventory attributes were then derived from relascopic measurements and/or visual assessment. Compared to SWFI, ABA has provided more precise estimation of the inventory attributes, as well as cost savings. Use of laser scanning technology enables a wide range of applications that can accelerate forestry. Precision forestry will be based on more efficient use of 3D information that is acquired from different data sources using various sensors. In this communication, we review our recent findings and describe our future vision in precision forestry research.

1.2. Towards Precision Forestry

Detailed and up-to-date information is a necessity for implementing sustainable forest resource management practices. To acquire this information, forest companies and governmental organizations are using ALS-based, forest-inventory methodologies. ALS technology and applications have matured rapidly and are already widely used in operational applications in forestry and surveying. ALS enables the development of detailed maps of ground elevations and detailed characterization of forests. In contrast to many remote-sensing data sources, ALS is spatially detailed (high resolution) and captures vegetation and tree heights. The height of individual trees or canopy density of the stand can be measured accurately with this novel technology. National Land Survey (NLS) is coordinating collection of countrywide (338,000 km2) terrain elevation data using ALS. The Finnish Forest Centre has used ALS data in combination with aerial images for management planning forest inventory of family forests since 2010. Forest companies and Metsähallitus (state forests) began using ALS data for forest resource management even earlier.
Operational ALS-based forest inventories apply ABA [1]. The foremost advantages of ABA include the precise prediction of suite-of-basic-forest-inventory variables, such as stem volume; basal-area and height; sampling-based estimations with the possibility to calculate accuracy statistics; and, at least in principle, ALS-based forest inventory does not require stand boundaries [2]. In addition, current ALS data (0.5 pulses per m2) acquisition and processing costs for ABA are lower than those of traditional stand-wise field inventory methods [3,4]. With ALS, the scale is at the stand-sub-stand levels. The total timber volume is obtained with high accuracy, while information about size-distribution, timber assortments or the number of trees has limited reliability (e.g., [5,6]). ALS data is suitable also for the estimation of other various forest characteristics [6,7]. ABA has been at an operational stage for many years, and therefore it is already a proven method [2,3,4,7]. However, entirely different estimation and operation models are required for tasks that would extend our knowledge available from a forest, compared to the traditional, subjective forest mapping inventories. For example, in ABA, stem-quality attributes required by the forest industry, such as species-specific timber assortments, cannot be obtained accurately [5,8,9,10]. Single tree-level information would be required to solve the above-mentioned limitations [11,12]. Thus, there is growing interest for more detailed forest measurements. Single trees can be detected from the ALS data [13,14]. Nevertheless, single-tree techniques have failed to challenge ABA to date, mainly because of problems with reliable tree detection in various forest conditions [15]. To optimize cutting, the stem-diameter distribution, stem form, and quality information must be measured as accurately as possible. From a detailed forest mapping point of view, ALS data has certain limitations. For example, tree species recognition has proven to be challenging, and individual tree-level information cannot be obtained with an accuracy required for wood procurement planning. There is growing interest in more detailed measurements of the forests; the main driver is the profitability of forestry. In other words, the above-mentioned limitations in ALS-based forest mapping need to be solved.

2. Precision Forestry by Means of Multisource 3D Information

At the moment, forest industry in Finland is looking toward the next generation’s individual tree-level techniques for forest inventory to create added value, cost savings and new value chains. Our vision is that the base product for the next generation’s precision forestry-based forest resource management will consist of up-to-date forest attribute maps with spatial resolutions of 10–20 m. This kind of information can be produced by the current ABA inventory techniques. However, the challenges are (1) how to provide more detailed information for wood procurement and (2) the age of the inventory information limits its usefulness and therefore must be frequently updated. Raster map information is suitable for many forest management applications, and it should be possible to be up-scaled to the single tree level using multisource temporal data in the near future (Figure 1).
Figure 1. The base product for forest resource management will be forest attribute maps with spatial resolution of 10–20 m; the raster map can be up-scaled for single tree level using multisource and temporal data.
Forests 05 01682 g001
Multisource information, acquired from a variety of sensors and platforms, promises to be a viable data source for precision forestry. Most of the wood trade profits are realizable in mature stands, as historical forest operations can be used to determine the quality of the wood and thus the amount of possible profit in the final cutting. Thus, in our vision, requirements for forest information vary depending on the forests’ maturity according to the metrics presented in Table 1. We believe that ALS data sets should be acquired at 10-year intervals. Aerial imagery should be collected every two to three years and satellite 3D data on a weekly basis. Logging machine-mounted 3D scanners will collect tree-level reference data that are complemented by other laser scanning data acquisitions. In addition, harvesters will produce accurate tree maps after the final thinning. The availability of remote sensing data at the hypothetical intervals is probable and thus contains only minor uncertainty in our vision. However, the mounting of 3D laser scanners on the harvester is still an active research area ([16], See section 3.1) with promising research results, we expect that the solution is within reach.
Table 1. Data requirements for precision forestry depending on stand development stage.
Data requirements for forest inventoryStand development stage
Seedling standsThinning standAfter the final thinning/mature stands
Level of the required detail Grid Grid Single tree
Ground truth UAV MLS, ground plots Logging machine, MLS
DTM ALS-based ALS-based ALS-based
Remote sensing data ALS, stereo imagery ALS, stereo imagery ALS, stereo imagery

3. Precision Forestry Data Acquisition Techniques

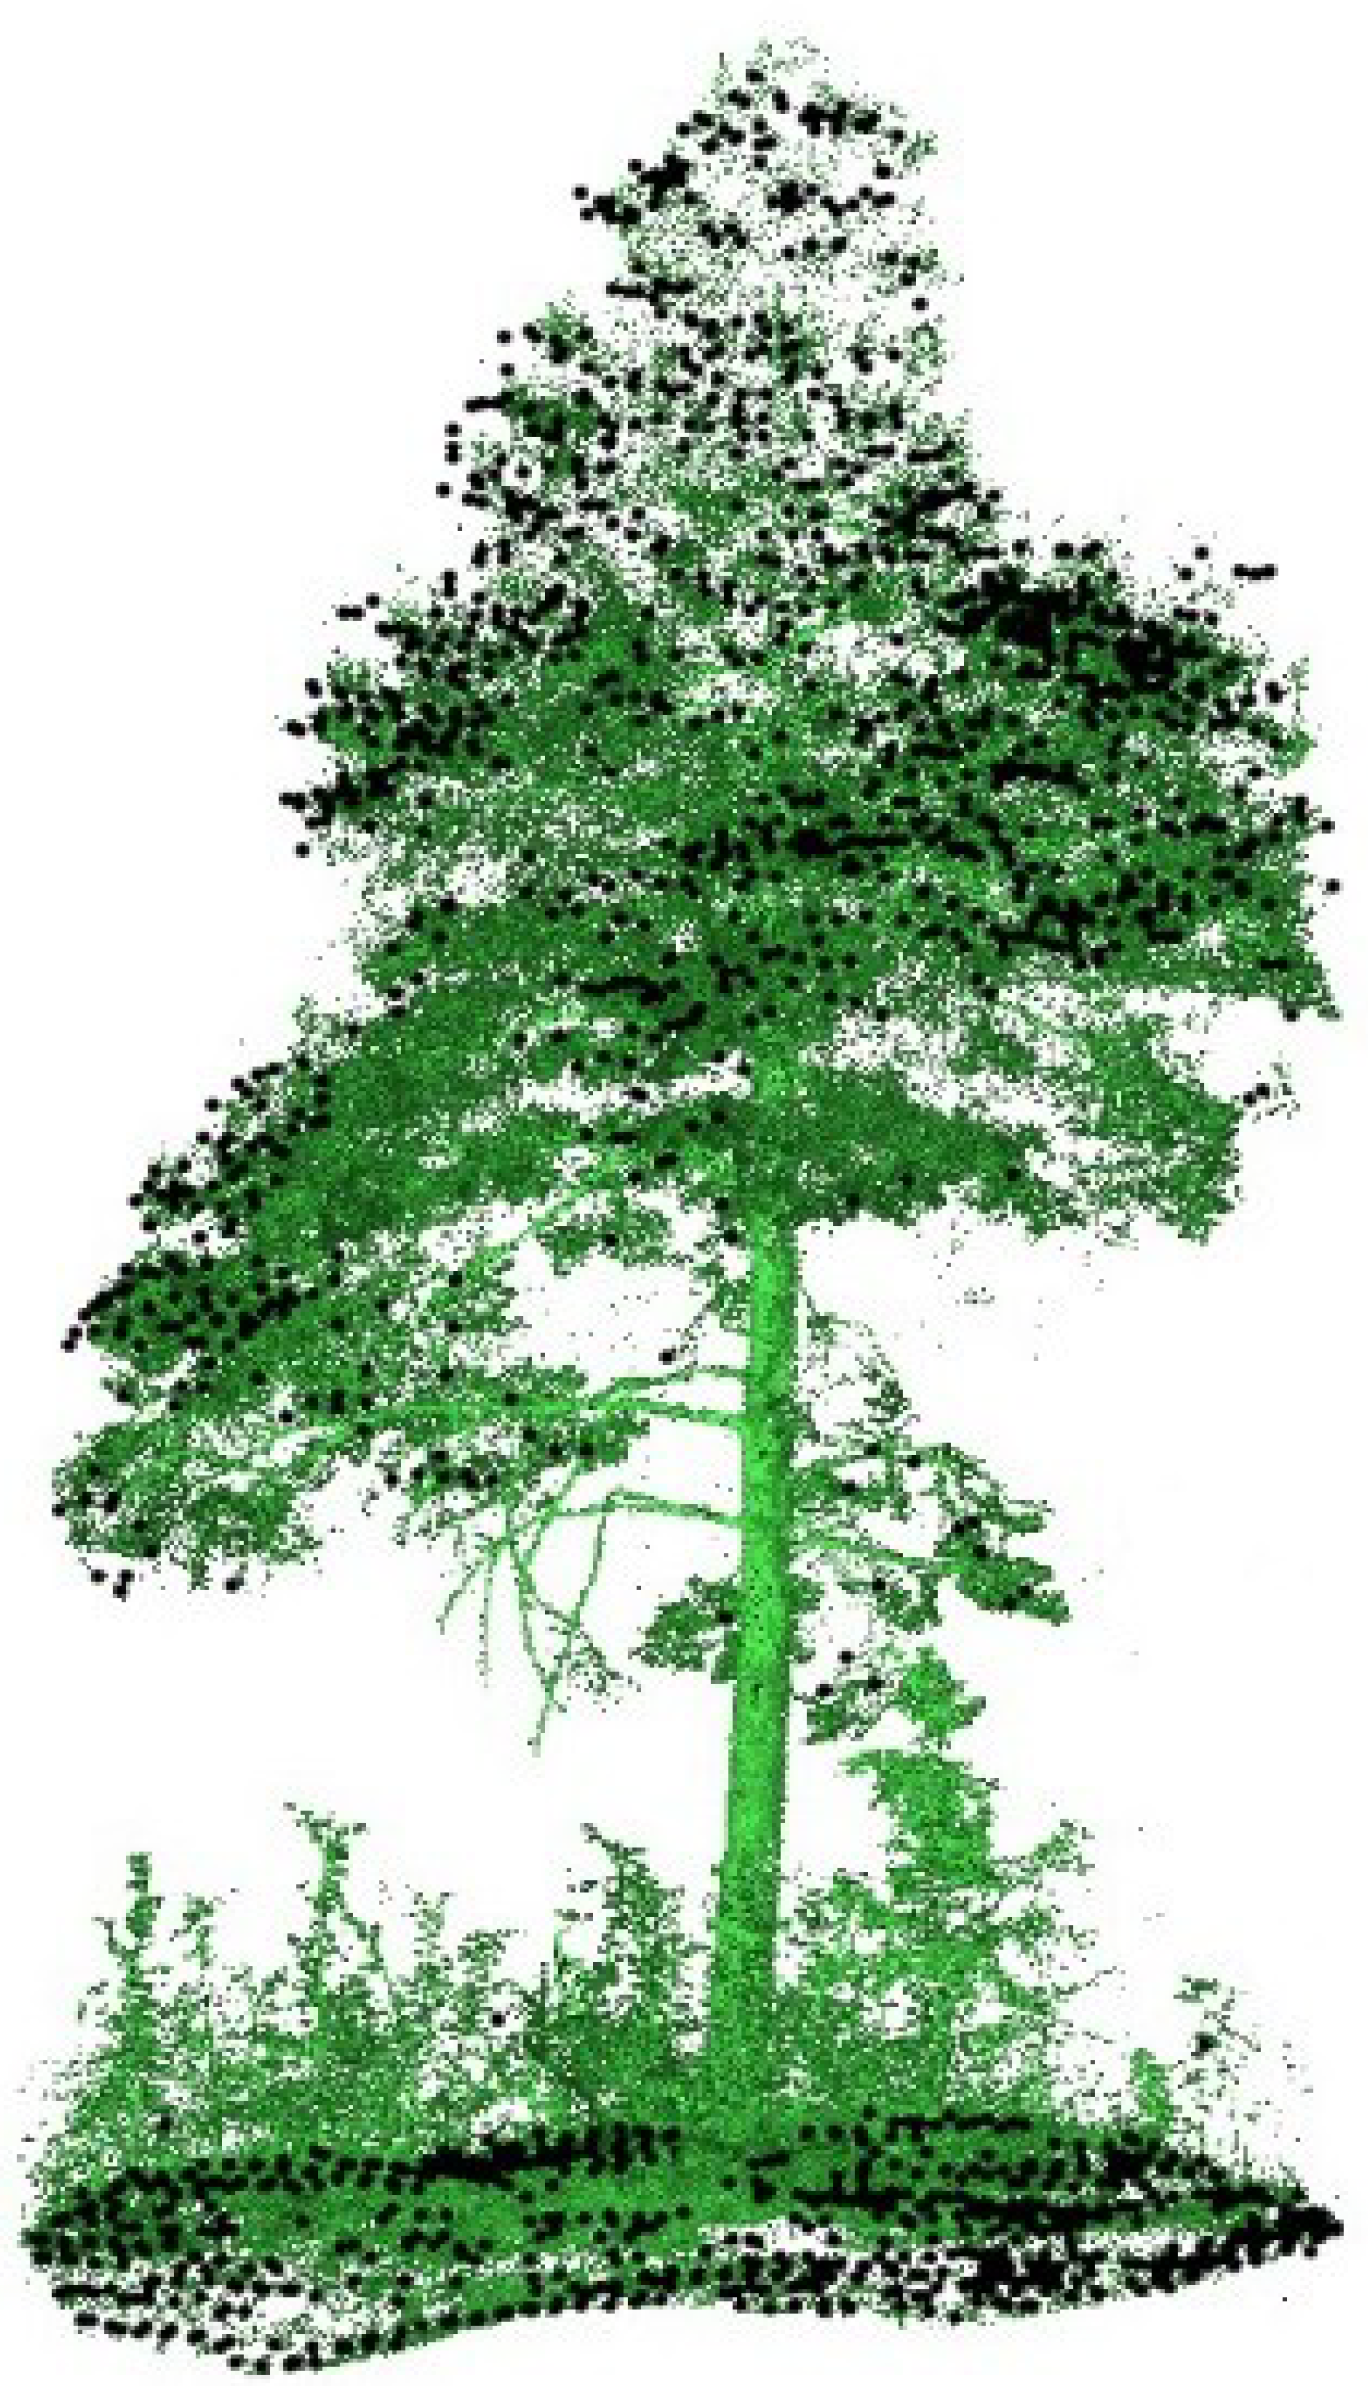
3.1. Terrestrial and Mobile Laser Scanning

ALS is the most frequently applied laser technique in forestry. However, in the acquisition of ground truth or in small-area monitoring, terrestrial or mobile laser scanning (TLS, MLS) are feasible. TLS or MLS point clouds provide far more detailed descriptions of the stem than an ALS point cloud (Figure 2). TLS data are usually acquired with a tripod-mounted laser scanner. The tripod is placed in the desired location, and the scanner measures the 3D locations of the targets within the scanner field of view. With respect to coverage, point density and accuracy, it is also possible to use mobile laser scanning (MLS) to cover the gap between ALS and TLS. MLS is a multi-sensor system that integrates navigation and data acquisition sensors on a rigid, moving platform for collecting point clouds in similar fashion to ALS. Examples of the moving platforms are vans, cars, boats, UAVs (Unmanned Aerial Vehicles), and logging machines. The navigation sensors usually include GNSS (Global navigation satellite system) receivers and an IMU (Inertial Measurement Unit), while the data acquisition sensors include laser scanners and various imaging systems.
The point clouds provided by the MLS can be characterized by the following parameters: (a) point density of from several hundred to several thousand points per m2; (b) XYZ-point accuracy of a few centimeters when the data are collected in good GPS and IMU conditions; and (c) typical target ranges of less than 100 meters. The use of TLS and MLS in scientific work is still in its infancy; thus, the status of MLS is similar to that of the ALS in the late 1990s.
Figure 2. Combination of the TLS (green) and ALS (dark blue) point clouds.
Forests 05 01682 g002

3.2. Airborne and Space-Borne Point Clouds

ALS has been the primary data source for three-dimensional (3D) information on forest vertical structure; however, there is an increasing interest in the use of high spatial resolution digital aerial, optical satellite or radar imagery to generate 3D information analogous to ALS data [17,18] to support forest inventory and monitoring. This interest in alternative technologies for acquiring accurate height information can be attributed to the need to control cost. At the moment, imagery is about one-half to one-third of the cost of ALS data. In addition, certain forest inventory attributes remain difficult to obtain without imagery, such as species composition [2,18]. Point clouds derived from the aerial imagery can provide point densities of 100 points/m2 depending on image resolution. However, the imagery-derived height information primarily characterizes the outer canopy envelope; the detection of small canopy openings is limited. The lack of penetration and insensitivity to small canopy openings limits the variety of metrics that may be generated from the digital stereo imagery when compared to the broad range of metrics that may be calculated from the ALS data [17]. On the other hand, it should be noted that aerial images also provide spectral information that is useful in tree species classification, and the height information is as accurate as that obtained from ALS. A review of the potential of aerial image-derived point clouds for forestry purposes can be found in White et al. [18].
Besides optical images, commercial radar satellite data have rapidly improved in recent years in terms of spatial resolution, thanks to the latest very-high-resolution synthetic aperture radar (SAR) satellites (e.g., TerraSAR-X, COSMO-SkyMed, Radarsat-2, and TanDEM-X). SAR is able to provide images with a resolution of about 1 m from satellites orbiting at altitudes of several hundred kilometers. A major advantage of radar images, compared with optical region satellite images, has been their availability (temporal resolution) under varying imaging conditions. Radargrammetry and interferometry are basic techniques used to derive 3D information from radar imagery. Radargrammetry is based on the stereoscopic measurement of SAR images [19] in which, analogously to photogrammetric forward intersection, two or more radar images with different viewing perspectives are used to extract 3D information from the target area. Although radargrammetry has been a well-known technique for many decades, it has gained new recognition due to the new SAR satellites with enhanced spatial resolution [20]. Interferometric height measurements are based on the phase differences of two or more SAR data acquisitions with slightly different view angles. Compared to the ALS and digital stereo imagery (DSI), the obtained point densities are far sparser. As a result, the derived digital surface model (DSM) has a spatial resolution of approximately 5 m to 10 m, and information can be derived only to the substand (e.g., 20 m grid) or stand level. In theory, the strength of SAR is the temporal resolution. SAR data can be obtained on nearly a daily basis. Thus, in the future, SAR techniques have an operational potential to monitor forest changes such as natural hazards and cuttings.
In general, with these more cost-efficient 3D techniques, forest managers could potentially realize more frequent inventory cycles providing more up-to-date information. For the purposes of forest mapping and monitoring, it has been suggested that ALS data could be acquired at regular, but extended, time periods (i.e., every 10 or 20 years, depending on forest and management considerations), with forest information updated periodically using alternative point clouds [17] derived from optical satellite, aerial or radar imagery acquired in between regular forest inventory cycles. In theory, these point clouds could be used for area-based estimations in a fashion analogous to ALS data, or DSM height information could be generalized even to the single trees [17]. It should be noted that an ALS-derived digital terrain model (DTM) is required with all of these alternative techniques.
How will ALS be used for precision forestry in the future? At the moment, ALS is used for area-based predictions with operational point densities below one pulse per m2. Due to technical developments, the pulse densities are constantly increasing. Higher pulse densities enable detection of the single trees from the point cloud. However, regardless of the applied pulse density, detection of all the trees with the 100% certainty required for precision forestry is still a major challenge. In addition, although single trees can be measured from ALS, there still remain limitations in extraction of tree attributes. Except for tree height, other tree attributes have to be predicted statistically. It should be pointed out that these limitations exist with all of the above-mentioned remote-sensing techniques.

3.3. Collecting Forest Resource Information Using Logging Machines

Cut-to-length logging machines are used for thinning and clear-cutting. During harvesting, logging machines collect detailed information from forests; tree species, timber assortments, tree quality and stem curve are measured and stored from the harvested trees. These data could be used in precision forestry to complete the field measurements, providing both more inexpensive and detailed ground truth. In addition, more measuring sensors could be mounted on a logging machine to collect information from the remaining trees. Thus, the most important application where logging machines could be used as a measuring device would be monitoring of thinning density, to support the decision making of the driver and to provide measurements of the remaining trees. Presumably, the collected information could also be used for improving the bucking of the stems. If logging machines can be developed to collect accurate real-time information from the harvested stand, it would be a major step toward the automatization of forestry operations. However, currently the operationally-obtained positional accuracy of the logging machine tree data is not sufficient for automatic planning of harvesting routes or match to the trees measured with remote-sensing data. The location of the logging machine under varying forest canopy is recorded at an accuracy of about 3 m [21]. Positioning of the logging machine under the forest canopy requires improvement.
Sensor and measurement systems that can be mounted on a logging machine are being actively investigated by forest machine companies and several research groups [16]. Measurements done by logging machine cranes could be used as caliper measurements. With the crane, stem diameter is measured and stored at 10 cm intervals, which enables estimation of the optimal cutting and stem curve. Measurement of the remaining trees can be done using MLS techniques (See section 2.1) or using more cost-effective 2.5D-scanners. Currently, there are logging machine-based tree-mapping algorithms using 2.5 scanners and SLAM algorithms [22,23] that are capable of detecting 100% of the remaining trees in mature Scots pine stands [16]. Thus, it is expected that operational applications will become more common during the next decade.

4. Added Values for Wood Procurement from Detailed Information

In forestry-related research, one of the key aims is to search for new value-chains based on new, accurate information sources that comprise forest data. For example, detailed precision forestry can improve the efficiency of wood production by providing stem diameter distributions and pre-knowledge of the timber quality. Improved temporal resolution of alternative 3D technologies enables forest attribute updates and monitoring of forest damage. The management and planning of wood procurement can take advantage of detailed forest resource information as well.

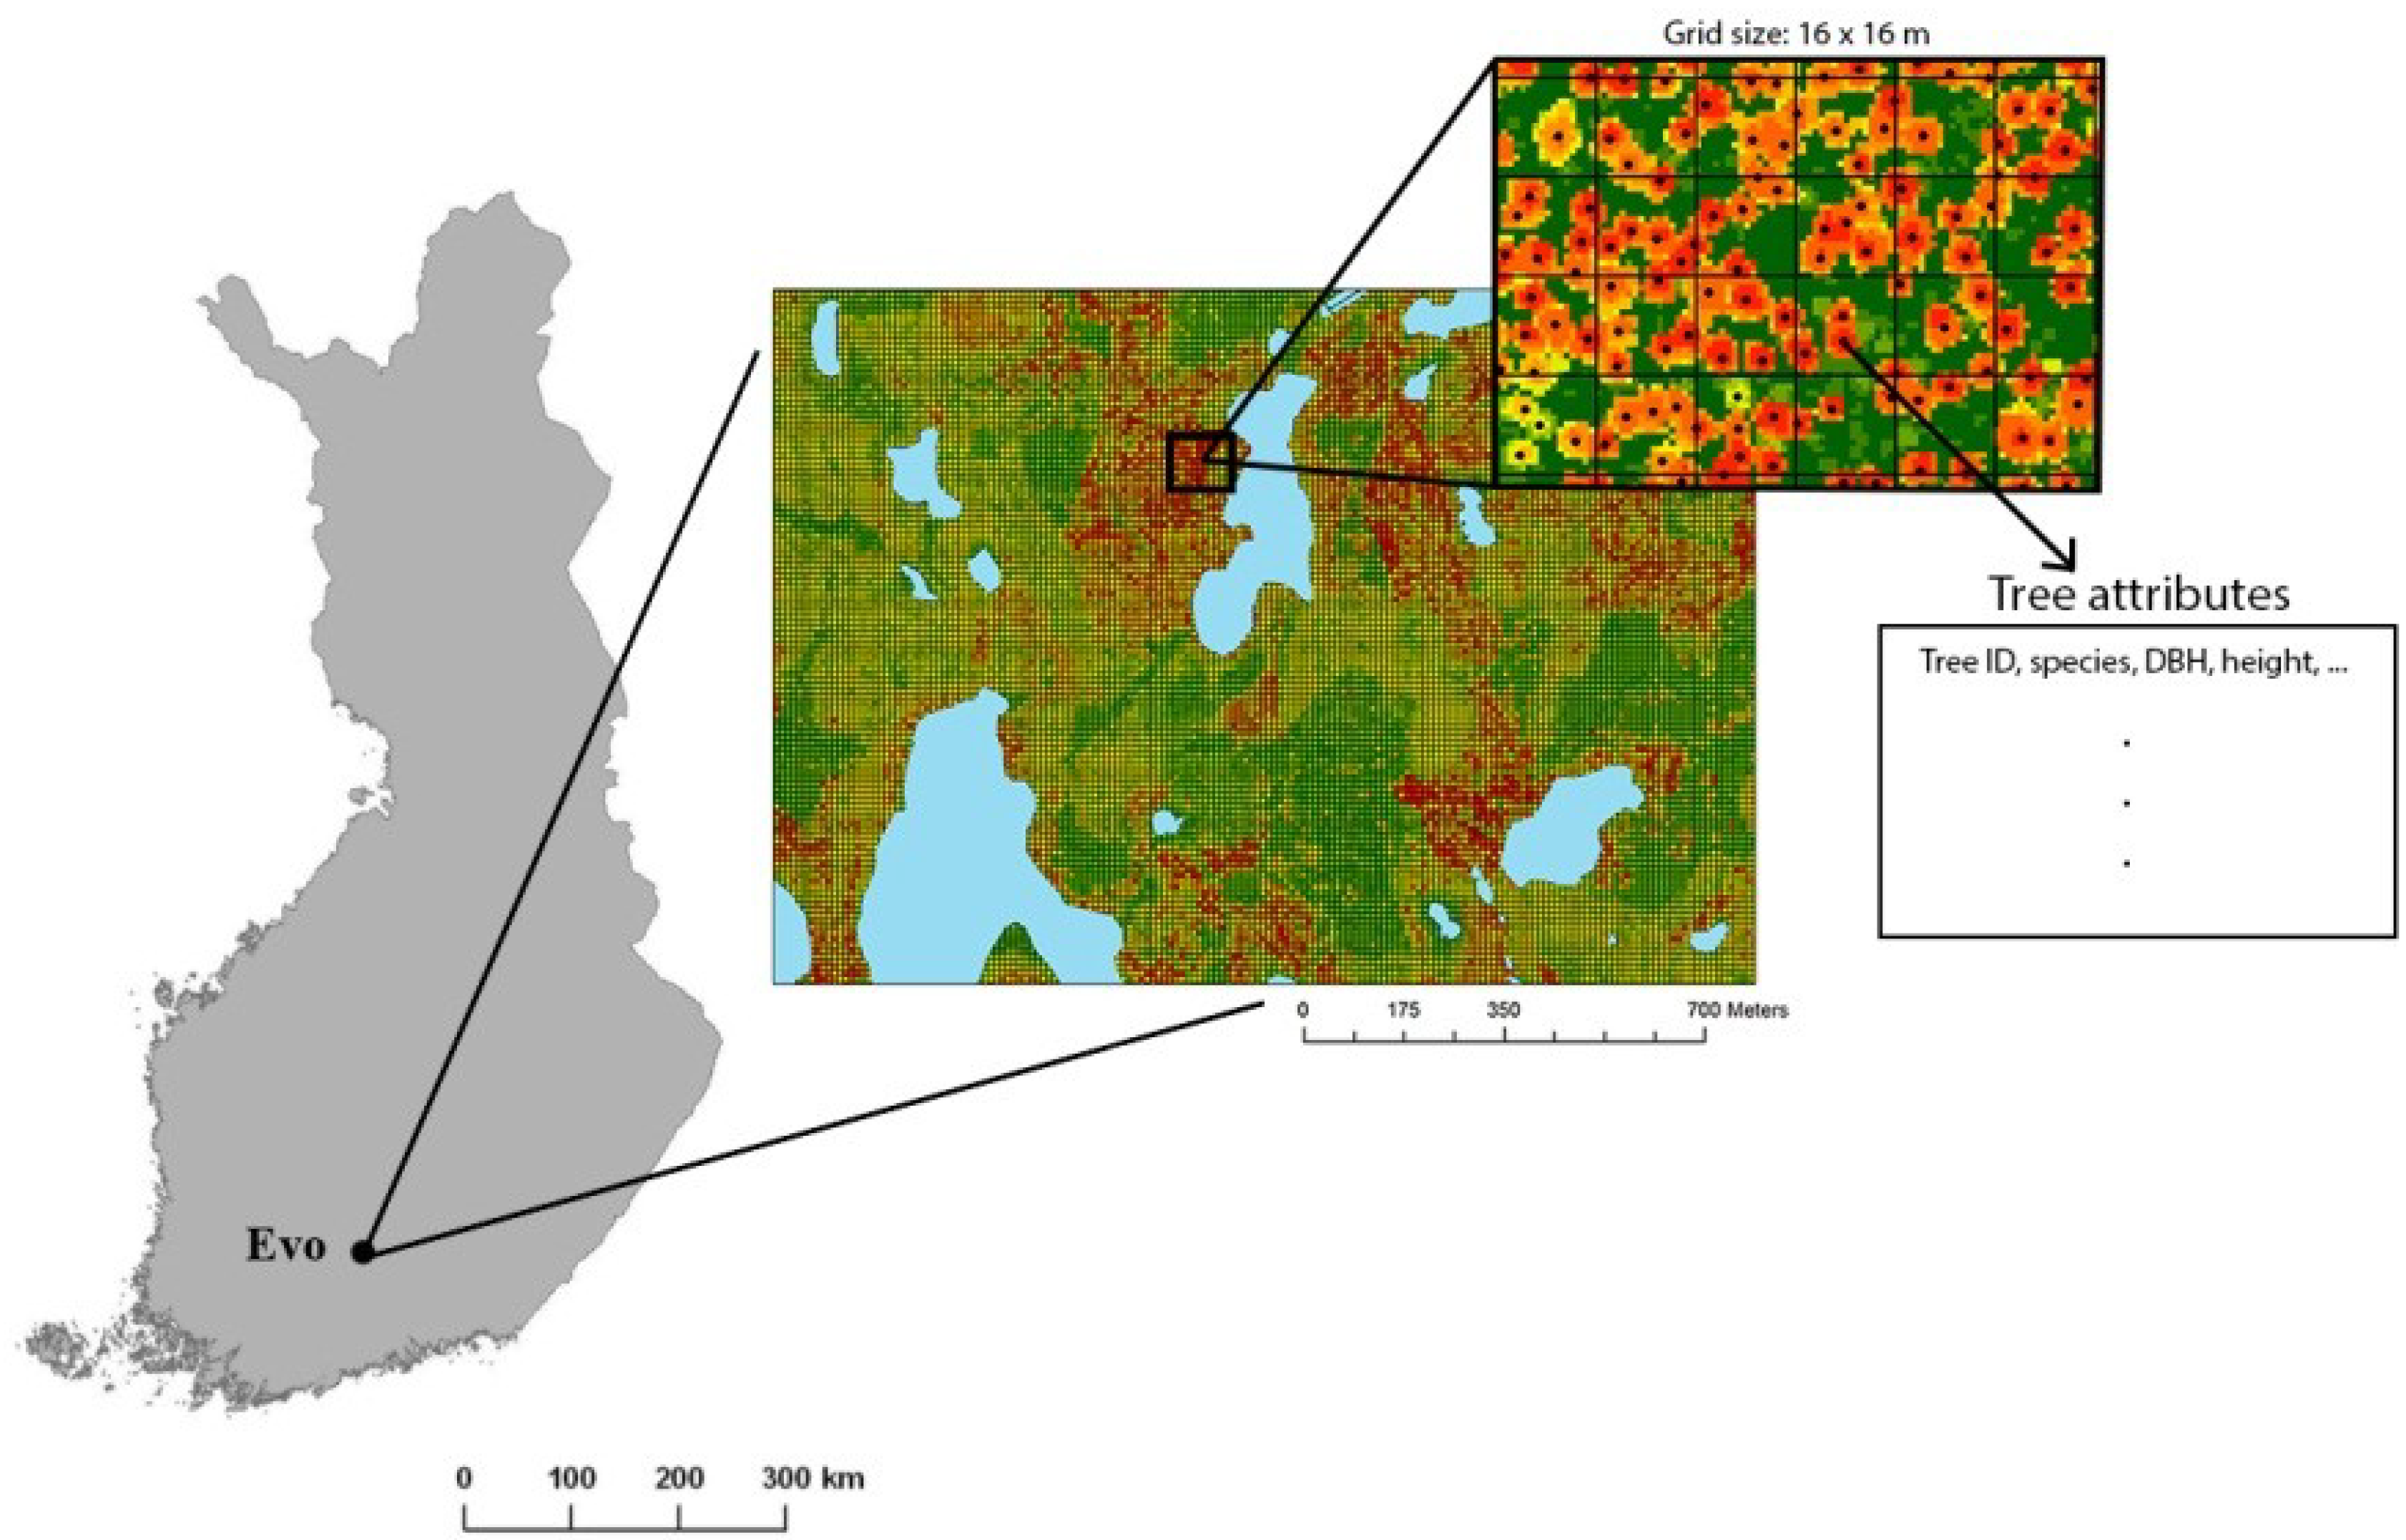
4.1. Forest Resource Information at the Grid Level

Forest attribute maps with spatial resolution of 10–20 m can be produced by current ABA inventory techniques [1,2,3,4,5,6,14,17]. In thinning stands, mapping and timing of forest management operations are highly important from a silvicultural point of view [24]. Forest management operations, such as pre-commercial thinnings, commercial thinnings and renewal cuttings, can be mapped and timed based on field visits or growth models based on inventory data. However, growth models are a major source of uncertainty in these kinds of forest management planning calculations [5]. In thinning stands, the most important decision is the determination of the timing of the next forest management operation. Pre-commercial and first thinnings are the most important silvicultural actions, because those significantly affect the future stand development. We believe that the use of stand height-density information obtained from ALS will provide information that can be used to generate timing of the next forest management operations in the thinning stands. Tree-level information is not crucial in the determination of timing for thinnings, although tree clustering cannot be mapped with ABA. Precision forestry also relies on good forest management practices. For example, in thinning stands trees should not be clustered if pre-commercial thinnings have been done on time. Thus, thinnings can be determined based on forest attribute estimates such as basal area and dominant height in addition to the ALS-derived canopy height and cover metrics. However, to date there exist only a few studies in which thinning maturity predictions have been studied with ALS data [24]. With existing information sources there is still a lot possibilities to improve the current operational practices.
ABA requires ground plots, and in seedling stands ground plots are laborious to measure. Thus, in the future, aerial images and laser scanning data acquired by UAV can be used to acquire ground plot information from seedling stands. The added modeling data from seedling stands will improve the accuracy of the ABA estimates. The required tree species and age information should be recorded during regeneration and used as auxiliary information.

4.2. Tree Maps with Attribute Information

Tree maps will be derived for mature stands in our precision forestry vision (Figure 1). Spatially accurate tree maps are also a major step toward a virtual 3D forest. Tree maps are beneficial for planning forest management operations and as input information for the next generation’s growth models. In addition, a tree map is a highly beneficial input when stem distributions and tree quality variables are updated using ALS or digital stereo imagery (See 3.2). We believe that MLS-based tree mapping is capable of providing accurate tree maps (<1 m mean error of XY-coordinates) for mature stands. In addition, MLS-based tree species recognition could be developed to link tree species information to the tree map. In a conceptual precision forestry framework, it would be beneficial to have a tree map after the last thinning but before the final cutting. Thus, the scanner could be mounted to a harvester and the tree map produced during the harvesting.
Tree attributes of the remaining trees will be measured by MLS. MLS or TLS have already proven to be capable of measuring various structural tree parameters, such as DBH, height, stem curve, and tree species [25]. These terrestrially-acquired point clouds can be used in defining values of the stem by stem curve measurements [26]. With these technologies, even the branches can be measured [27]. We also assume that external stem quality variables could be linked to the internal wood quality and used to guide bucking of the stems.

4.3. Harvesting Planning

Wood procurement and harvesting planning would also benefit from pre-knowledge of the terrain conditions, such as ruggedness and bearing capacity at the harvesting site. Harvesting, especially in forests located in peatlands, require knowledge about the ground-bearing capacity. Usually peatlands are harvested during the winter, but recent mild winters have forced harvesting to be carried out during the unfrozen seasons as well. ALS-based DTMs provide detailed information regarding the topography. Local low- and high-level areas can be mapped and used in planning for logging tracks. In addition, ALS-derived canopy height models (CHM) include information about basal-area and biomass that correlate with the ground-bearing capacity [28]. Thus, a combination of DTM and CHM information can be used in producing bearing capacity maps that can improve harvesting planning in conjunction with tree maps provided by harvester-mounted MLS. Local weather station and soil maps can provide additional information that is important for bearing capacity predictions in the future.

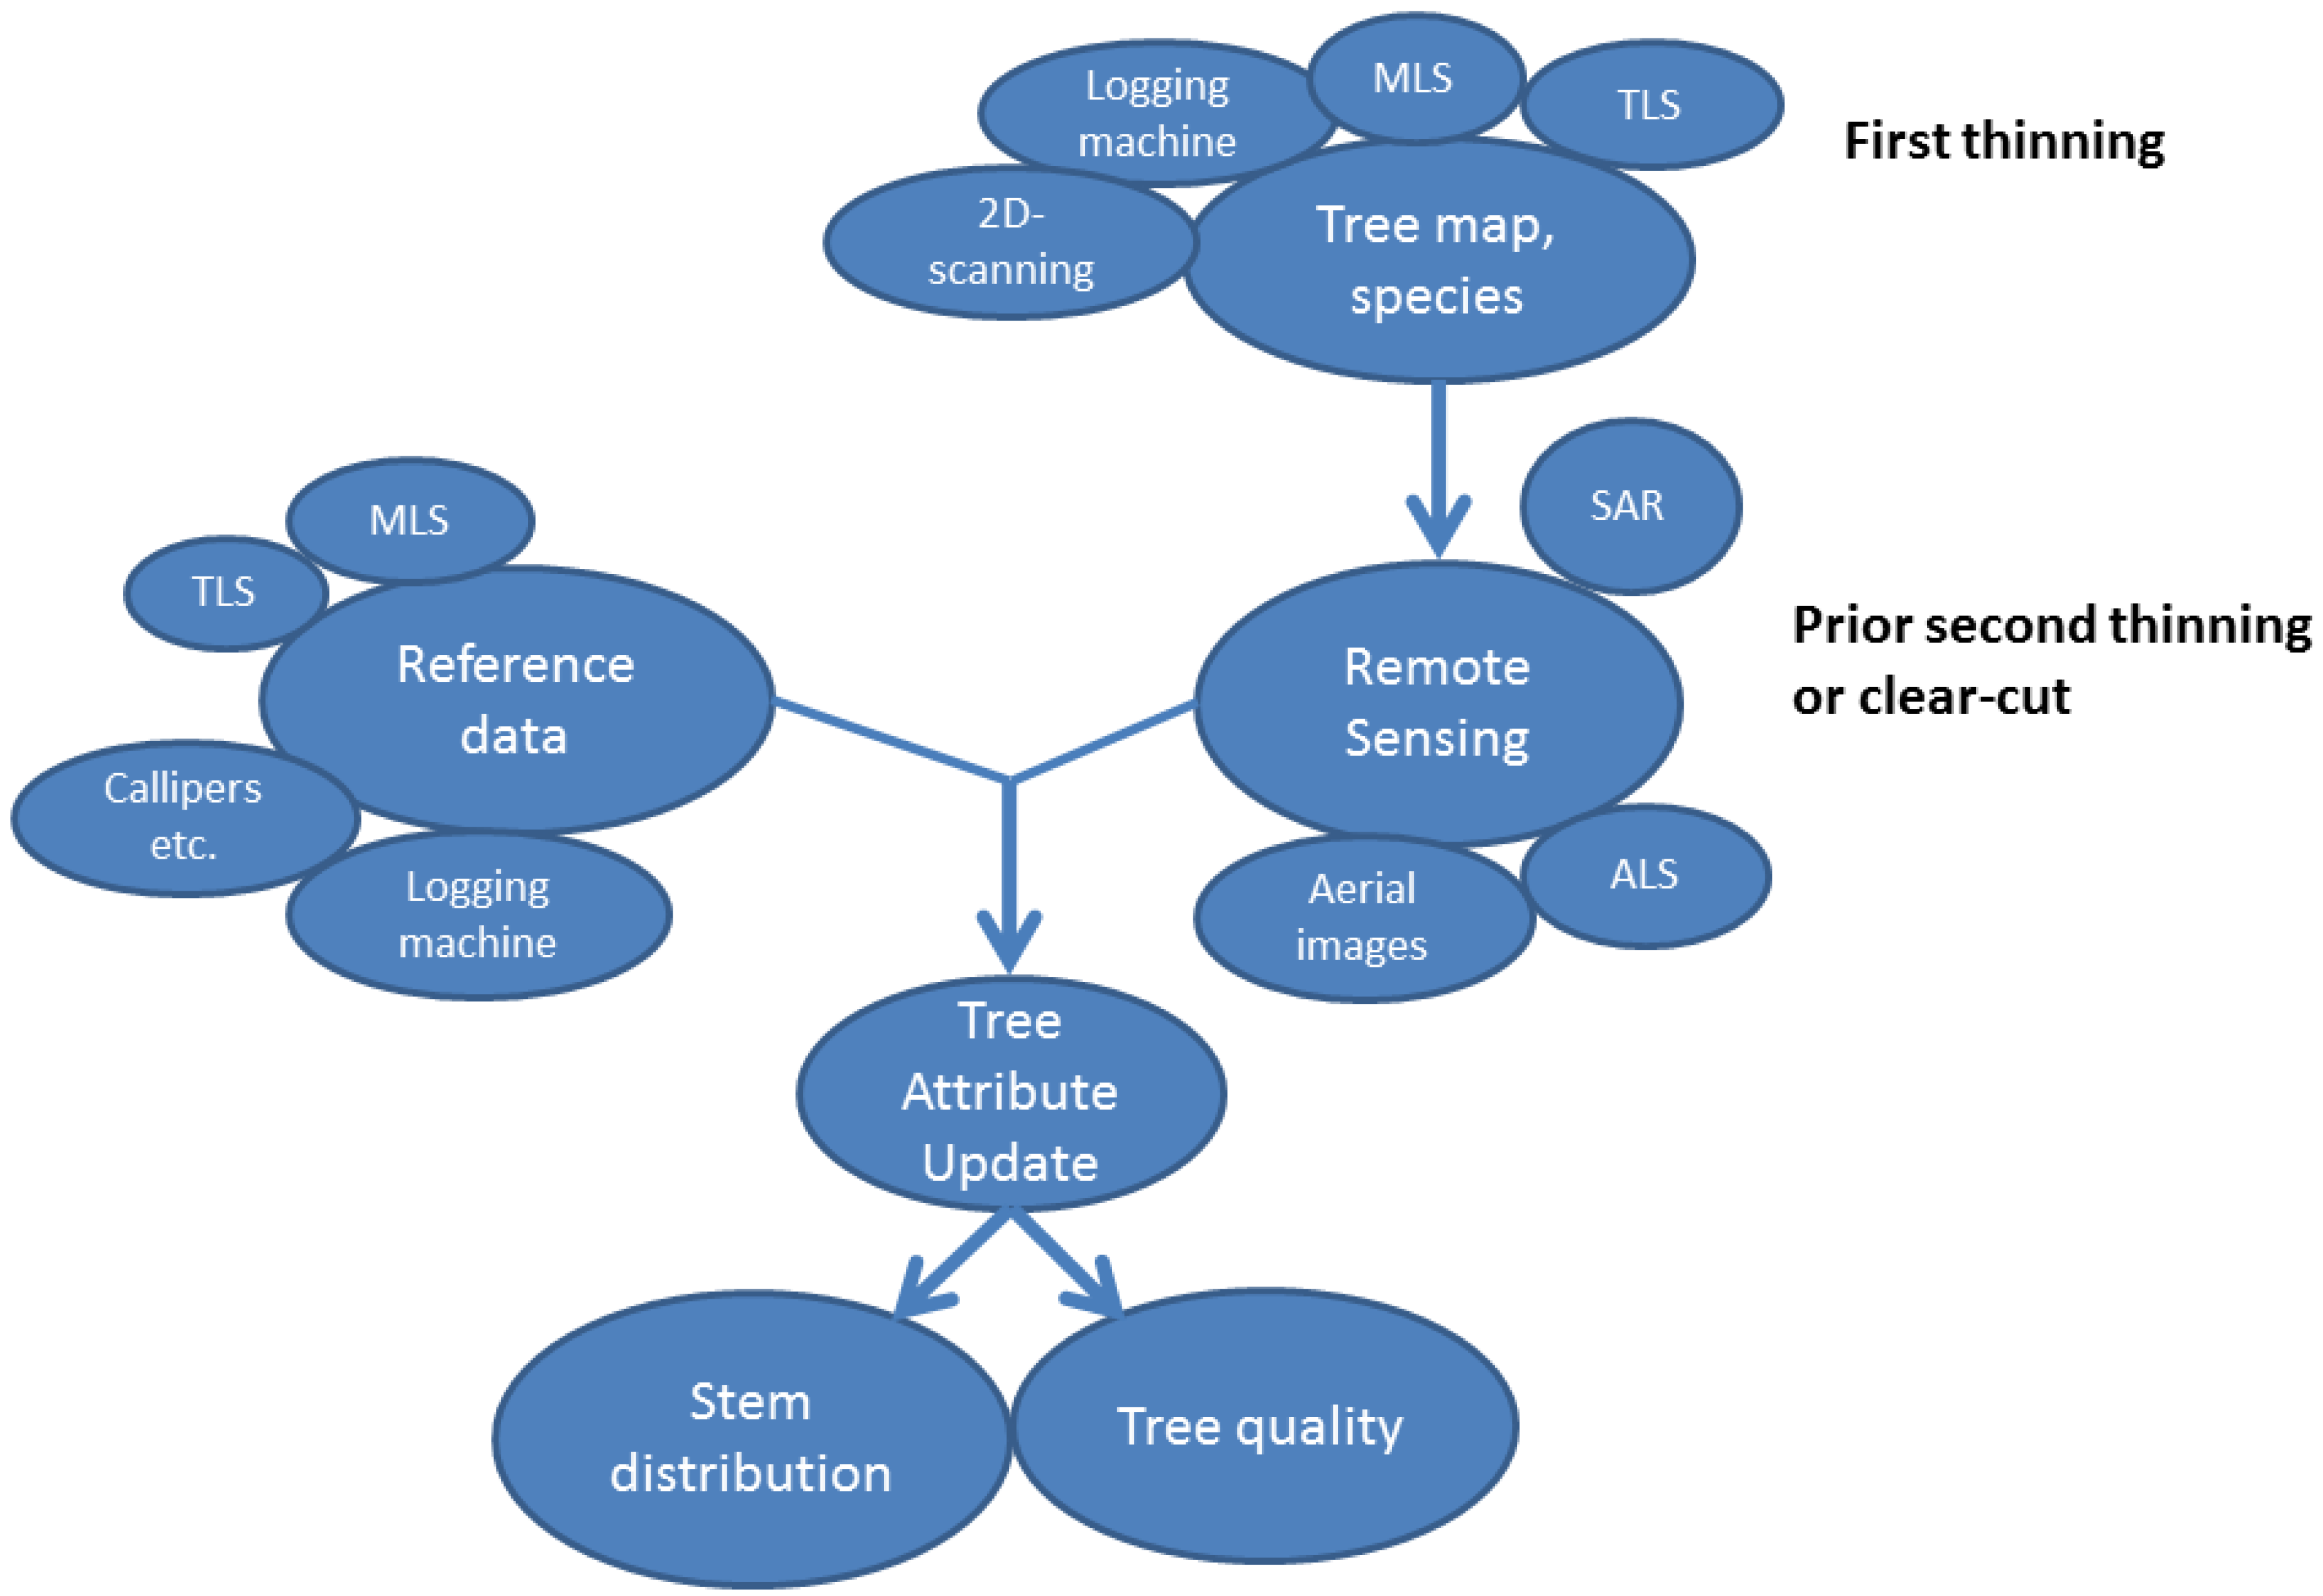
4.4. Information Update

4.4.1. Updating Forest Resource Information at the Grid Level

In precision forestry, the goal is for the decision maker to always have up-to-date information from the forest that enables him/her to optimize forest management. ALS data sets, aerial imagery and satellite 3D data will be available on a regular basis. After the first ALS data acquisition, detailed DTM will enable various other 3D remote-sensing techniques such as photogrammetry, radargrammetry and interferometry. Grid-level forest resource information will be updated using the newest remote-sensing data available. The update information source will be recorded. Current state-of-the-art growth models are used if required. Although in boreal forest conditions, growth of 2–3 years is rather marginal. We believe that when the same sensors are used as for the second observational epoch (T2), the ground plots and the developed models from T1 then also can be applied to T2.

4.4.2. Updating Tree Maps with Attribute Information

With tree maps, individual tree inventory techniques can be applied from a new starting point, because the two major bottlenecks in current ALS-based single-tree level inventory, tree detection and tree-species recognition, can be avoided. With existing tree map and tree-species information, airborne 3D data are used in extraction of predictors for tree quality variable update. In our investigations, multisource single tree inventory (MS-STI, Figure 3) has provided accuracies that have been unobtainable by ABA or traditional ALS-based single-tree inventories [11,12]. Ground truth for MS-STI can be obtained by MLS measurements from harvester and harvester crane measurements.
Height growth of the trees (T2-T1) can be determined from the ALS data [29]. Forest growth relates strongly to the site type, forest value (both economic and ecological) and optimal final cutting time, as decreased growth reveals the need for renewal of the growing stock. With MS-STI, growth of the forest economic value can be calculated and used in the determination of final cutting. Pre-harvest measurements can be carried out using MS-STI. In other words, tree attributes are updated prior to the final cutting based on tree map and newest possible 3D data or tree-level spatial growth models. In pre-harvest measurements, MS-STI can provide information regarding the species-specific stem distribution and wood quality, which is important for sawmills.
Figure 3. Multisource single tree inventory.
Forests 05 01682 g003

5. Conclusions

In this communication, we reflected on our recent findings and future visions for precision forestry research. In precision forestry, characteristics of forests and treatments can be determined accurately at stand, sub-stand or individual tree level. Our vision is that the base product for the next generation’s precision forestry will consist of up-to-date forest attribute maps (spatial resolutions of 10–20 m) produced using data acquired from air- and space-borne sensors. Tree level information can be obtained from the most valuable stands using multisource information acquired from ground-based sensors, such as logging machine-mounted laser scanners and airborne data. Presented data acquisition methodologies combined with know-how of the forest companies and governmental organizations will provide a good starting point for developing the next generation of precision forestry in which precise forest resource information will be a base for profitable forestry.

Acknowledgments

The Academy of Finland is acknowledged for its financial support in the form of the project “Science and Technology Towards Precision Forestry” and Centre of Excellence in Laser Scanning Research (CoE-LaSR). The authors wish to use this opportunity to express their appreciation to partners in Data to Intelligence (D2I) Digile/Tekes Program.

Author Contributions

All authors contributed to the scientific brainstorming, planning and writing process of the article.

Conflicts of Interest

The authors declare no conflict of interest.

References and Notes

  1. Næsset, E. Predicting Forest Stand Characteristics with Airborne Scanning Laser Using a Practical Two-Stage Procedure and Field Data. Remote Sens. Environ. 2002, 80, 88–99. [Google Scholar] [CrossRef]
  2. White, J.C.; Wulder, M.A.; Varhola, A.; Vastaranta, M.; Coops, N.C.; Cook, B.D.; Pitt, D.; Woods, M. A Best Practices Guide for Generating Forest Inventory Attributes from Airborne Laser Scanning Data Using an Area-Based Approach. For. Chron. 2013, 89, 722–723. [Google Scholar] [CrossRef]
  3. Vastaranta, M. Forest Mapping and Monitoring Using Active 3D Remote Sensing. Diss. For. 2012, 144, 45. [Google Scholar]
  4. Wulder, M.; Coops, N.; Hudak, A.; Morsdorf, F.; Nelson, R.; Newnham, G.; Vastaranta, M. Status and Prospects for LiDAR Remote Sensing of Forested Ecosystems. Can. J. Remote Sens. 2013, 39, S1–S5. [Google Scholar] [CrossRef]
  5. Holopainen, M.; Vastaranta, M.; Rasinmäki, J.; Kalliovirta, J.; Mäkinen, A.; Haapanen, R.; Melkas, T.; Yu, X.; Hyyppä, J. Uncertainty in Timber Assortment Estimates Predicted from Forest Inventory Data. Eur. J. For. Res. 2010, 129, 1131–1142. [Google Scholar] [CrossRef]
  6. Næsset, E.; Gobakken, T.; Holmgren, J.; Hyyppä, H.; Hyyppä, J.; Maltamo, M.; Nilsson, M.; Olsson, H.; Persson, Å.; Söderman, U. Laser Scanning of Forest Resources: The Nordic Experience. Scand. J. For. Res. 2004, 19, 482–499. [Google Scholar] [CrossRef]
  7. Wulder, M.A.; White, J.C.; Nelson, R.F.; Næsset, E.; Ørka, H.O.; Coops, N.C.; Hilker, T.; Bater, C.W.; Gobakken, T. LiDAR Sampling for Large-Area Forest Characterization: A Review. Remote Sens. Environ. 2012, 121, 196–209. [Google Scholar] [CrossRef]
  8. Holmgren, J.; Barth, A.; Larsson, H.; Olsson, H. Prediction of Stem Attributes by Combining Airborne Laser Scanning and Measurements from Harvesters. Silva Fenn. 2012, 46, 227–239. [Google Scholar]
  9. Vauhkonen, J.; Ene, L.; Gupta, S.; Heinzel, J.; Holmgren, J.; Pitkänen, J.; Solberg, S.; Wang, Y.; Weinacker, H.; Hauglin, K.M. Comparative Testing of Single-Tree Detection Algorithms under Different Types of Forest. Forestry 2012, 85, 27–40. [Google Scholar] [CrossRef]
  10. Vauhkonen, J.; Packalen, P.; Malinen, J.; Pitkänen, J.; Maltamo, M. Airborne Laser Scanning Based Decision Support for Wood Procurement Planning. Scand. J. For. Res. 2013, 28. [Google Scholar] [CrossRef]
  11. Saarinen, N.; Vastaranta, M.; Kankare, V.; Tanhuanpää, T.; Holopainen, M.; Hyyppä, J.; Hyyppä, H. Urban-Tree-Attribute Update Using Multisource Single-Tree Inventory. Forests 2014, 5, 1032–1052. [Google Scholar] [CrossRef]
  12. Vastaranta, M.; Saarinen, N.; Kankare, V.; Holopainen, M.; Kaartinen, H.; Hyyppä, J.; Hyyppä, H. Multisource Single-Tree Inventory in the Prediction of Tree Quality Variables and Logging Recoveries. Remote Sens. 2014, 6, 3475–3491. [Google Scholar] [CrossRef]
  13. Hyyppä, J.; Inkinen, M. Detecting and Estimating Attributes for Single Trees Using Laser Scanner. Photogramm. J. Finl. 1999, 16, 27–42. [Google Scholar]
  14. Hyyppä, J.; Yu, X.; Hyyppä, H.; Vastaranta, M.; Holopainen, M.; Kukko, A.; Kaartinen, H.; Jaakkola, A.; Vaaja, M.; Koskinen, J. Advances in Forest Inventory Using Airborne Laser Scanning. Remote Sens. 2012, 4, 1190–1207. [Google Scholar] [CrossRef]
  15. Kaartinen, H.; Hyyppa, J.; Yu, X.W.; Vastaranta, M.; Hyyppa, H.; Kukko, A.; Holopainen, M.; Heipke, C.; Hirschmugl, M.; Morsdorf, F.; Naesset, E.; Pitkanen, J.; Popescu, S.; Solberg, S.; Wolf, B.M.; Wu, J.C. An International Comparison of Individual Tree Detection and Extraction Using Airborne Laser Scanning. Remote Sens. 2012, 4, 950–974. [Google Scholar] [CrossRef] [Green Version]
  16. Melkas, T.; Miettinen, M.; Hämäläinen, J.; Einola, K. Puukarttajärjestelmä hakkuun tehostamisessa. Available online: http://www.metsateho.fi/files/metsateho/Tuloskalvosarja/Tuloskalvosarja_2014_01_Puukarttajarjestelma_hakkuun_tehostamisessa_tm_ym.pdf (accesed on 2 April 2014).
  17. Vastaranta, M.; Wulder, M.A.; White, J.C.; Pekkarinen, A.; Tuominen, S.; Ginzler, C.; Kankare, V.; Holopainen, M.; Hyyppä, J.; Hyyppä, H. Airborne Laser Scanning and Digital Stereo Imagery Measures of Forest Structure: Comparative Results and Implications to Forest Mapping and Inventory Update. Can. J. Remote Sens. 2013, 39, 382–395. [Google Scholar]
  18. White, J.; Wulder, M.; Vastaranta, M.; Coops, N.; Pitt, D.; Woods, M. The Utility of Image-Based Point Clouds for Forest Inventory: A Comparison with Airborne Laser Scanning. Forests 2013, 4, 518–536. [Google Scholar] [CrossRef]
  19. Karjalainen, M.; Kankare, V.; Vastaranta, M.; Holopainen, M.; Hyyppa, J. Prediction of Plot-Level Forest Variables Using TerraSAR-X Stereo SAR Data. Remote Sens. Environ. 2012, 117, 338–347. [Google Scholar] [CrossRef]
  20. Perko, R.; Raggam, H.; Deutscher, J.; Gutjahr, K.; Schardt, M. Forest Assessment Using High Resolution SAR Data in X-Band. Remote Sens. 2011, 3, 792–815. [Google Scholar] [CrossRef]
  21. Rasinmäki, J.; Melkas, T. A Method for Estimating Tree Composition and Volume Using Harvester Data. Scand. J. For. Res. 2005, 20, 85–95. [Google Scholar] [CrossRef]
  22. Miettinen, M.; Ohman, M.; Visala, A.; Forsman, P. Simultaneous Localization and Mapping for Forest Harvesters. In Proceedings of the IEEE International Conference, Robotics and Automation, Roma, Italy, 10–14 April 2007; pp. 517–522.
  23. Öhman, M.; Miettinen, M.; Kannas, K.; Jutila, J.; Visala, A.; Forsman, P. Tree Measurement and Simultaneous Localization and Mapping System for Forest Harvesters. In Field Service Robotics; Springer-Verlag Berlin Heidelberg: Berlin, Germany, 2008; pp. 369–378. [Google Scholar]
  24. Vastaranta, M.; Holopainen, M.; Yu, X.; Hyyppä, J.; Hyyppä, H.; Viitala, R. Predicting Stand-Thinning Maturity from Airborne Laser Scanning Data. Scand. J. For. Res. 2011, 26, 187–196. [Google Scholar] [CrossRef]
  25. Liang, X.L.; Litkey, P.; Hyyppa, J.; Kaartinen, H.; Vastaranta, M.; Holopainen, M. Automatic Stem Mapping Using Single-Scan Terrestrial Laser Scanning. IEEE Trans. Geosci. Remote Sens. 2012, 50, 661–670. [Google Scholar] [CrossRef]
  26. Xinlian, L.; Kankare, V.; Xiaowei, Y.; Hyyppa, J.; Holopainen, M. Automated Stem Curve Measurement Using Terrestrial Laser Scanning. IEEE Trans. Geosci. Remote Sens. 2014, 52, 1739–1748. [Google Scholar] [CrossRef]
  27. Raumonen, P.; Kaasalainen, M.; Åkerblom, M.; Kaasalainen, S.; Kaartinen, H.; Vastaranta, M.; Holopainen, M.; Disney, M.; Lewis, P. Fast Automatic Precision Tree Models from Terrestrial Laser Scanner Data. Remote Sens. 2013, 5, 491–520. [Google Scholar] [CrossRef]
  28. Lindeman, H.; Ala-Ilomäki, J.; Sirén, M.; Vastaranta, M.; Holopainen, M.; Uusitalo, J. Turvemaan Kantavuuden Ennustaminen Laserkeilausaineistoilla; Working Papers of the Finnish Forest Research Institute; Metla: Helsinki, Finland, 2013; p. 31. [Google Scholar]
  29. Yu, X.; Hyyppä, J.; Kaartinen, H.; Maltamo, M. Automatic Detection of Harvested Trees and Determination of Forest Growth Using Airborne Laser Scanning. Remote Sens. Environ. 2004, 90, 451–462. [Google Scholar] [CrossRef]

