
Predicted Changes in Climatic Niche and Climate Refugia of Conservation Priority Salamander Species in the Northeastern United States

Abstract
:1. Introduction
2. Experimental Section
2.1. Priority Species Selection


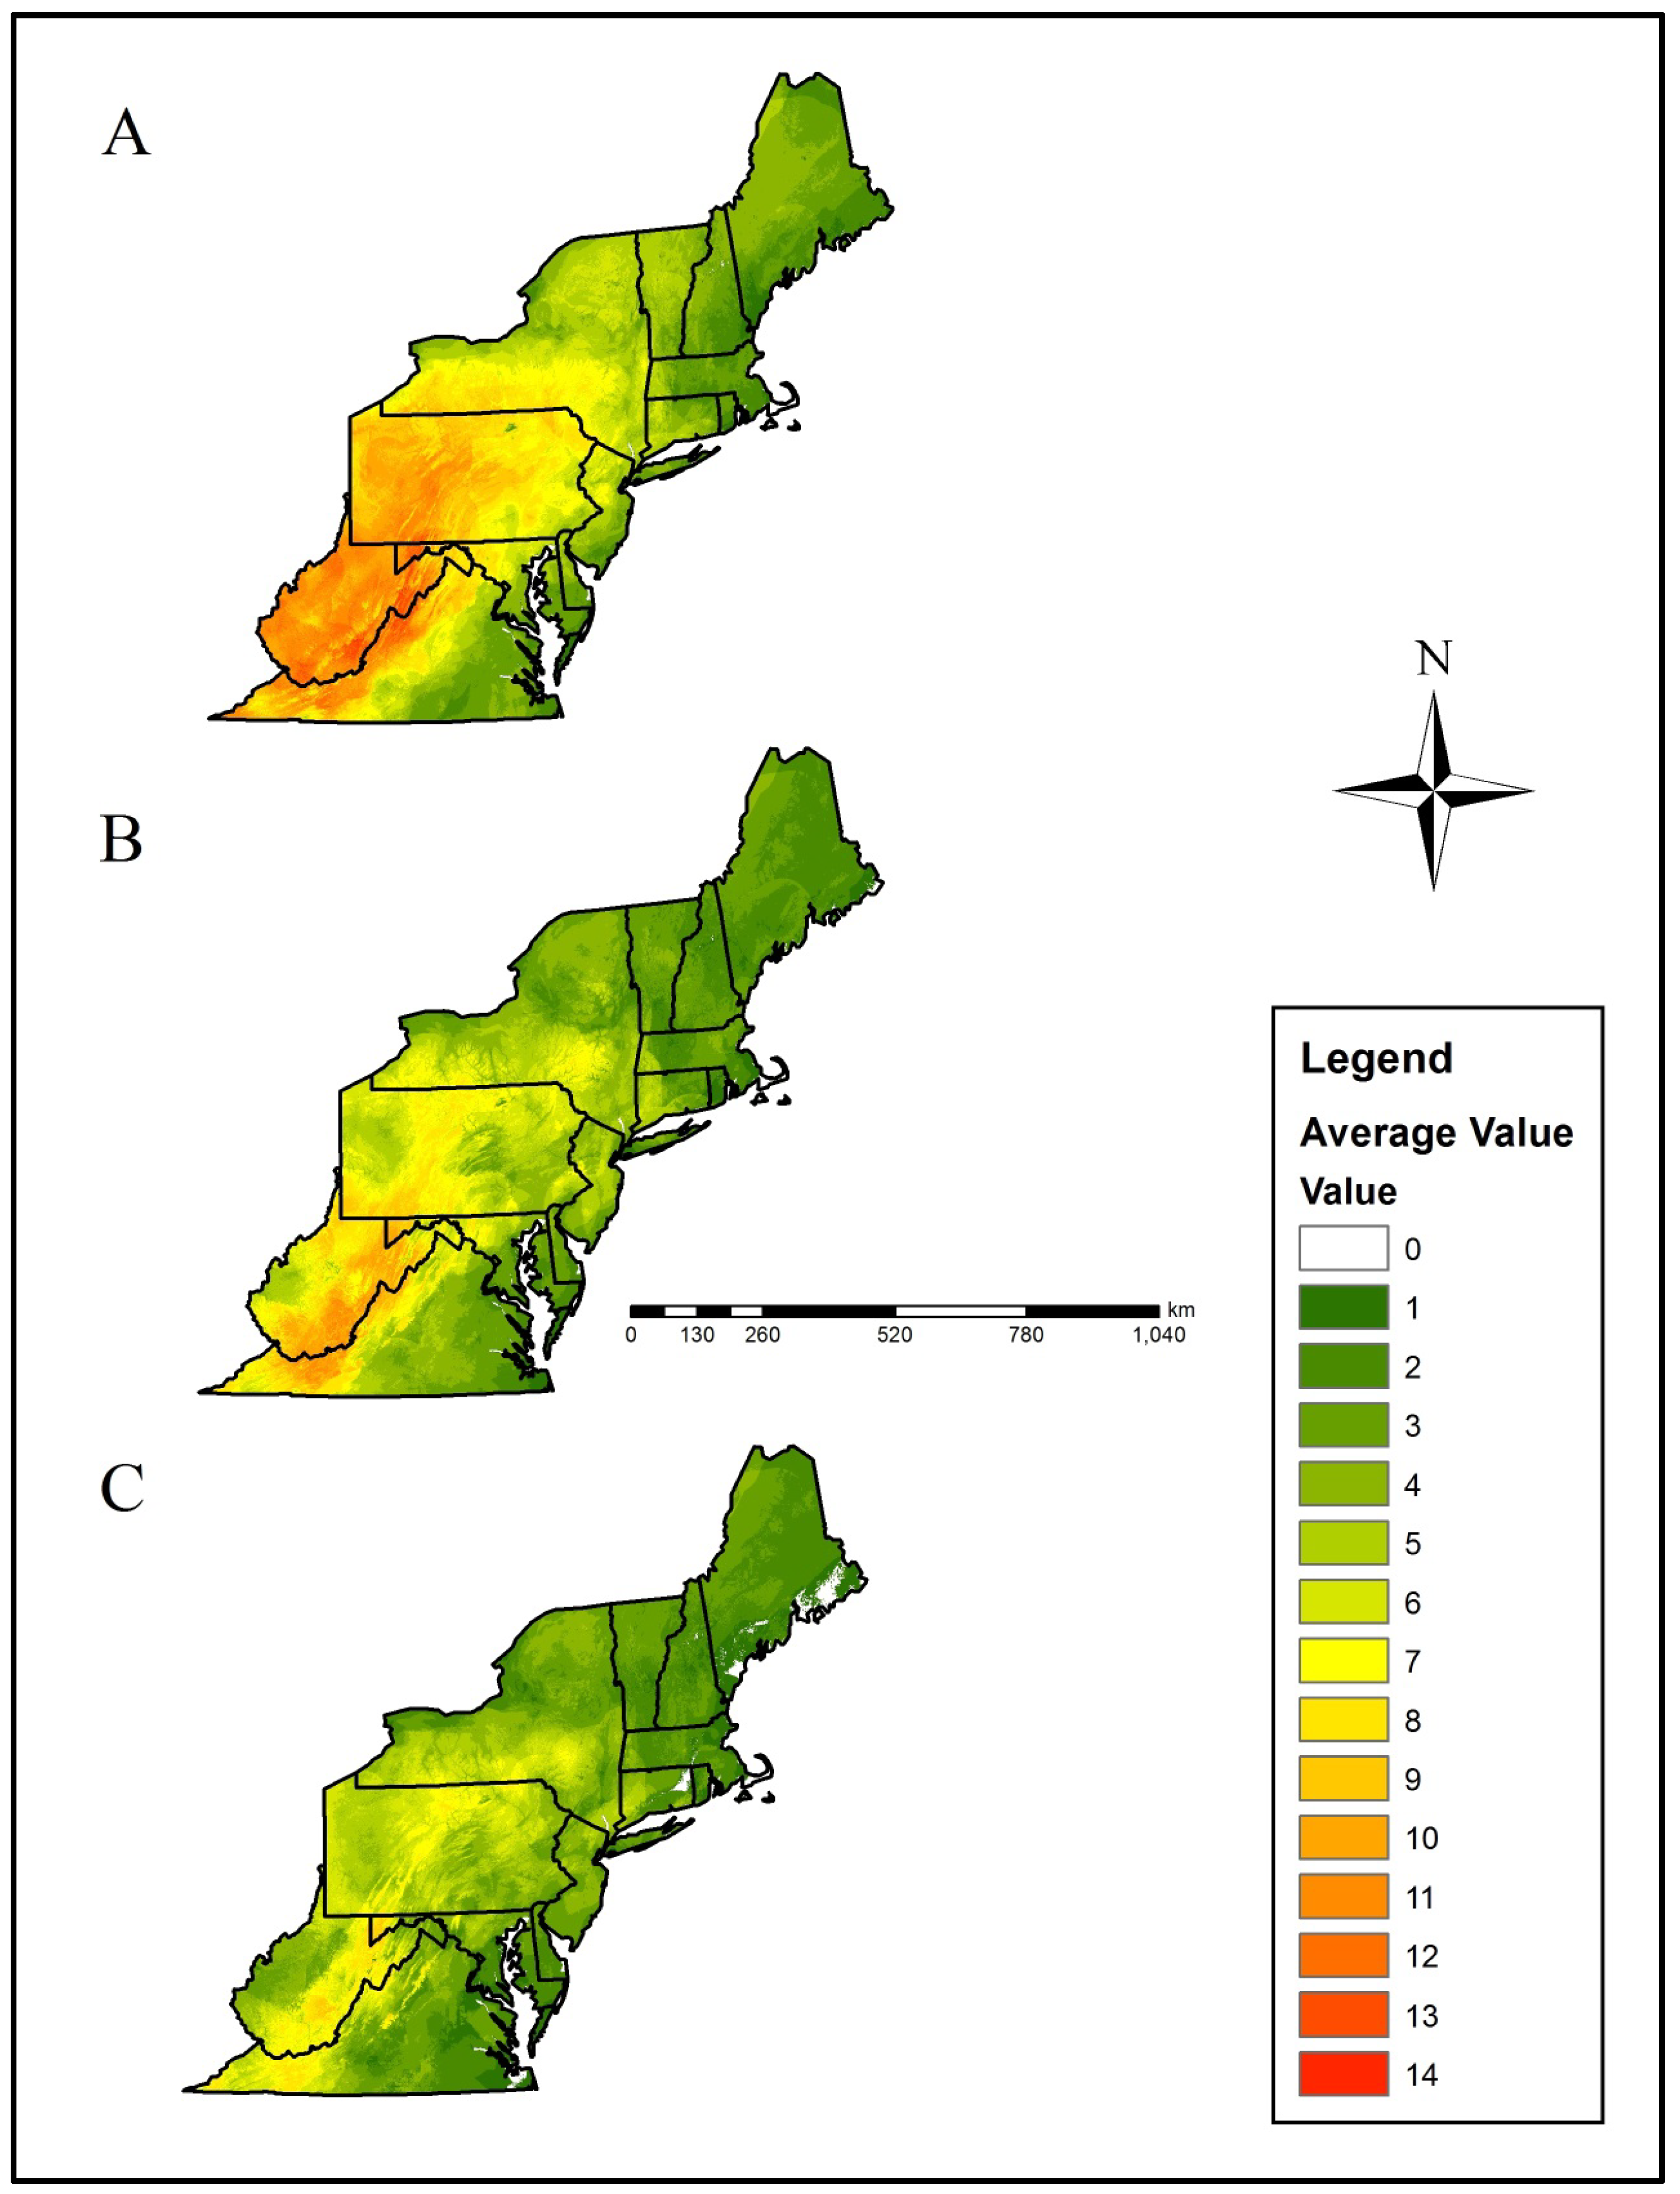
| Level III Ecoregion | Current Average (± SE) | RCP 4.5 Average (± SE) | RCP 8.5 Average (± SE) |
|---|---|---|---|
| Acadian Plains and Hills | 3.01 ± 0.62 | 2.68 ± 0.47 | 2.15 ± 0.47 |
| Atlantic Coastal Pine Barrens | 3.48 ± 1.98 | 3.85 ± 0.93 | 3.20 ± 0.73 |
| Blue Ridge | 8.50 ± 2.37 | 7.72 ± 1.10 | 5.96 ± 1.22 |
| Central Appalachians | 11.00 ± 1.79 | 9.07 ± 1.14 | 6.94 ± 1.45 |
| Eastern Great Lakes Lowlands | 5.23 ± 1.02 | 4.06 ± 0.83 | 3.74 ± 0.79 |
| Erie Drift Plain | 8.92 ± 1.59 | 6.40 ± 1.41 | 5.94 ± 1.33 |
| Middle Atlantic Coastal Plain | 3.28 ± 1.35 | 2.87 ± 0.52 | 2.26 ± 0.47 |
| North Central Appalachians | 8.86 ± 1.41 | 7.04 ± 1.39 | 6.23 ± 1.36 |
| Northeastern Coastal Zone | 3.39 ± 1.40 | 3.37 ± 0.78 | 2.81 ± 0.55 |
| Northeastern Highlands | 4.50 ± 0.60 | 3.66 ± 0.64 | 3.37 ± 0.65 |
| Northern Allegheny Plateau | 7.79 ± 1.23 | 6.36 ± 1.19 | 5.90 ± 1.20 |
| Northern Piedmont | 6.70 ± 1.96 | 5.37 ± 0.96 | 4.16 ± 0.90 |
| Piedmont | 4.82 ± 1.93 | 4.42 ± 0.52 | 3.15 ± 0.57 |
| Ridge and Valley | 9.50 ± 2.08 | 7.34 ± 1.27 | 5.67 ± 1.35 |
| Southeastern Plains | 3.73 ± 1.33 | 3.23 ± 0.39 | 2.28 ± 0.56 |
| Western Allegheny Plateau | 10.59 ± 1.99 | 7.17 ± 1.24 | 5.15 ± 1.26 |
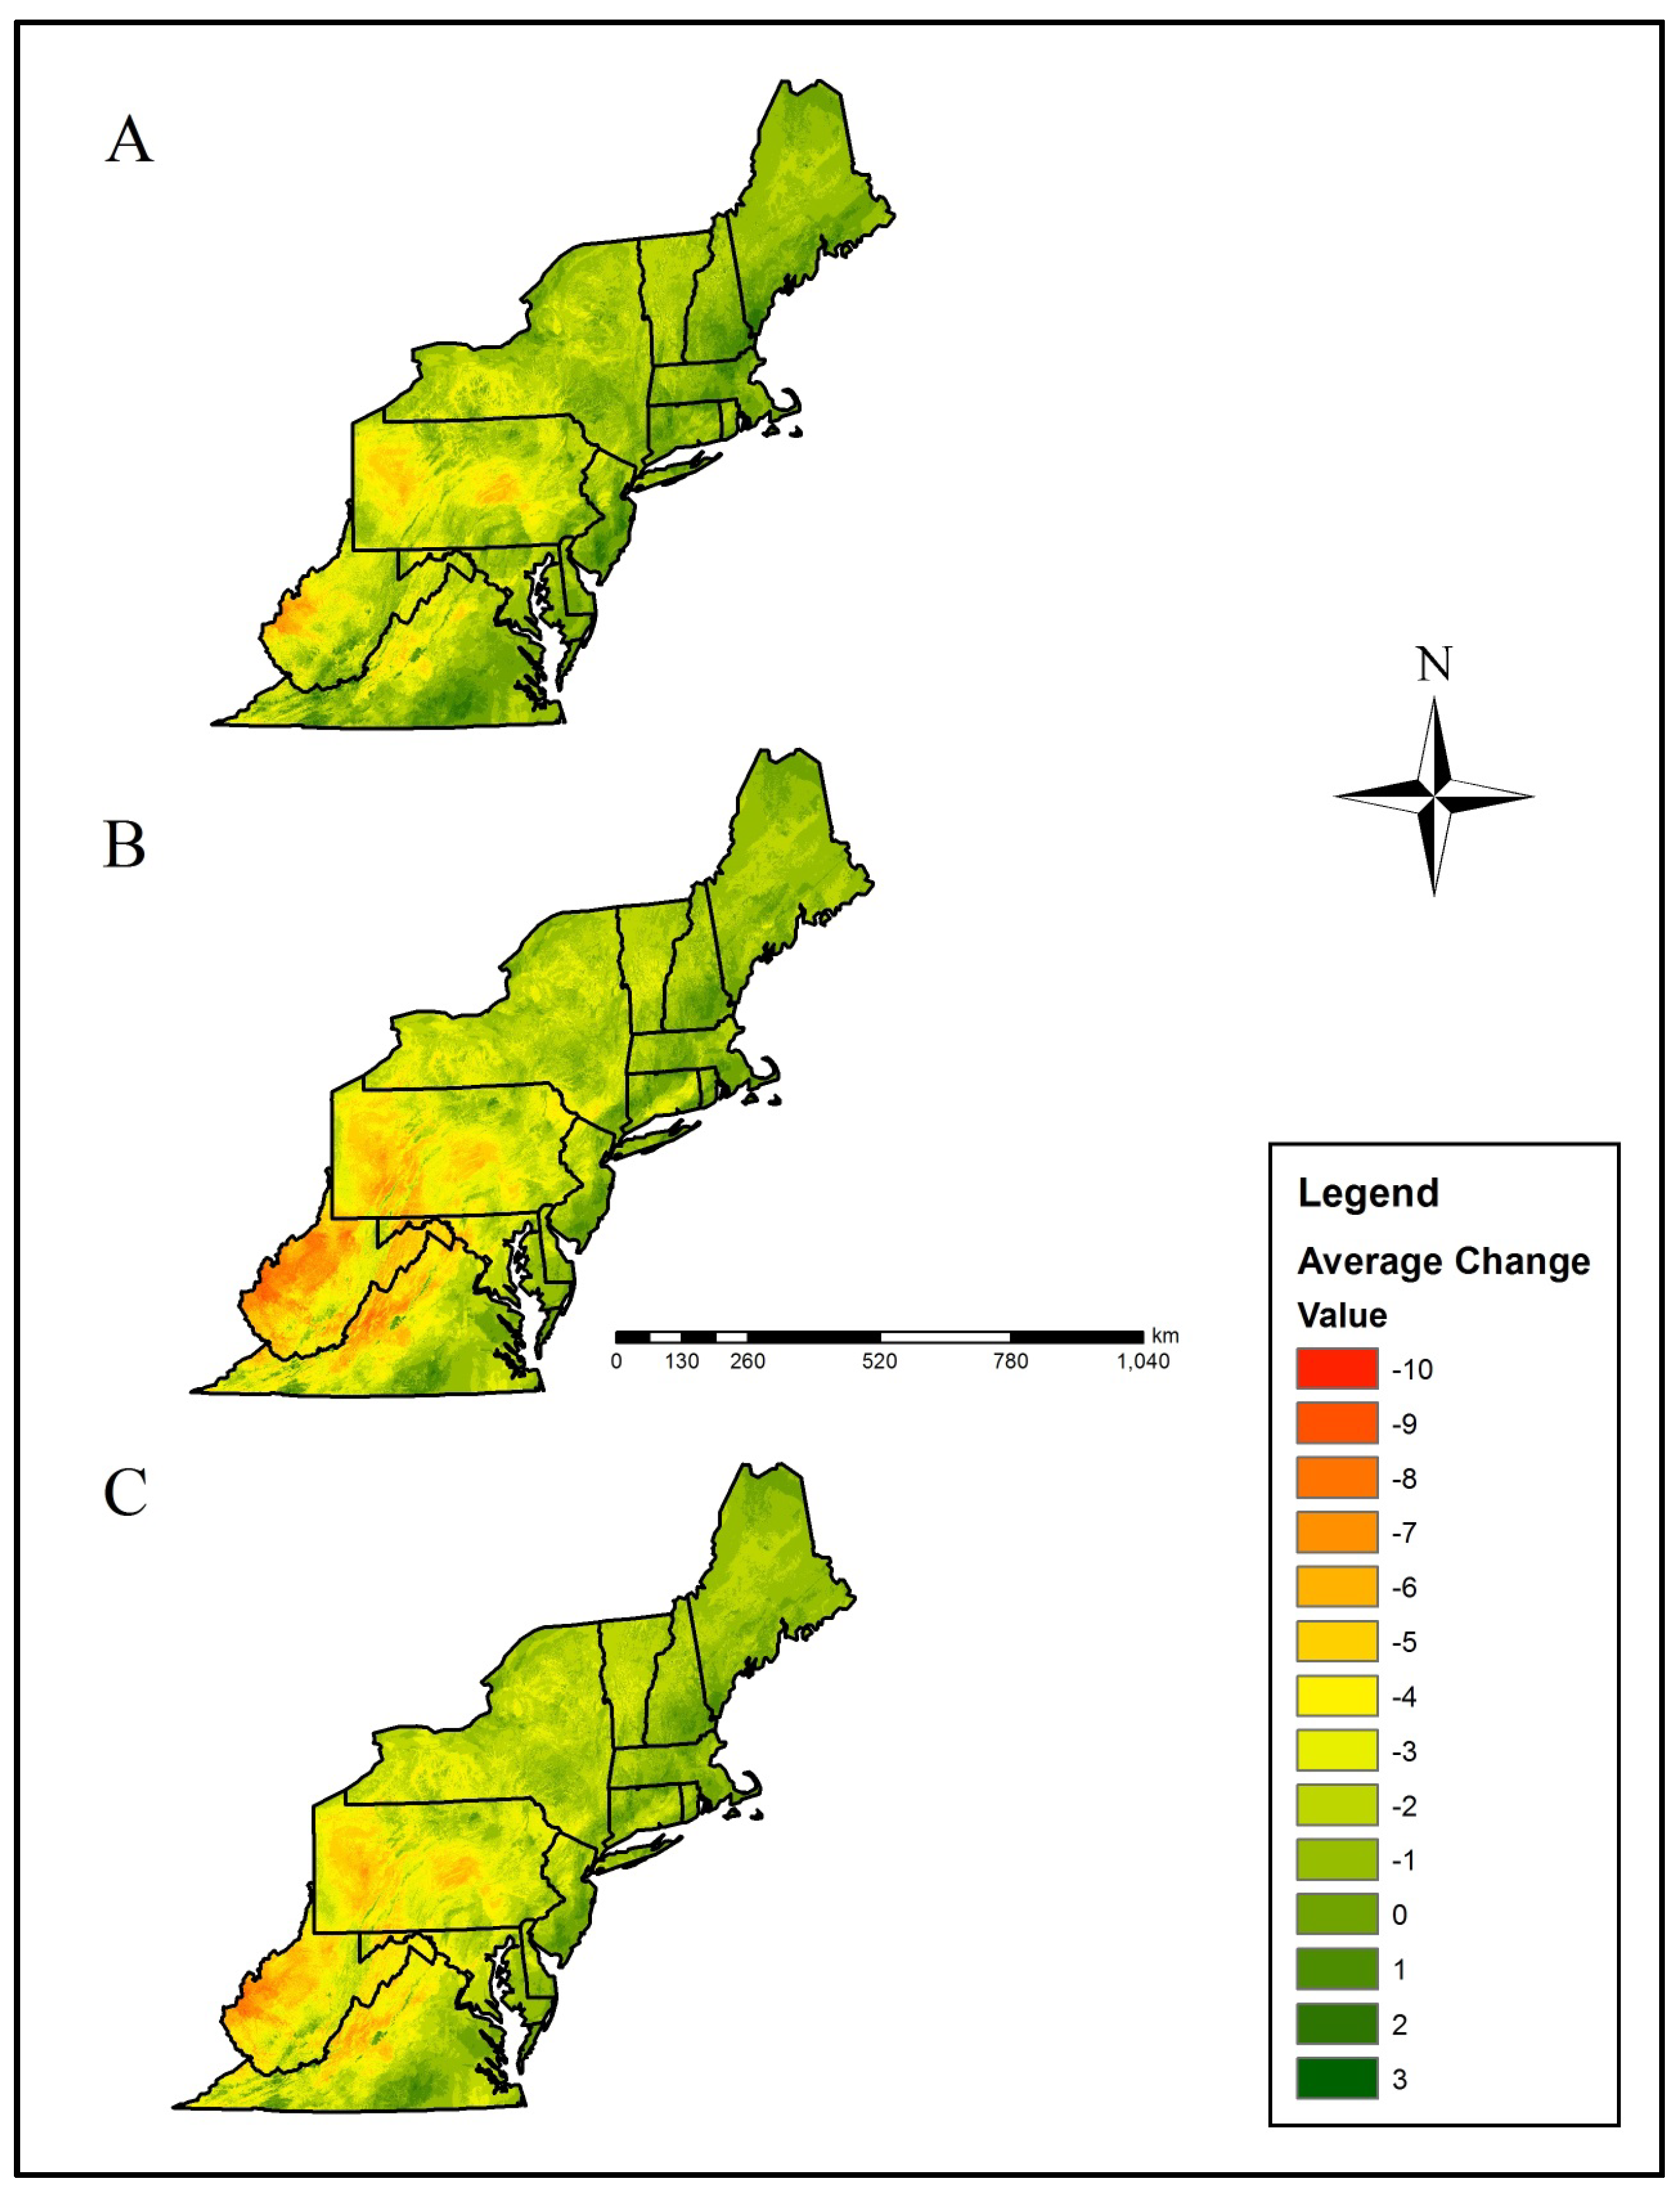
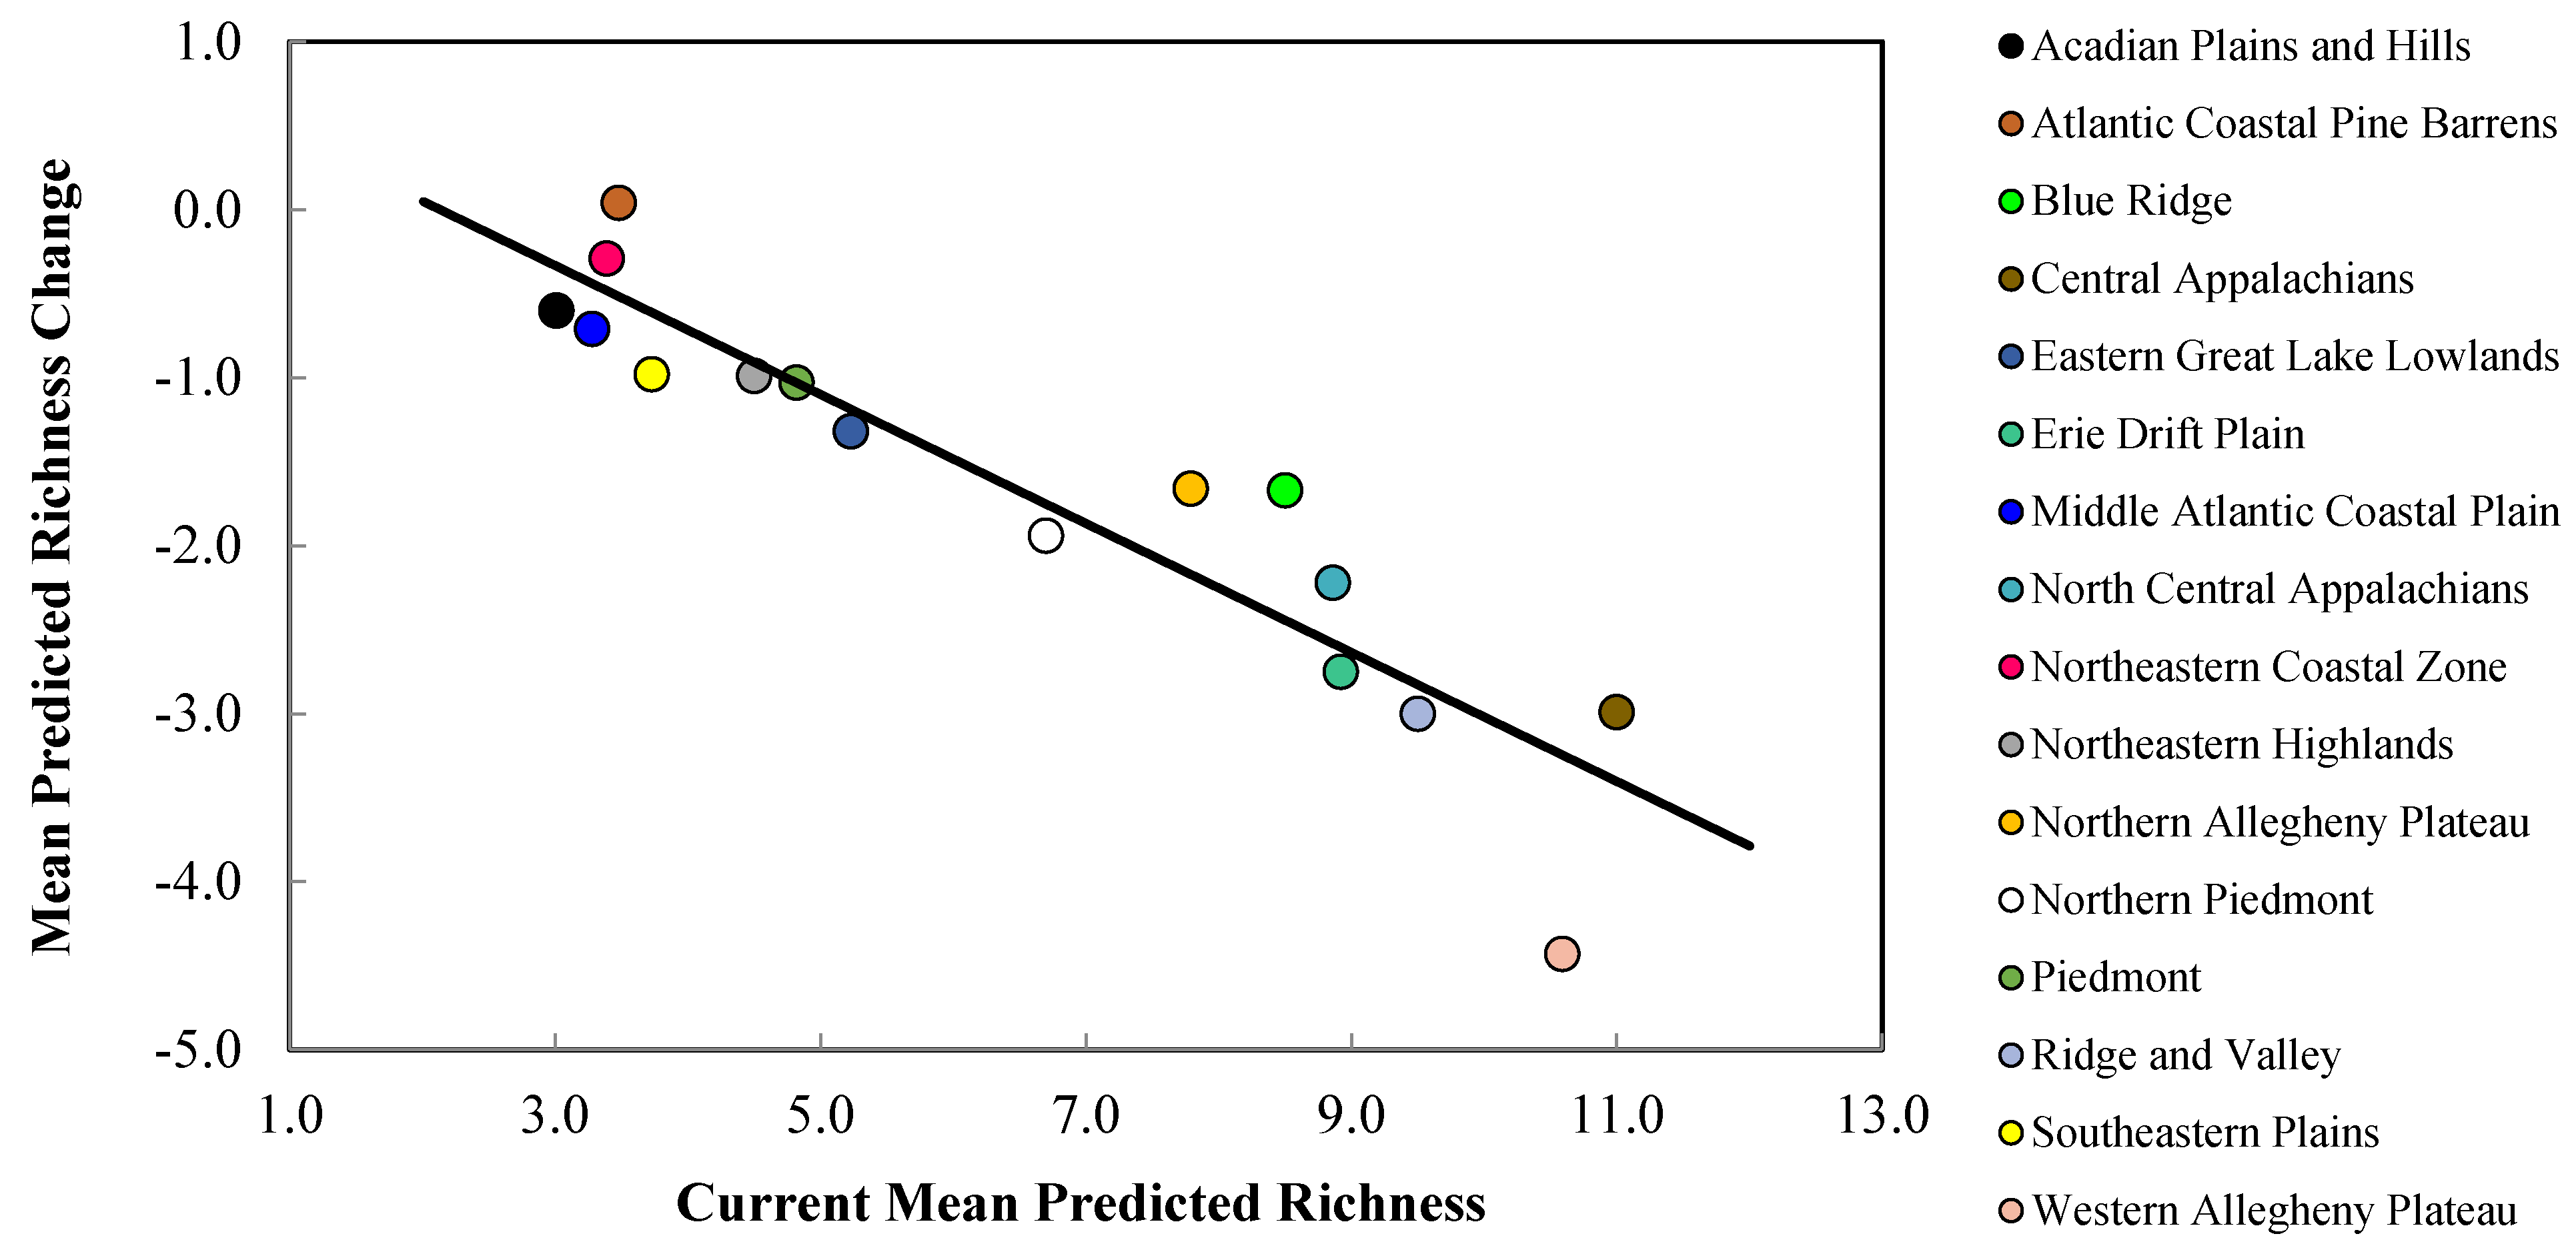
| Level III Ecoregion | CCSM RCP 4.5 | Hadley RCP 4.5 | CCSM RCP 8.5 | Hadley RCP 8.5 | Average Change (± SE) |
|---|---|---|---|---|---|
| Acadian Plains and Hills | –0.15 | –0.52 | –0.72 | –1.00 | –0.60 ± 0.18 |
| Atlantic Coastal Pine Barrens | +0.06 | +0.67 | –0.23 | –0.33 | +0.04 ± 0.23 |
| Blue Ridge | –0.97 | –0.61 | –2.14 | –2.95 | –1.67 ± 0.54 |
| Central Appalachians | –1.25 | –2.59 | –3.25 | –4.86 | –2.99 ± 0.75 |
| Eastern Great Lakes Lowlands | –0.86 | –1.47 | –1.25 | –1.71 | –1.32 ± 0.18 |
| Erie Drift Plain | –1.85 | –3.19 | –2.43 | –3.53 | –2.75 ± 0.38 |
| Middle Atlantic Coastal Plain | –0.52 | –0.30 | –0.65 | –1.39 | –0.71 ± 0.24 |
| North Central Appalachians | –0.97 | –2.67 | –1.71 | –3.54 | –2.22 ± 0.56 |
| Northeastern Coastal Zone | +0.07 | –0.09 | –0.39 | –0.77 | –0.29 ± 0.18 |
| Northeastern Highlands | –0.44 | –1.25 | –0.94 | –1.32 | –0.99 ± 0.20 |
| Northern Allegheny Plateau | –0.66 | –2.20 | –1.44 | –2.33 | –1.66 ± 0.39 |
| Northern Piedmont | –1.48 | –1.18 | –2.16 | –2.92 | –1.94 ± 0.39 |
| Piedmont | –0.23 | –0.55 | –0.64 | –2.68 | –1.03 ± 0.56 |
| Ridge and Valley | –1.81 | –2.51 | –3.26 | –4.41 | –3.00 ± 0.56 |
| Southeastern Plains | –0.12 | –0.89 | –0.30 | –2.60 | –0.98 ± 0.57 |
| Western Allegheny Plateau | –3.01 | –3.82 | –4.71 | –6.17 | –4.43 ± 0.68 |
2.2. Climate Scenario Selection
| Scientific Name | Common Name | Federally (T or E) | NatureServe (G1–G3) | IUCN Red List (NT, VU, E, or CE) | State T or E (# States) | NEPARC (Regional Responsibility Species) | ≥50% of States Listed in Species Wildlife Action Plan |
|---|---|---|---|---|---|---|---|
| Ambystoma barbouri | Streamside Salamander | --- | --- | NT | --- | --- | --- |
| Ambystoma jeffersonianum/ Ambystoma laterale | Jefferson’s Salamander/Blue-spotted Salamander | ---/--- | ---/--- | ---/--- | ---/Y(3) | Y/--- | Y/Y |
| Ambystoma opacum | Marbled Salamander | --- | --- | --- | Y(2) | --- | Y |
| Ambystoma mabeei | Mabee’s Salamander | --- | --- | --- | Y(1) | --- | --- |
| Ambystoma tigrinum | Eastern Tiger Salamander | --- | --- | --- | Y(5) | --- | Y |
| Aeneides aeneus | Green Salamander | --- | G3 | NT | Y(2) | --- | Y |
| Cryptobranchus alleganiensis | Hellbender | --- | G3 | NT | Y(1) | --- | Y |
| Desmognathus fuscus | Northern Dusky Salamander | --- | --- | --- | --- | Y | --- |
| Desmognathus monticola | Seal Salamander | --- | --- | --- | --- | Y | --- |
| Desmognathus ochrophaeus | Allegheny Mountain Dusky Salamander | --- | --- | --- | --- | Y | --- |
| Desmognathus organi | Northern Pygmy Salamander | --- | G3 | --- | --- | Y | --- |
| Eurycea bislineata | Northern Two-lined Salamander | --- | --- | --- | --- | Y | --- |
| Eurycea longicauda | Long-tailed Salamander | --- | --- | --- | Y(1) | Y | Y |
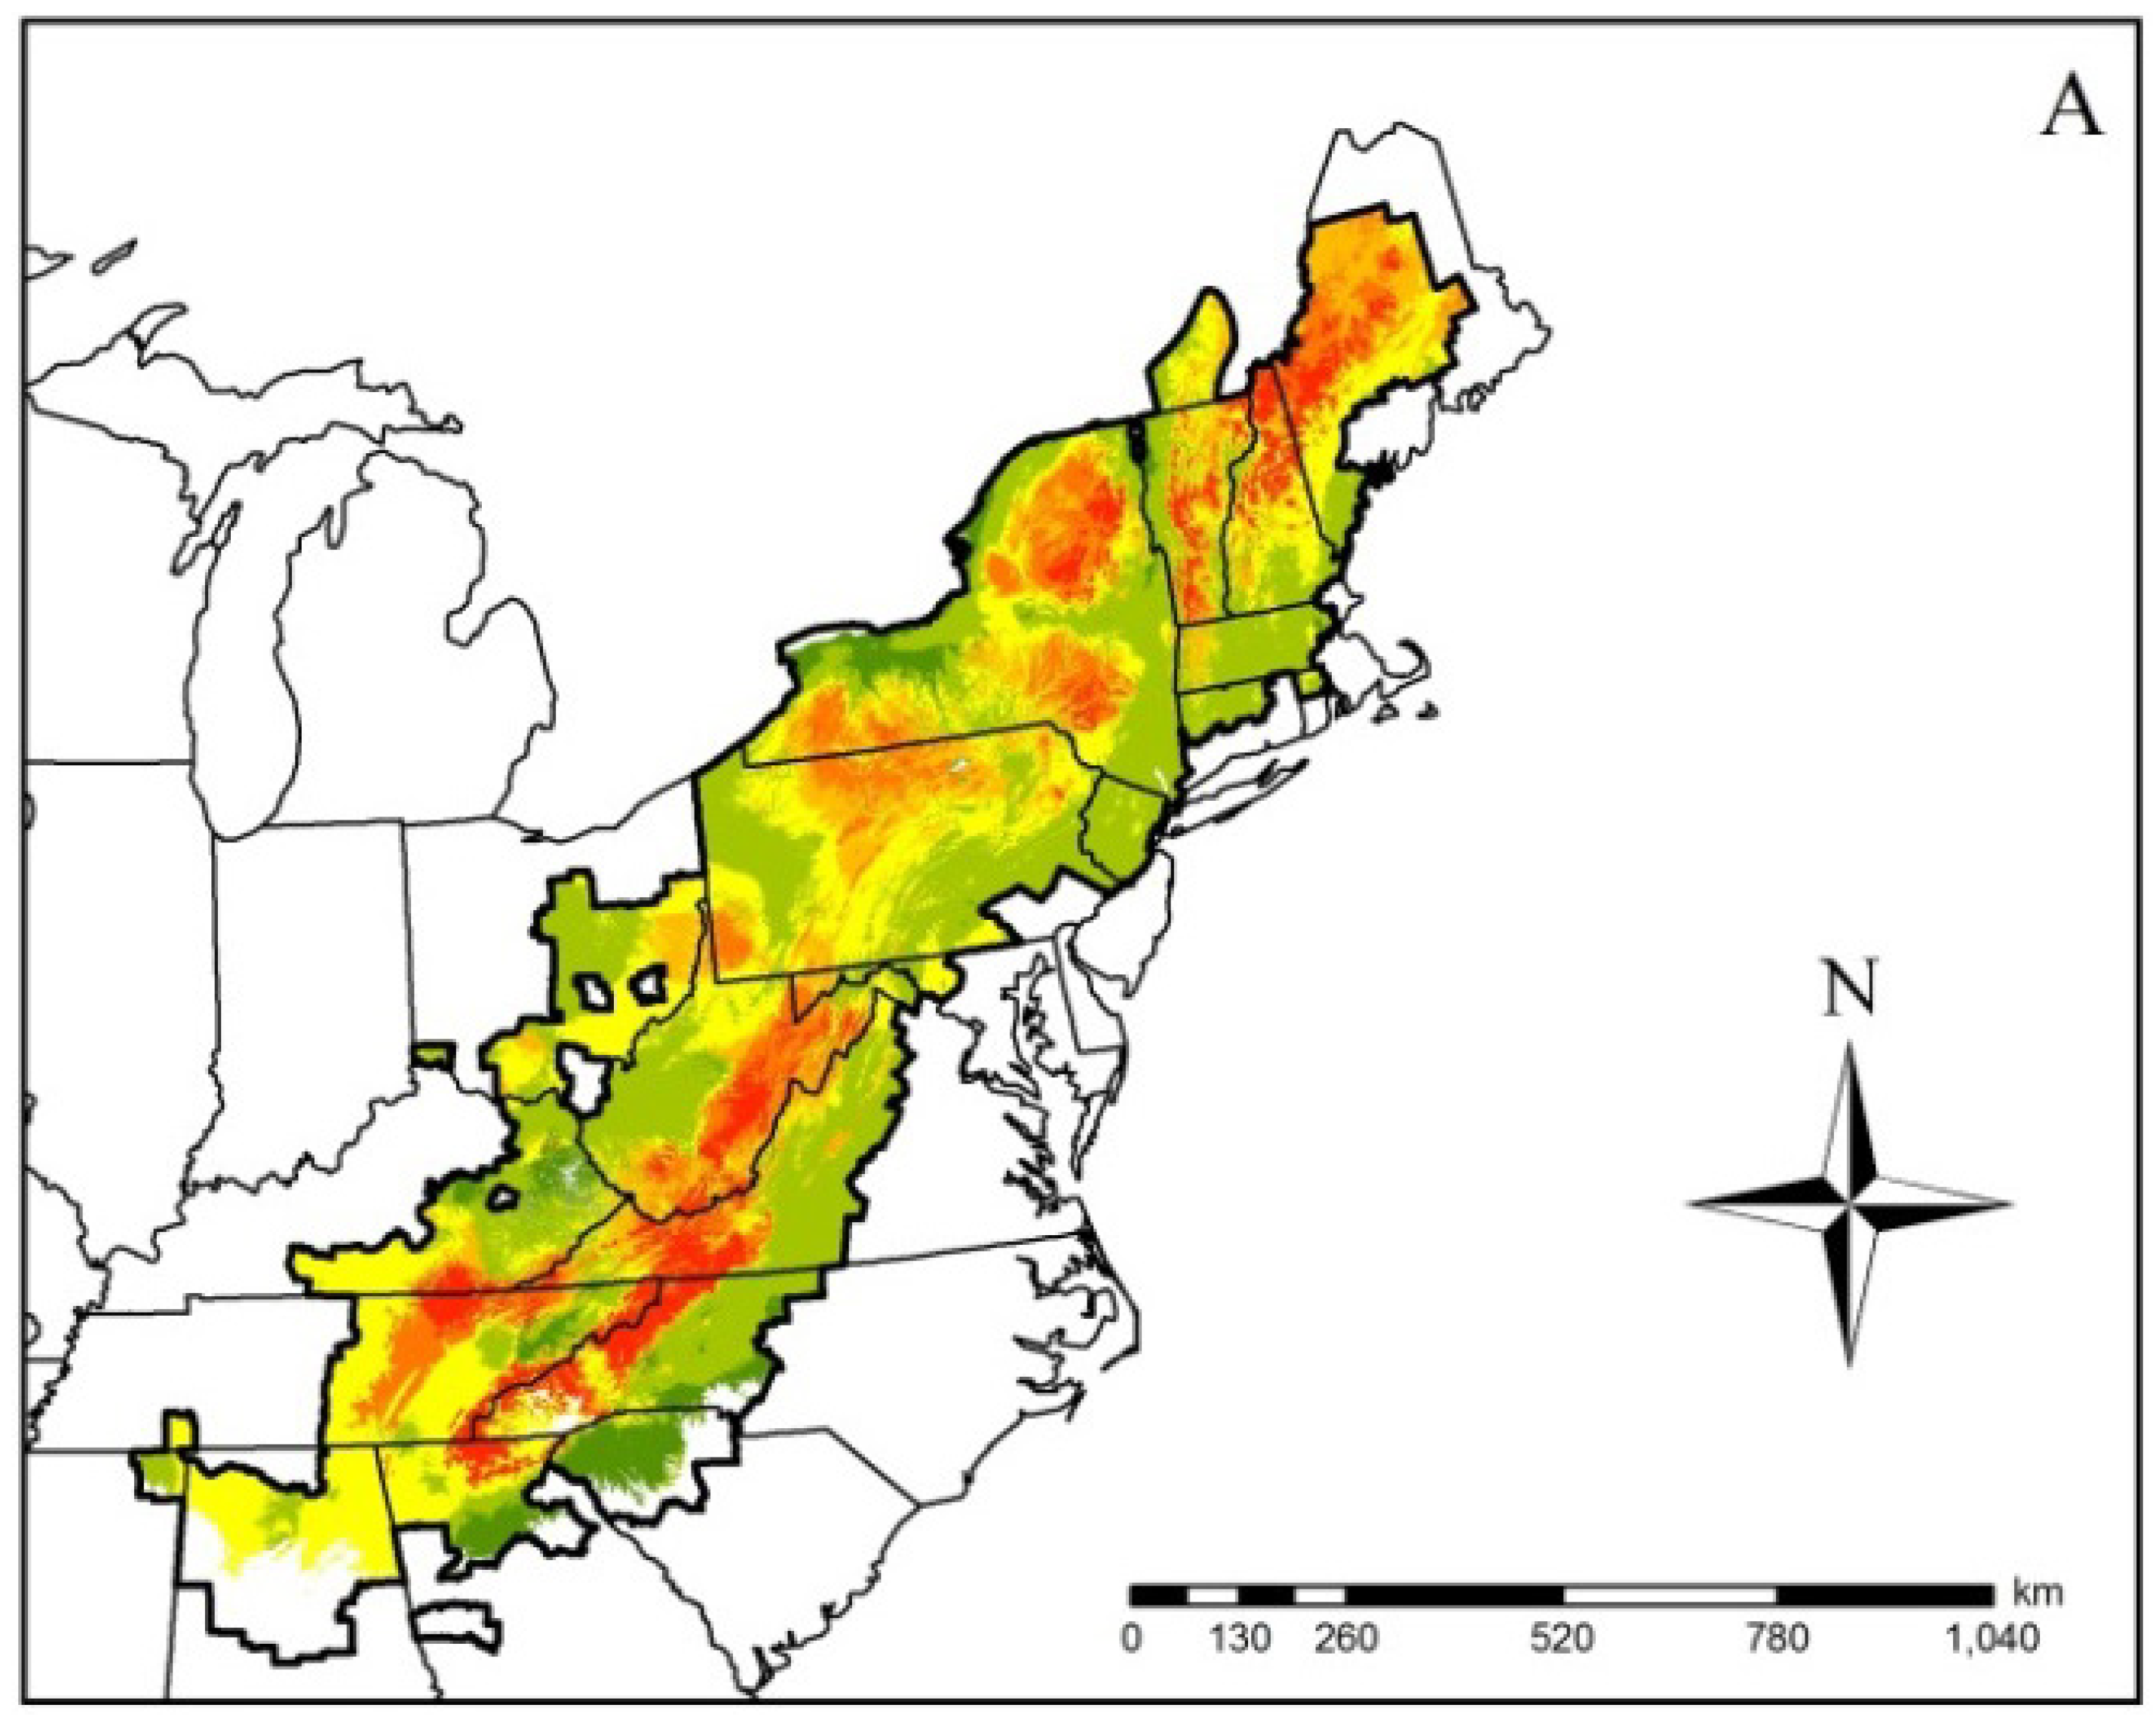
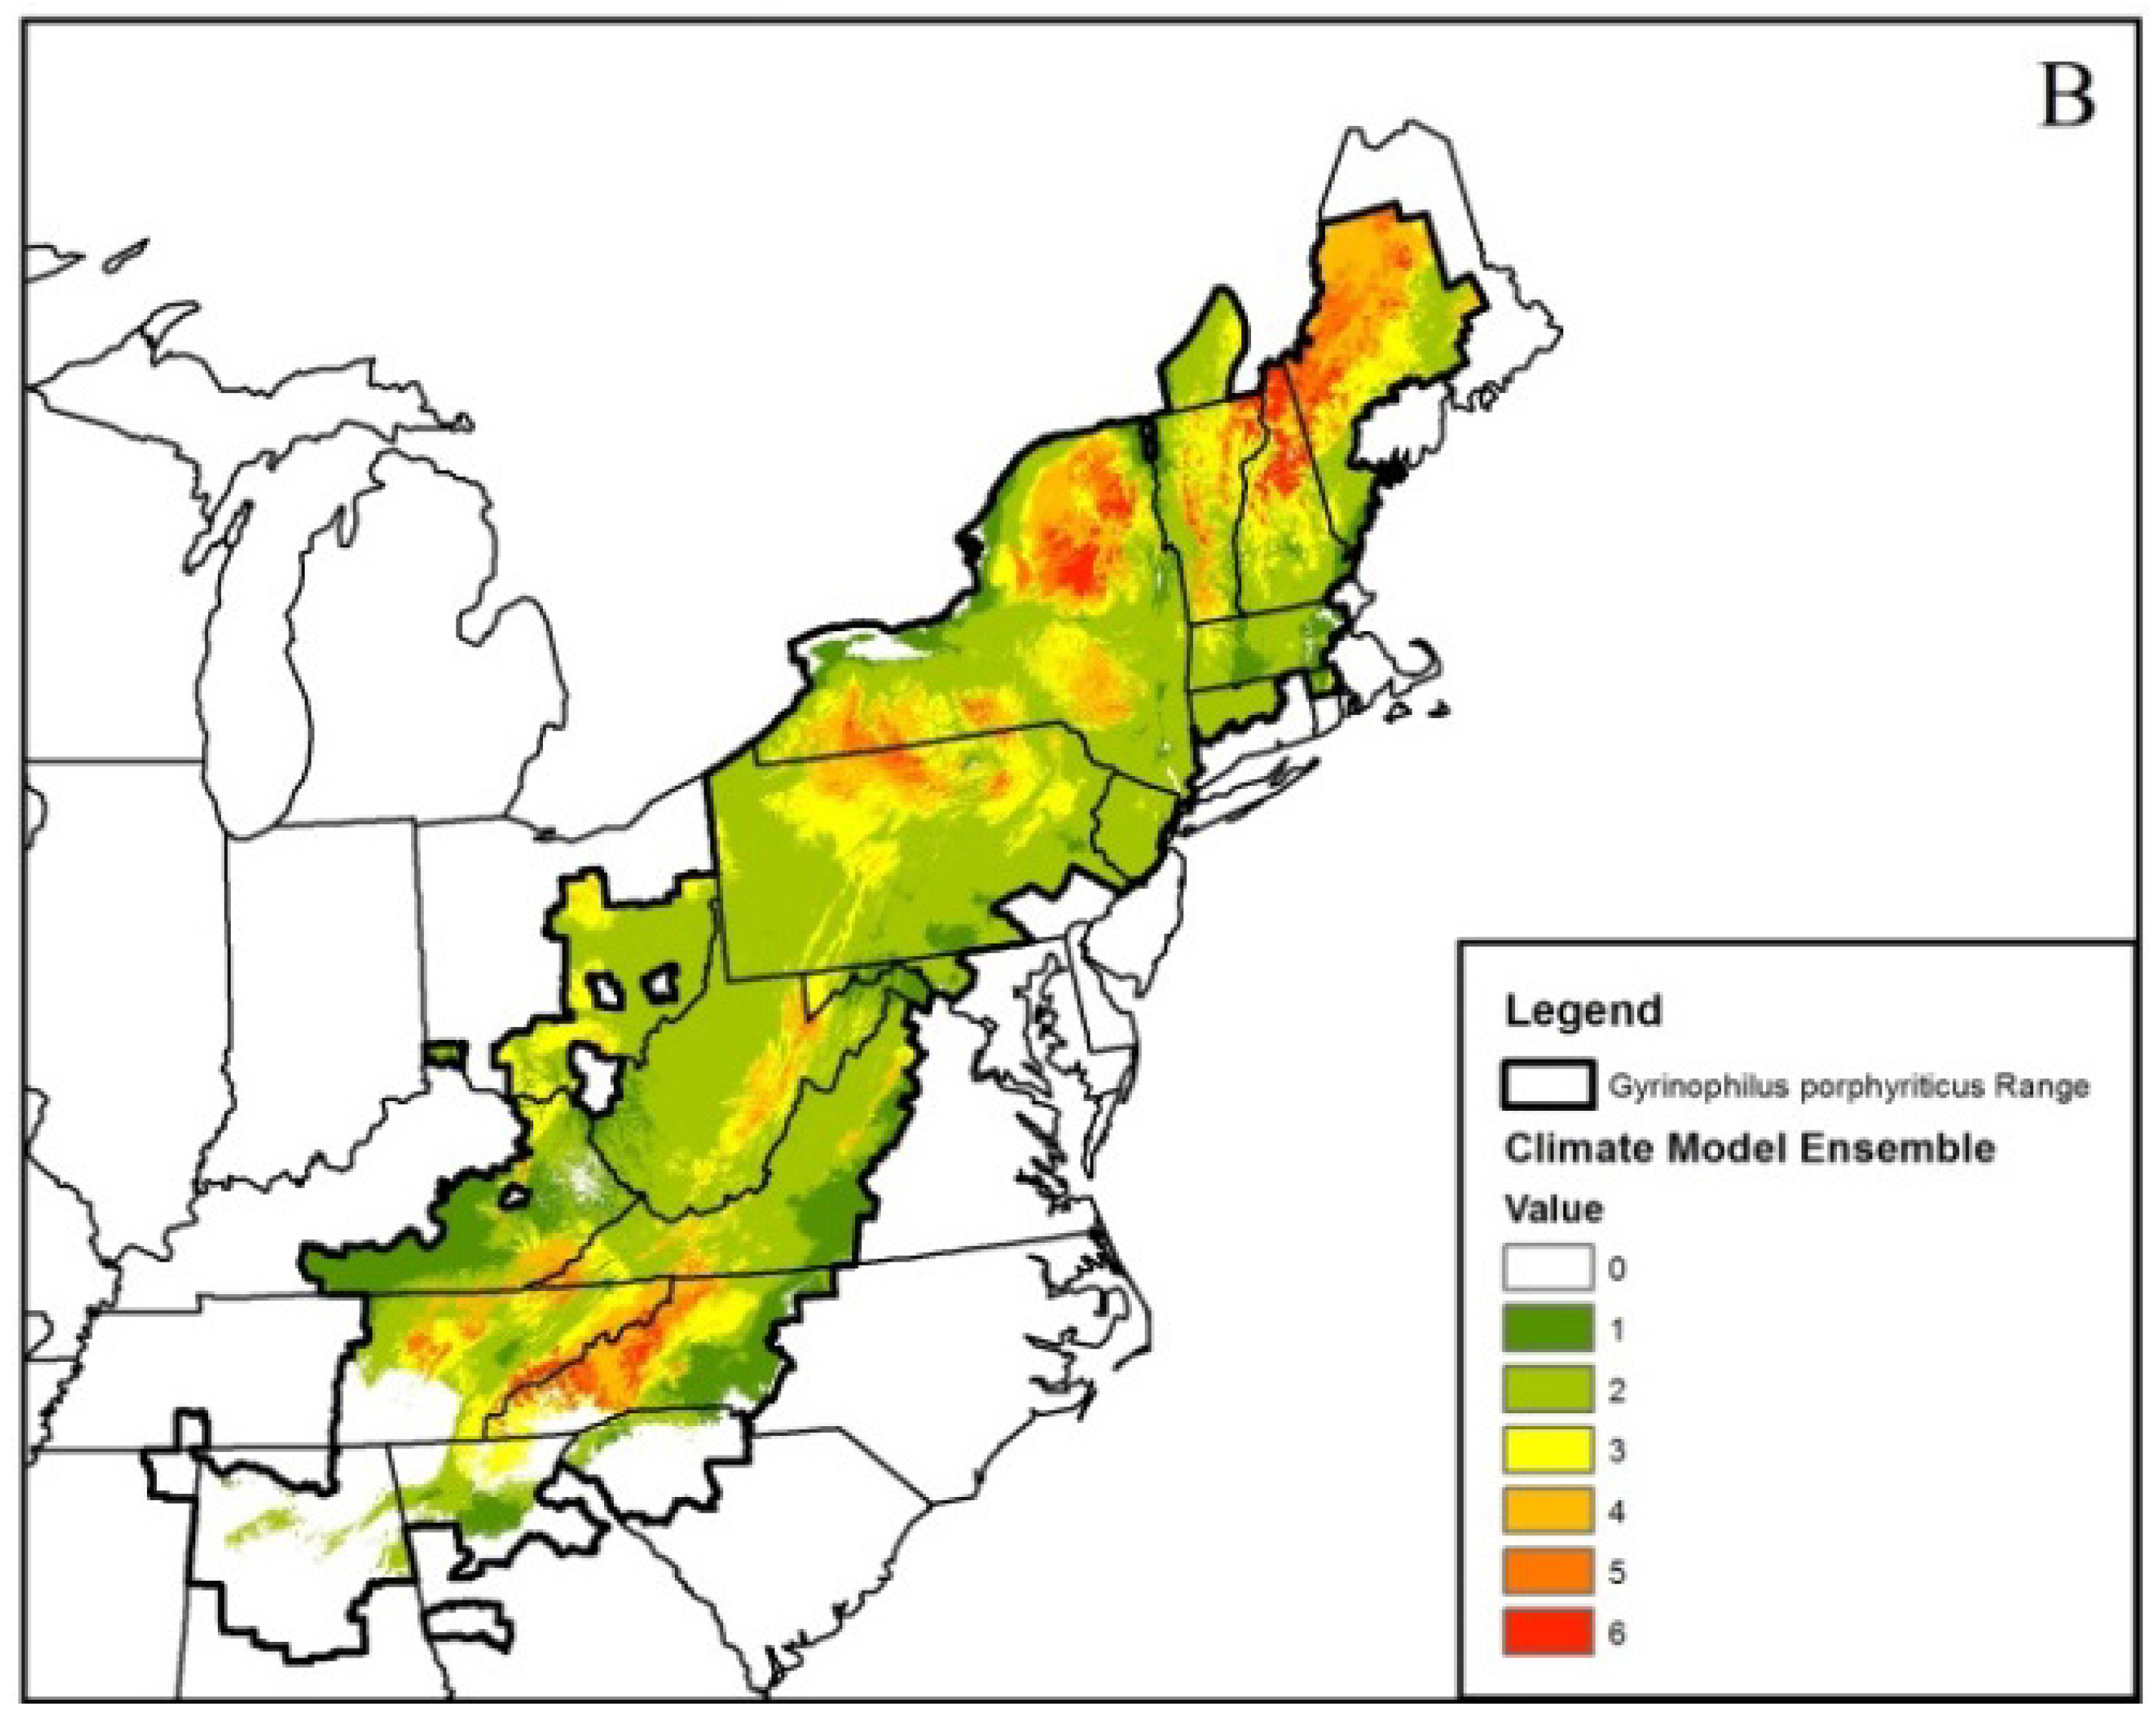
| Gyrinophilus porphyriticus | Spring Salamander | --- | --- | --- | Y(1) | Y | --- |
| Gyrinophilus subterraneus | West Virginia Spring Salamander | --- | G1 | E | --- | Y | --- |
| Necturus maculosus | Common Mudpuppy | --- | --- | --- | --- | --- | Y |
| Plethodonglutinosus/ Plethodon kentucki/ Plethodon cylindraceus | Northern Slimy Salamander/Cumberland Plateau Slimy Salamander/White-spotted Slimy Salamander | ---/---/--- | ---/---/--- | ---/---/--- | Y(1)/---/--- | Y/Y/Y | ---/---/--- |
| Plethodon hoffmani | Valley and Ridge Salamander | --- | --- | --- | --- | Y | --- |
| Plethodon hubrichti | Peaks of Otter Salamander | --- | G2 | VU | --- | Y | --- |
| Plethodon nettingi | Cheat Mountain Salamander | T | G2 | NT | Y(1) | Y | --- |
| Plethodon punctatus | Cow Knob Salamander | --- | G3 | NT | --- | Y | --- |
| Plethodon shenandoah | Shenandoah Salamander | E | G1 | VU | Y(1) | Y | --- |
| Plethodon sherando | Big Levels Salamander | --- | G2 | VU | --- | Y | --- |
| Plethodon virginia | Shenandoah Mountain Salamander | --- | G2 | NT | --- | Y | --- |
| Plethodon wehrlei | Wehrle’s Salamander | --- | --- | --- | --- | Y | --- |
| Plethodon welleri | Weller’s Salamander | --- | G3 | E | --- | --- | --- |
| Pseudotriton montanus | Mud Salamander | --- | --- | --- | Y(3) | --- | Y |
| Pseudotriton ruber | Red Salamander | --- | --- | --- | --- | Y | Y |
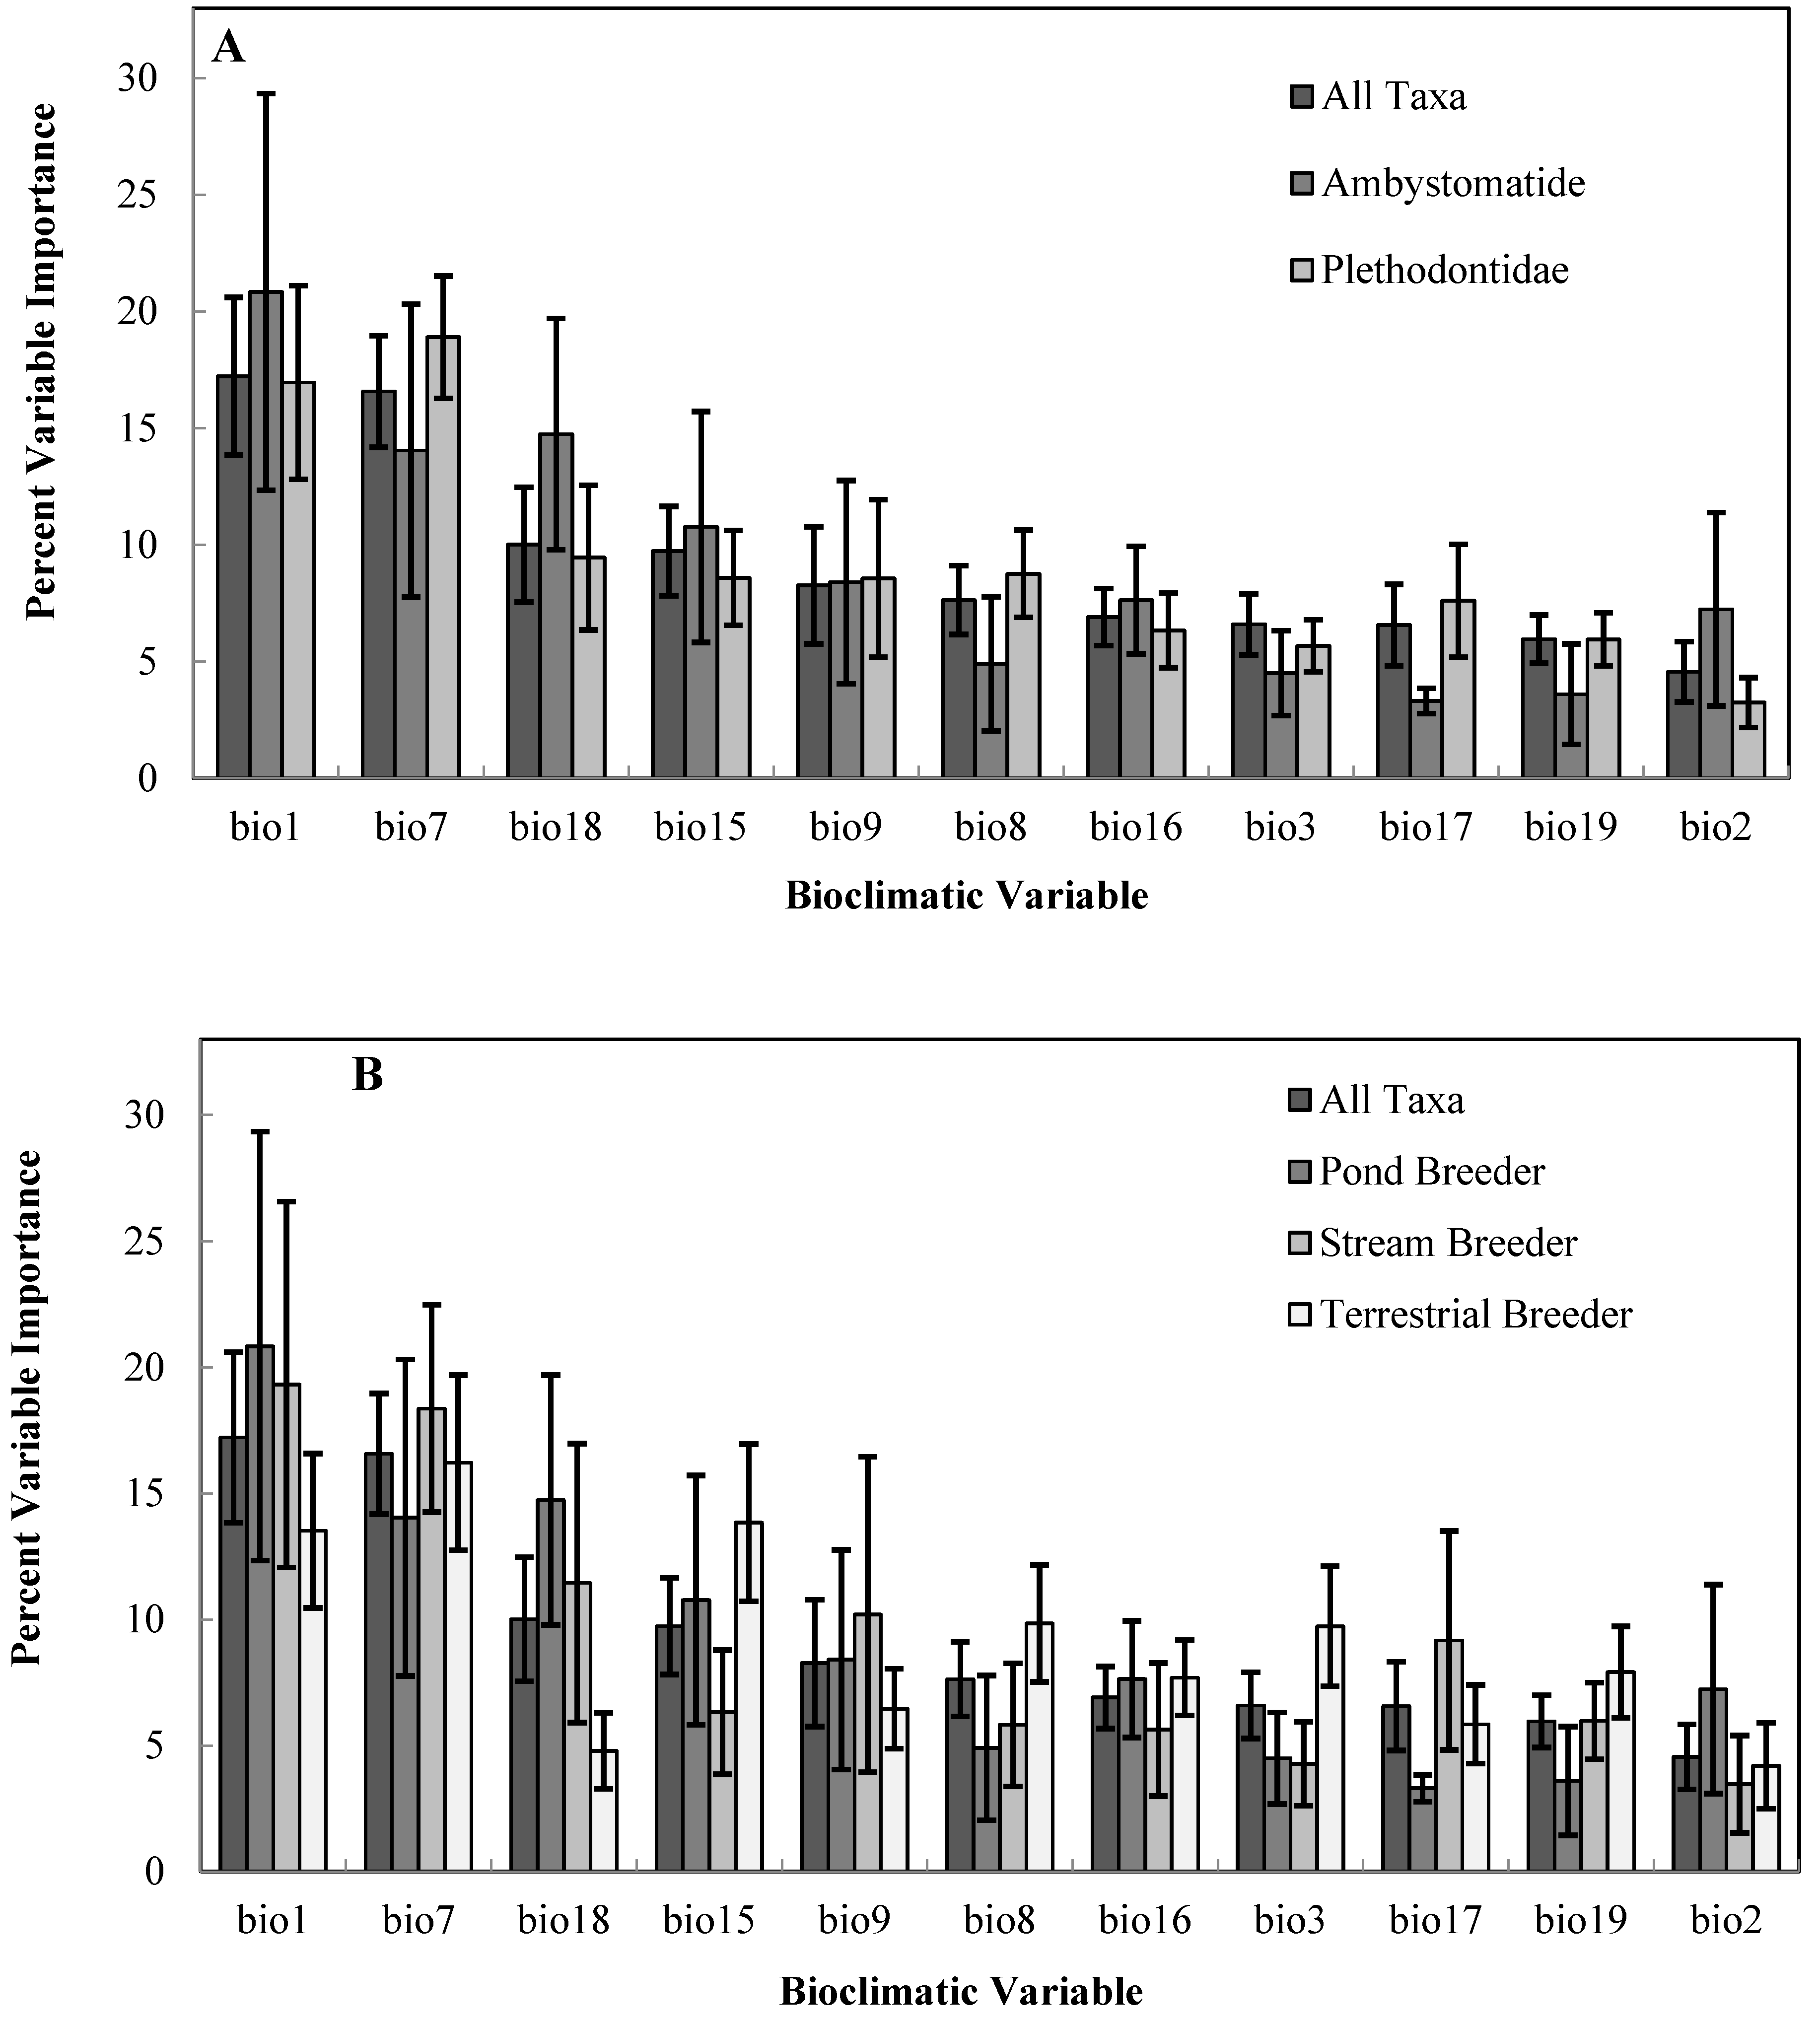
| Bioclimatic Variable | Bioclimatic Variable Description |
|---|---|
| BIO1 | Annual Mean Temperature |
| BIO2 | Mean Diurnal Range (Mean of monthly (max temp–min temp)) |
| BIO3 | Isothermality (Mean Diurnal Range/Minimum Temp Range) X 100 |
| BIO7 | Temperature Annual Range (Max Temperature of Warmest Month–Max Temperature of Coldest Month) |
| BIO8 | Mean temperature of Wettest Quarter |
| BIO9 | Mean temperature of Driest Quarter |
| BIO15 | Precipitation seasonality (Coefficient of Variation) |
| BIO16 | Precipitation of Wettest Quarter |
| BIO17 | Precipitation of Driest Quarter |
| BIO18 | Precipitation of Warmest Quarter |
| BIO19 | Precipitation of Coldest Quarter |
2.3. Data Preparation and Climate Modeling
2.4. Analysis of Species/Climate Distributions


| Species | N | AUC (± SD) | CCSM RCP 4.5 | Hadley RCP 4.5 | CCSM RCP 8.5 | Hadley RCP 8.5 | Average Change (± SE) |
|---|---|---|---|---|---|---|---|
| Ambystoma barbouri | 34 | 0.76 ± 0.13 | –0.98 | –0.98 | –0.94 | –1.00 | –0.97 ± 0.01 |
| *Ambystoma jeffersonianum/*Ambystoma laterale | 527 | 0.76 ± 0.03 | –0.03 | –0.10 | –0.06 | –0.10 | –0.07 ± 0.02 |
| Ambystoma mabeei | 35 | 0.79 ± 0.09 | –0.98 | –0.99 | –1.00 | –1.00 | –0.99 ± 0.05 |
| Ambystoma opacum | 497 | 0.76 ± 0.02 | –0.03 | –0.11 | –0.15 | –0.11 | –0.10 ± 0.03 |
| Ambystoma tigrinum | 145 | 0.80 ± 0.08 | –0.22 | –0.16 | –0.20 | –0.10 | –0.17 ± 0.03 |
| Aneides aeneus | 171 | 0.86 ± 0.04 | –0.13 | –0.57 | –0.52 | –0.75 | –0.49 ± 0.13 |
| Cryptobranchus alleganiensis | 342 | 0.89 ± 0.02 | –0.37 | –0.60 | –0.66 | –0.79 | –0.61 ± 0.09 |
| Desmognathus fuscus | 1394 | 0.74 ± 0.02 | –0.16 | –0.37 | –0.28 | –0.54 | –0.34 ± 0.08 |
| Desmognathus monticola | 397 | 0.78 ± 0.03 | –0.33 | –0.80 | –0.49 | –0.84 | –0.61 ± 0.12 |
| Desmognathus ochrophaeus | 359 | 0.79 ± 0.03 | –0.70 | –0.75 | –0.89 | –0.93 | –0.81 ± 0.05 |
| Desmognathus organi | 16 | 0.91 ± 0.06 | –0.99 | –1.00 | –0.77 | –0.98 | –0.94 ± 0.05 |
| Eurycea bislineata | 953 | 0.75 ± 0.02 | +0.05 | –0.09 | +0.01 | –0.09 | –0.03 ± 0.03 |
| Eurycea longicauda | 515 | 0.73 ± 0.03 | –0.31 | –0.41 | –0.52 | –0.63 | –0.47 ± 0.07 |
| Gyrinophilus porphyriticus | 764 | 0.76 ± 0.02 | –0.34 | –0.62 | –0.52 | –0.73 | –0.55 ± 0.08 |
| Necturus maculosus | 143 | 0.83 ± 0.03 | –0.09 | –0.15 | –0.12 | –0.09 | –0.11 ± 0.01 |
| *Plethodon glutinosus/*Plethodon kentucki/*Plethodon cylindraceus | 1741 | 0.76 ± 0.02 | –0.25 | –0.52 | –0.39 | –0.74 | –0.48 ± 0.10 |
| Plethodon hoffmani | 212 | 0.79 ± 0.03 | –0.90 | –0.96 | –0.93 | –0.93 | –0.93 ± 0.01 |
| Plethodon nettingi | 34 | 0.92 ± 0.06 | –0.94 | –0.99 | –1.00 | –1.00 | –0.98 ± 0.02 |
| Plethodon punctatus | 17 | 0.88 ± 0.15 | –1.00 | –1.00 | –1.00 | –1.00 | –1.00 ± 0.00 |
| Plethodon virginia | 24 | 0.88 ± 0.06 | –1.00 | –1.00 | –1.00 | –1.00 | –1.00 ± 0.00 |
| Plethodon wehrlei | 150 | 0.80 ± 0.07 | –0.32 | –0.84 | –0.54 | –0.88 | –0.65 ± 0.13 |
| Plethodon welleri | 15 | 0.74 ± 0.10 | –0.15 | –0.99 | –0.74 | –0.94 | –0.71 ± 0.20 |
| Pseudotriton montanus | 97 | 0.79 ± 0.08 | –0.05 | –0.33 | –0.17 | –0.61 | –0.29 ± 0.12 |
| Pseudotriton ruber | 719 | 0.69 ± 0.02 | 0.00 | –0.52 | –0.18 | –0.59 | –0.33 ± 0.14 |
3. Results


4. Discussion
5. Conclusions
Acknowledgments
Author Contributions
Conflicts of Interest
References
- Scheu, S.; Setala, H. Multitrophic interactions in decomposer food webs. In Multitrophic Level Interactions; Tschamtke, T., Hawkins, B.A., Eds.; Cambridge University Press: Cambridge, UK, 2002; pp. 223–269. [Google Scholar]
- Walton, B.M.; Tsatiris, D.; Rivera-Sostre, M. Salamanders in forest-floor food webs: Invertebrate species composition influences top-down effects. Pedobiologia 2006, 50, 313–321. [Google Scholar] [CrossRef]
- Beard, K.H.; Vogt, K.A.; Kulmatiski, A. Top-down effects of a terrestrial frog on forest nutrient dynamics. Oecologia 2002, 133, 583–593. [Google Scholar] [CrossRef]
- Kietzer, S.C.; Goforth, R.R. Salamander diversity alters stream microinvertebrate community structure. Freshwater Biol. 2013, 58, 2114–2125. [Google Scholar] [CrossRef]
- Munshaw, R.G.; Palen, W.J.; Courcelles, D.M.; Finlay, J.C. Predator-driven nutrient recycling in California stream ecosystems. PLoS One 2013, 8, e58542. [Google Scholar] [CrossRef] [PubMed]
- Davic, R.D.; Welsh, H.H., Jr. On the ecological roles of salamanders. Ann. Rev. Ecol. Syst. 2004, 35, 405–435. [Google Scholar] [CrossRef]
- Wyman, R.L. Experimental assessment of salamanders as predators of detrital food webs: Effects on invertebrates, decomposition and the carbon cycle. Biodivers. Conserv. 1998, 7, 641–650. [Google Scholar] [CrossRef]
- Best, M.L.; Welsh, H.H., Jr. The trophic role of a forest salamander: Impacts on invertebrates, leaf litter retention, and the humification process. Ecosphere 2013, 5, art16. [Google Scholar] [CrossRef]
- Stuart, S.N.; Chanson, J.S.; Cox, N.A.; Young, B.E.; Rodrigues, A.S.L.; Fischman, D.L.; Waller, R.W. Status and trends of amphibian declines and extinctions worldwide. Science 2004, 306, 1783–1786. [Google Scholar] [CrossRef] [PubMed]
- Houlahan, J.E.; Findlay, C.S.; Schmidt, B.R.; Meyer, A.H.; Kuzmin, S.L. Quantitative evidence for global amphibian population declines. Nature 2000, 404, 752–755. [Google Scholar] [CrossRef] [PubMed]
- Collins, J.P.; Storfer, A. Global amphibian declines: Sorting the hypotheses. Divers. Distrub. 2003, 9, 89–98. [Google Scholar] [CrossRef]
- Hof, C.; Araújo, M.B.; Jetz, W.; Rabhek, C. Additive threats from pathogens, climate and land-use change for global amphibian diversity. Nature 2011, 480, 516–521. [Google Scholar] [PubMed]
- Corn, P.S. Climate change and amphibians. Anim. Biodivers. Conserv. 2005, 28, 59–67. [Google Scholar]
- Southerland, M.T.; Jung, R.E.; Baxter, D.P.; Chellman, I.C.; Mercurio, G.; Volstad, J.H. Stream salamanders as indicators of stream quality in Maryland, USA. Appl. Herpetol. 2004, 2, 23–46. [Google Scholar] [CrossRef]
- Barrett, K.; Guyer, C. Differential responses of amphibians and reptiles in riparian and stream habitats to land use disturbances in western Georgia, USA. Biol. Conserv. 2008, 9, 2290–2300. [Google Scholar] [CrossRef]
- Semlitsch, R.D.; Todd, B.D.; Blomquist, S.M.; Calhoun, A.J.K.; Gibbons, J.W.; Gibbs, J.P.; Graeter, G.J.; Harper, E.B.; Hocking, D.J.; Hunter, M.L., Jr.; et al. Effects of timber harvest on amphibian populations: Understanding the mechanisms from forest experiments. BioScience 2009, 59, 853–862. [Google Scholar] [CrossRef]
- Tilghman, J.M.; Ramee, S.W.; Marsh, D.M. Meta-analysis of the effects of canopy removal on terrestrial salamander populations in North America. Biol. Conserv. 2012, 152, 1–9. [Google Scholar] [CrossRef]
- Weinstein, S.B. An aquatic disease on a terrestrial salamander: Individual and population level effects of the amphibian chytrid fungus, Batrachochytrium dendrobatidis, on Batrachoceps attenuatus (Plethodontidae). Copeia 2009, 2009, 653–660. [Google Scholar] [CrossRef]
- Martel, A.; Blooi, M.; Adriaensen, C.; Rooij, V.P.; Beukema, P.W.; Fisher, M.C.; Farrer, A.R.; Schmidt, B.R.; Tobler, U.; Goka, K.; et al. Recent introduction of a chytrid fungus endangers western Palearctic salamanders. Science 2014, 31, 630–631. [Google Scholar] [CrossRef] [Green Version]
- Welsh, H.H., Jr.; Hodgson, G.R. Woodland salamanders as metrics of forest ecosystem recovery: A case study from California’s redwoods. Ecosphere 2013, 4, art59. [Google Scholar] [CrossRef]
- Walther, G.; Post, E.; Convey, P.; Menzel, A.; Parmesan, C.; Beebee, T.J.C.; Fromentin, J.-M.; Hoegh-Guldberg, O.; Bairlein, F. Ecological responses to recent climate change. Nature 2002, 416, 389–395. [Google Scholar] [CrossRef] [PubMed]
- Parmesan, C.; Yohe, G. A globally coherent fingerprint of climate change impacts across natural systems. Nature 2003, 42, 37–42. [Google Scholar] [CrossRef]
- Tingley, M.W.; Monahan, W.B.; Beissinger, S.R.; Moritz, C. Birds track their Grinnelian niche throughout a century of climate change. Proc. Natl. Acad. Sci. USA 2009, 106, 19637–19643. [Google Scholar] [CrossRef] [PubMed]
- Kroschel, W.A.; Sutton, W.B.; McClure, C.J.W.; Pauley, T.K. Decline of the Cheat Mountain salamander over a 32-year period and the potential influence of competition from a sympatric species. J. Herpetol. 2014, 48, 415–422. [Google Scholar] [CrossRef]
- Walker, B.; Holling, C.S.; Carpenter, S.R.; Kinzig, A. Resilience, adaptability and transformability in social-ecological systems. Ecol. Soc. 2004, 9, 5. [Google Scholar]
- Ackerly, D.D.; Loarie, S.R.; Cornwell, W.K.; Weiss, S.B.; Hamilton, H.; Branciforte, R.; Kraft, N.J.B. The geography of climate change: Implications for conservation biogeography. Divers. Distrib. 2010, 16, 476–487. [Google Scholar] [CrossRef]
- Dobrowski, S.Z. A climatic basis for microrefugia: The influence of terrain on climate. Glob. Chang. Biol. 2010, 17, 1022–1035. [Google Scholar] [CrossRef]
- Foster, D.R.; Motzkin, G.; Slater, B. Land-use history as long-term broad-scale disturbance: Regional forest dynamics in central New England. Ecosystems 1998, 1, 96–119. [Google Scholar] [CrossRef]
- Hayhoe, K.; Wake, C.; Anderson, B.; Liang, X.; Mauer, E.; Zhu, J.; Bradbury, J.; DeGaetano, A.; Stoner, A.M.; Wuebbles, D. Regional climate change projections for the northeast USA. Mitig. Adapt. Strat. Glob. Chang. 2007, 13, 425–436. [Google Scholar] [CrossRef]
- Huntington, T.G.; Richardson, A.D.; McGuire, K.J.; Hayhoe, K. Climate and hydrological changes in the northeastern United States: Recent trends and implications for forested and aquatic ecosystems. Can. J. For. Res. 2009, 39, 199–212. [Google Scholar] [CrossRef]
- Milanovich, J.R.; Peterman, W.E.; Nibblelink, N.P.; Maerz, J.C. Projected loss of a salamander diversity hotspot as a consequence of projected global climate change. PLoS One 2010, 5, e12189. [Google Scholar] [CrossRef] [PubMed]
- Barrett, K.; Nibbelink, N.P.; Maerz, J.C. Identifying priority species and conservation opportunities under future climate scenarios: Amphibians in a biodiversity hotspot. J. Fish Wildl. Manag. 2014, 5, 282–297. [Google Scholar] [CrossRef]
- Ashcroft, M.B. Identifying refugia from climate change. J. Biogeogr. 2010, 37, 1407–1413. [Google Scholar]
- NEPARC. Northeast Amphibian and Reptile Species of Regional Responsibility and Conservation Concern. Available online: http://www.northeastparc.org/products/pdfs/NEPARC_NEspeciesofresponsibility.pdf (accessed on 23 April 2013).
- Overland, J.E.; Wang, M.; Bond, N.A.; Walsh, J.E.; Kattsov, V.M.; Chapman, W.L. Considerations in the selection of global climate models for regional climate projections: The Arctic as a case study. J. Clim. 2011, 24, 1583–1597. [Google Scholar] [CrossRef]
- Van Vuuren, D.P.; Edmonds, J.; Kainuma, M.; Riahi, K.; Thomson, A.; Hibbard, K.; Hurtt, G.C.; Kram, T.; Krey, V.; Lamarque, J.-F.; et al. The representative concentration pathways: An overview. Clim. Chang. 2011, 109, 5–31. [Google Scholar] [CrossRef]
- Hijmans, R.J.; Cameron, S.E.; Parra, J.L.; Jones, P.G.; Jarvis, A. Very high resolution interpolated climate surfaces for global land areas. Int. J. Climatol. 2005, 25, 1965–1978. [Google Scholar] [CrossRef]
- Rissler, L.J.; Apodaca, A.A. Adding more ecology into species delimitation: Ecological niche models and phylogeography help define cryptic species in the black salamander (Aneides flavipunctatus). Syst. Biol. 2007, 56, 924–942. [Google Scholar] [CrossRef] [PubMed]
- Milanovich, J.R.; Peterman, W.E.; Barrett, K.; Hopton, M.E. Do species distribution models predict species richness in urban and natural green spaces? A case study using amphibians. Landsc. Urban Plan. 2012, 107, 409–418. [Google Scholar] [CrossRef]
- Phillips, S.J.; Anderson, R.P.; Schapire, R.E. Maximum entropy modeling of species geographic distributions. Ecol. Model. 2006, 190, 231–259. [Google Scholar] [CrossRef]
- Elith, J.; Graham, C.H. Do they? How do they? Why do they differ? On finding reasons for differing performances of species distribution models. Ecography 2009, 32, 66–77. [Google Scholar] [CrossRef]
- MacKenzie, D.I.; Nichols, J.D.; Royle, J.A.; Pollock, K.H.; Bailey, L.L.; Hines, J.E. Occupancy Estimation and Modeling: Inferring Patterns and Dynamics of Species Occurrence; Elsevier-Academic Press: Amsterdam, The Netherlands, 2006; p. 324. [Google Scholar]
- Kramer-Schadt, S.; Niedballa, J.; Pilgrim, N.J.; Schröder, B.; Lindenborn, J.; Reinfelder, V.; Stillfried, M.; Heckmann, I.; Scharf, A.K.; Augeri, D.M.; et al. The importance of correcting for sampling bias in MaxEnt species distribution models. Divers. Distrib. 2013, 2013, 1366–1379. [Google Scholar] [CrossRef]
- Phillips, S.J.; Dudík, M.; Elith, J.; Graham, C.H.; Lehmann, A.; Leathwick, J.; Ferrier, S. Sample selection bias and presence-only distribution models: Implications for background and pseudo-absence data. Ecol. Appl. 2009, 19, 181–197. [Google Scholar] [CrossRef] [PubMed]
- Lobo, J.M.; Jiménez-Valverde, A.; Real, R. AUC: A misleading measure of the performance of predictive distribution models. Global Ecol. Biogeogr. 2007, 17, 145–151. [Google Scholar] [CrossRef]
- Baldwin, R.A. Use of maximum entropy modeling in wildlife research. Entropy 2009, 11, 854–866. [Google Scholar] [CrossRef]
- Jiménez-Valverde, A. Insights into the area under the receiver operator characteristic curve (AUC) as a discrimination measure in species distribution modelling. Global Ecol. Biogeogr. 2012, 21, 498–507. [Google Scholar] [CrossRef]
- Araújo, M.B.; New, M. Ensemble forecasting of species distributions. Trends Ecol. Evol. 2006, 22, 42–47. [Google Scholar] [CrossRef] [PubMed]
- Schwartz, M.W.; Iverson, L.R.; Prasad, A.M.; Matthews, S.N.; O’Connor, R.J. Predicting extinctions as a result of climate change. Ecology 2006, 87, 1611–1615. [Google Scholar] [CrossRef] [PubMed]
- Austin, M.P.; van Niel, K.P. Improving species distribution models for climate change studies: Variable selection and scale. J. Biogeogr. 2010, 38, 1–8. [Google Scholar] [CrossRef]
- Araújo, M.B.; Peterson, A.T. Uses and misuses of bioclimatic envelope modeling. Ecology 2012, 93, 1527–1539. [Google Scholar] [CrossRef] [PubMed]
- Wells, K.D. The Ecology and Behavior of Amphibians; The University of Chicago Press: Chicago, IL, USA, 2007. [Google Scholar]
- Feder, M.E. Integrating the ecology and physiology of plethodontid salamanders. Herpetologica 1983, 39, 291–310. [Google Scholar]
- Gifford, M.E.; Kozak, K.H. Islands in the sky or squeezed at the top? Ecological causes of elevational range limits in montane salamanders. Ecography 2012, 35, 193–203. [Google Scholar] [CrossRef]
- Moritz, C.; Patton, J.L.; Conroy, C.J.; Parra, J.L.; White, G.C.; Beissinger, S.R. Impact of a century of climate change on small-mammal communities in Yosemite National Park, USA. Nature 2008, 322, 261–264. [Google Scholar]
- Moskwik, M. Recent elevational range expanses in plethodontid salamanders (Amphibia: Plethodontidae) in the southern Appalachian Mountains. J. Biogeogr. 2014, 41, 1957–1966. [Google Scholar] [CrossRef]
- Rovito, S.M.; Parra-Olea, G.; Vásquez-Alamazán, C.R.; Papenfuss, T.J.; Wake, D.B. Dramatic declines in Neotropical salamander populations are an important part of the global amphibian crisis. Proc. Natl. Acad. Sci. USA 2009, 106, 3231–3236. [Google Scholar] [CrossRef] [PubMed]
- Cheng, T.L.; Rovitok, S.M.; Wake, D.B.; Vredenburg, V.T. Coincident mass extirpation of Neotropical amphibians with the emergence of the infectious fungal pathogen Batrachochytrium dendrobatidis. Proc. Natl. Acad. Sci. USA 2011, 108, 9502–9507. [Google Scholar] [CrossRef] [PubMed]
- Tingley, M.W.; Beissinger, S.R. Detecting range shifts from historical species occurrences: New perspectives on old data. Trends Ecol. Evol. 2009, 24, 625–633. [Google Scholar] [CrossRef] [PubMed]
- Feder, M.E. Environmental variability and thermal acclimation in Neotropical and temperate zone salamanders. Physiol. Zool. 1978, 51, 7–16. [Google Scholar]
- Kearney, M.R.; Wintle, B.A.; Porter, W.P. Correlative and mechanistic models of species distribution provide congruent forecasts under climate change. Conserv. Lett. 2010, 3, 203–213. [Google Scholar] [CrossRef]
- Magness, D.R.; Morton, J.M.; Huettman, F.; Chapin, F.S., III; McGuire, A.D. A climate-change adaptation framework to reduce continental-scale vulnerability across conservation reserves. Ecosphere 2011, 2, art112. [Google Scholar] [CrossRef]
- Hampe, A.; Petit, R. Conserving biodiversity under climate change: The rear edge matters. Ecol. Lett. 2005, 8, 461–467. [Google Scholar] [CrossRef] [PubMed] [Green Version]
- Shoo, L.P.; Olson, D.H.; McMenamin, S.K.; Murray, K.A.; Sluys, M.V.; Donnelly, M.A.; Stratford, D.; Terhivuo, J.; Merino-Viteri1, A.; Herbert, S.M.; et al. Engineering a future for amphibians under climate change. J. Appl. Ecol. 2011, 48, 487–492. [Google Scholar] [CrossRef]
- Bennun, L.A.; Fishpool, L.D.C. Important Bird Areas in Africa. Ostrich 2000, 71, 150–153. [Google Scholar] [CrossRef]
- Sutherland, R.; deMaynadier, P. Model Criteria and Implementation Guidance for a Priority Amphibian and Reptile Conservation Area (PARCA) System in the USA. Available online: http://www.parcplace.org/images/stories/documents/PARCA_System_Criteria_and_Implementation_Guidance_FINAL.pdf (accessed on 18 February 2013).
© 2014 by the authors; licensee MDPI, Basel, Switzerland. This article is an open access article distributed under the terms and conditions of the Creative Commons Attribution license (http://creativecommons.org/licenses/by/4.0/).
Share and Cite
Sutton, W.B.; Barrett, K.; Moody, A.T.; Loftin, C.S.; DeMaynadier, P.G.; Nanjappa, P. Predicted Changes in Climatic Niche and Climate Refugia of Conservation Priority Salamander Species in the Northeastern United States. Forests 2015, 6, 1-26. https://doi.org/10.3390/f6010001
Sutton WB, Barrett K, Moody AT, Loftin CS, DeMaynadier PG, Nanjappa P. Predicted Changes in Climatic Niche and Climate Refugia of Conservation Priority Salamander Species in the Northeastern United States. Forests. 2015; 6(1):1-26. https://doi.org/10.3390/f6010001
Chicago/Turabian StyleSutton, William B., Kyle Barrett, Allison T. Moody, Cynthia S. Loftin, Phillip G. DeMaynadier, and Priya Nanjappa. 2015. "Predicted Changes in Climatic Niche and Climate Refugia of Conservation Priority Salamander Species in the Northeastern United States" Forests 6, no. 1: 1-26. https://doi.org/10.3390/f6010001