1. Introduction
Mediterranean oak ecosystem management encompasses multiple economic, social, and ecological objectives. Typically, it involves further multiple stakeholders (e.g., large-scale non-industrial private forestland owners, small scale private forest owners, the forest industry, and agricultural regional offices, as well as other non-governmental organizations). Addressing sustainability concerns in Mediterranean oak forest ecosystem management is thus a complex task that requires the integration of diverse data, information, models, and methods. Stimulated by developments in business administration and industry, decision support systems (DSS) have facilitated this integration, thus contributing to the quality and transparency of decision-making in natural resource management [
1]. They provide support to solve forestry problems by integrating database management systems with simulation, analytical and operational research models, graphic display, tabular reporting capabilities, and the expert knowledge of scientists, managers, and decision-makers [
1].
The more important and most recent developments of DSS in forest management, including examples from North America, Europe, and Asia, have been reviewed recently [
2,
3]. According to the authors, a basic conclusion that emerges from the review is that the availability of DSS in forest management has enabled more effective analysis of options and implications that alternative management approaches have for all components of forest ecosystems. The case of Mediterranean forest ecosystem management planning is not an exception and several authors have highlighted the contribution of DSS to increase the efficiency and the effectiveness of its business processes [
4,
5,
6,
7,
8,
9,
10,
11].
Nevertheless, currently available forestry DSSs do not include an explicit functionality to assess the trade-offs between ecosystem management planning criteria. Marques
et al. [
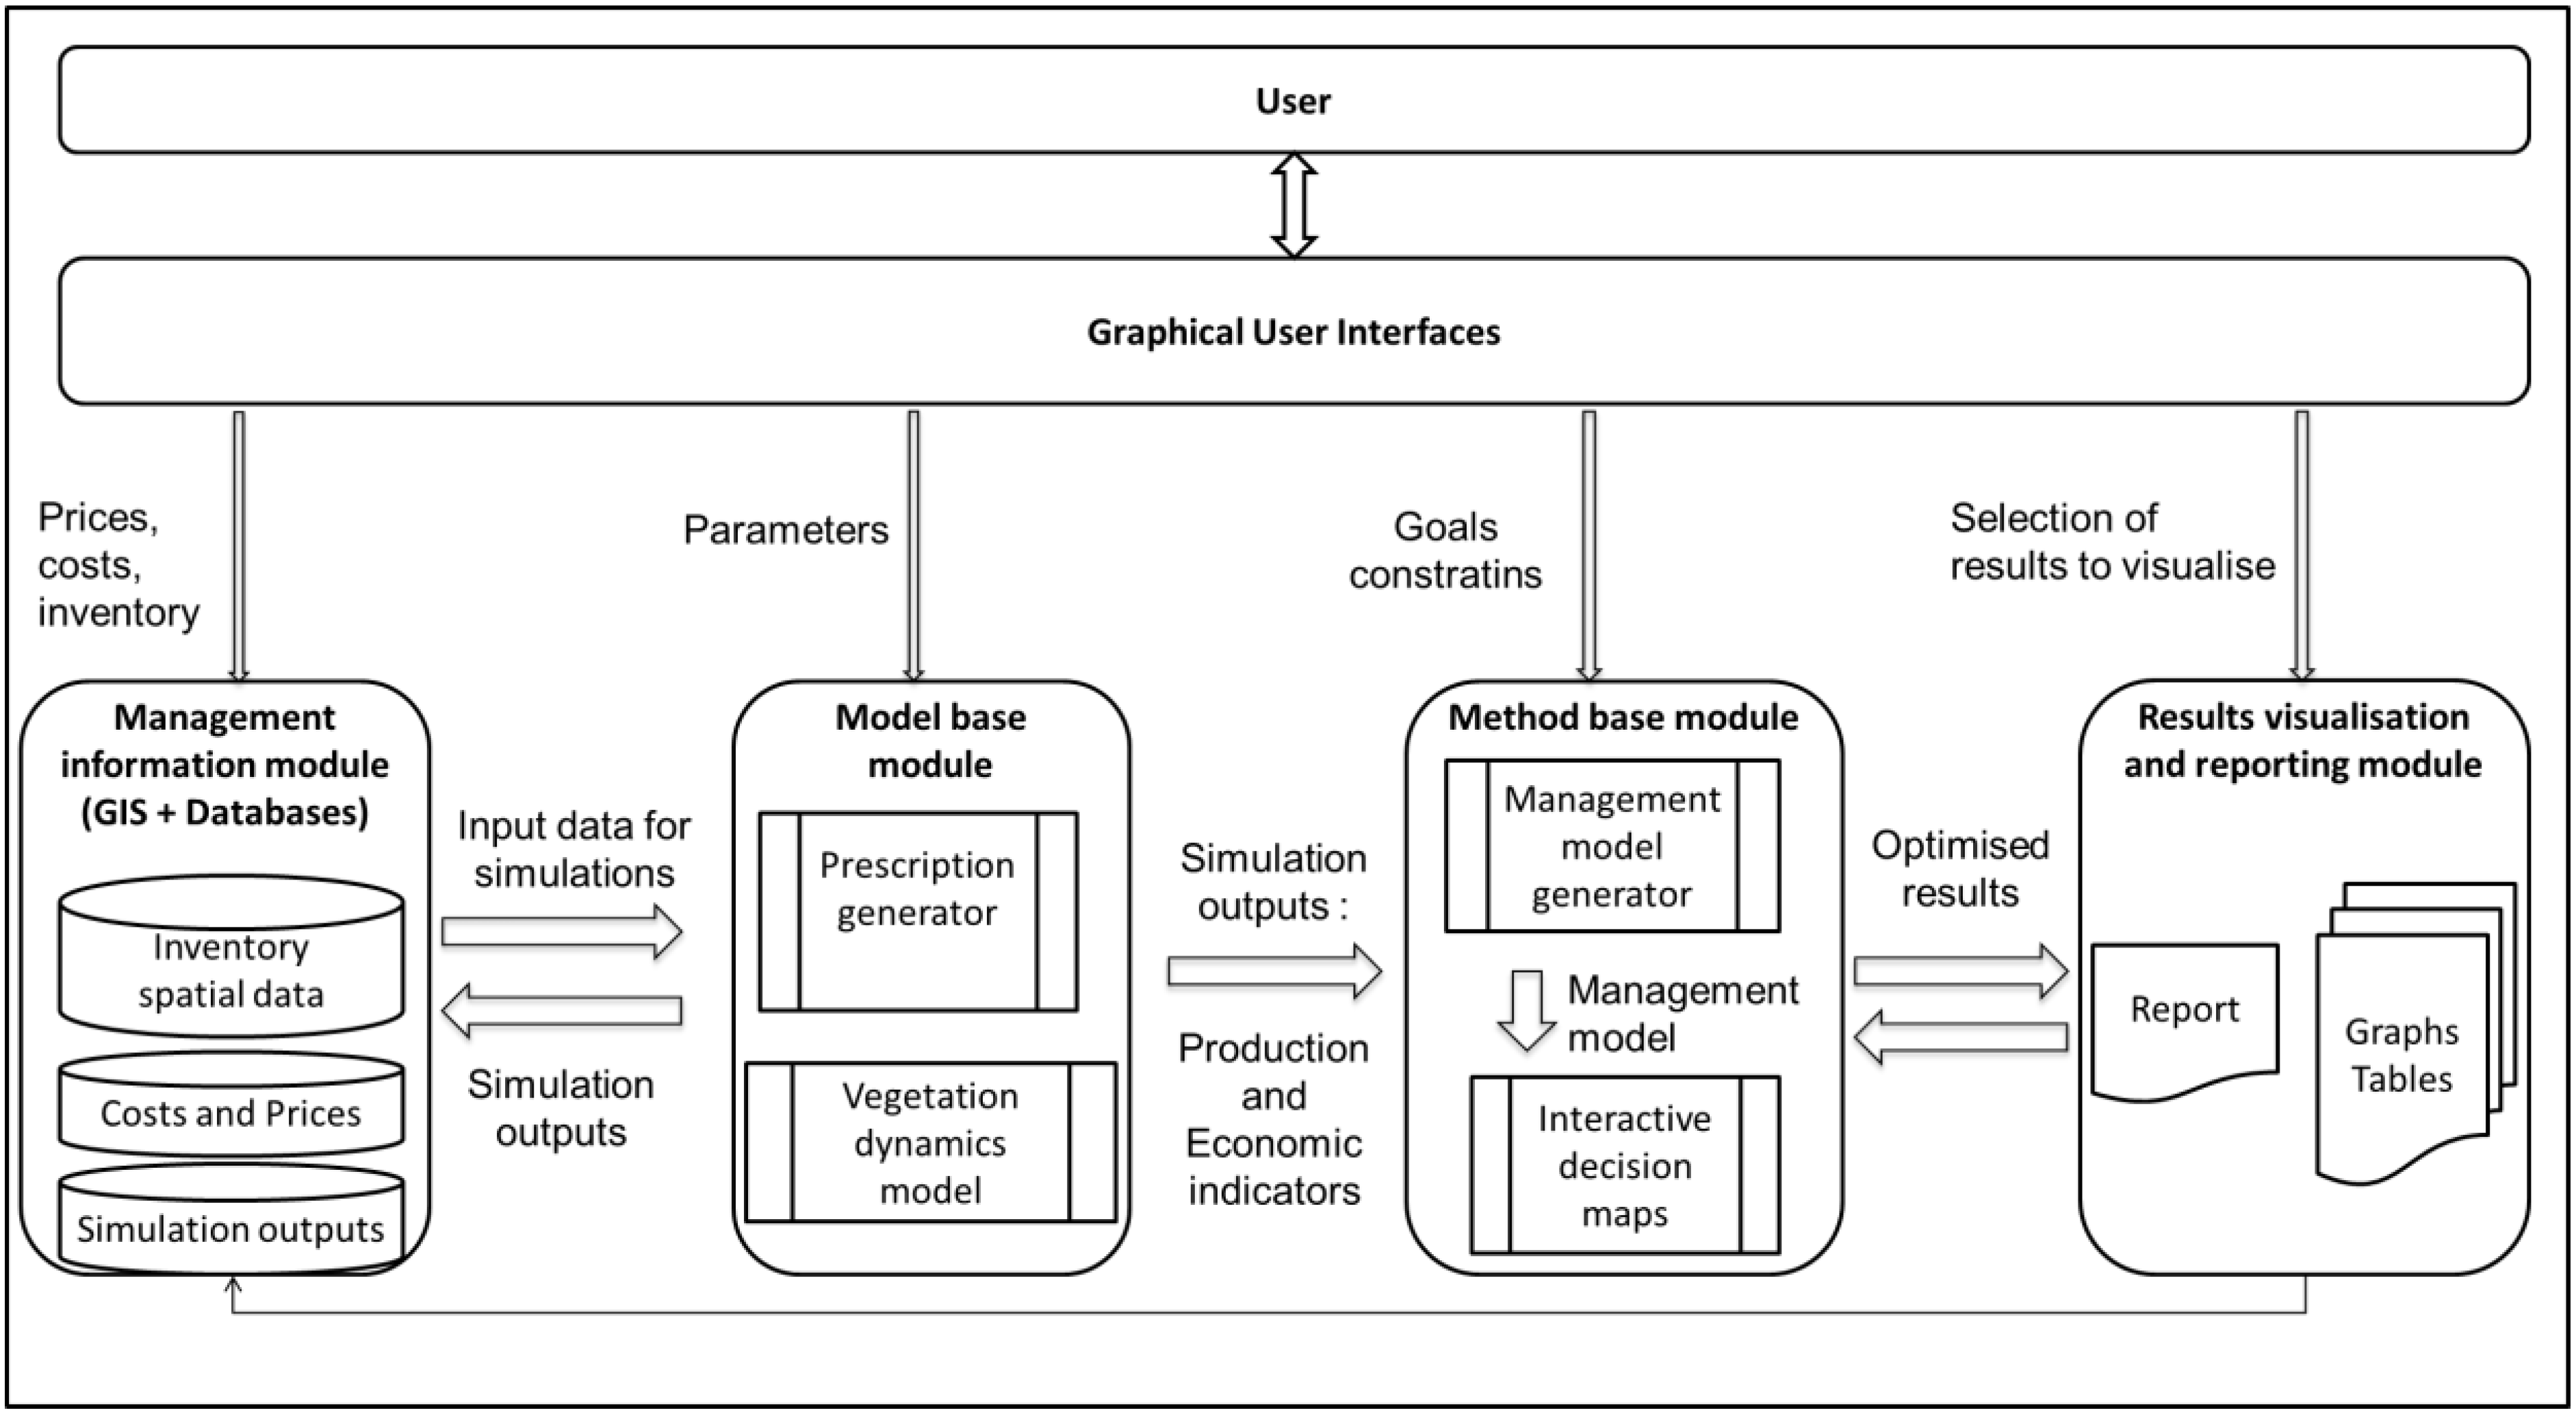
12] described the typical DSS architecture with a specific reference to Portuguese forest ecosystems. In summary, a typical DSS is a multicomponent system with geographical and vegetation projection functionalities as well as various combinations of models and optimization techniques, supported by Database Management Systems (DBMS) and accessed by spatial and graphical user interfaces [
13,
14]. The IT environment and DBM have been evolving from stand-alone/MS Access to web-based/.NET or Java/SQL. The methods base may include a freeware solver (e.g., LP Solve, GNU Linear Programming Kit—GLPK), a commercial solver (e.g., CPLEX), or meta-heuristics, such as Simulated Annealing, Genetic Algorithms, Random Search, or other case-specific heuristics. Furthermore, it is designed so that trade-offs between criteria are checked by comparing the outputs from alternative management planning scenarios. This analysis is conducted by checking scenario-specific reports provided by the graphical user interface. Nevertheless, no specific functionality is included to facilitate the assessment of the trade-offs between criteria by forest stakeholders. This prompted research into an approach to integrate an explicit trade-off assessment functionality in multiple-criteria DSS.
Typically, individual forest stakeholders’ decisions reflect unilateral perceptions of the forest sector, often based on imperfect and unshared information [
15]. Nevertheless, the lack of acknowledgement of trade-offs between management planning and/or policy analysis criteria may lead to unnecessary conflicts and sub-optimal resources utilization [
16,
17]. Huang
et al. [
18] presented a review of multi-criteria decision analysis (MCDA) in environmental problems. They conclude that the dominant methods are the multi-attribute utility theory (MAUT), outranking, and the analytical hierarchy process. However, they acknowledge the limitations and difficulties of these methods. A system that may integrate an explicit trade-off assessment functionality to promote and facilitate negotiation and participation of multiple stakeholders is needed in order to improve and render more transparent the decision making process.
Borges
et al. [
19] presented an application of the Feasible Goals Method (FGM) technique to approximate the Pareto frontier for a multi-objective problem. The Pareto frontier comprises points that cannot be improved in one criterion without worsening at least the value of one of the remaining criteria. It thus provides the information needed for the assessment of trade-offs between ecosystem management criteria. Borges
et al. [
19] presented the mathematical formulation and the approach but research on how to integrate this technique into a DSS was not performed. The current research explores the potential of integrating this technique in decision support architectures (e.g., [
6,
13]) to solve multipurpose ecosystem management planning problems. Specifically, it encompasses the development and integration of a module that encapsulates the FGM technique in a forest ecosystem management decision support system to build interactive and animated visualization maps (
i.e., decision maps) of the Pareto frontier [
20,
21]. It further encompasses research on the linkage of this module within the DSS and the design of interfaces with end users. The decision-maker can investigate these animated visualization maps in an interactive way to assess trade-offs between criteria and select an appropriate criteria combination directly in the computer screen. This is especially important in complex ecosystem management problems where multiple decision-makers and stakeholders are involved. The use of this technique in a user-friendly DSS may support negotiation and consensus building between decision-makers and other forest stakeholders. However, this technique has not been implemented in currently available forestry DSSs. In this context, this paper focuses on the development and the demonstration of the potential use of a DSS functionality to assess the trade-offs between ecosystem management planning and/or policy analysis criteria, which may be very useful to facilitate communication, cooperation, negotiation, and information sharing between stakeholders with a wide range of preferences and interests.
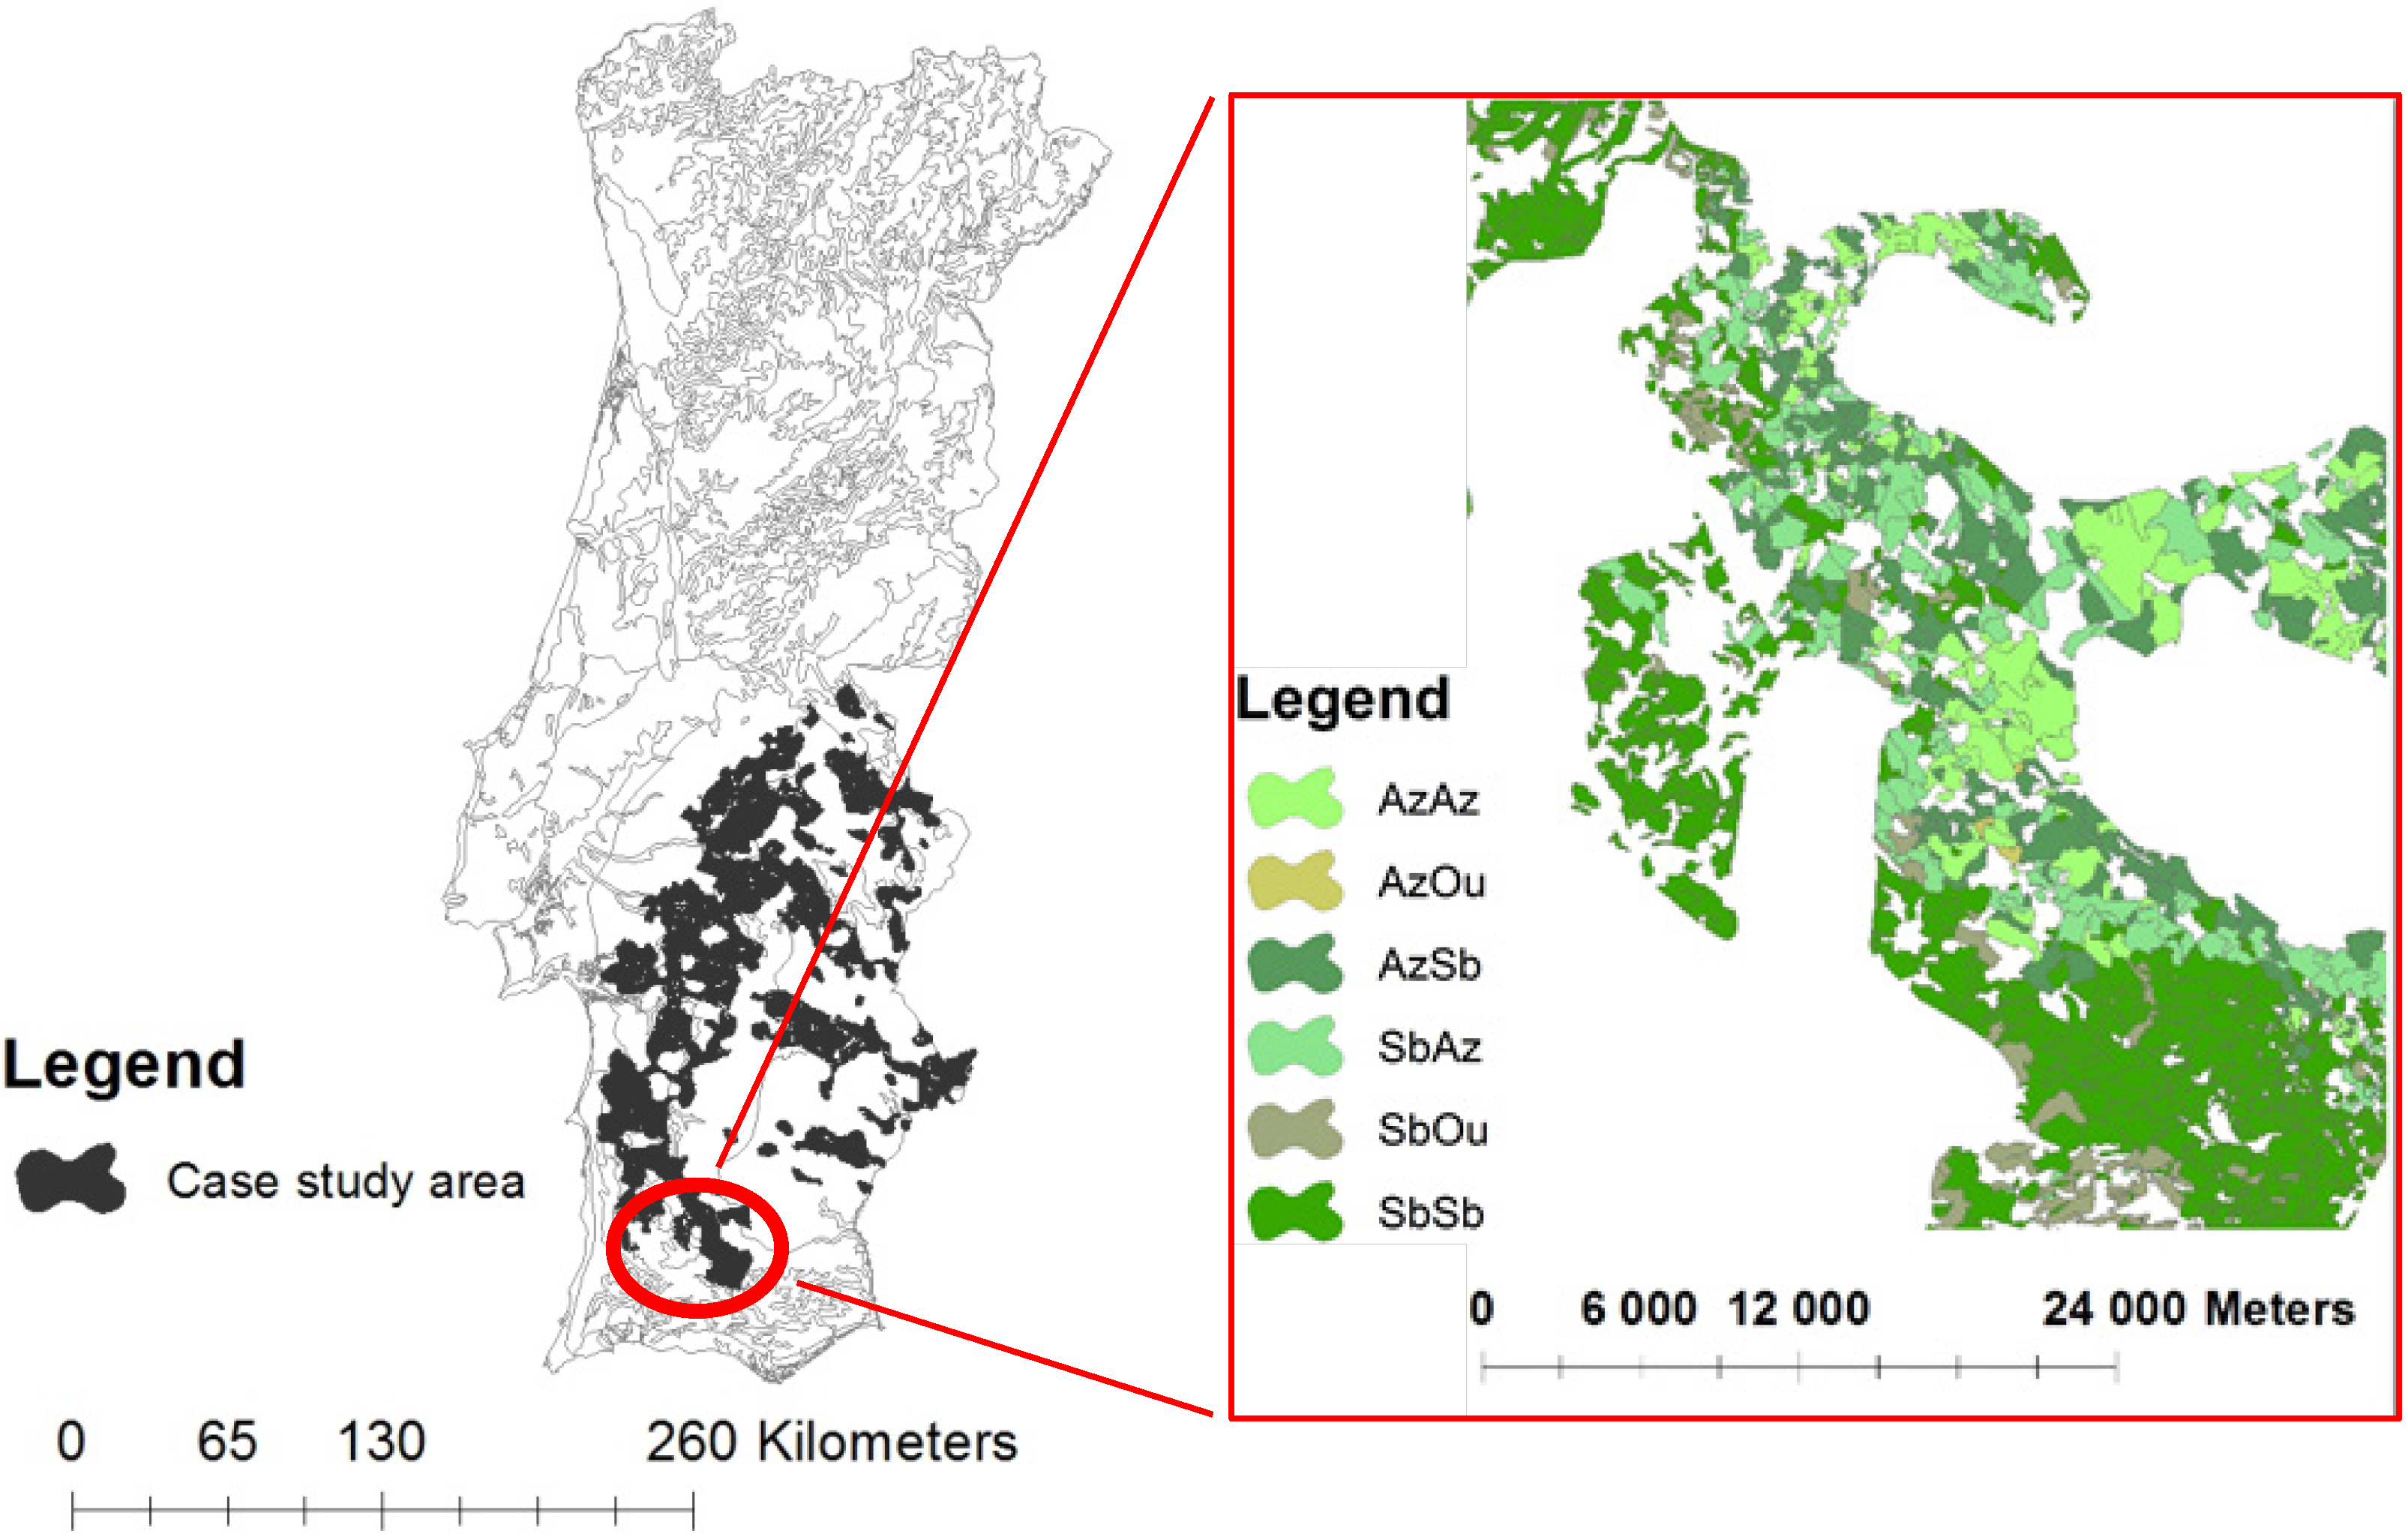
A large-scale application encompassing multiple-criteria forest ecosystem management planning scenarios in Alentejo (
circa 1 million ha) in Southern Portugal is used for illustrating the potential of the new DSS functionality to support the analysis of trade-offs between criteria (from three to seven criteria) and the selection of forest-level policies that address strategic multi-objective forest planning goals in a Mediterranean forest ecosystem. The paper is structured as follows. First, the case study area is presented (
Section 2.1). Second, the architecture of the DSS and its modules are explained in detail (
Section 2.2,
Section 2.3,
Section 2.4 and
Section 2.5). Third, a description of a hypothetical decision situation is presented, along with the case study methodology (
Section 2.6). Fourth, the results section (
Section 3) illustrates how the DMs may explore the information provided by the DSS in order to make the final decision. Finally, a critical discussion and final conclusions are presented (
Section 4).
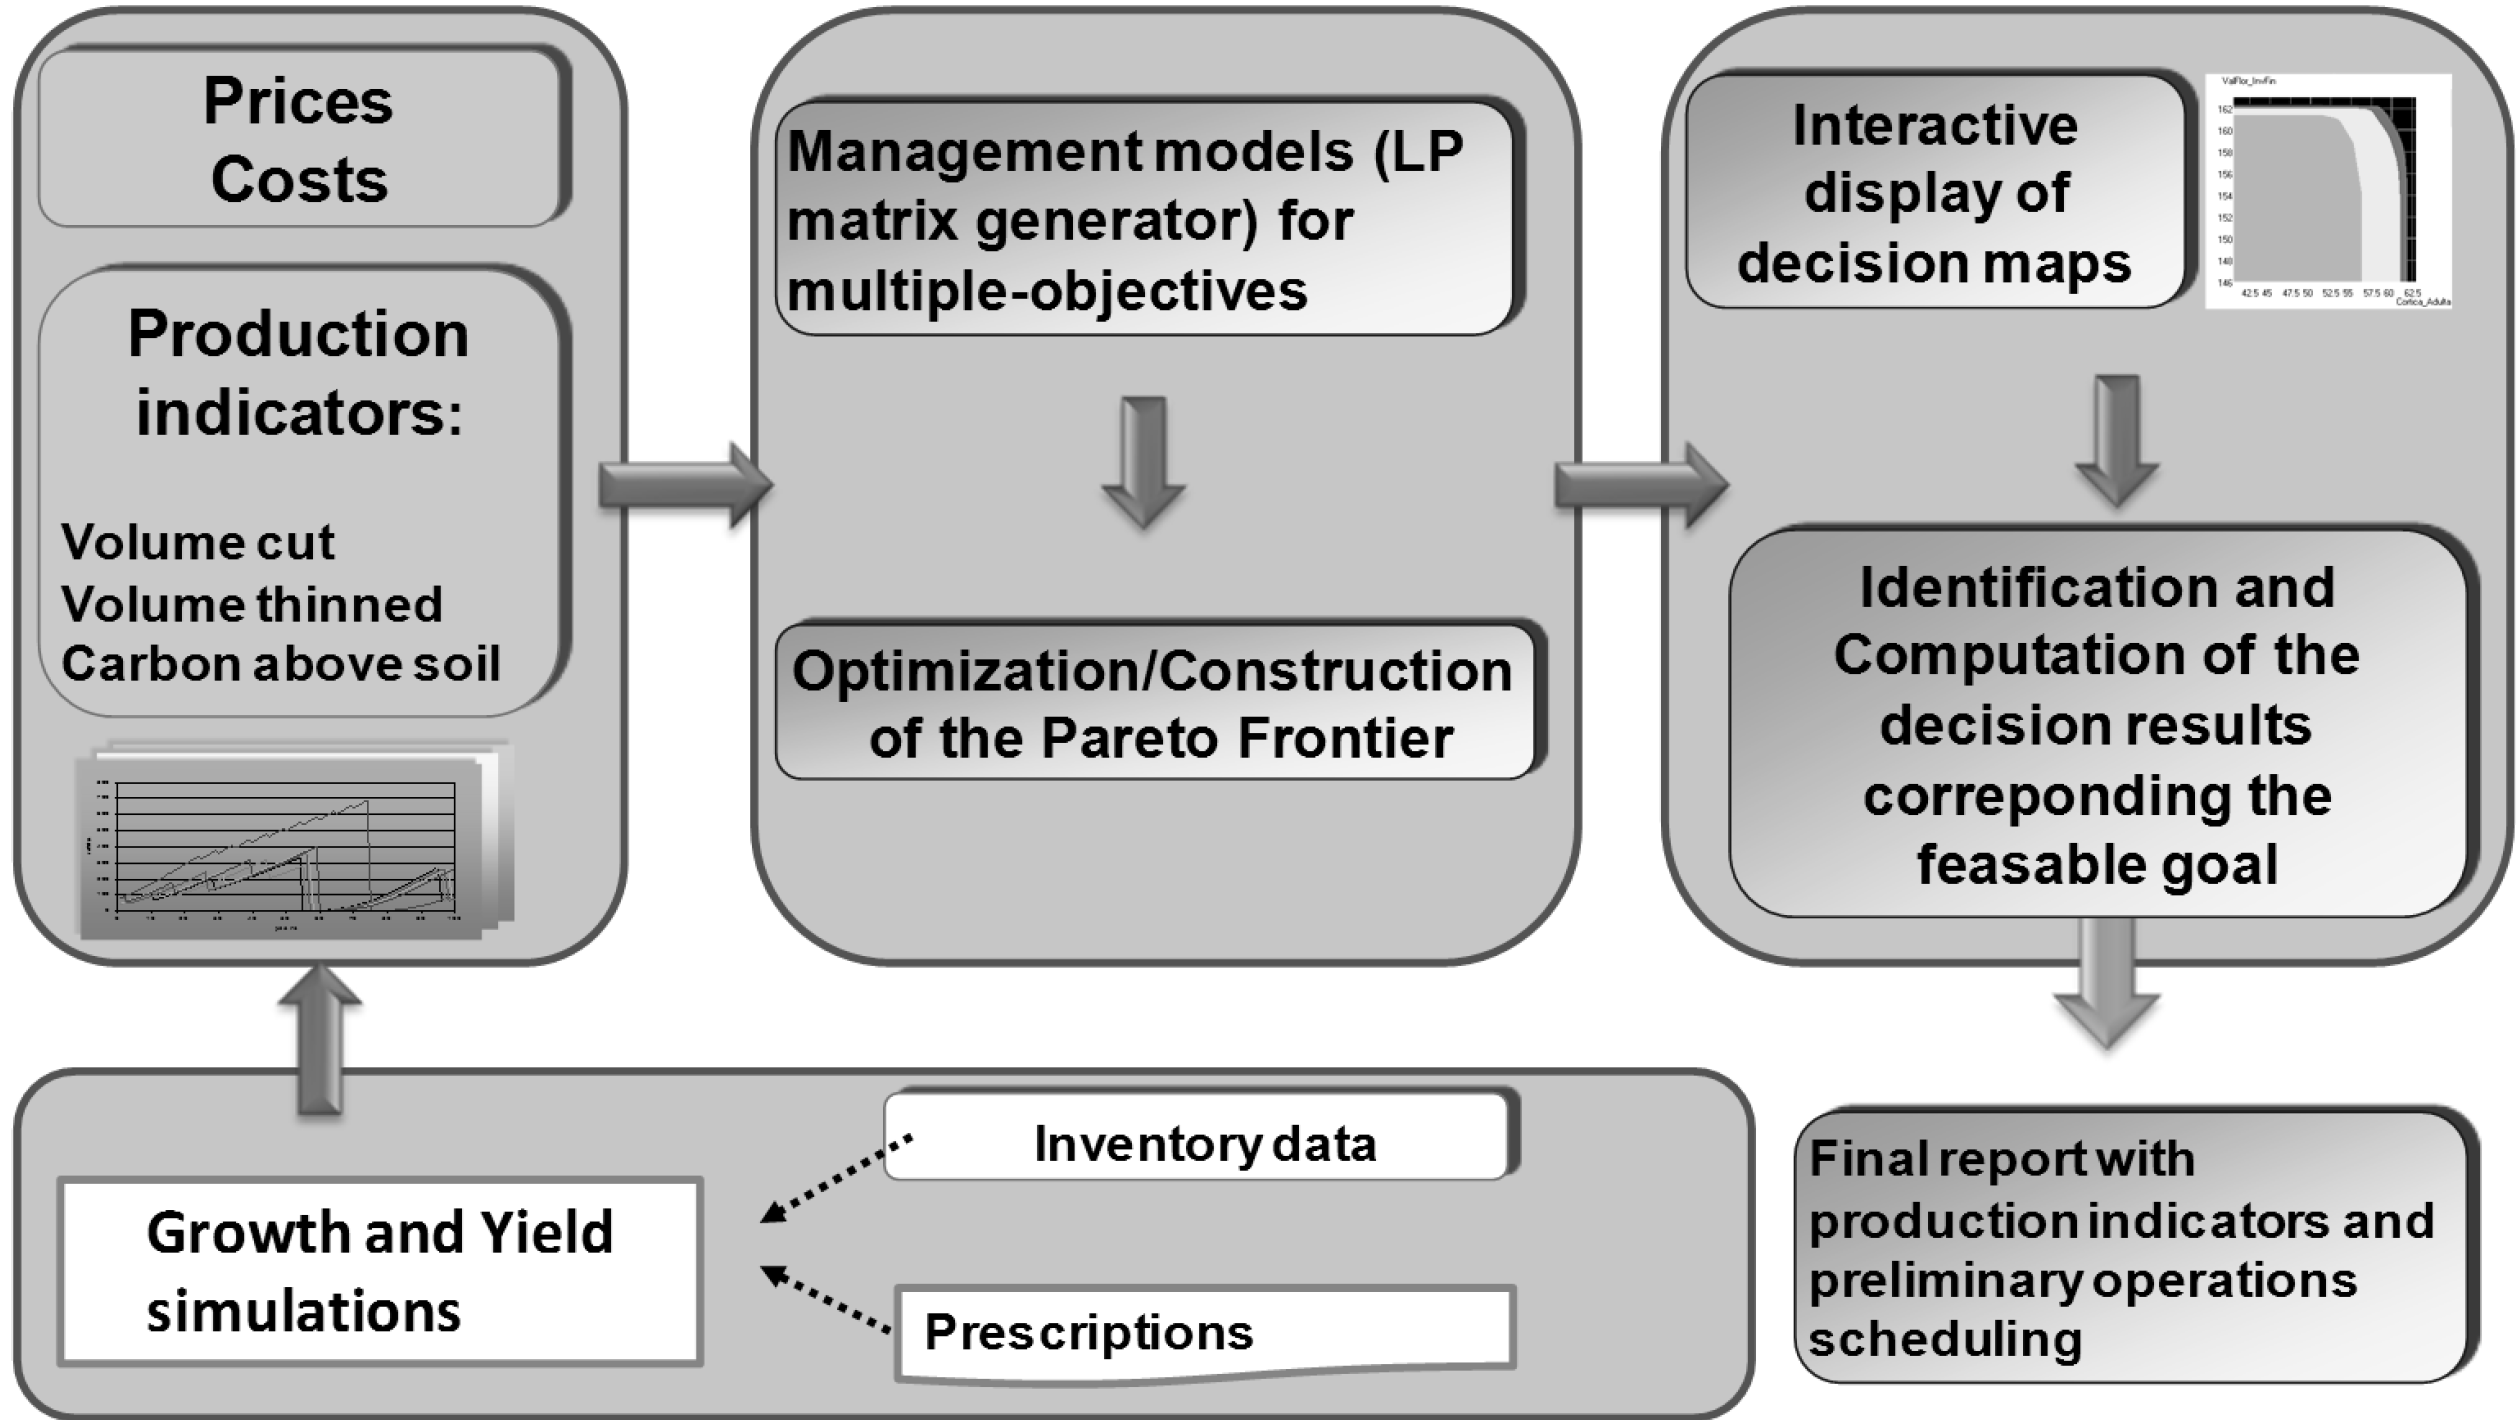
3. Results
A preliminary analysis maximizing net present value without using regularity constraints revealed that the total NPV (including soil expectation value) for the study area was 79.6 × 10⁸ € over the 50-year planning horizon. Achieving this total income resulted in wide fluctuations of cork production (e.g., up to 100% in the last period). The maximum value for carbon was 30 × 108 kg and for cork yield it was 74.58 × 10⁷ kg.
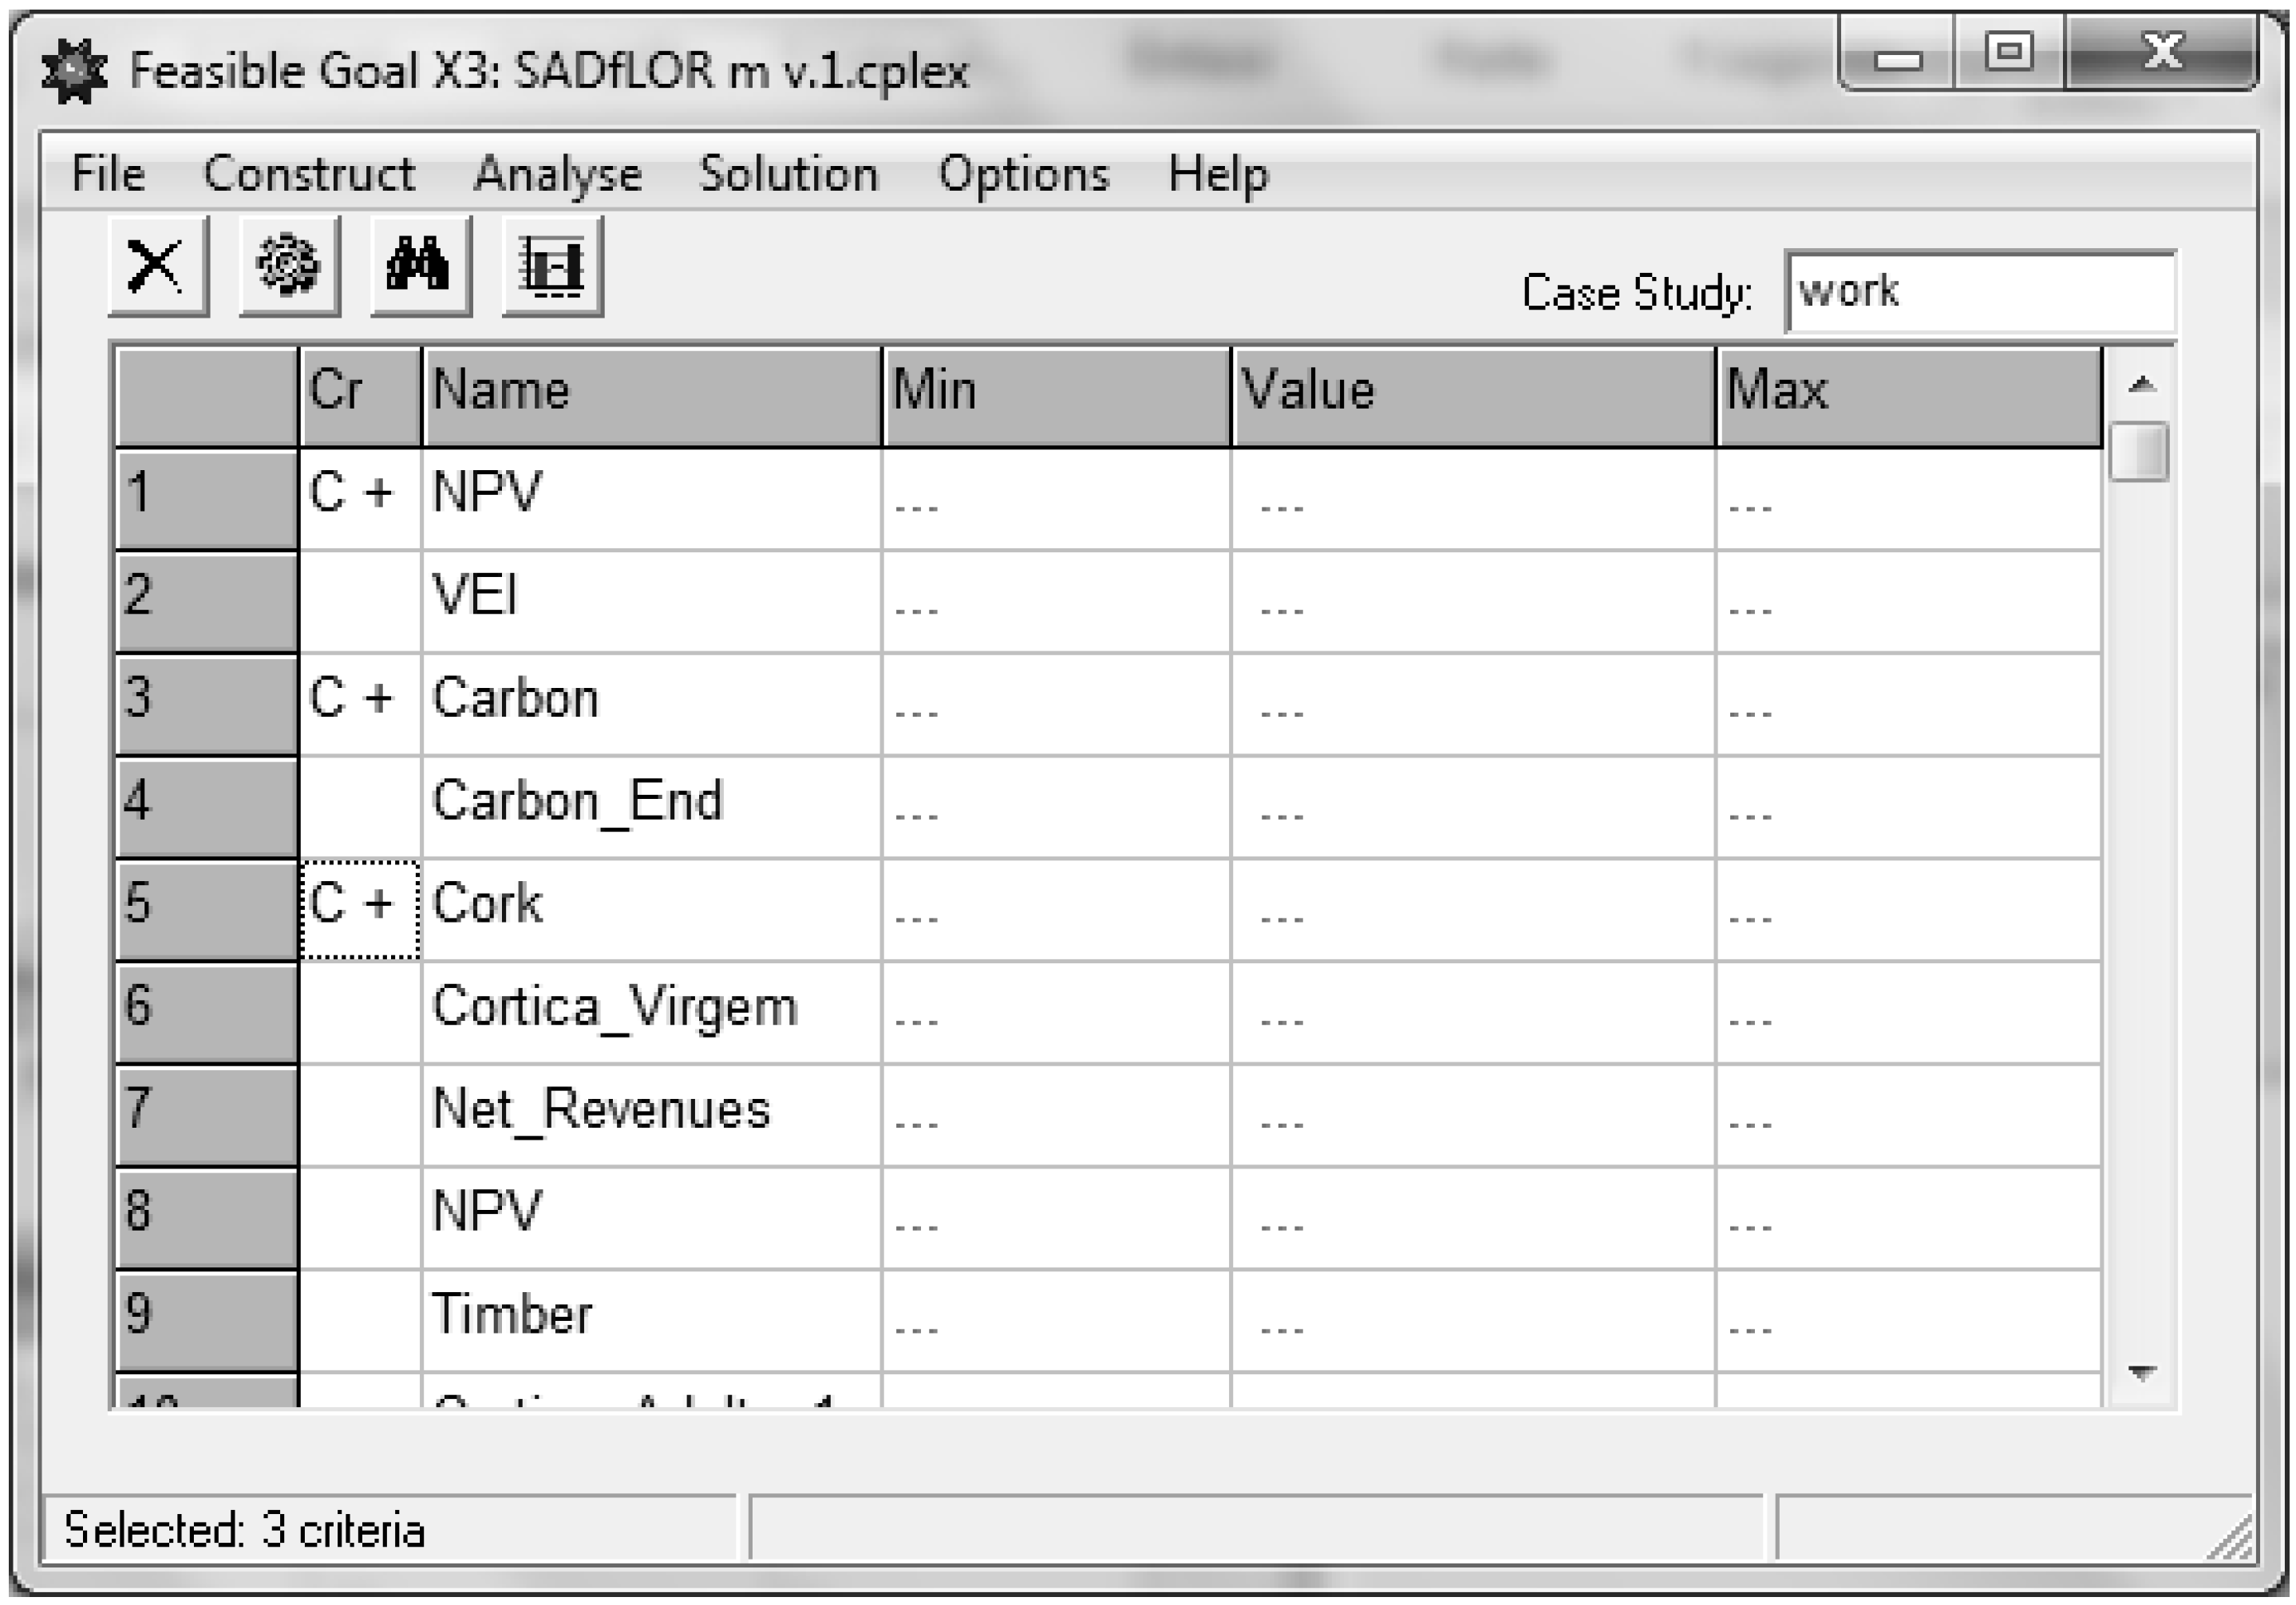
The system generated trade-off information for the multi-objective test problem. The interactive decision maps module produced several bi-criteria maps (
Figure 7). These maps showed that NPV and total adult cork production were mostly complementary objectives and only competed at very high cork production levels (
Figure 7A). So it was almost possible to find an optimum value for both criteria. For this reason, for further constructions of frontiers with more objectives the DM used either NPV or cork. On the other hand, cork and timber are competing objectives as well as carbon and wood, and carbon and NPV, showing a trade-off curve.
Figure 7.
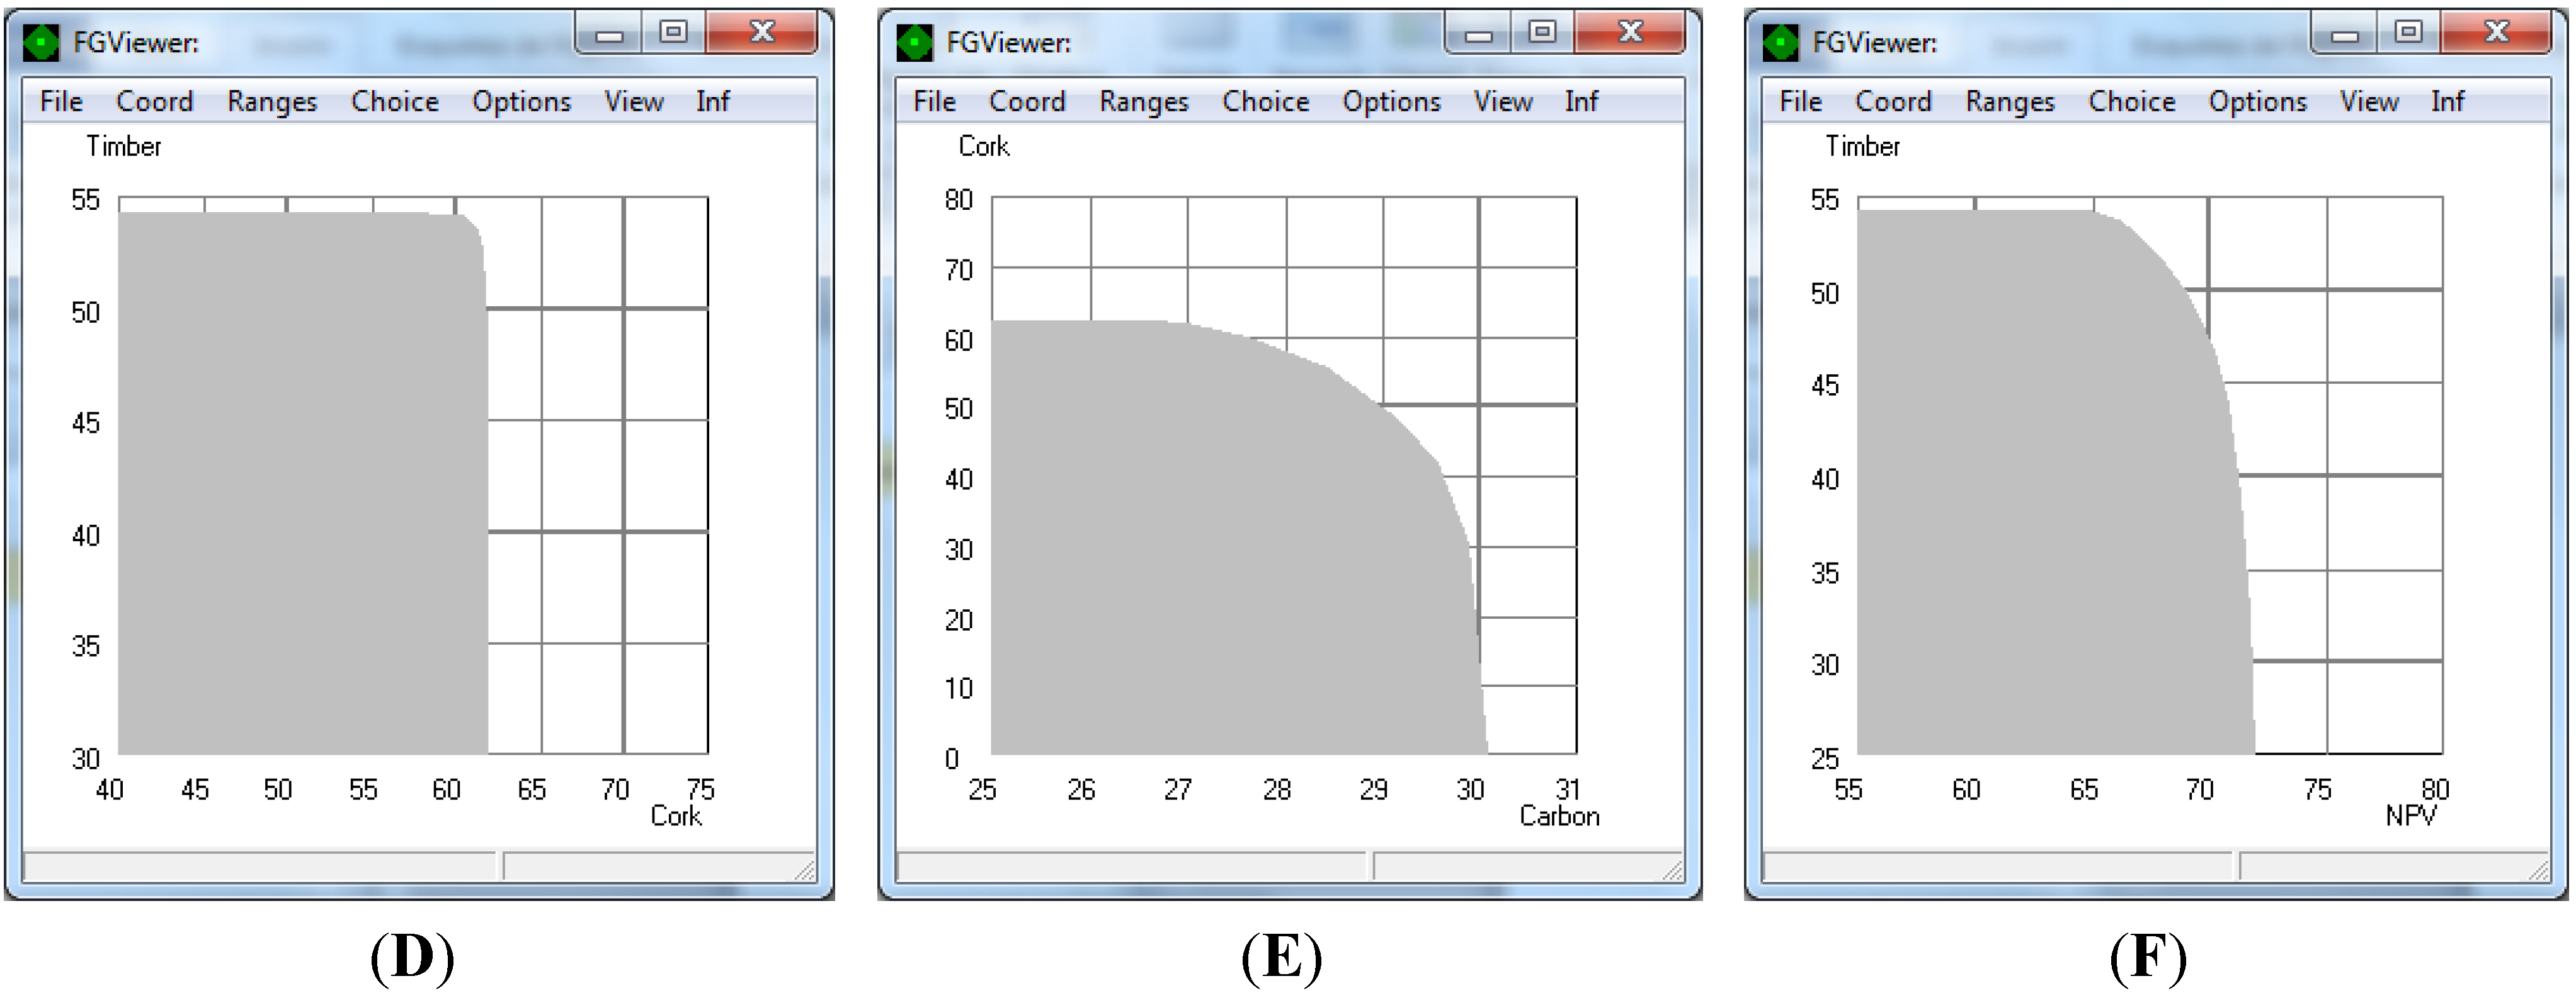
Two-dimensional decision maps displaying the efficient frontier of our planning problem without considering regularity constraints. The figure shows the trade-off between: (A) cork supply and net present value, (B) timber yield and cork supply, (C) timber yield and carbon stock, (D) cork supply and carbon stock. The units of the graph are: 107 kg of cork, 108 € in the case of NPV (net present value), 108 kg of carbon, and 105 m3 of timber.
Figure 7.
Two-dimensional decision maps displaying the efficient frontier of our planning problem without considering regularity constraints. The figure shows the trade-off between: (A) cork supply and net present value, (B) timber yield and cork supply, (C) timber yield and carbon stock, (D) cork supply and carbon stock. The units of the graph are: 107 kg of cork, 108 € in the case of NPV (net present value), 108 kg of carbon, and 105 m3 of timber.
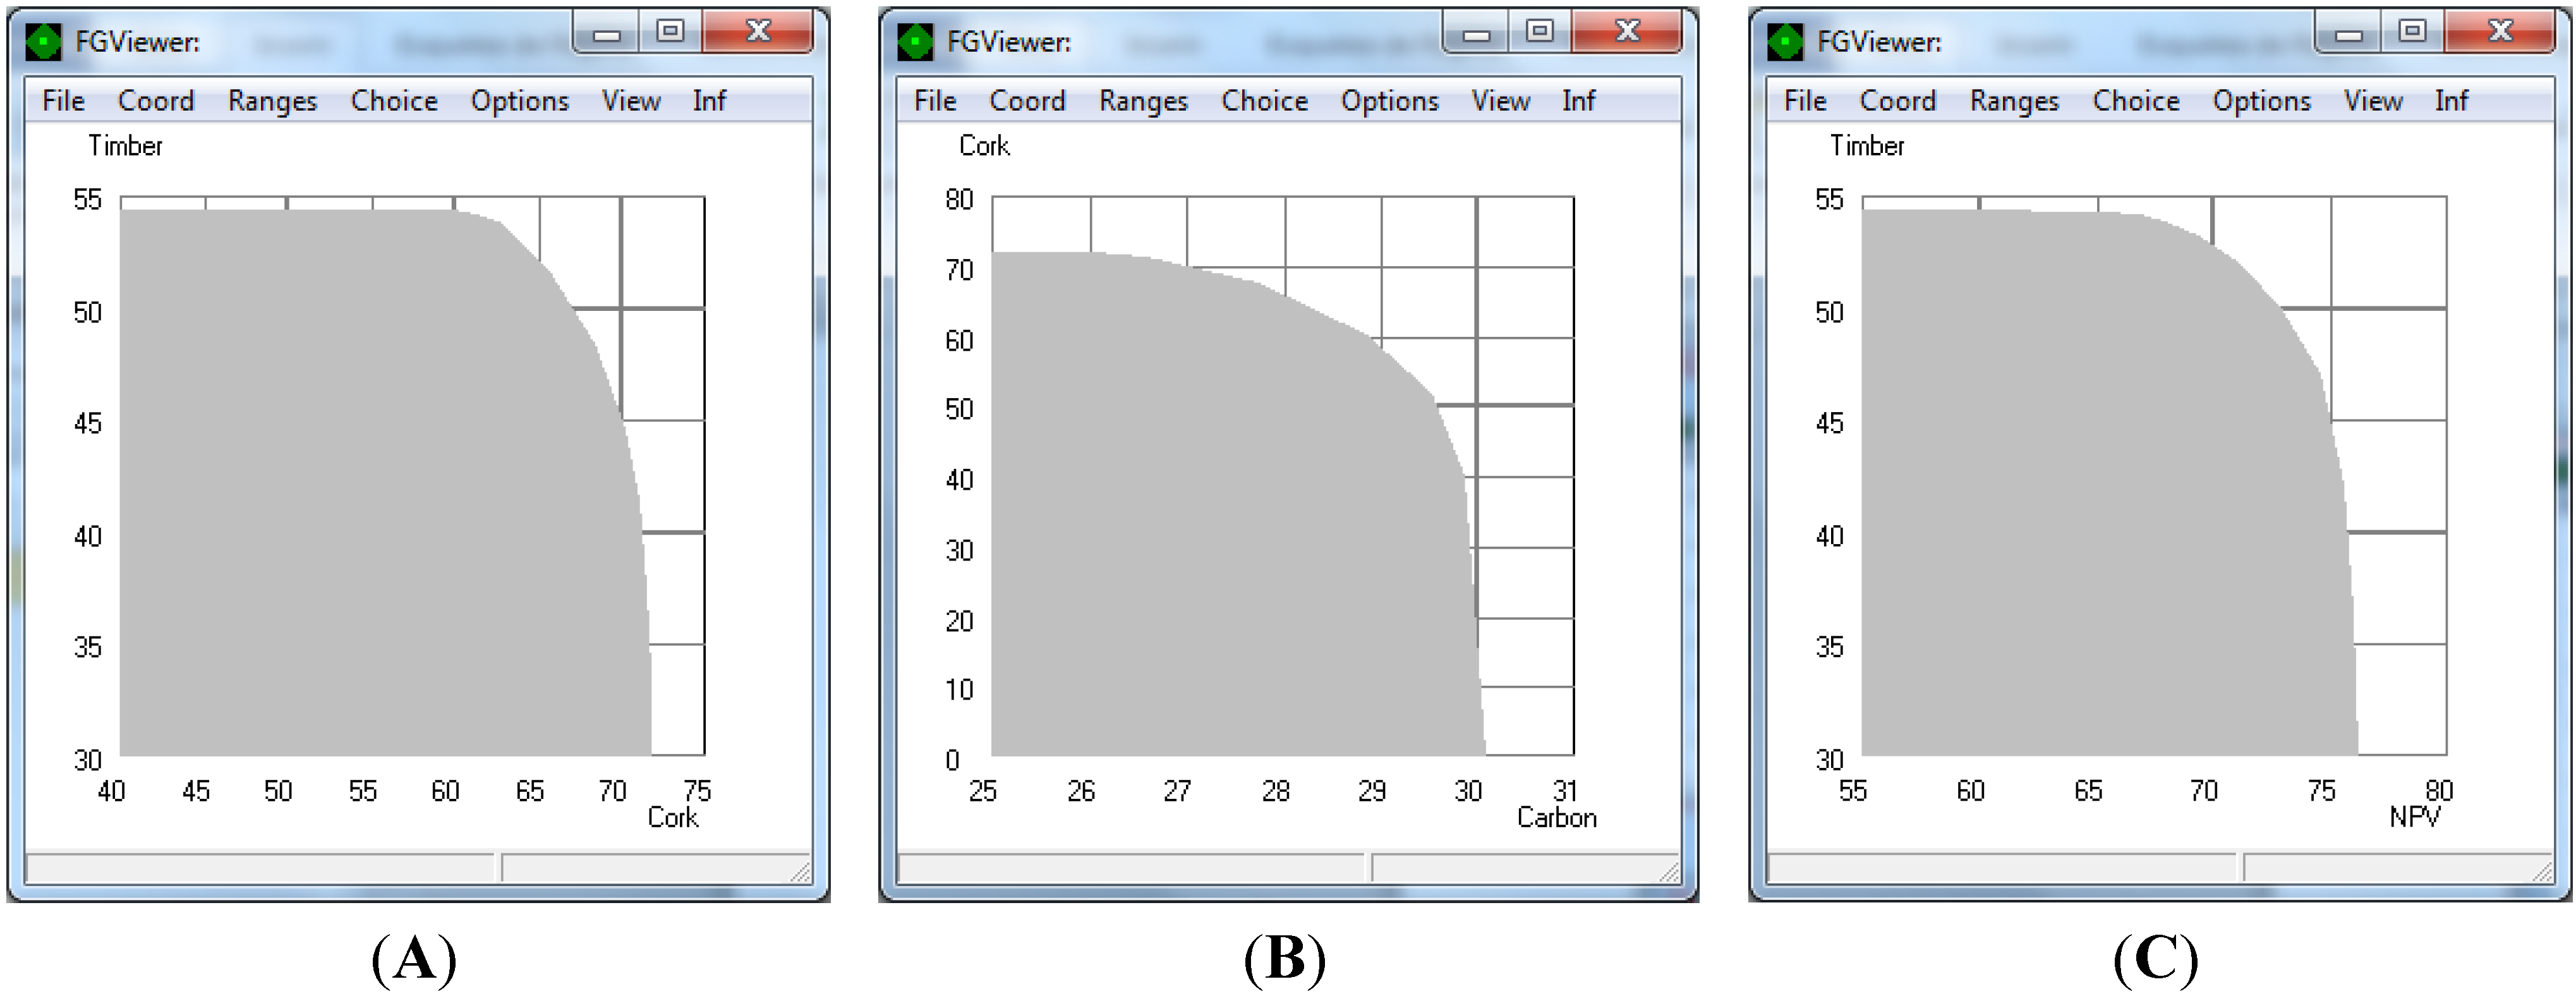
The trade-off information highlighted the competitive feature of the relationship between timber yield and cork supply (
Figure 7B) as well as between the net present value and the carbon stock criteria (
Figure 7C). Carbon increased up to 27.6 × 10
8 kg for lower values of NPV. The relation between cork and carbon was not so competitive (
Figure 7D) as cork extraction does not lead to the removal of the tree.
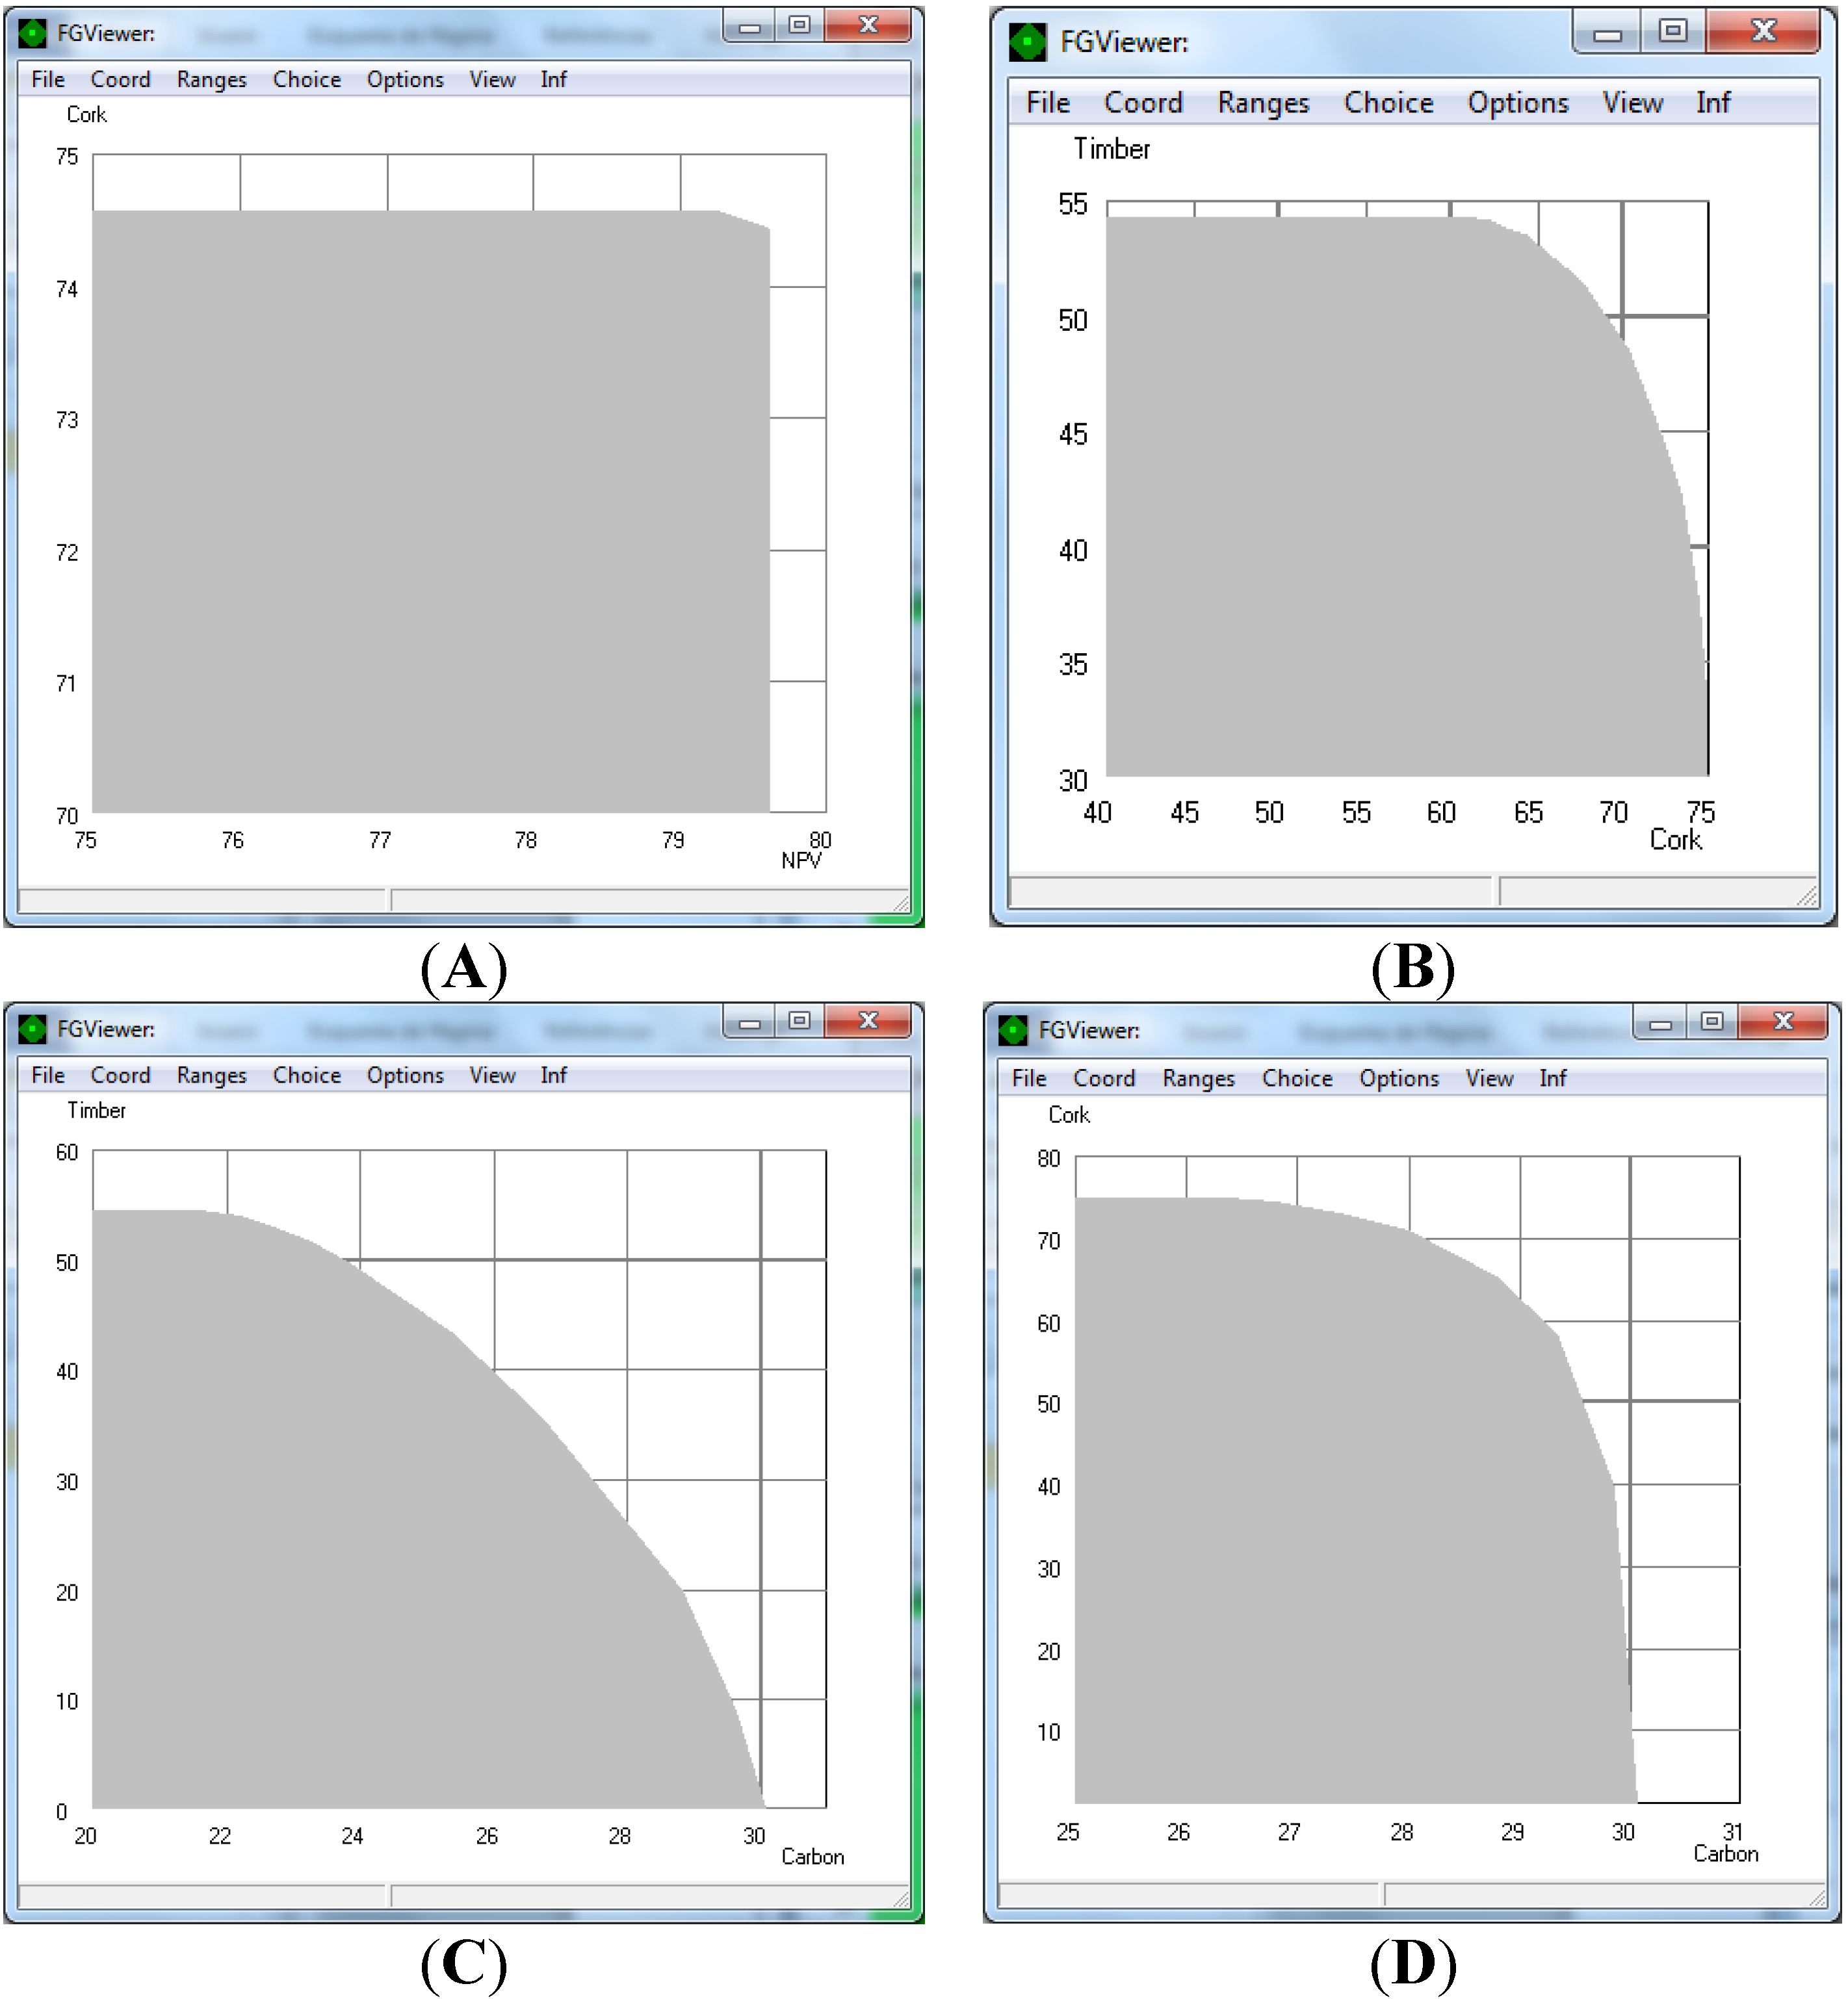
When the solutions were constrained to a certain level of regularity of cork availability (allowing the cork production to fluctuate between certain levels among periods) a decrease in both cork production and NPV was observed. The more regularity was sought, the more reduction in both criteria. In this context, when constraining carbon and wood and cork yield fluctuations to a maximum of 30% between periods, NPV decreased from around 80× 10
8 to 75.3 × 10
8 € and cork yield decreased from around 75 × 10
7 to 71.5 × 10
7 kg. As there was not much difference between the unconstrained solutions, a more strict regularity constraint was tested (
Figure 8A,D). Nevertheless, cork even-flow constraints led to an increase of both the carbon stock and the value of the inventory at the end of the planning horizon.
NPV optimization constrained by a maximum 20% fluctuation deviation in periodic adult cork supply led to a significant reduction of the NPV (
i.e., 10% compared to that of the unconstrained model). Compared to the unconstrained scenario, a restriction of cork flow fluctuation to a maximum of 20% increased carbon stock and final inventory at the end of the planning period by 8% and 15%, respectively. In this case, NPV and cork yield were reduced to 71 × 10
8 € and 62 × 10
7 kg·C (
Figure 8B,E).
If a 10% regularity constraint was used, the NPV and cork yield were drastically reduced (up to 40%) compared to the potential cork yield. This drastic reduction of incomes was due to the inflexibility in cork management; in this scenario a great part of the area would remain unmanaged in order to accomplish the regularity constraint. This would be highly unreasonable. In addition, as the decision-makers (DMs) are mostly concerned with the total amount of cork supply as well as with its sustainability, it was decided to study the trade-offs between cork yield, wood, and carbon sequestration when the adult cork supply maximum deviation across periods was set to 30%. This was considered an adequate strategic policy by the DMs.
Figure 8.
Two-dimensional decision maps displaying the efficient frontier of our planning problem for the case of 30% (A–C) and 20% (D–F) adult cork even-flow constraints. The units of the graph are: 107 kg of cork, 108 € in the case of NPV (net present value), 108 kg of carbon, and 105 m3 of timber.
This was instrumental to generate further information,
i.e., the three-dimensional decision maps for various values of total cork supply (
Figure 9), for additional trade-off analysis that might help fine-tune the setting of achievement levels.
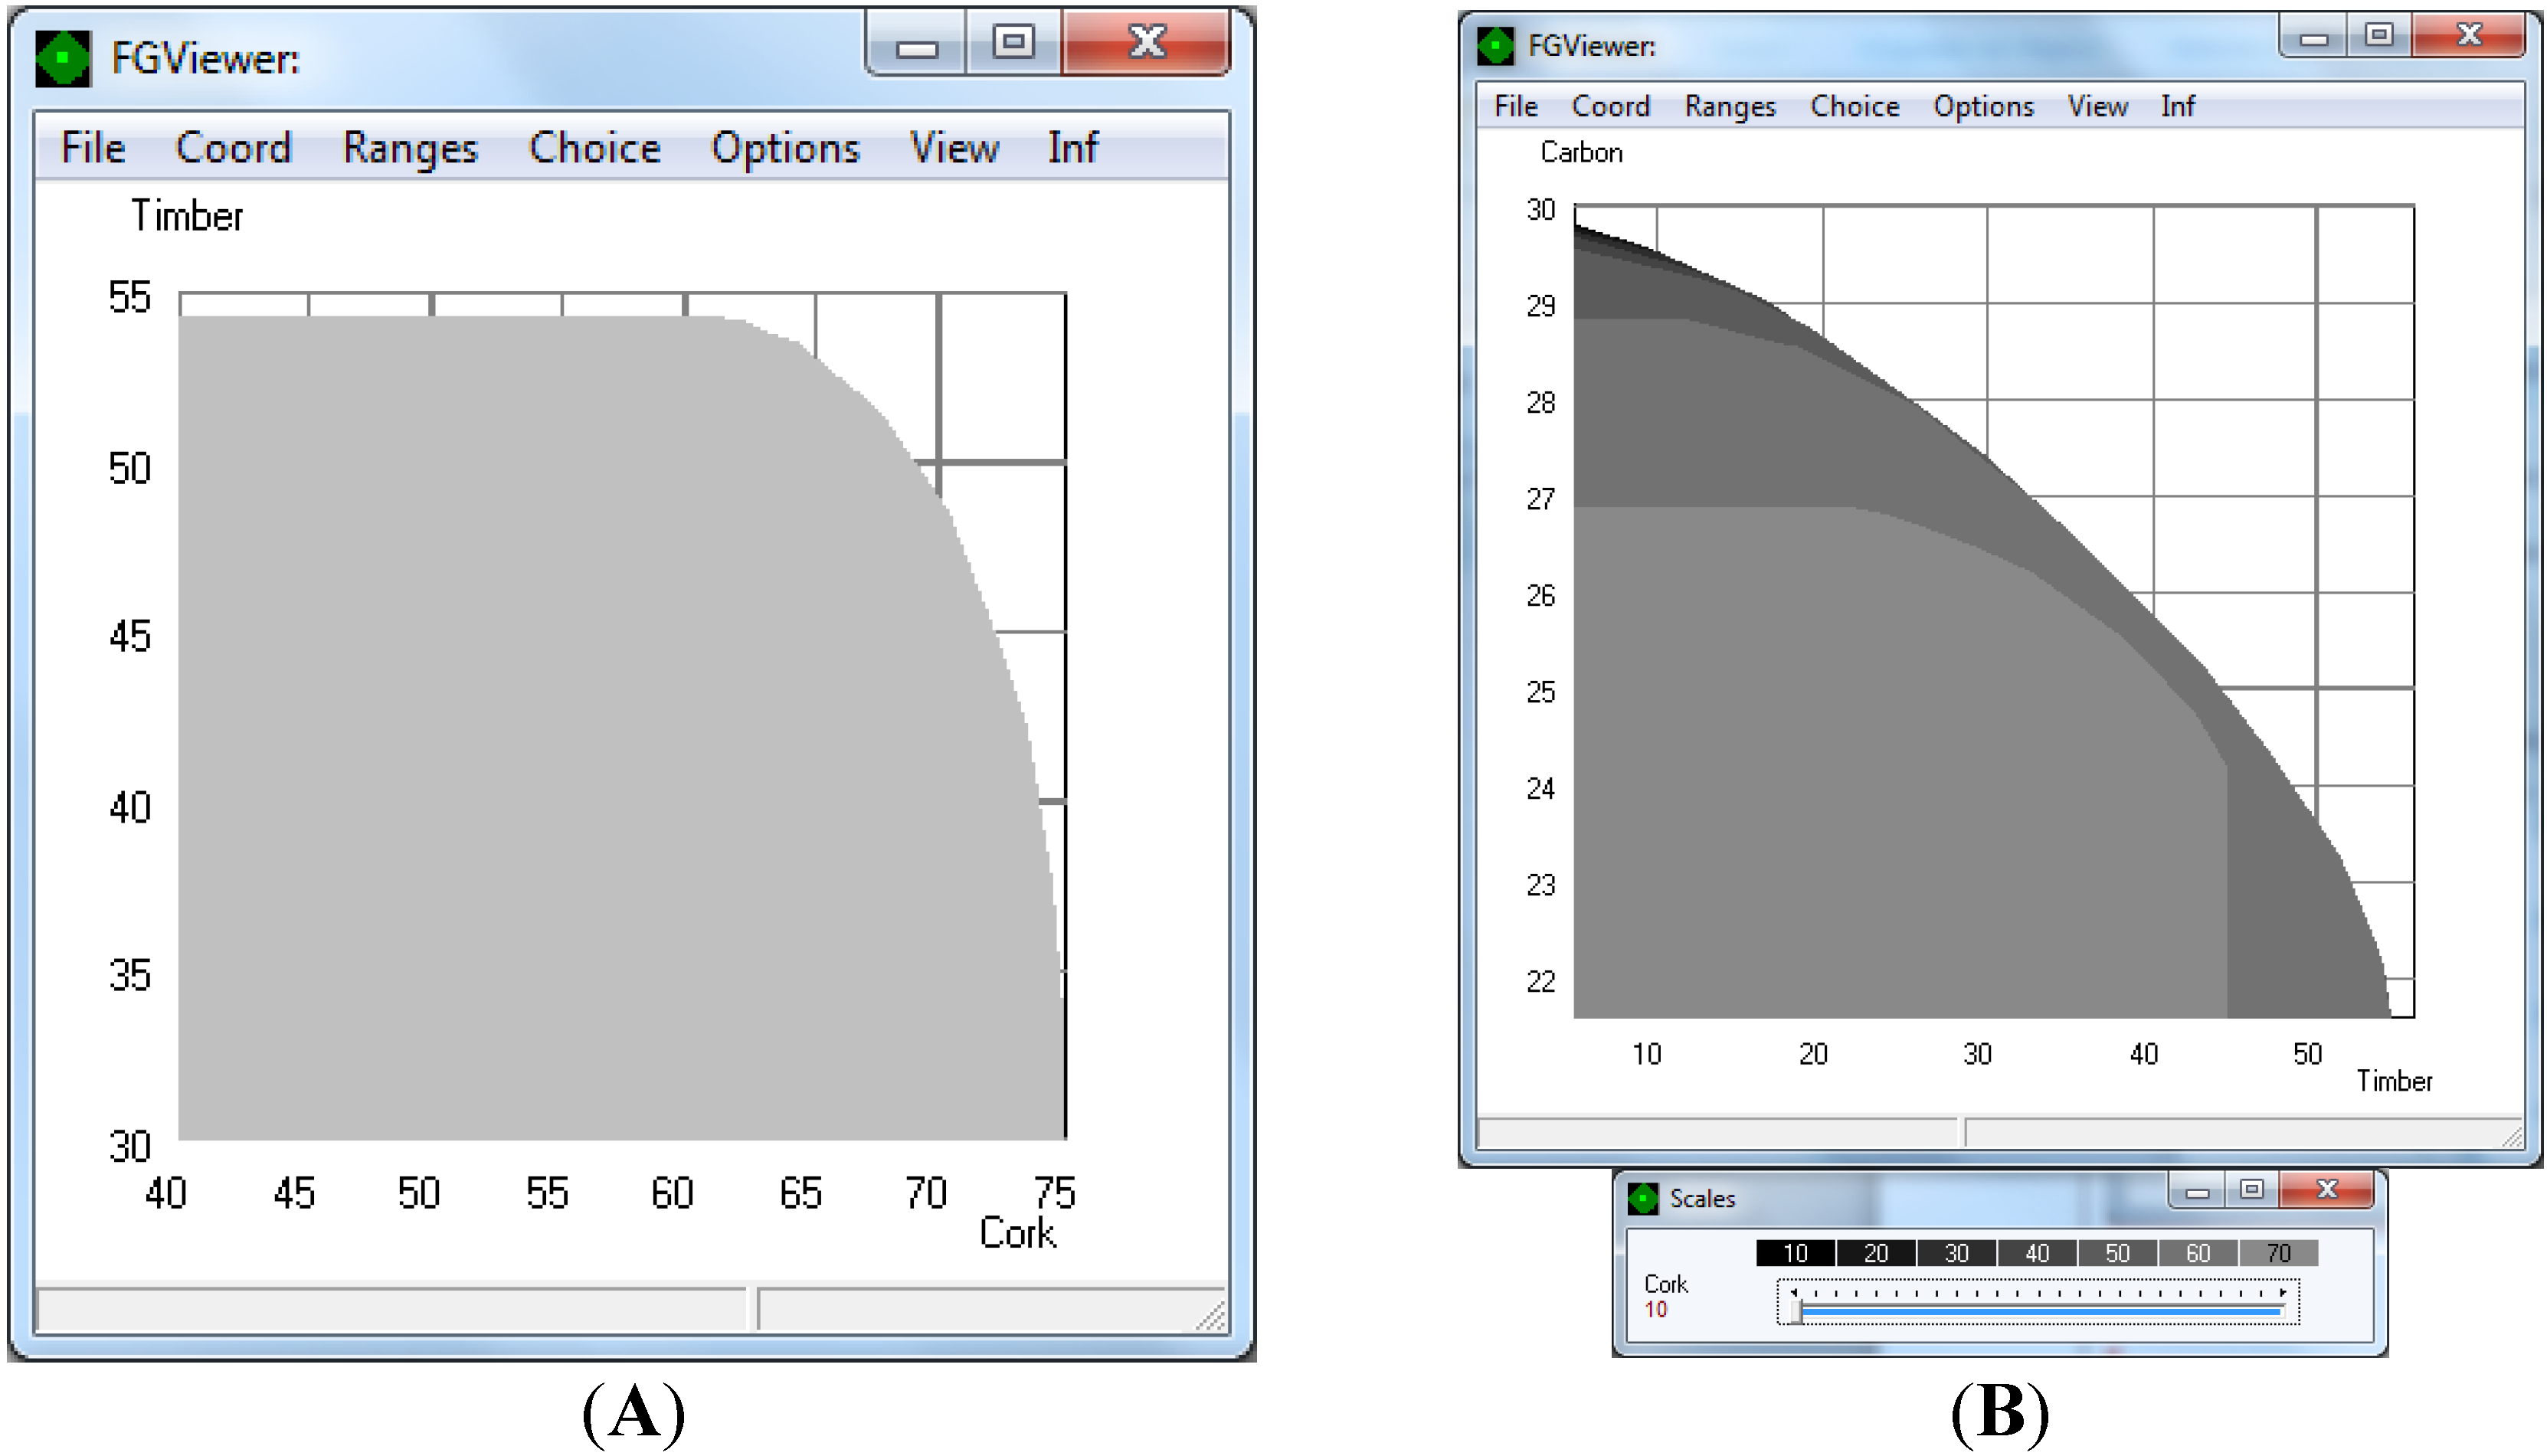
Figure 9.
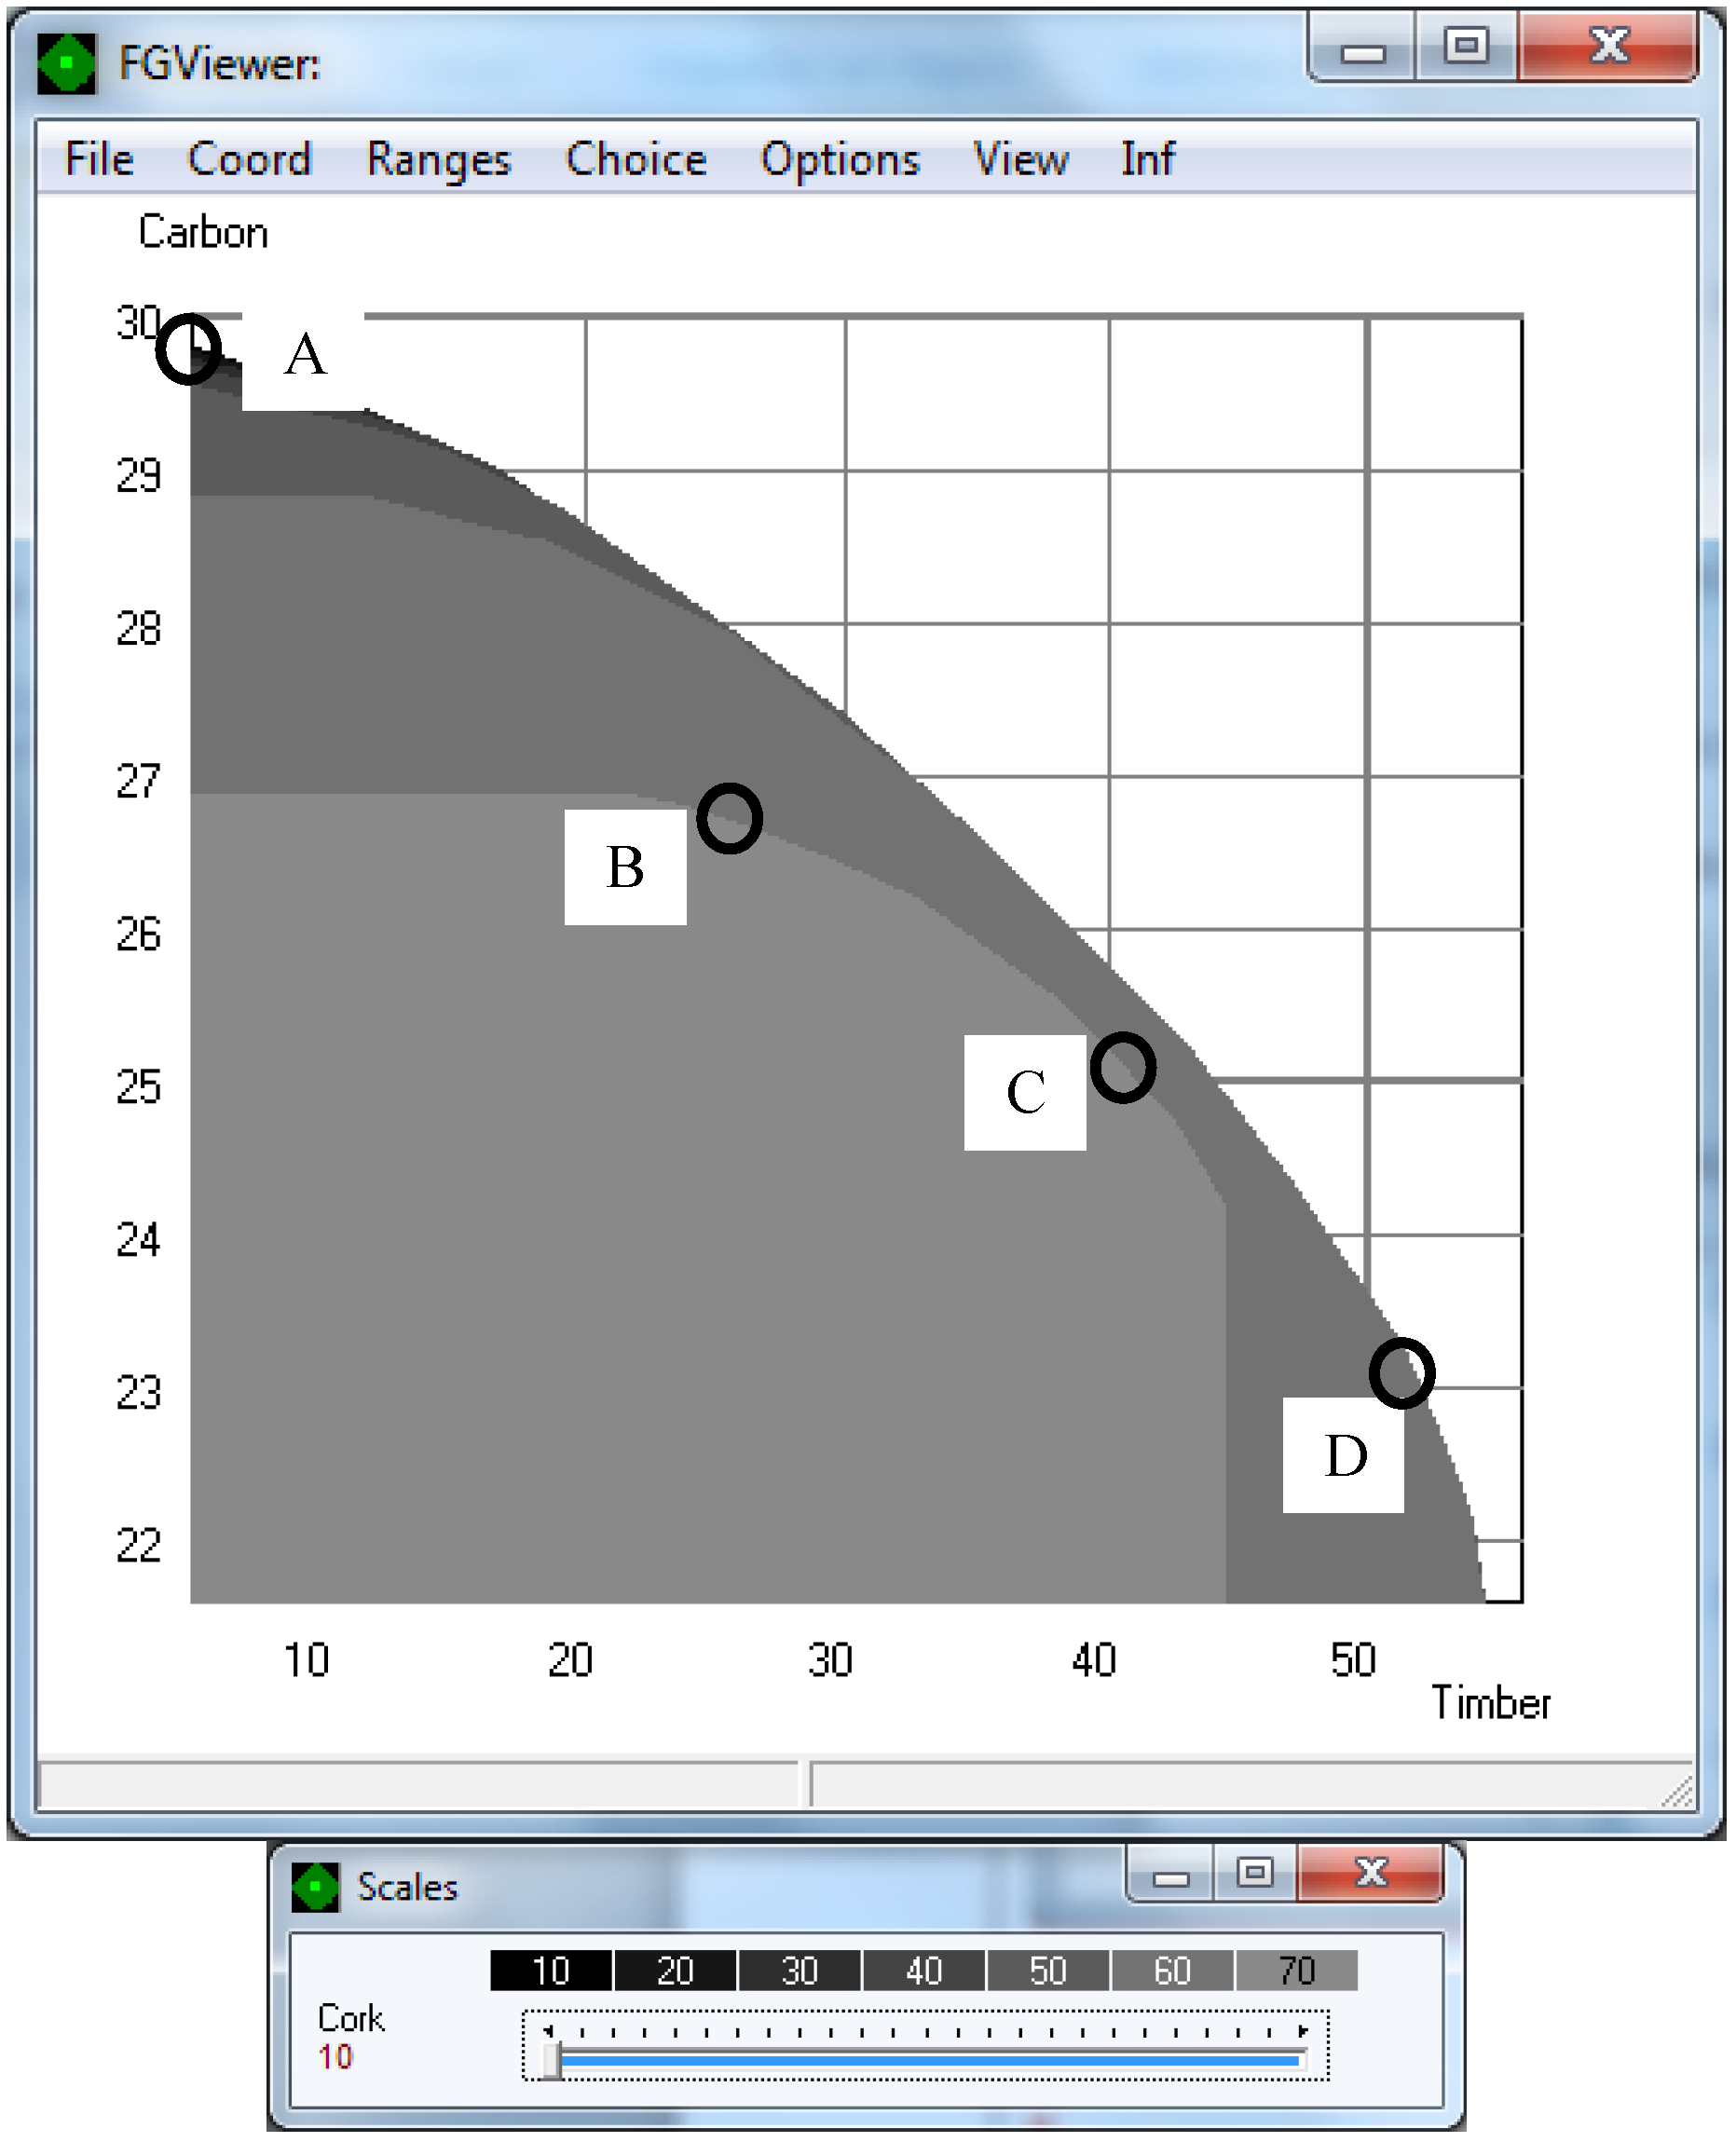
A three-dimensional decision map displaying the efficient frontier of our planning problem under a regularity constraint of 30% in cork supply. The colored area corresponds to achievement levels of cork supply. Points A–D correspond to points in the Pareto frontiers further analyzed by decision-makers. The units of the graph are: 107 kg of cork, 108 € in the case of NPV (net present value), 108 kg of carbon, and 105 m3 of timber.
Figure 9.
A three-dimensional decision map displaying the efficient frontier of our planning problem under a regularity constraint of 30% in cork supply. The colored area corresponds to achievement levels of cork supply. Points A–D correspond to points in the Pareto frontiers further analyzed by decision-makers. The units of the graph are: 107 kg of cork, 108 € in the case of NPV (net present value), 108 kg of carbon, and 105 m3 of timber.
The trade-off information supported the selection by decision-makers of regions of the Pareto frontier that best reflected their concerns. For that purpose, the methods base sub-module that provides the interactive decision maps (IDM) was used to produce the Pareto frontiers of a three-criteria planning problem (
i.e., wood yield, carbon, and cork supply) (
Figure 9). This decision map shows timber yield on the horizontal axis, carbon stock on the vertical axis, and cork supply is given by slices in different colors. These colors correspond to different achievement levels of cork supply. The number of slices shown (
i.e., levels of achievement) may be modified by the DM directly in the interface. Each slice presents all possible combinations of the pairs (carbon-timber yield) when cork supply is bounded by corresponding values shown in the top of the legend. The decision map clearly shows that wood production directly competes with carbon stock and cork supply (and therefore NPV). The more wood we want to harvest, the less cork is produced. This is the consequence of an increase of harvests from thinning cork oak trees that may not produce adult cork in earlier periods. As a result of removing trees from the ecosystem, less carbon is stored.
Within the decision map for the three conflicting criteria (
Figure 9), point A results in the maximum possible carbon stock (29.75 × 10
8 kg) but reduces the total cork supply to 15.1 × 10
7 kg and timber yield to 5.72 × 10
5 m
3. On the contrary, point D almost maximizes timber yield (51.5 × 10
5 m
3) with a corresponding cork supply of 60 × 10
7 kg and NPV of 66.2 × 10
8 €, but the carbon (C) stock is drastically reduced to 23.2 × 10
8 kg of C. More interesting points are found in the slice (bi-criterion map) corresponding to the restriction of cork production to ≥ 70 × 10
7 kg. Therefore, this first trade-off analysis may provide information to help DMs set minimum achievement levels for three criteria. In its Pareto frontier (trade-off between carbon stock and wood yield), points B and C are further analyzed. Moving from point B to point C along the Pareto frontier, carbon stock reduces from 26.8 × 10
8 kg to 24.2 × 10
8 kg while timber yield rises from 23.3 × 10
5 m
3 to 44.3 × 10
5 m
3. In both cases cork supply is 70 × 10
7 kg; however, due to higher timber yield, the NPV is higher in point C (
i.e., 74.3 × 10
8).
This decision map also shows that the cork supply frontiers are quite close, which means that at a certain level of wood yield small changes in carbon goals will reduce the cork supply drastically (
Figure 8). For example, when total timber supply is set to the level found in point B, when C sequestration is slightly increased up to 28 tons, the cork supply obtained is drastically reduced to 50 × 10
7 kg (almost a 25% reduction). Similarly, if the timber supply is set to 44 × 10
5 m
3 (the level found in point C), when C stock level is slightly increased to 25 × 10
8 kg, the NPV is reduced to 60 × 10
8 €. So for further analysis, DMs may analyze only the area between points B and C; this means that targets for each criterion are set (
i.e., cork supply ≥ 50 × 10
7 kg, timber yield ≥ 23.3 × 10
5 m
3, and carbon stock ≥ 24.2 × 10
8 kg).
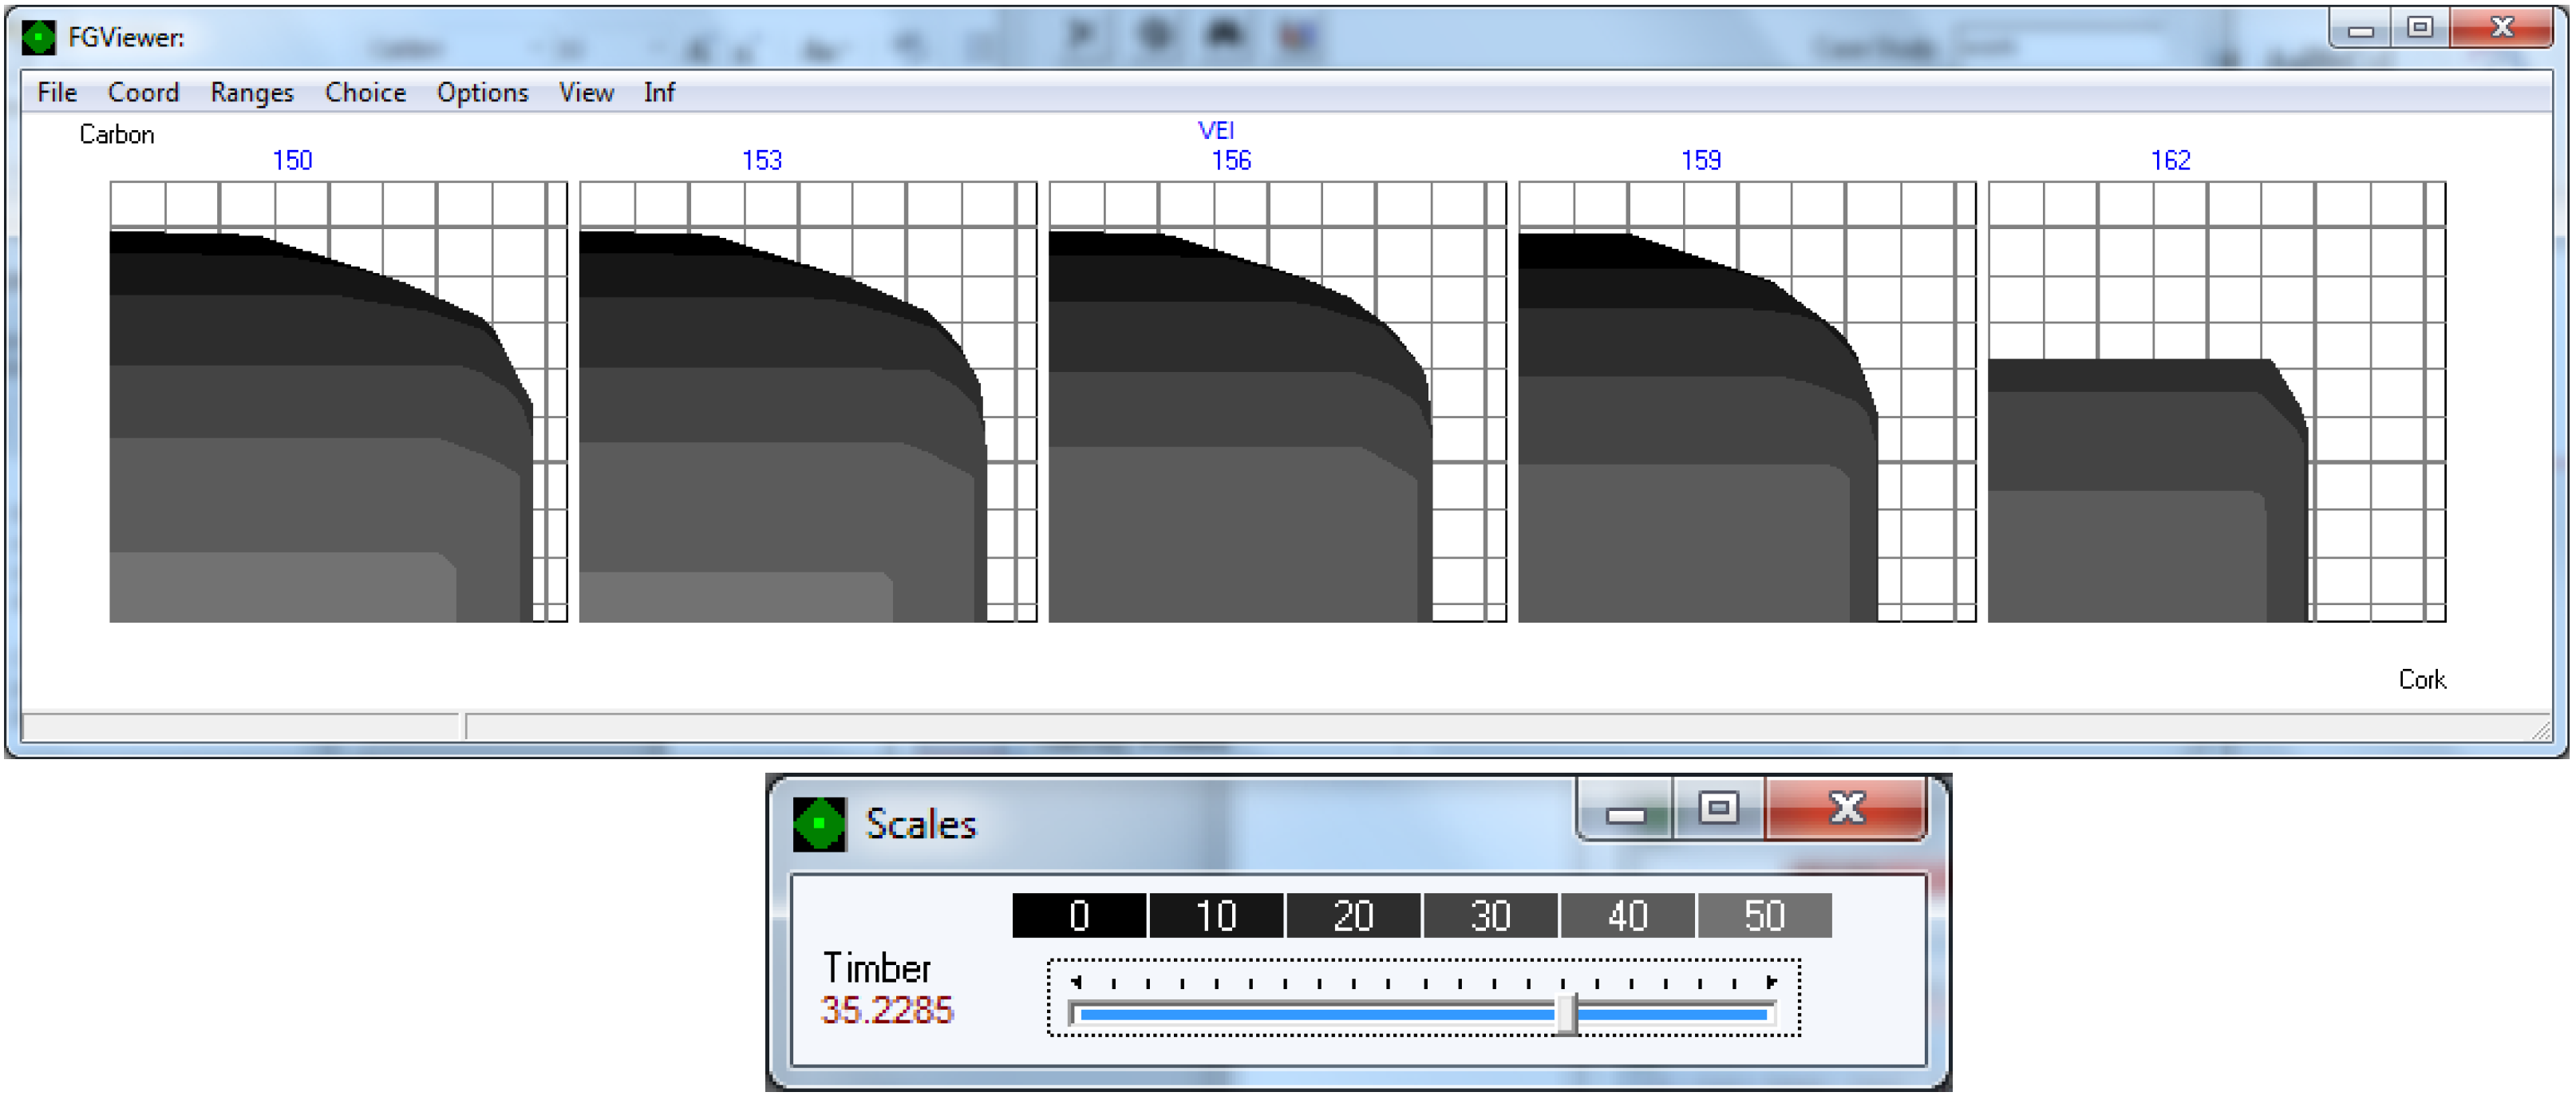
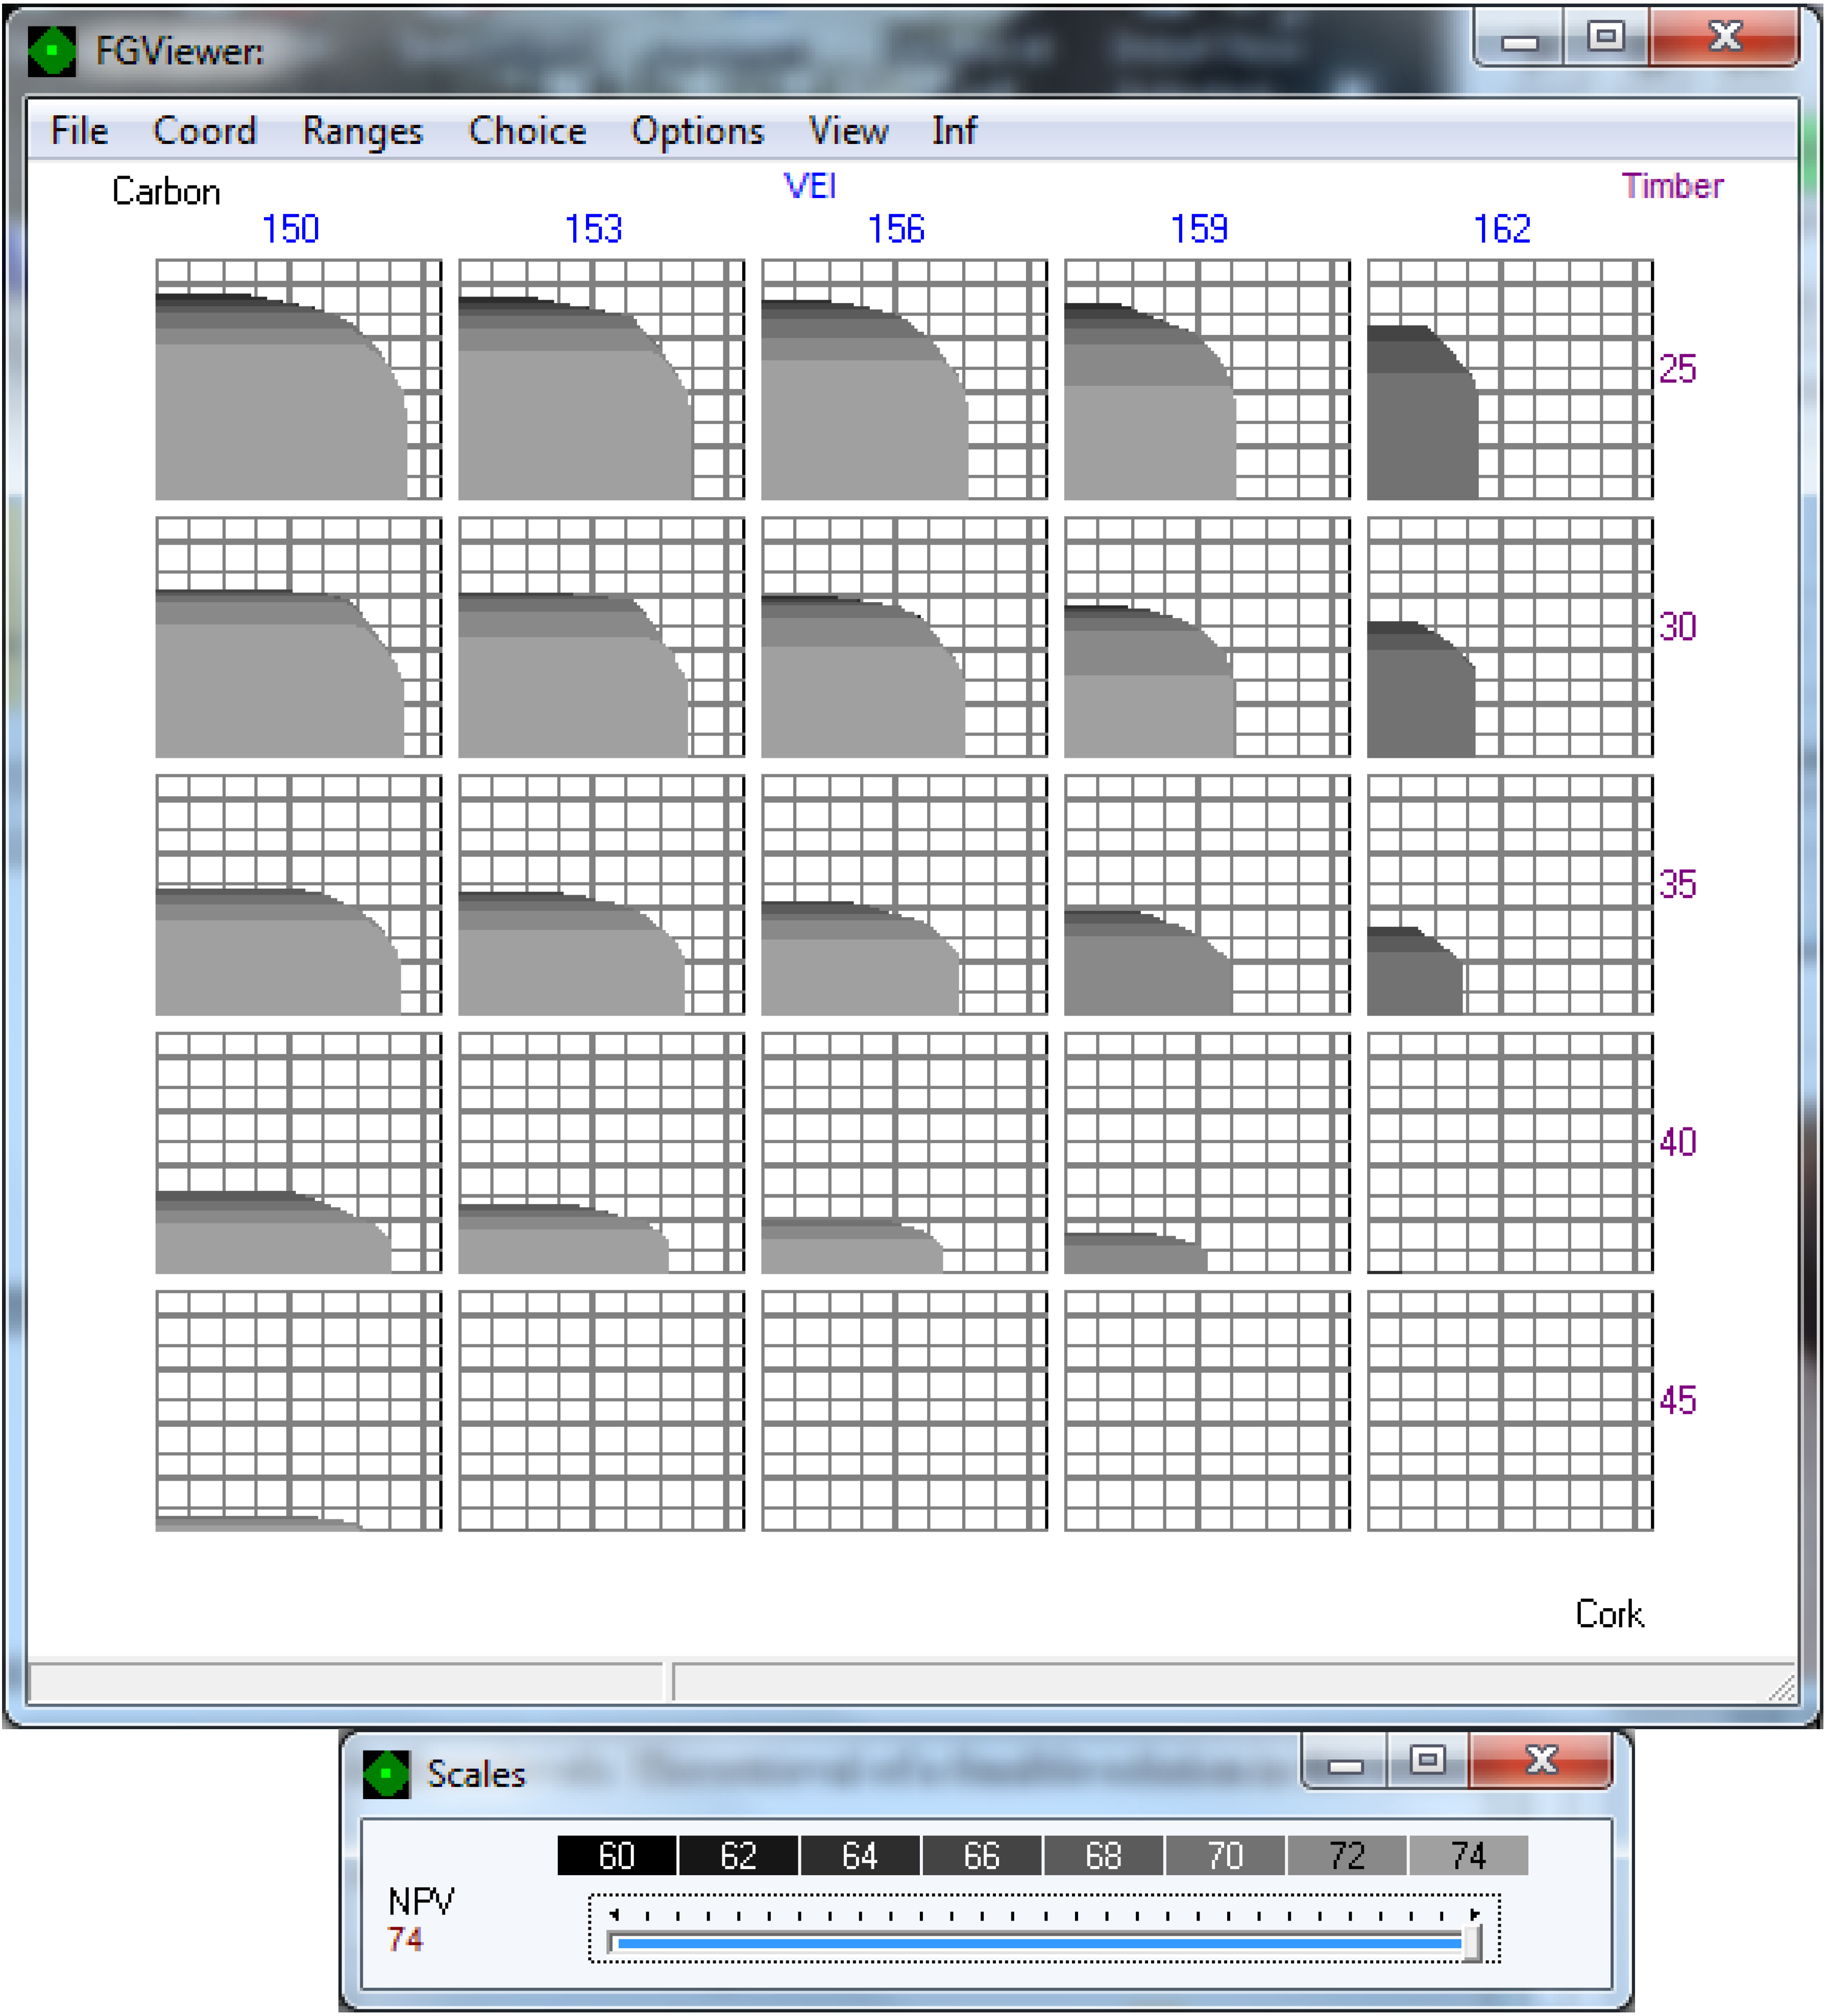
In strategic planning, usually in addition to regularity constraints a minimum value for the ending inventory (VEI) is included as a constraint to ensure future production. Therefore, we may further include VEI as a fourth objective. In this case the system generates a four-dimensional decision map considering VEI, cork and carbon stock, and timber. These maps are a sequence of three-dimensional decision maps constructed for different values of e fourth criterion (
Figure 10). These parallel figures represent slices of the EPH in the direction of the fourth criterion (
i.e., VEI). This decision map shows that VEI competes with both carbon stock and cork supply criteria. The increase in VEI leads to a decrease in both the carbon sequestration and the cork supply. The information provided in the form of these decision maps helped DMs set the target achievement level for the VEI criteria at 156 × 10
7 €.
Figure 10.
A four-dimensional decision map displaying the efficient frontier of our planning problem under a regularity constraint of 30% in cork supply, minimum achievement levels for three criteria (targets for each criterion: min timber = 23.3 × 10⁴ m3, min cork = 50 × 107 kg, min carbon = 24.2 × 10⁸ kg). Each decision map corresponds to a specific value for the ending inventory (VEI) of 150 × 107, 153 × 107, 156 × 107, 159 × 107, and 162 × 107 €, respectively. The colored area corresponds to achievement levels of timber yield.
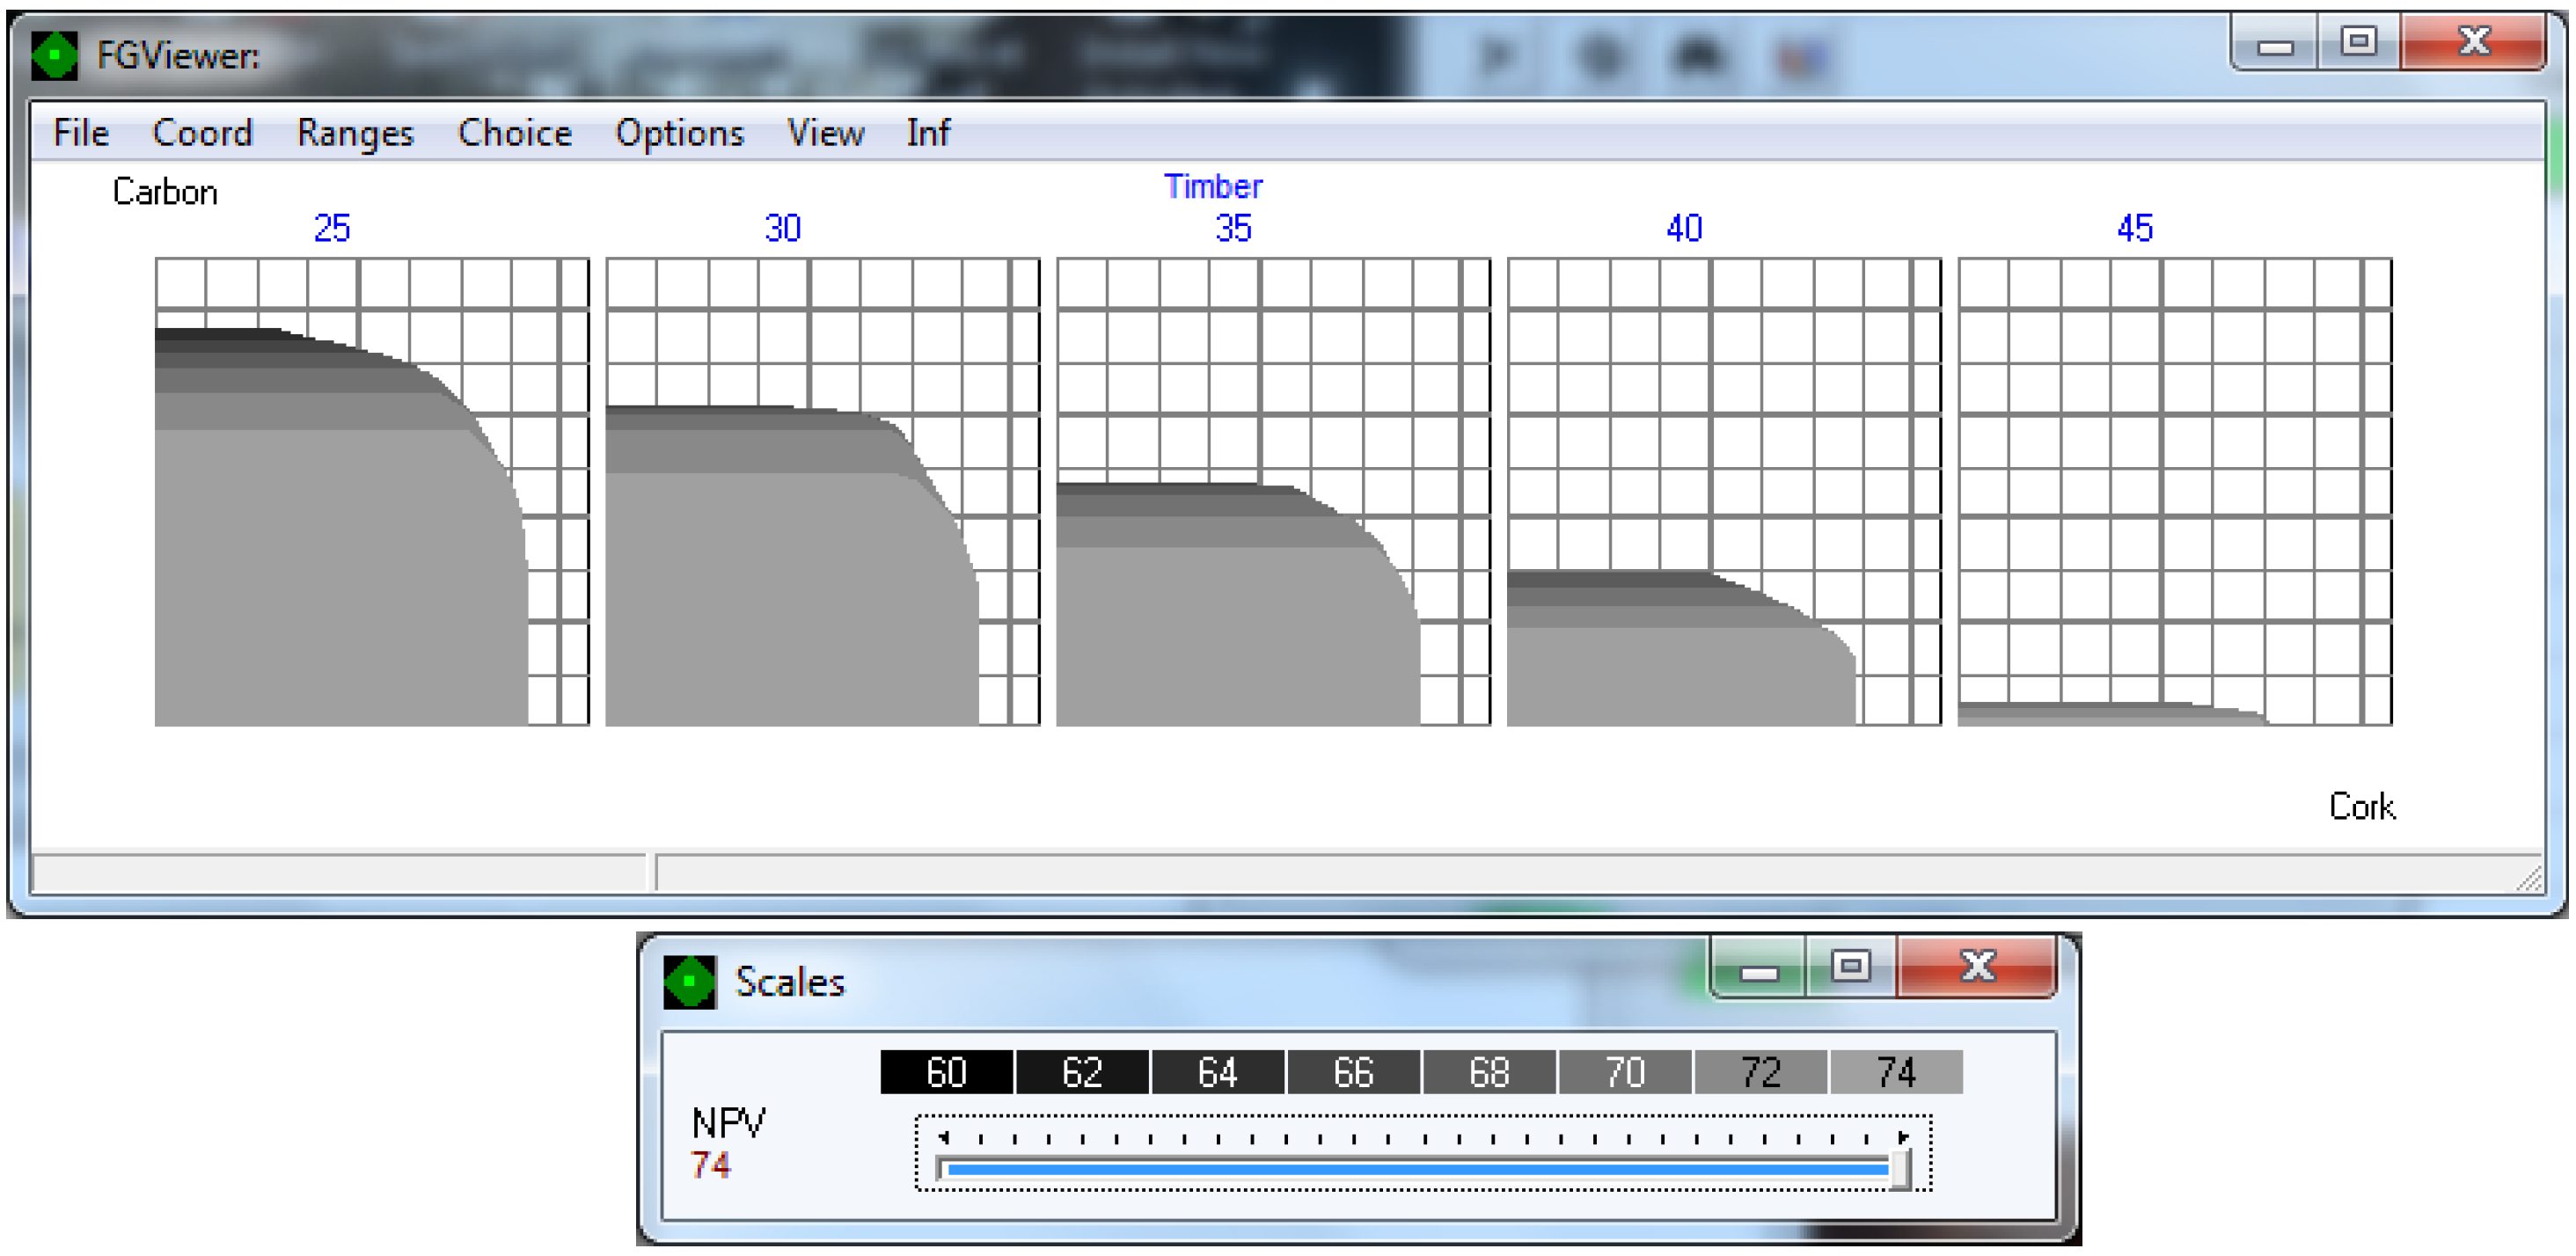
For additional trade-off analysis that might help fine-tune the setting of achievement levels, the system may generate a four-dimensional decision maps when setting minimum achievement levels defined in previous steps (
Figure 11). In this example, carbon and cork are shown on the axes, NPV is shown in colored slices, and wood yield is shown as the fourth criterion. Therefore, the four-dimensional decision maps consists of sequences of three-dimensional decision maps corresponding to a specific timber supply level of 25 × 10
5, 30 × 10
5, 35 × 10
5, 40 × 10
5, and 45 × 10
5 m
3.
Figure 11.
A four-dimensional decision map displaying the efficient frontier of our four-criteria planning problem under a regularity constraint of 30% in cork supply, considering minimum achievement levels for three criteria (targets for each criterion: min timber = 23.3 × 10⁴ m3, min cork = 50 × 107 kg, min Carbon = 24.2 × 10⁸ kg) and a specific achievement level for value for the ending inventory (VEI = 156 × 107 €). Each decision map corresponds to a specific timber supply level 25 × 105, 30 × 105, 35 × 105, 40 × 105 and 45 × 105 m3, respectively. The NPV is expressed in 108 €.
The system allows DMs to analyze a five-dimensional decision map (a matrix of decision maps) (
Figure 12). This matrix contains a series of snapshots of three-dimensional maps. Where every column of the matrix is related to a certain value of the fourth criterion (
i.e., VEI) and any row in the matrix is related to a certain value of the fifth criteria (
i.e., timber). However, it seems easier to analyze four-dimensional decision maps.
Figure 12.
A five-dimensional decision map (a matrix of decision maps) displaying the EPH of our five criteria planning problem considering minimum achievement levels for three criteria (targets for each criterion: min timber = 23.3 × 10⁴ m3, min cork = 50 × 107 kg, min carbon = 24.2 × 10⁸ kg). Each column in the matrix corresponds to a specific timber supply level: 25 × 104, 30 × 104, 35 × 104, 40 × 104, or 45 × 104 m3. Each row in the matrix corresponds to specific levels of VEI: 150 × 107, 153 × 107, 156 × 107, 159 × 107, and 162 × 107 €.
Decision-makers are mostly concerned with the total amount of revenues, the cork supply as well as with its sustainability. Information provided in
Figure 10,
Figure 11 and
Figure 12 helped DMs to set the target achievement level for the Timber criteria at 30 × 10
4 m
3. Then the attention of the DMs focuses on the trade-off analysis between the three other criteria when timber = 30 × 10
4 m
3 and VEI = 156 × 10
7 €.
The DM may click on the map corresponding the levels of achievement of timber and VEI previously defined (
i.e., timber = 3 × 10
4 m
3 and VEI = 156 × 10
7 €) and the system generates the three dimensional decision map which corresponds to all possible combinations of cork, NPV and carbon that leads to the achievement of the minimum achievement levels for timber, carbon and cork supply and for the specific targets fixed for timber and VEI (
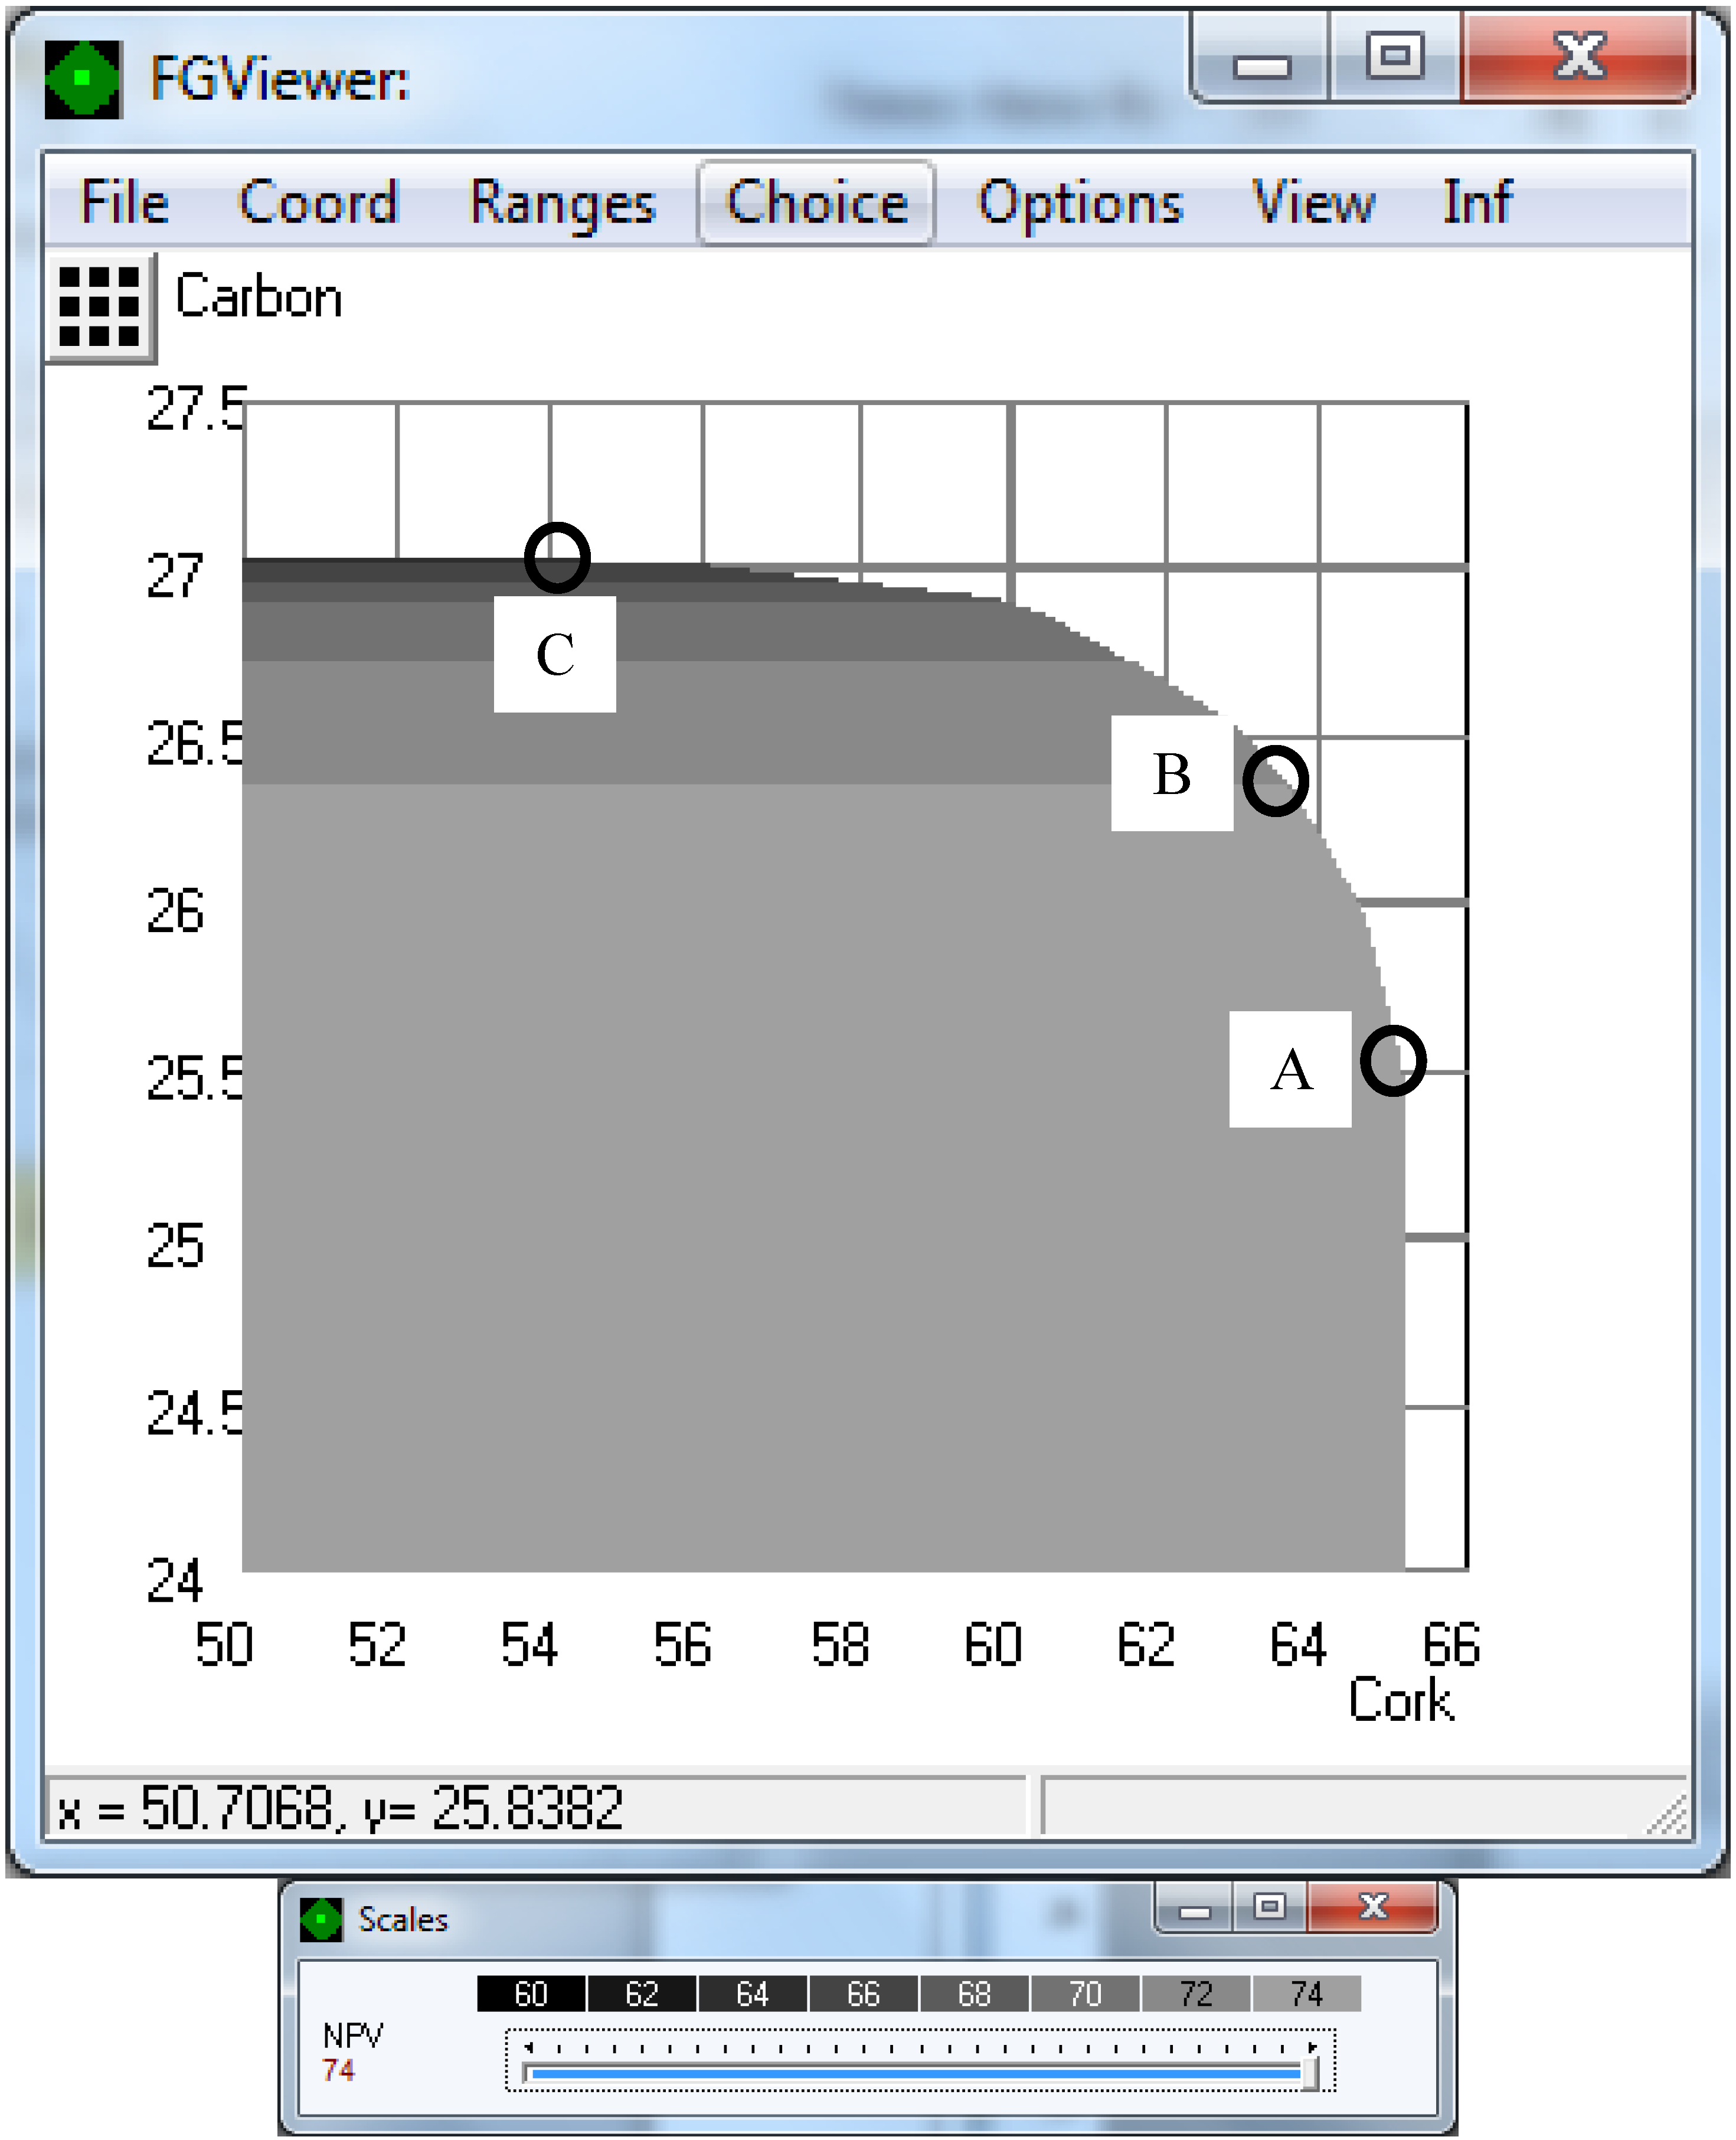
Figure 13). This information may help the DMs to select the final option.
Figure 13.
A three-dimensional decision map displaying the EPH of our planning problem, considering minimum achievement levels for two criteria (targets for each criterion: min cork = 50 × 107 kg, min carbon = 24.2 × 10⁸ kg) and fixed levels of value of ending inventory VEI and timber (i.e., timber = 30 × 105 m3 and VEI = 156 × 107 €). The colored area corresponds to different achievement levels of NPV. Points A–C correspond to solutions selected by decision-makers.
For illustration purposes we present information associated with three choices (points A–C in
Figure 13), these points correspond to NPV values equal to 74.06 × 10
8, 74 × 10
8 and 67.93 × 10
8 €. For the solutions timber was equal to 30 × 10
4 m
3 and VEI was equal to 156 × 10
7 €. The three solutions differed in the values of Carbon and Cork supply. In the case of Carbon the values were 25.5, 25.9 and 26.9 for solutions A–C, respectively. Cork supply values were 64.6, 63.6 and 58.6 × 10
7 kg for solutions A, B and C, respectively. Among all possible points the DM did choose the point B (
Figure 13) as this point corresponds to a reasonable combination of the different criteria (
Table 1).
By retrieving the values of the levels of achievement of the five goals that were set by the DMs based on the trade-off analysis, the DSS thus generates the information needed to retrieve the solution in the decision space (i.e., the management plan).
Table 1.
Solutions in the Feasible Set in the criteria space retrieved by the Reference Point Method (points A–C decision map in
Figure 13) for the multi-criteria formulation optimization constrained by a maximum 30% deviation in periodic adult cork supply.
Table 1.
Solutions in the Feasible Set in the criteria space retrieved by the Reference Point Method (points A–C decision map in Figure 13) for the multi-criteria formulation optimization constrained by a maximum 30% deviation in periodic adult cork supply.
| Criteria | Point A | Point B | Point C |
|---|
| NPV (108 €) | 74.06 | 74.00 | 67.93 |
| Carbon (108 kg) | | | |
| Period 1 | 19.31 | 19.56 | 20.10 |
| Period 2 | 22.61 | 23.03 | 24.04 |
| Period 3 | 25.94 | 26.50 | 27.71 |
| Period 4 | 28.90 | 29.45 | 30.56 |
| Average | 25.49 | 25.96 | 26.91 |
| Ad cork (107 kg) | | | |
| Period 1 | 7.49 | 7.47 | 6.96 |
| Period 2 | 9.74 | 9.71 | 9.05 |
| Period 3 | 12.44 | 12.10 | 11.70 |
| Period 4 | 15.17 | 14.94 | 13.43 |
| Period 5 | 19.72 | 19.43 | 17.46 |
| Total | 64.57 | 63.65 | 58.60 |
| Timber (105 m3) | | | |
| Period 1 | 3.75 | 3.48 | 1.21 |
| Period 2 | 4.41 | 3.74 | 2.10 |
| Period 3 | 4.45 | 4.40 | 4.30 |
| Period 4 | 6.32 | 7.17 | 8.41 |
| Period 5 | 11.13 | 11.46 | 13.98 |
| Total | 30.06 | 30.24 | 30.00 |
| Disc Revenues (107 €) | | | |
| Period 1 | 188.40 | 188.08 | 172.71 |
| Period 2 | 167.31 | 167.64 | 154.30 |
| Period 3 | 145.19 | 144.24 | 136.76 |
| Period 4 | 120.85 | 121.25 | 107.64 |
| Period 5 | 103.21 | 103.19 | 92.27 |
| Total | 724.96 | 724.40 | 663.67 |
| VEI (107 €) | 156.05 | 156.28 | 156.01 |
4. Discussion
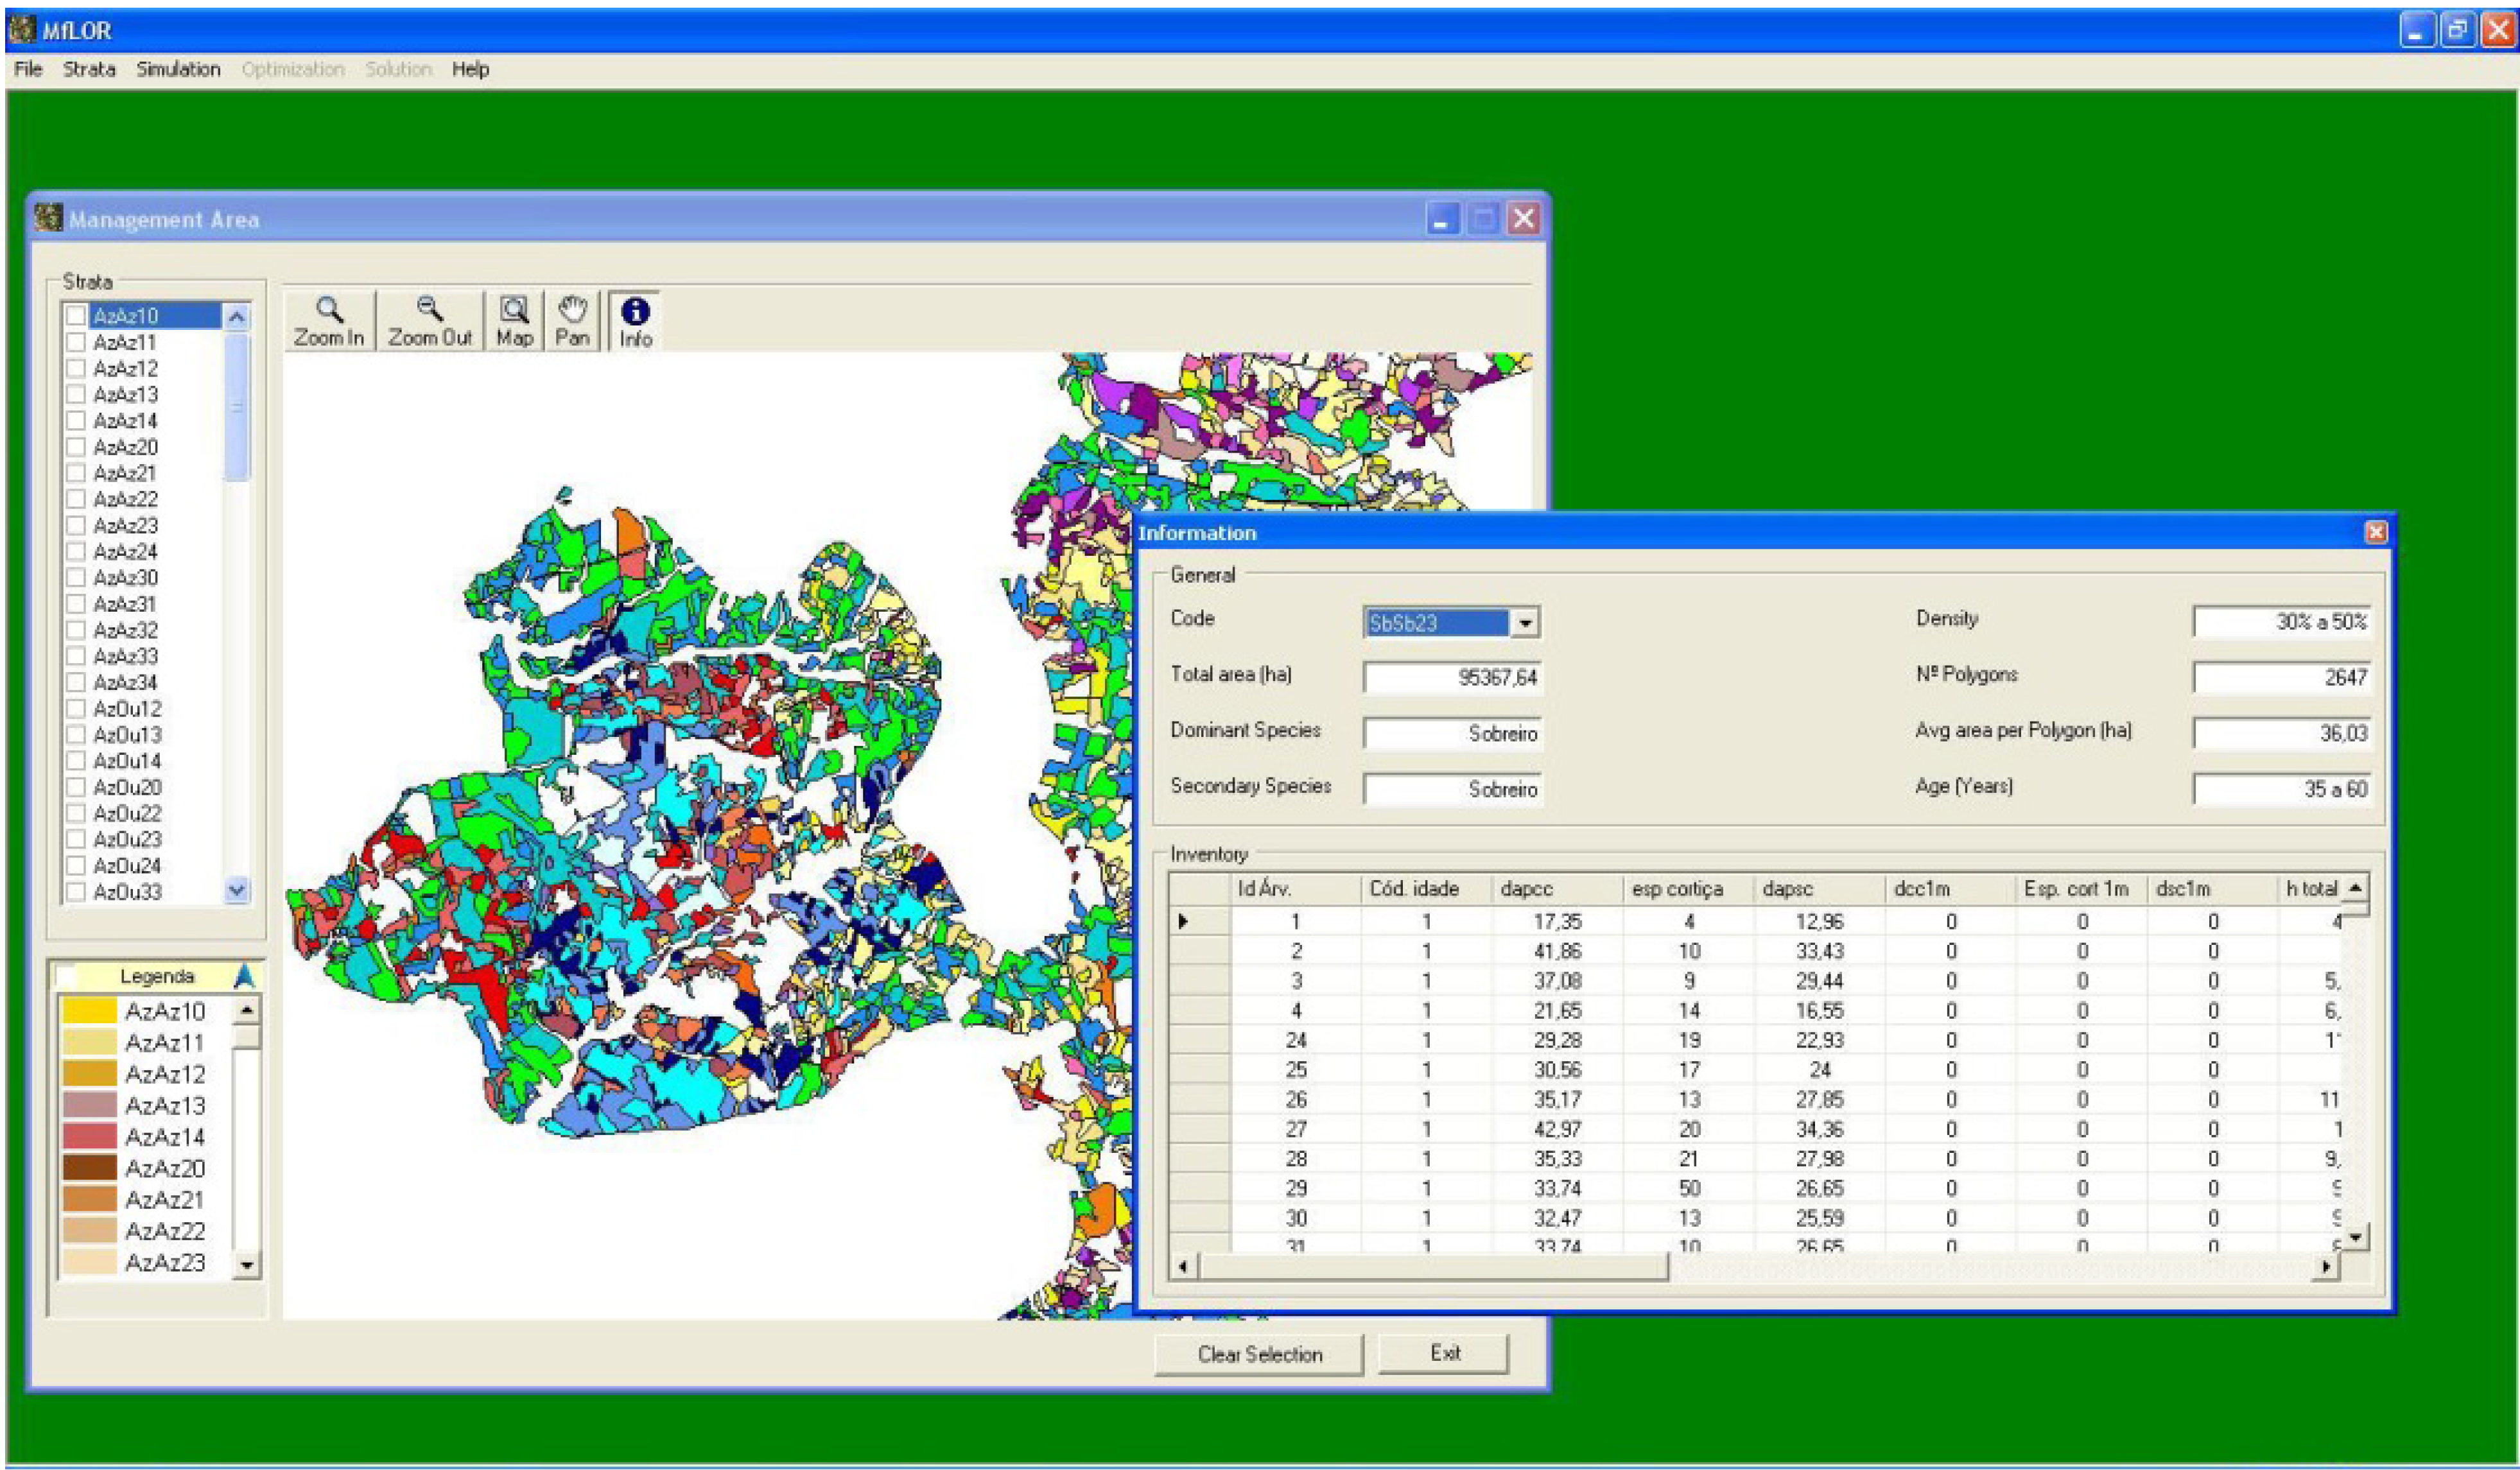
The new DSS functionality was tested using a large scale application—an area in Alentejo in Southern Portugal extending over 1 million ha. Results demonstrated the use of the new DSS integrated functionality. The management information system provided an effective way to store ecosystem data and communicate information to the other DSS modules. The model base efficiently read the ecosystem data to generate prescriptions and simulate the growth of both cork and holm oak over a five-decade planning horizon. The number of cycles varied from 6 to 27. Specifically, after defining cycles, the model base read the inventory data and simulated up to 8400 silviculture strategies for all strata over the 50-year planning horizon. Computational costs were reasonable. The most costly run took about 17 min in an Intel Core Duo 2.66 MHz machine with 1 Gb of RAM.
Results further demonstrated the potential of the new DSS integrated functionality to provide decision-makers with information to develop management strategies. The Portuguese Ministry of Agriculture Regional Office of Alentejo (DRAPAL) used an earlier version of the system in 2008 for scenario analysis [
31]. However, this version did not include the IDM sub-module to generate Pareto frontiers. The new functionality allows for the assessment of trade-offs between policy analysis criteria and thus it contributes to enhancing policy analysis. Flexibility in linear programming matrix generation within the IDM module is key to this functionality. This system architecture may further be used for enhancing ecosystem management planning.
The trade-offs shown by the new functionality highlighted that NPV and adult cork yield only compete marginally at very high levels of cork production. The highest NPV and the consequent cork production are 79.6 108 € and 74.43 × 10⁷ kg. When constraining the solutions to a certain level of regularity of cork availability (allowing cork production to fluctuate between certain levels), a significant decrease in both cork production and NPV is observed. This is due to the inflexibility in cork management as, in order to accomplish the regularity constraints, a large part of the area would remain unmanaged. The results are clearly logical because the profits obtained by debarking trees are much higher than any other possible product (i.e., wood), and there is not any other possible income from the forest. Moreover, the regularity constraint forbids debarking during some years (extent debarking rotation) in order to equilibrate the cork extraction over time, and thus there is a loss of production and profits during the planning period.
The DSS presented in this article provides information on the efficient trade-offs between all the analyzed criteria. It provides information to the user on potentially feasible combinations of values from three to seven criterion values and on efficient criterion trade-offs. This tool may help to overcome the shortcomings of DSS with methods bases that require
a priori understanding of the trade-offs between the conflicting criteria such as some multiple-attribute utility methods [
32] that involve complicated interactions with DMs—with the latter being required to compare multiple pairs of criteria points before trade-off information is made available. In fact, in the DSS presented no
a priori information is asked of the decision-maker about weights of preferences. This is especially important when the DM does not have a clear idea of the feasible values for the different criteria. In fact, one of the main limitations to consider when selecting a particular MCDA approach is the level of available knowledge about the problem space [
18,
33]. Defining
a priori the goals and preferences may not be realistic and it may lead to poor management decisions. Thus, the DSS presented here may overcome obstacles of
a priori preference approaches. The IDM module helps decision-makers specify preferences or targets for the different criteria. Furthermore, it facilitates negotiation when multiple stakeholders are involved in decision-making and policy analysis processes. This is especially important to address complex natural resources management problems where multiple decision-makers and stakeholders are involved.
In the context of multi-criteria optimization Gass
et al. [
34] proposed to compute and display the Pareto frontier for bi-criteria linear models, approximating the Pareto frontier of the Feasible Set in the Criteria Space (FSCS). At the first stage of this approach, the Pareto frontier is constructed or approximated. At the second stage, the Pareto frontier is represented graphically and then the decision-maker (DM) identifies the most preferable criterion point at this frontier. However, such a convenient method of informing decision-makers was restricted to the bi-criteria problems due to computational difficulties that aroused in multi-dimensional problems. Borges
et al. [
19] presented and discussed an application of the interactive technique introduced by Lotov
et al. [
20] to generate the Pareto frontier of forest management planning problems encompassing up to seven objectives. This research developed an effective strategy for integrating this approach in a methods base in a forest ecosystem management and policy analysis decision support system.
Generating and visualizing the complete set of efficient solutions (
i.e., Pareto optimal) to planning and policy analysis problems helps the DMs to acquire a holistic view of the planning or policy analysis problem. The new IDM sub-module provides an interactive approach that allows the specification of target criteria levels by the DM on sections of the Pareto frontier [
20,
35]. The DSS provides the DMs with information about potentially feasible combinations of values from three to seven criteria and about efficient criterion trade-offs. The DMs may identify a preferred feasible combination of criteria values (feasible goals) directly on the graphic display. Then, the computer provides the corresponding solution in the decision space e.g., management plan or behavioral landscape. This allows the DMs to gain insight about ecological, economic, and social interactions, thus generating the information needed for sound policy making.
The system used interactive decision maps in the context of a cork and holm oak forest planning problem where goods and services such as carbon sequestration and cork supply are considered in addition to timber yield. Nevertheless, the system is extensible as it allows for the updating and insertion of production and conservation functions to address other objectives. Future research will focus further on multi-criteria spatial DSS, which may address problems where the spatial context of stand-level decisions must be acknowledged. It will further focus on the development of a web-based architecture of this functionality to support participatory backcasting analysis.


