1. Introduction
Biomass from forestry and agroforestry is increasingly in demand for the production of renewable energy [
1,
2]. Regarding the rising demand for biomass used for energy production at the EU level (20% of the energy needs from renewables by 2020 [
3]), tools are needed that consider the availability of such resources [
4]. Many studies on renewable energy potential at the local [
5,
6], regional [
7,
8,
9], national [
10,
11,
12], and global level [
13,
14] have been carried out. Most of them concentrate exclusively on forestry, many focus on economic (e.g., [
15]) or logistic valuation (e.g., [
16]), and several also on environmental questions (e.g., [
11]). The increase in renewable energy production evolves trade-offs regarding the production of food and fodder [
17] and further aspects, such as water quantity and quality [
18]. Trade-off analyses on energy potential were also carried out regarding the agricultural sector [
19,
20,
21].
In order to meet current and future resource demand and to avoid trade-offs for ecosystem services, integrated assessment approaches for tapping into regional potential in order to sustainably provide biomass are indispensable [
22]. Tools which support natural resource management are currently becoming more complex and increasingly take into account socio-economic conditions [
23]. As an interface to planning at the regional (meso) scale, cross-sectoral approaches and tools are needed [
24]. Regional planning is necessary to implement national level renewable energy targets. The strength of regional approaches lies in the involvement of stakeholders [
25]. In many cases, integrated assessment approaches are applied when the results should be used for decision-making [
26]. Decision support systems can be made for one land use sector such as forestry [
4,
27,
28] or agriculture [
29,
30] or at the landscape scale [
31,
32]. In the context of energy turnaround and regional planning, there is a need for building an interface for regional planners as well as foresters and other stakeholders in the regional supply chain [
33].
HEUREKA, for example, is a Swedish system which focuses on forest planning at the regional scale [
34]. It consists of several models which allow a detailed analysis of tree and stand development. In common with the Biomass Module, which is presented in this study, planning horizon and time steps are defined by the user. There are several other forest decision support systems, e.g., the Landscape Management System (LMS, [
35]) or the European Forest Information Scenario Model (EFISCEN [
36]), which include more detailed forest models compared to the Biomass Module. In contrast, the Biomass Module does not go into detail regarding individual tree growth, because it was not coupled with tree growth models. The advantage of coupling models would have been to provide an interactive assessment of the biomass of a region [
37]. A coupling with growth and yield models, however, would have required much more stand- and tree-specific data and would have considerably increased the computation effort until results could be provided. The Biomass Module now is characterized by short calculation times and the link to an integrated ecosystem services assessment. While HEUREKA is used especially by forestry companies, the Biomass Module additionally addresses regional planners. Further tools, like LANDIS [
33], take an intermediate position, as they address both local administrations as well as land managers at the regional level.
Two German decision support systems address the agricultural sector. MANUELA supports agricultural management in terms of nature conservation [
38]; LandCaRe was developed to evaluate the impact of Climate Change on agricultural farming at local and regional levels [
39]. In comparison to the Biomass Module, extended issues are determined, such as economic evaluations or more detailed, partially process-based models, respectively. While MANUELA neglects temporal aspects, it allows the simulation of nature conservation measures, e.g., the introduction of hedge rows. Land use change, however, is not provided as measure. In contrast, LandCaRe considers a short and medium term temporal scale. Land use change cannot be simulated with the help of this tool.
In contrast to the mentioned systems, the Biomass Module attempts to fill the gap between local and regional, sectoral and integrated land use change modeling in a wider temporal planning horizon.
The aim of this research was to develop an approach that supports the identification of suitable strategies to enhance the provision of lignocellulosic biomass in a regional planning context. The approach builds upon and is integrated into the cellular automaton based software platform GISCAME [
40,
41,
42,
43,
44]. So far, the GISCAME only facilitated an ecosystem services assessment at a relative scale from 0–100. This procedure is valuable for cross-sectoral studies, especially trade-off analyses. Details, such as absolute amount of biomass potential, however, were not available. The add-on Biomass Module now adds this detailed information, which attracts, besides regional planners, now also local land managers. This extension makes use of forest inventory data and considers also further socio-cultural spatial information (legal status related to nature conservation areas; land ownership type). Information on current and future demand and supply of biomass is used for the scenario development. Comparing land use and/or management change alternatives helps to develop strategies for balancing a potential mismatch of demand and supply. As a result, statements on the effect of land use and land management change on growth and yield are generated. Scenarios are used to communicate the impact of forest conversion or clear-cutting of forest stands on potential supporting, provisioning, regulating, and cultural ecosystem services, which lead to recommendations for regional planning [
45]. A central target within the development of the tool for regional biomass estimation was to find an approach to bridge the gap between plot level growth and yield information and regional land use data across a multi-functional landscape.
In this article, the Biomass-Module and its model architecture are presented. Exemplary results for the planning region “Upper Elbe Valley/Eastern Ore Mts.” in Saxony, Germany, are shown. In the context of competitive demand for land used for the production of food and fodder on the one hand and for commodities on the other [
10], the simulations are additionally evaluated regarding a set of seven ecosystem services using the GISCAME platform. Conclusions are drawn on the effectiveness of the Biomass Module in supporting communication between regional planners and local forest owners. It generates sound information on cause-effect relationships at the regional scale for informed management of the resources.
2. Methods
2.1. Model Region
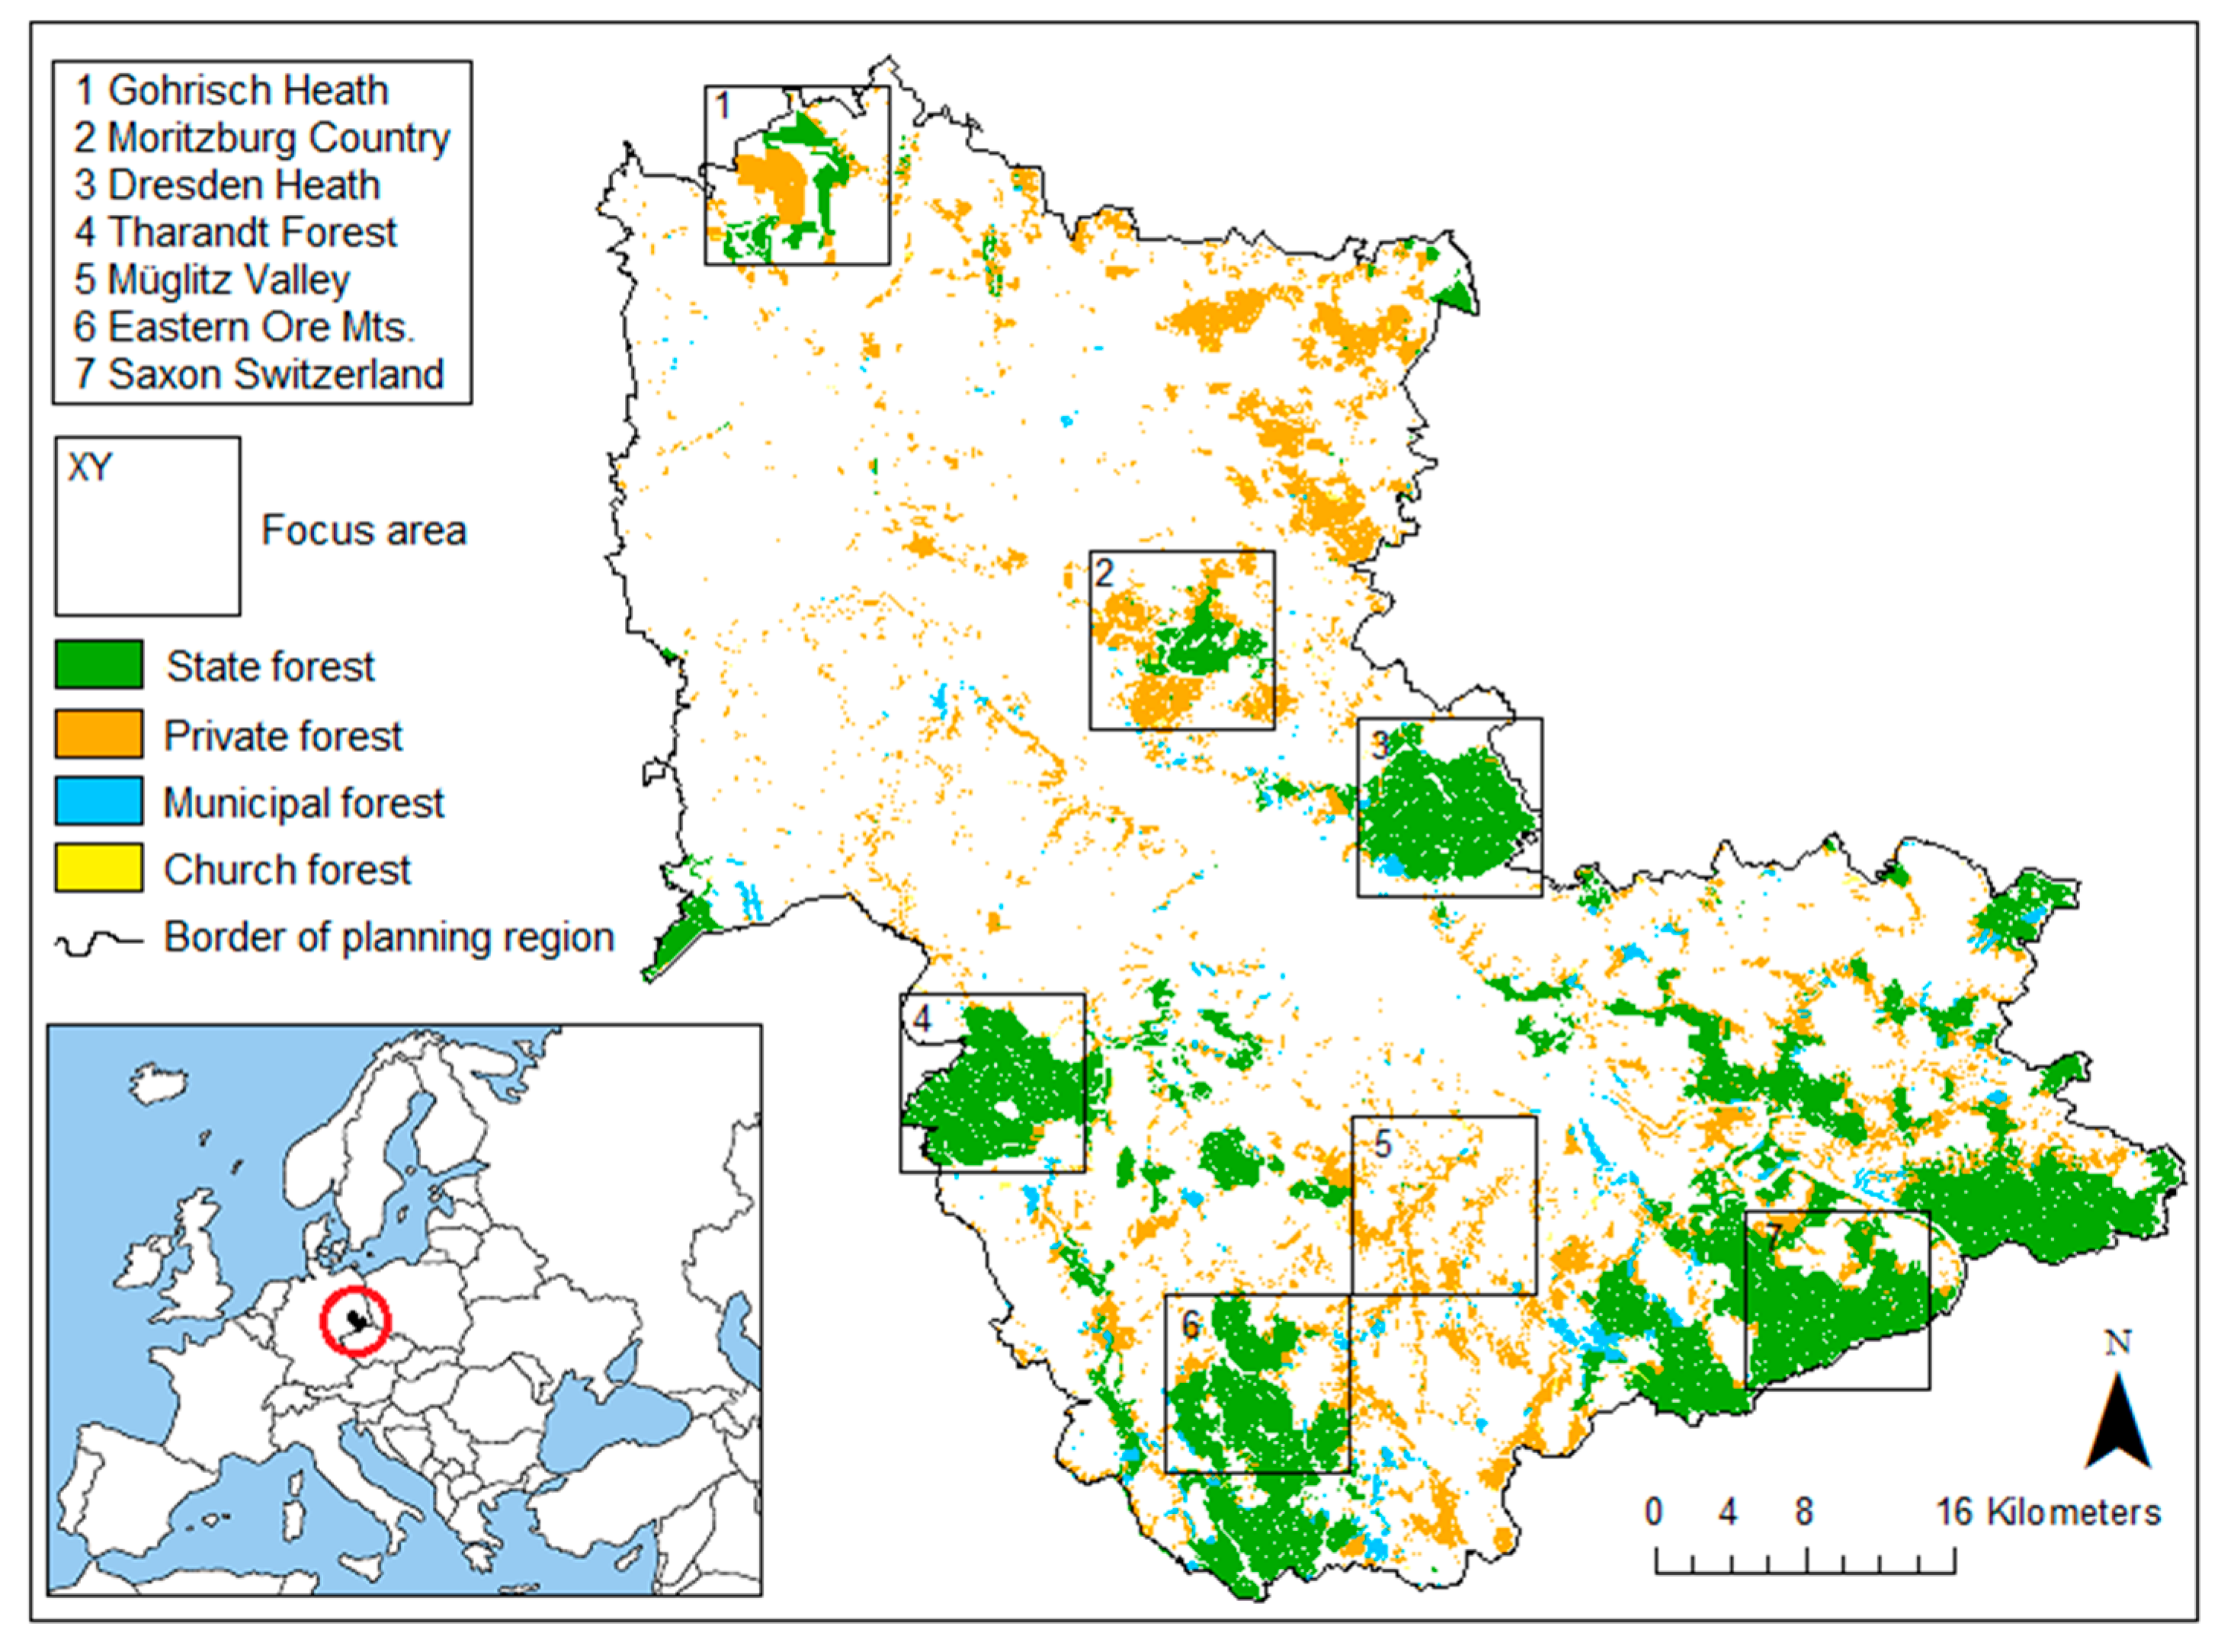
The model region “Upper Elbe Valley/Eastern Ore Mts.” is located in the middle of the German Federal State of Saxony and has an area of 3434 km². It is one of four planning regions in Saxony. The region comprises three administrative districts (Meißen, Dresden, and the district Saxon Switzerland/Eastern Ore Mts.) and five forest districts (Dresden, Neustadt, Gohrischer Heide, Bärenfels, Sächsiche Schweiz). The investigations concentrate on (i) the whole model region; and (ii) focus areas of 10 × 10 km (
Figure 1). Results for the focus area No. 5, the Müglitz valley, are presented in this study.
Figure 1.
The planning district “Upper Elbe Valley/Eastern Ore Mts.”. Focus areas are highlighted. Only wood-producing areas are colored, whereas main ownership types are distinguished. Focus area 5 (Müglitz valley) serves as the case study area for in depth analyses.
Figure 1.
The planning district “Upper Elbe Valley/Eastern Ore Mts.”. Focus areas are highlighted. Only wood-producing areas are colored, whereas main ownership types are distinguished. Focus area 5 (Müglitz valley) serves as the case study area for in depth analyses.
Twenty-four percent of the region is forested. The mean annual increment is about 9.4 m³/ha × yr, and the main consumers are saw mills, whose annual demand is not covered by the supply of the region [
46]. About 53% of the forested area is state forest, 43% is privately owned forest. The share of other owner types, like municipalities and churches, is negligible. A challenge for regional forest management is the large amount of small scale private forests of <5 ha (98%). Concerning the maximum regional biomass potential, a cluster analysis revealed that private forest has the greatest potential [
47]. While the state forest has a mobilization rate of 100%, only 60% of the private forest is mobilized. Despite this high potential, the region is characterized by some severe weaknesses. The small size of the enterprises, weak networking, and lack of innovation are problems the region has to face. However, positive basic attitudes and the prospect of increasing development in the energy sector were also recognized [
47].
Agriculture is dominated by grain cultivation, followed by rape [
46]. Low energy wood is being produced in the region. In 2011, six farmers cultivated short rotation coppices; 22 biogas plants and 11 combined biomass heat and power stations were run in the region [
46]. In our model region, some studies regarding energy provisioning potential from agriculture and forestry have already been carried out [
46,
47].
2.2. Data
EuroMaps Land Cover (
©GAF AG, Euromap GmbH, 2013) data set was used as land use data [
40,
48,
49]. Based on ortho-rectified IRS-P6 LISS-III and Landsat-5 TM data of 2005–2008, digital land use classification with adapted classes was generated automatically with ERDAS Imagine with a spatial resolution of 25 m-grids. After several filter operations to avoid single pixels and other effects, a period of manual interpretation work took place. Wrongly classified pixels were recoded and the classes that could not be pre-classified automatically were inserted. The land use data was actualized in 2011 (forest development types) and 2013 (crop rotation classes). Complementary forest inventory data, obtained from the public state forest enterprise Sachsenforst (2013), were applied and all data were combined. While the area-covering EuroMaps land use/land cover served as a basis, the inventory data were added to the map in order to refine the date. It was assumed that the inventory data are more reliable than satellite data. To also integrate possible future development types of forests [
48], additional land use classes were included. Finally, a raster data set with 100 m resolution was generated.
Besides land use/land cover data in raster format, further cell properties were required to estimate the biomass potential. Data on ownership type, age, and stand density were provided by the public state forest enterprise Sachsenforst. The data, however, was not available for the whole forested area in the region. Especially, the state forests were well underpinned; other ownership types lacked data. Data gaps were observed in areas which were identified as “forest” by satellite (EuroMaps Land Cover data) and which were not part of the inventory data (e.g., urban forest or afforested areas), and also for all forest types besides state forest (such as church forest, municipal forest, and private forest). The land use type classification of the EuroMaps data distinguished the main coniferous (pure/mixed) and main deciduous tree species (pure/mixed stands), which had to be specified according to the forest inventory classification. Regarding missing information on stand density, forest type (leading and main mixes tree species), and age class (mainly in private forests), the following assumptions were made:
- -
Missing age values were filled by the median age of the state forest of the region (forest inventory data, 59 years).
- -
Missing stand density was filled with the median stand density of the state forest in the region (forest inventory data, 0.78).
- -
Areas which were identified by satellite (EuroMaps data) as forests, but which were not listed in the forest inventory data, were defined as specified in
Appendix Table A1.
Finally, a set of 36 forest land use types was considered in this study (
Appendix Table A2). The land use classes were provided with yield tables (
Appendix Table A3). These contain several parameters of growth and yield (
Table 1), as well as actual harvesting statistics to account for different timber assortments, such as pole wood, industrial wood, and fuel wood [
50]. Ten age- and stand density-dependent parameters were selected, which are classically used in forest management decisions or which were confirmed by consulted practice partners from forestry, regional planning, and regional economic development coordination to be helpful for decisions at regional scale. The different timber assortments were derived from tree species-specific forest harvesting statistics in the Federal State of Saxony in the year 2013 [
50] where their share is expressed as percentage of the annual yield. Such tables can also be generated on the basis of outputs of forest growth and yield models, such as SIMO [
51], EFISCEN [
36] or HEUREKA [
34].
Table 1.
Assessment parameters, which are addressed in the Biomass Module.
Table 1.
Assessment parameters, which are addressed in the Biomass Module.
| No. | Parameter | Abbreviation | Unit |
|---|
| 1 | Age class in 5-year steps | Age | (years) |
| 2 | Mean diameter of volume removed (at breast height) | DBH | (cm) |
| 3 | Harvestable timber with bark, >7cm Ø (“Yield”) | Y | (m³) |
| 4 | Current annual volume growth of merchantable stem volume | CAI | (m³) |
| 5 | Sum of volume removed of merchantable stem volume | Ycum | (m³) |
| 6 | Cubic meter standing | SV | (m³) |
| 7 | Mean annual volume growth of merchantable stem volume | MAI | (m³) |
| 8 | Fuel value per cubic meter of timber harvested | FV | (kWh) |
| 9 | Assortment: fuel wood | FW | (m³) |
| 10 | Assortment: industrial wood | IW | (m³) |
| 11 | Assortment: pole stand, timber for ties, stem wood | SW | (m³) |
Since the Biomass Module is dealing with huge data amounts at regional scale and the fact that the user information needed to be kept simple to assist in decision-making, different yield classes were not differentiated. As a standard, the dendrometric data of the second yield class, which represents average site productivity, was applied. Regarding the simulation of management strategies, moderate thinning was chosen. The according amounts of biomass are defined in yield tables, which are based on empirical, regional data (
Appendix Table A3). Mixed stands are addressed as a combination of a maximum of two tree species with individual ages. Leading tree species (share of 75%) were distinguished from admixed tree species (25%). Stand density, a measure for the stocking of the stands, was integrated as a factor, which has a value range from 0–1.4.
2.3. GISCAME- Framework
In the framework of the research project RegioPower, GISCAME [
43,
44] is applied for visualizing and assessing the impact of alternative land use scenarios in forestry and agriculture on (i) the production potential for biomass and (ii) the provision of ecosystem services at the regional scale. GISCAME combines features of a geo-information system, a cellular automaton, and multi-criteria evaluation. It integrates a database management system with several analytical research approaches [
41,
42]. As an outcome, it provides various reporting options. It is being developed since 2007 by a core development team (from Centre for Development Research in Bonn, Germany, and PiSolution GmbH in Markkleeberg, Germany) and additional (changing) project partners.
So far, GISCAME was mainly employed for assessing land use change scenarios with a focus on the sectors forestry and agriculture [
21,
52]. The impact of land use change is assessed in qualitative manner and visualized in capacity maps and a radar chart. The assessment is based on a multi-criteria evaluation approach that includes indicator values as well as expert assessments, which are normalized to generate comparability (
Figure 2). An assessment matrix is the basis for the ecosystem services assessment. Each land use type has values between 0 and 100 regarding each ecosystem service. Through the conversion of land use type-specific indicator values into relative values, the comparison of various services with different indicators was facilitated. For a regional assessment, mean values of all grid cells in a map concerning each ecosystem service are calculated [
45]. The basic simulation allows integrated assessment of up to 10 ecosystem services [
40]. Regarding the provisioning service “wood production” in the basic GISCAME evaluation, the harvestable volume of timber with bark with a diameter of more than 7 cm was used as indicator for each forest type.
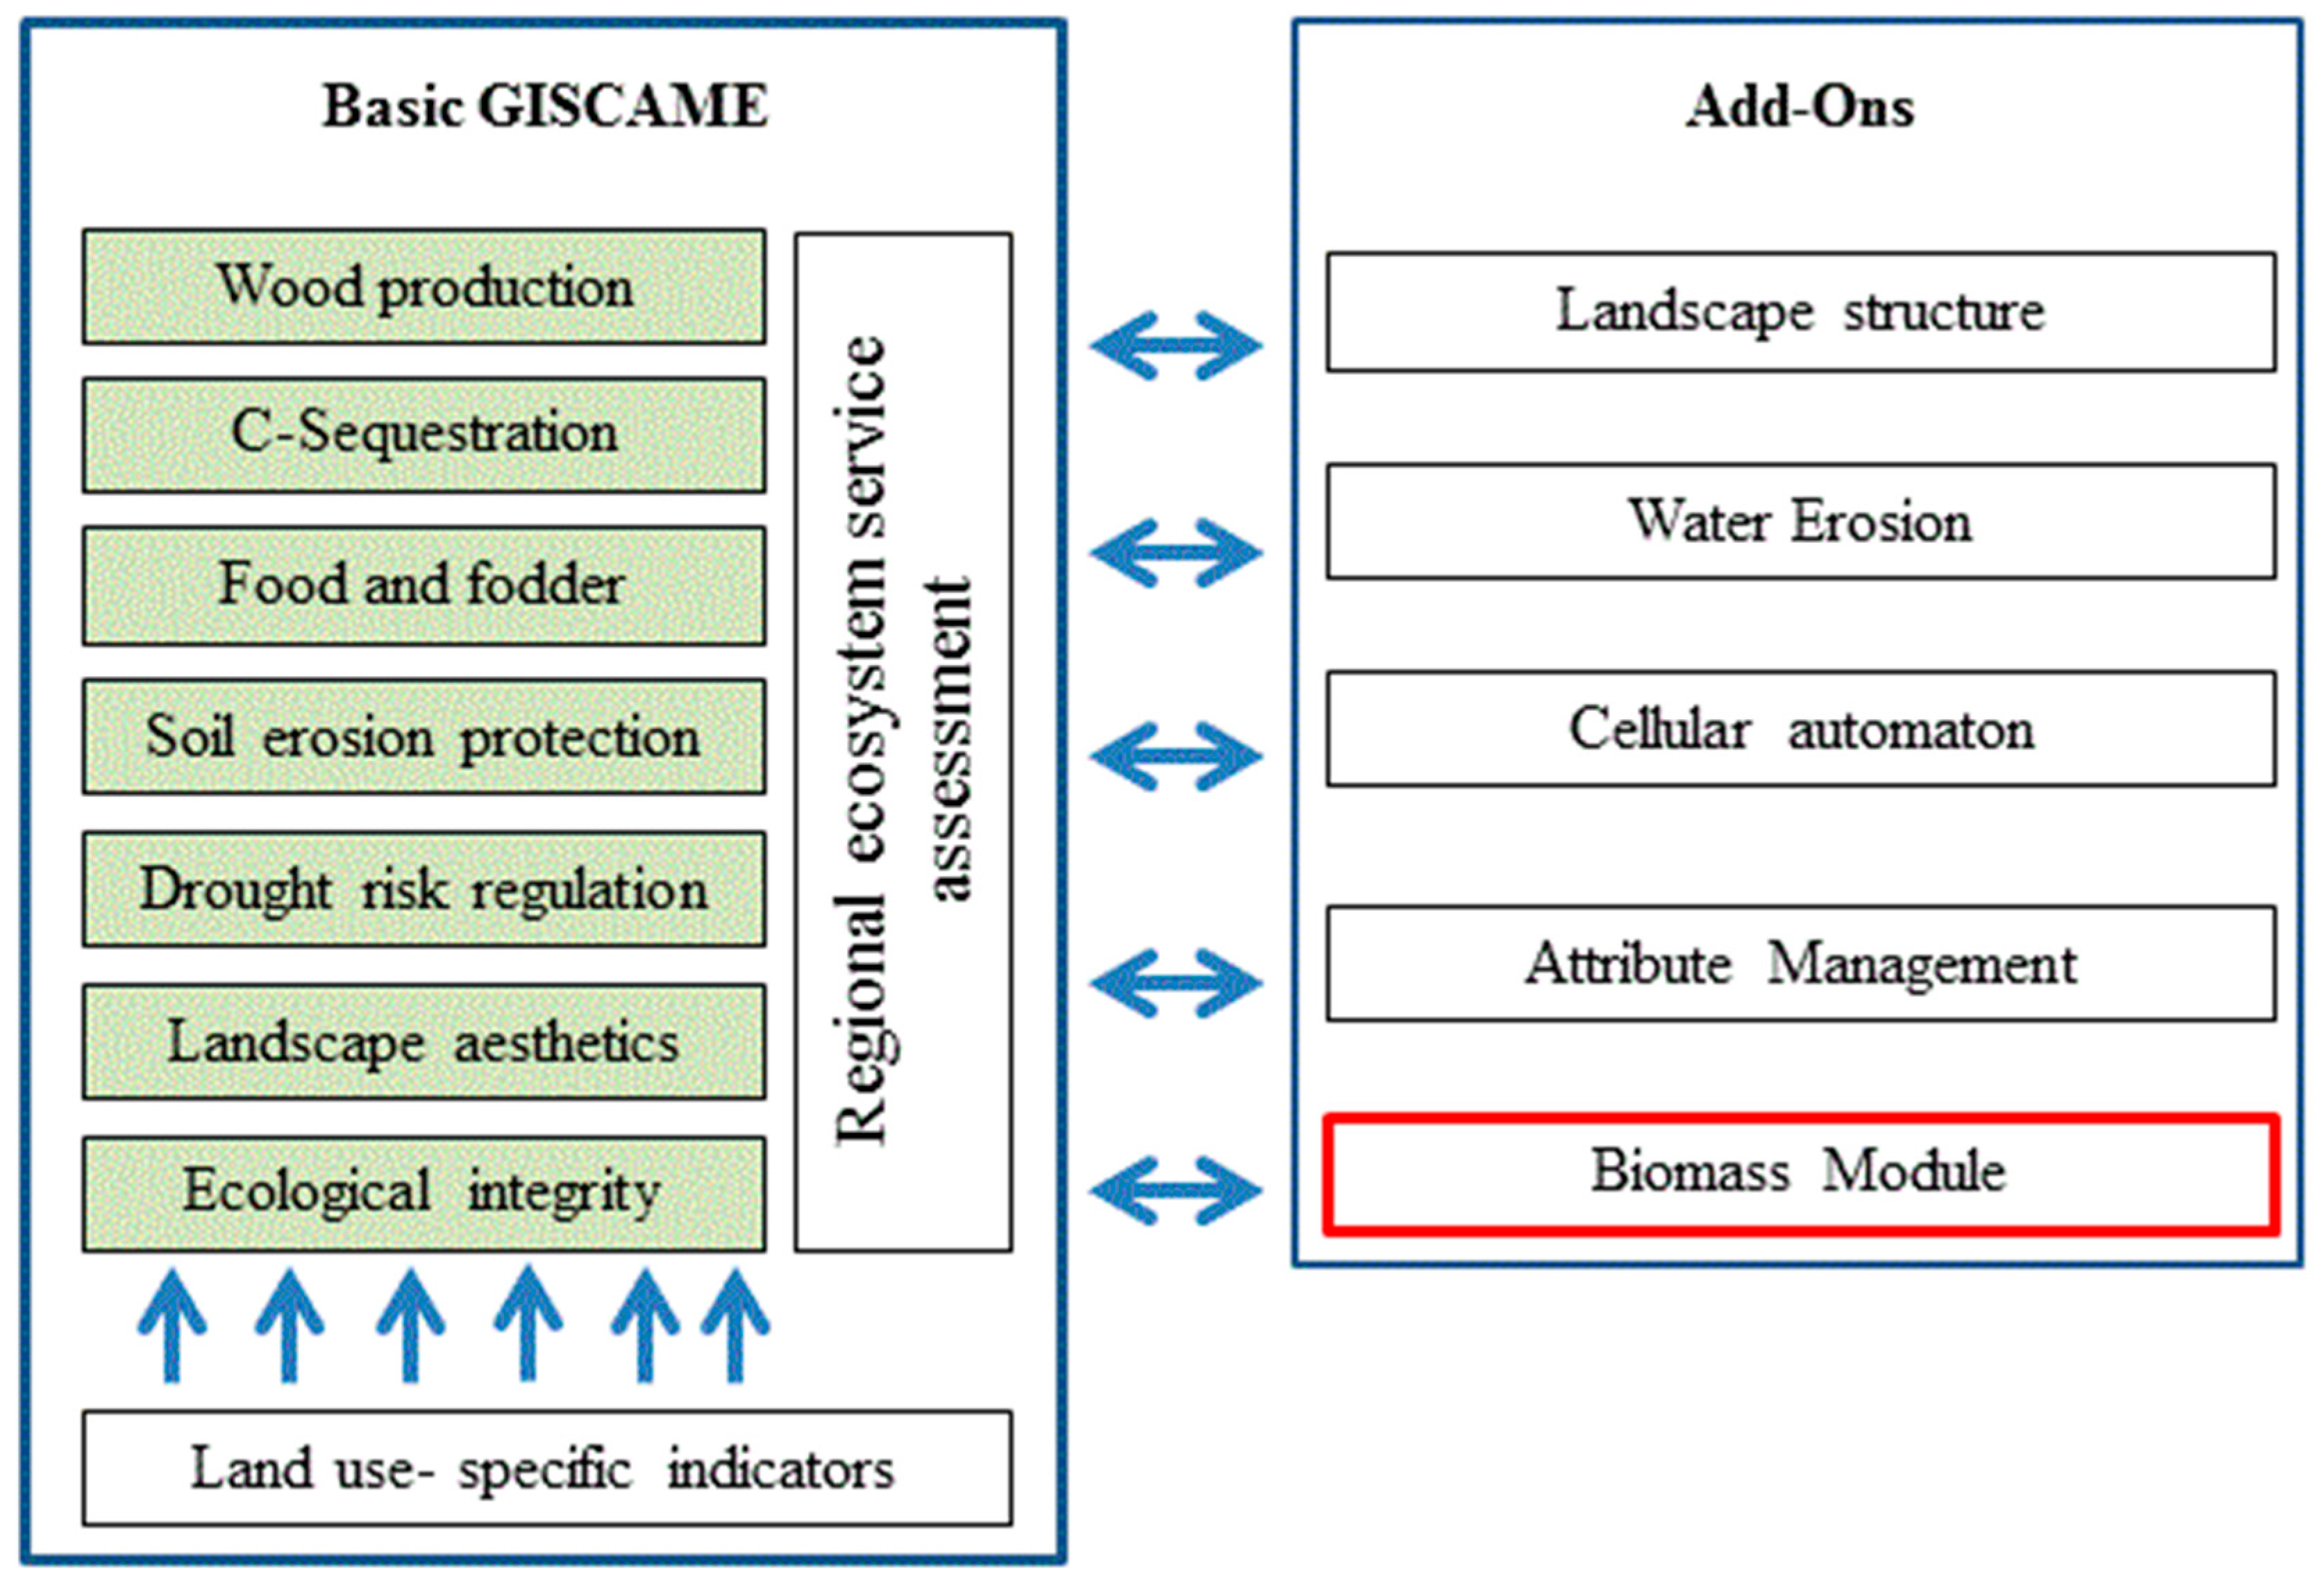
Figure 2.
Overview of the main components of GISCAME. In addition to the basic land use type-specific ecosystem services assessment (left side), add-ons facilitate in-depth analyses (right side). The Biomass Module is introduced and applied in the study at hand.
Figure 2.
Overview of the main components of GISCAME. In addition to the basic land use type-specific ecosystem services assessment (left side), add-ons facilitate in-depth analyses (right side). The Biomass Module is introduced and applied in the study at hand.
Additionally, five add-ons refine the scenario development and the evaluation of the land use change alternatives (
Figure 2, right side). They form an extension of the GISCAME framework, which can be used in addition to the basic ecosystem services assessment. The add-ons have been developed in different research projects with different targets. The add-on “Landscape Structure Module” [
53,
54] supports the assessment of additional effects of land use changes on the ecological and aesthetic value of the landscape. The add-on “Water Erosion Module” [
49] facilitates the calculation of water erosion potential and creation of erosion risk maps. Two more add-ons serve the scenario development. The “Attribute Action Management System” allows the merging of attribute layers; the “Cellular Automaton” supports explorative scenario development on the basis of transition probabilities and neighborhood interactions. To integrate the estimation of lignocellulosic biomass in the ecosystem services assessment platform, a fifth add-on, the “Biomass Module”, was developed.
Before the Biomass Module was programmed, the concept was brought into line with regional requirements, which is one step of the phases of decision-making [
27]. This analysis was applied to support participation in decision making and to meet various expectations of different stakeholders [
55]. As a consequence of the requirements analysis, the main focus was put on user interfaces and decision support.
2.4. Concept and Approach of the Biomass Module
On the basis of user requirement analysis, the Biomass Module was linked with growth and yield models via a data-base application. Model coupling involves feedback between models; in contrast, linking models only means an exchange of model outputs. Dynamics in forest growth and yield were reproduced using “one-way” linking [
56] with growth and yield tables. The user requirement analysis had further influence on the module architecture (
Figure 3). The Biomass Module is subdivided into four components.
Figure 3.
Model architecture of the new Biomass Module, consisting of four parts which are linked to further data, models, or software. LU/LC… land use/land cover.
Figure 3.
Model architecture of the new Biomass Module, consisting of four parts which are linked to further data, models, or software. LU/LC… land use/land cover.
Component 1 covers the data base. The system requires (i) land use/land cover (LU/LC) data, (ii) the spatial distribution of the age classes of land use types, which provide biomass, and (iii) yield tables, which might be the output of models or empirical data. Additionally, more layers can be uploaded. Such attribute layers might be for instance (future) climate conditions, soil properties, or ownership types.
When the data base is complete, all input data can be mapped (component 2). Besides the land use/land cover maps, it is possible to display attribute maps, which means spatially explicit presentation of additional information, such as ownership type, slope, and so on.
The consideration of temporal and spatial dynamics is incorporated by a simulation toolbox (component 3). The user defines the temporal horizon, medium-term or long-term simulation. A period of up to 200 years in five-year (or larger) increments can be considered. The temporal analyses are foreseen to better account for the role of temporal dynamics in forest systems at landscape scale.
For the simulation of planning alternatives, several management options are available. Besides land use change (including afforestation and deforestation), a point-and-click graphical user interface [
35] with dropdown menus allows the simulation features ‘forest conversion’ and ‘clear-cut’ in a user driven (participatory) manner [
57]. The final land use map might be further analyzed using the assessment routines in GISCAME including trade-offs for other ecosystem services, potential maps, landscape structural aspects, and water erosion [
40,
45], for example.
Results are displayed in a separate window (component 4). The user can choose parameters, forest/stand types, and time steps, which should be displayed graphically or in tables. Finally, a report can be compiled. It contains the framework conditions (coordinates, user, etc.) and the user can choose which data he/she wants to export. Besides the report in pdf-format, it is possible to export the land use data as ASCII-formatted text files, which are compatible to geographic information (GIS) systems. Tables can be exported in csv-format (comma-separated values, compatible with MS-EXCEL, for example).
2.5. Scenario Development
For the focus area Müglitz valley, alternative management options were developed to illustrate and communicate the wood supply potential in the model region. The scenarios focus on two planning issues, which have to be taken into account in the planning region. Due to the energy turnaround in Germany, demand for energy wood is increasing [
57]. Simultaneously, climate change-adapted forests are required and subsidized by the government [
58].
Initially, before management scenarios were developed, the data for the whole planning region was further specified to derive more realistic results. The values which were calculated with the Biomass Module originally represent the theoretic potential [
59]. This means that all state forests were taken into account, irrespective of site conditions (such as soil type, slope, and climate) and legal status (managed or protected forests). The theoretic potential gives a very rough overview of how much wood might be available in a landscape, and it does not reflect the available amount of wood. In a next step, the technical potential [
60], or technical-ecological potential [
59], was taken into account by reducing the theoretical potential due to poor accessibility or due to legal restrictions on timber use (nature protection areas). To achieve values for the more realistic and practice-oriented technical potential, a special feature was introduced into the Biomass Module. It allows exclusion of non-accessible stands from potential analysis. In our case, areas with steep slopes (>15°) and protected areas (forest management forbidden) were identified and practically excluded from the calculations by reducing the potential yield by 90%. Protected areas in the model region are one national park (Saxon Switzerland) and a number of nature protection areas.
In contrast to the theoretical and technical potential, the economic potential refers to the economic added value. This aspect was not considered, because of large uncertainties considering market-price development. In the presented study, the effective potential was used by implementing assumptions concerning the ownership type. In Saxony, privately owned forests are only mobilized to a rate of 60%, whereas for municipal forests and church forests a mobilization rate of 86% was assumed [
47]. State forests were defined to have a mobilization rate of 100%. The mobilization rate is the share of potentially harvestable wood, which really is harvested depending on the ownership type.
Figure 4 illustrates the influence of the factors ownership type, nature protection status, and slope that lead from theoretic to effective potential of wood provision regarding the whole planning region (see also
Figure 5). The highest impact of 9% had the ownership type. This factor reduced the theoretic potential according to the respective mobilization rates. The potential was reduced by 90% at slopes larger than 15%; at nature protection sites, also just 10% of the theoretical potential was considered. Slope and protection status equally reduced the potential yield by 3%, respectively. As several factors can overlap, the combination of the three factors resulted in a reduction of the theoretical potential yield in the model region by 30%.
Figure 4.
From theoretical to effective potential: site-specific attribute data reduce the yield of the model region (yield in m³ at time step zero).
Figure 4.
From theoretical to effective potential: site-specific attribute data reduce the yield of the model region (yield in m³ at time step zero).
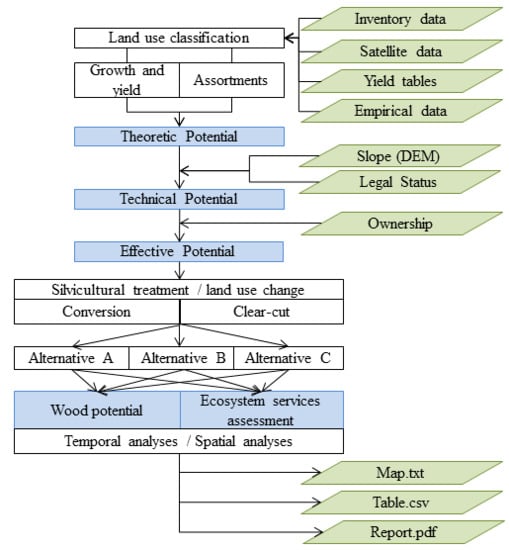
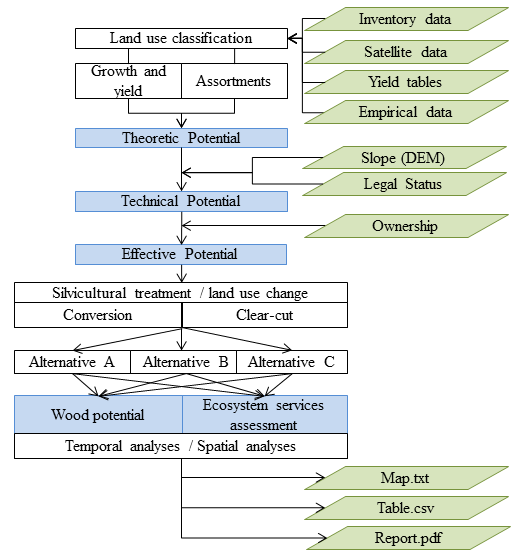
Figure 5.
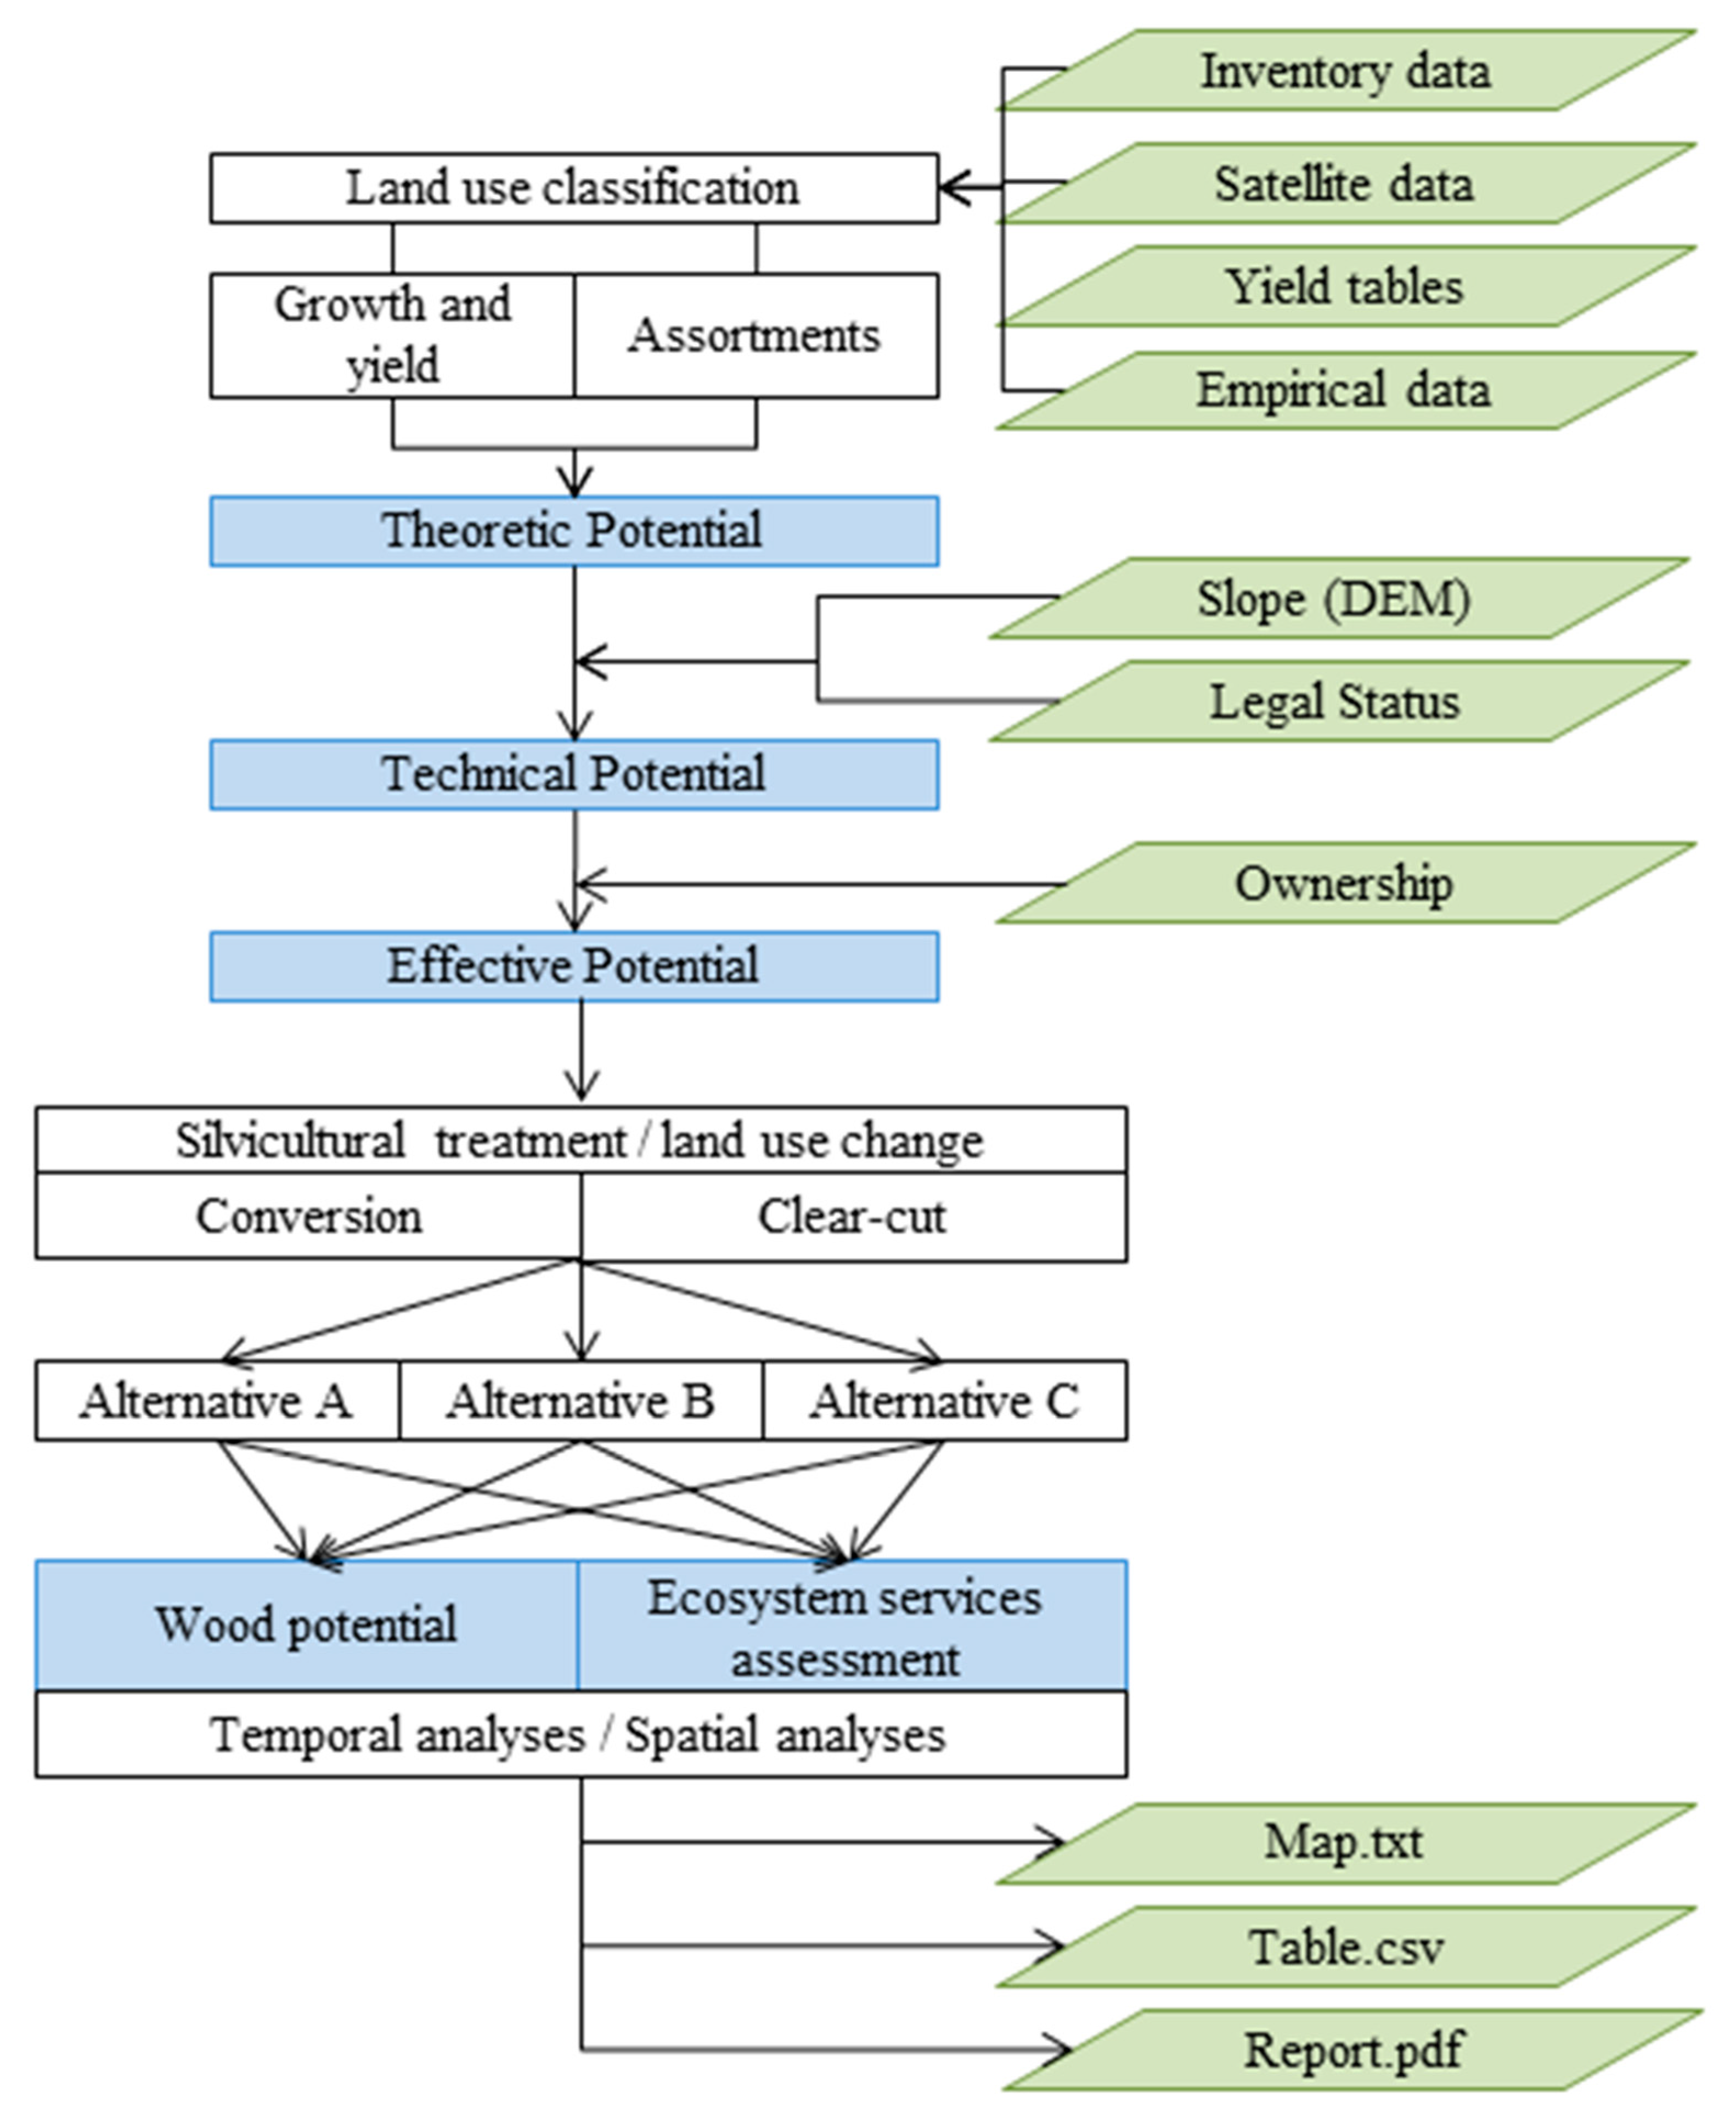
Flow chart of methods and data that were used to simulate management alternatives in the planning region “Upper Elbe Valley/Eastern Ore Mts.”. Green parallelograms represent data; blue squares are (intermediate) outputs, which are used for supporting decision-making.
Figure 5.
Flow chart of methods and data that were used to simulate management alternatives in the planning region “Upper Elbe Valley/Eastern Ore Mts.”. Green parallelograms represent data; blue squares are (intermediate) outputs, which are used for supporting decision-making.
The actual scenario development in the Biomass Module occurs user-driven. One user of the new add-on is the East German Society of Forest Planning, which is one representative of the regional stakeholder group. For the focus area Müglitz valley, five scenarios were defined, which exemplify management strategies according to regional planning issues in six time steps (today (0) and in five, 10, 15, 20, 50, and 100 years). They cover medium-term and long-term planning. Management actions take place at different time steps. Main drivers for the scenario development were firstly climate change and, therefore, the need for site-adapted, resilient forest types. Second, the increasing demand for renewable energy from forests was taken into account by simulating the introduction of fast-growing trees in forests and agricultural areas. The scenarios were defined as follows:
Business as usual (“BAU”): No land use change simulated; served as reference scenario.
“Conversion-SRC-Afforestation”: Conversion of pure stands into climate change-adapted and site-specific stand types in time step zero (T0, today). Following the forest development types defined by the state forestry association [
61], pine and larch stands were converted into oak-beech stands. Beech was converted into beech-maple (whereas the tree species group “maple” includes also other hardwood species, such as lime and elm). Spruce was converted into beech-oak. Five years later, in T1, short rotation coppices (SRC) were introduced at 50% of agricultural sites, which are currently used as pastures. After 15 years (T3), remaining pastures were converted into SRC and the old SRC plantations were afforested using the mixed stand type beech-oak. This scenario combined target of Climate Change adaptation and energy demand.
“Pastures to beech-oak”: In T0, agricultural sites, which are currently used as pastures, were afforested using the mixed stand type beech-oak. This strategy contributes to both climate change adaptation and increased supply of energy wood.
“Pastures to SRC”: In T0, agricultural sites, which are currently used as pastures, are planted with SRC. The scenario focused on energy wood production.
“Pure to mixed stands”: Conversion of pure stands into climate change adapted and site-specific stand types in time step zero (T0) following the same strategy as in scenario 2. This last scenario aims at climate change adaptation.
The most probable scenario is scenario 5, which is pursued as an objective of the German and Saxon governments. A conversion of pasture land into short rotation coppices as assumed for scenarios 2 and 3 is less probable. Although this fits into the regional climate change adaptation strategy, ownership restrictions would prevent such land use changes. From experience, farmers in this region do not tend to convert pastures into a forest-like land use system. Scenarios 1 and 3 (no change and afforestation of pastures) are not probable. Scenario 1 was included as reference scenario. Scenario 3 was simulated to communicate the positive potential of an extension of forested area especially regarding ecological issues.
Figure 5 summarizes the methods starting with data for the land use classification (
Section 2.2), over scenario development (this sub-section), to final outputs on wood production and integrated ecosystem services assessment (
Section 2.3).
3. Results
3.1. Business as Usual
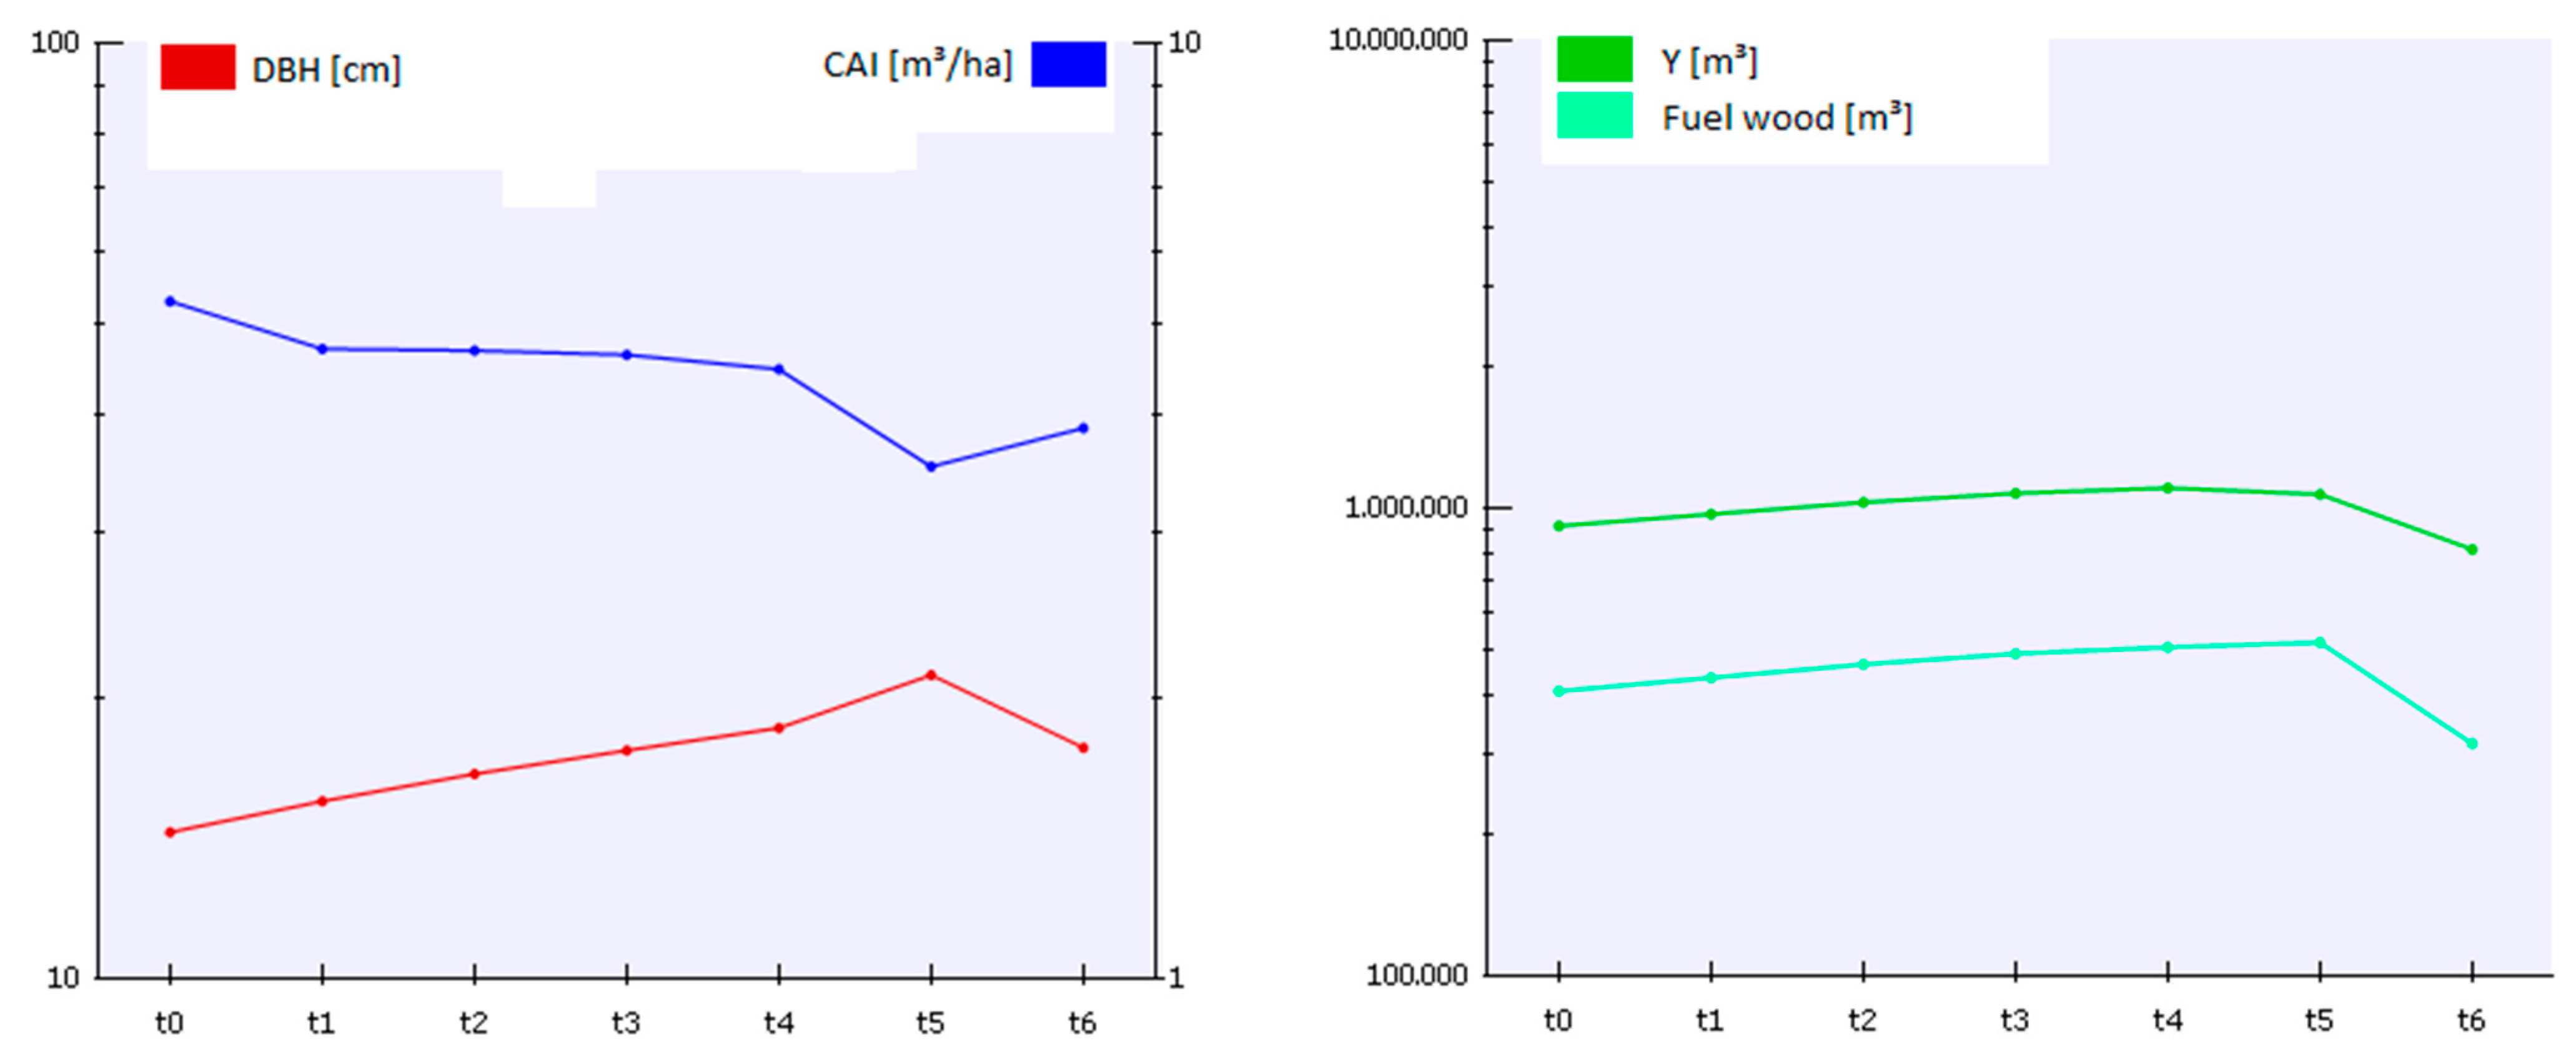
Figure 6 shows four exemplary parameters for the BAU-scenario (reference scenario without land use or forest management changes) after zero, five, 10, 15, 20, 50, and 100 years (in the graph time steps T0–T6, respectively). The graph illustrates the temporal development of the parameters. For the next 50 years, decreasing current annual increment (CAI) and increasing breast height diameter (DBH) can be expected, because the currently dominating spruce stands get older (T0–T5). In 100 years (T6), the rotation periods of the spruce stands will have started over again. In comparison with T0 (today), less yield (
Figure 6, right graph) and fewer increments, but higher diameters (
Figure 6, left graph) can be expected for long term forestry planning (T100).
Figure 6.
Development of the parameters breast height diameter (DBH [cm], logarithmic scale), current annual increment (CAI (m³/ha), logarithmic scale), yield (Y), and amount of fuel wood (FW) as one assortment derived from the expected yield. The latter two parameters are shown in [m³] at logarithmic scales.
3.2. Management Strategies in the Focus Area
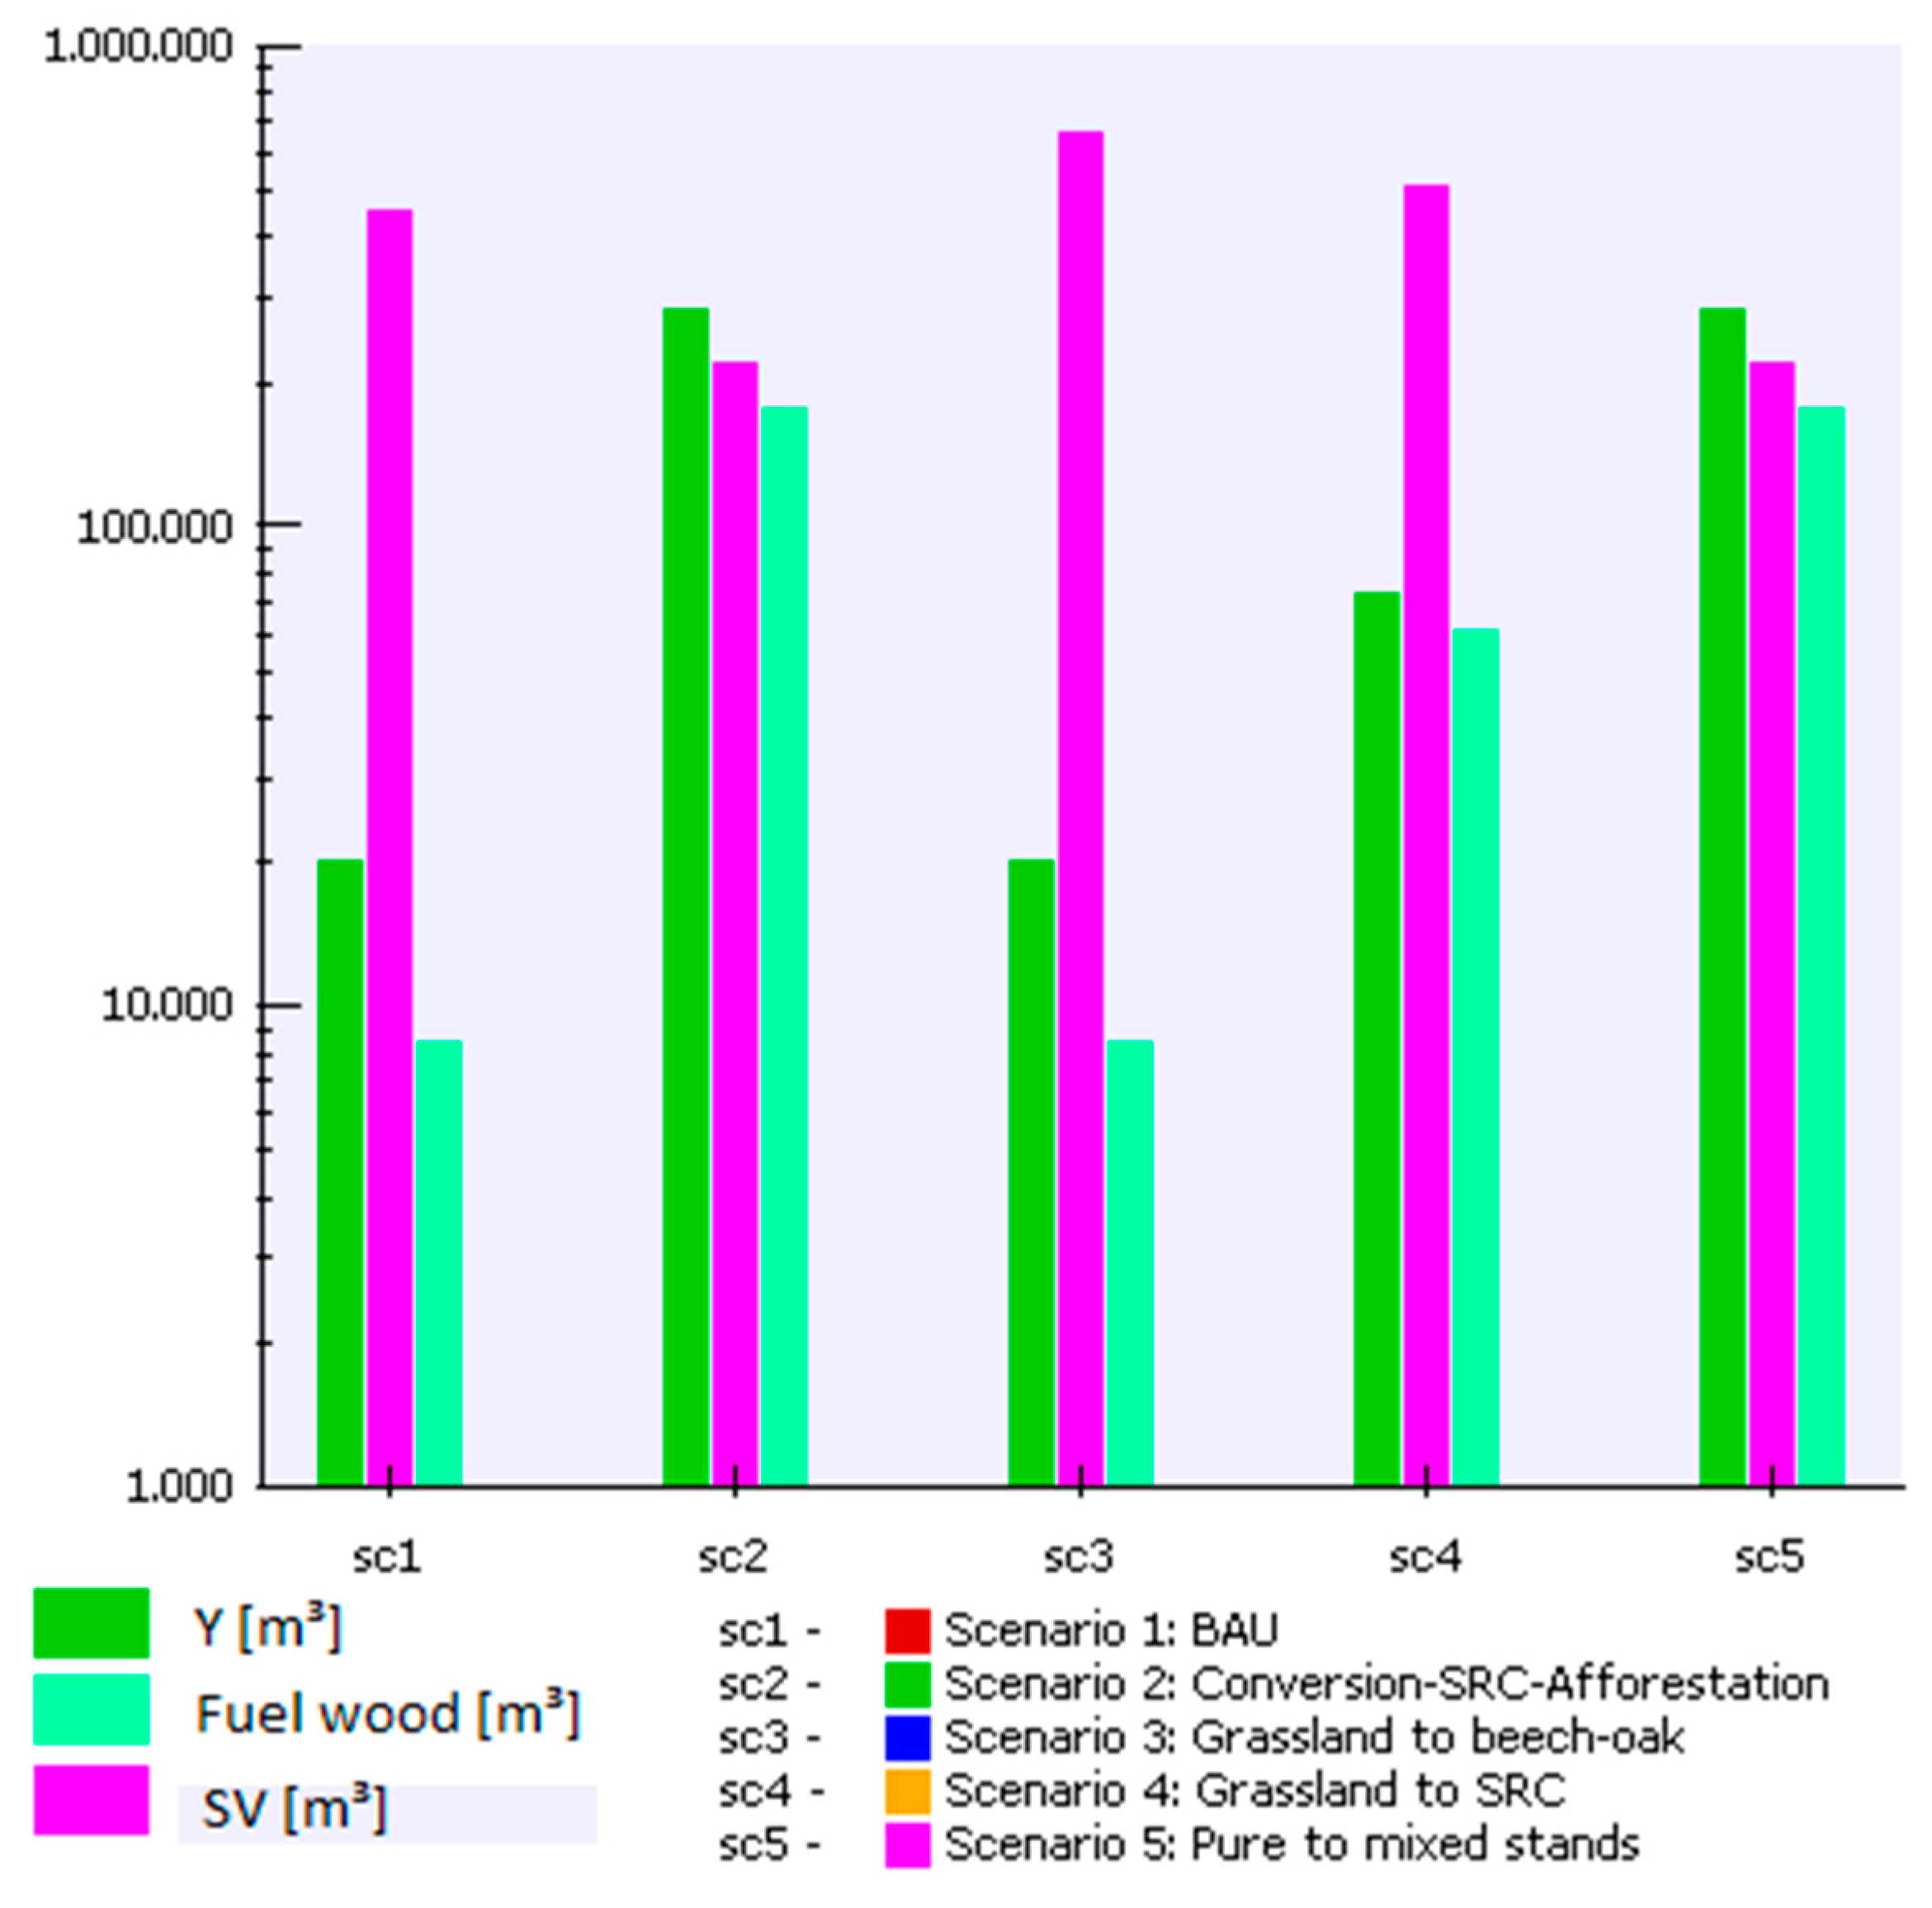
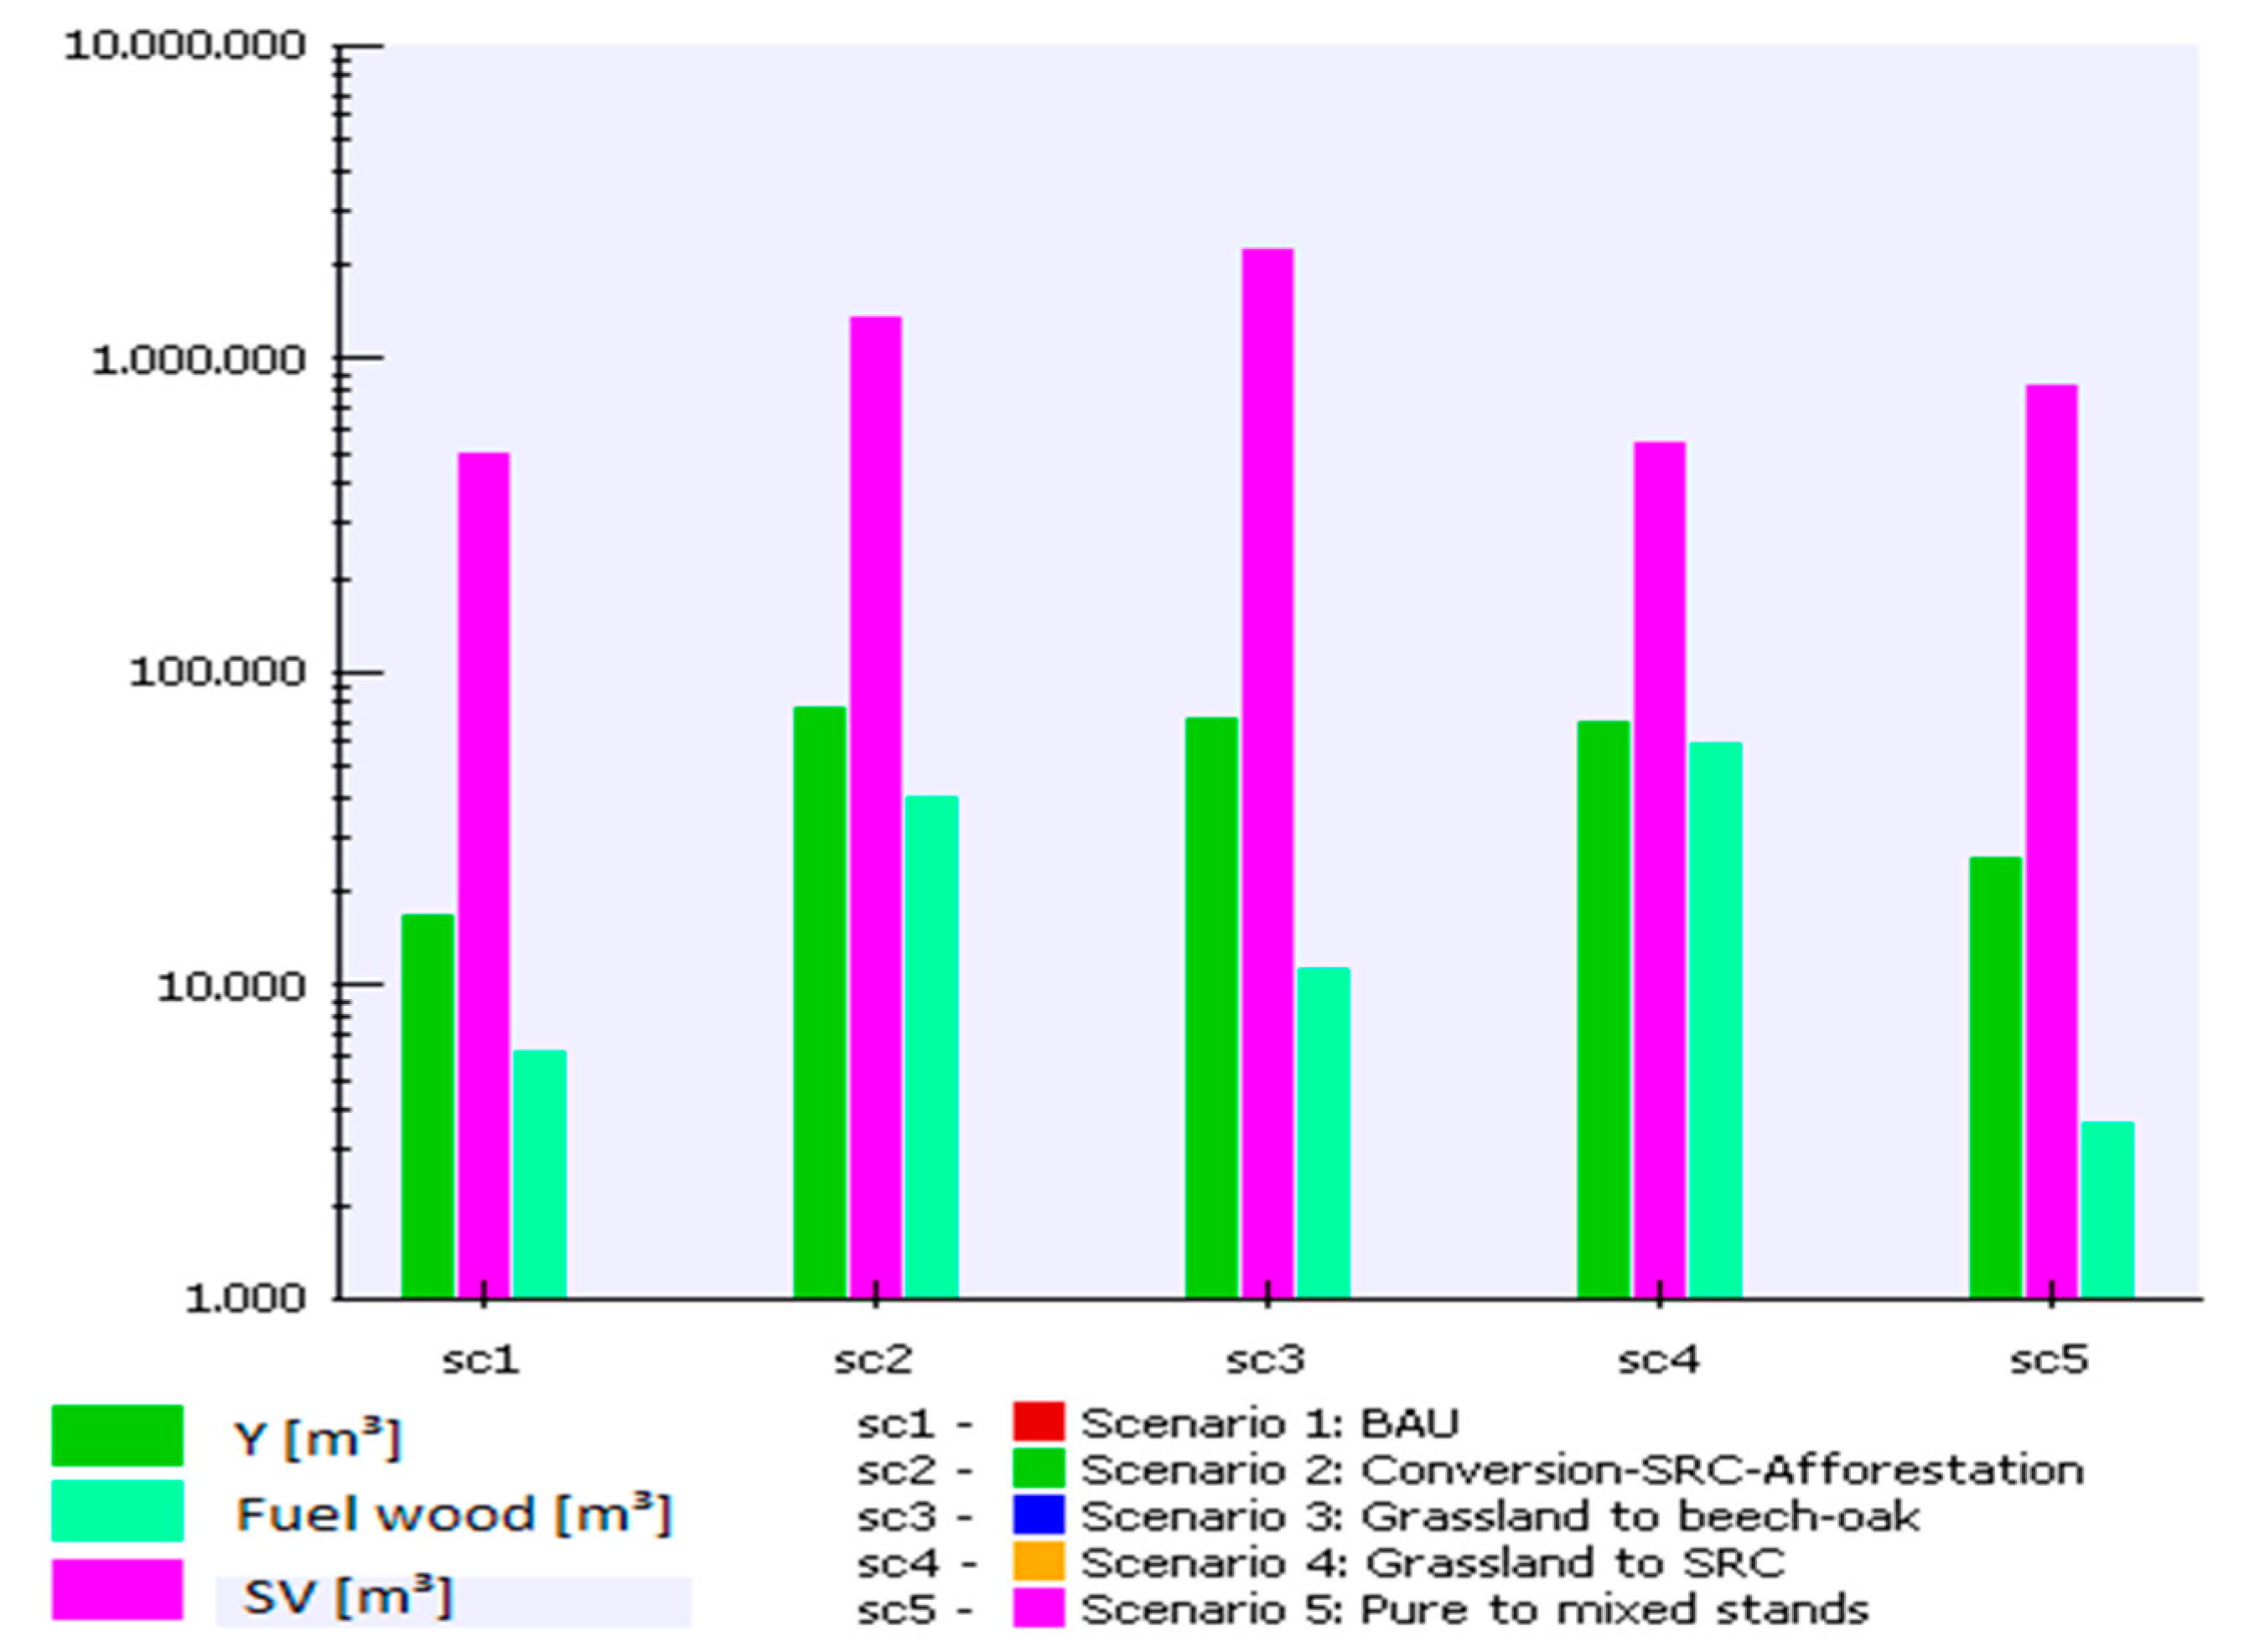
Figure 7 compares all five scenarios of the focus area Müglitz valley at time step zero (today). At this time step, most of the forest changes took place. Regarding the output parameters, this means that trees were partially removed or planted. As a consequence, yields are high where thinning/forest conversion took place. Despite the fact that newly planted trees (age class 0–5) did not contribute to yield (<7 m breast height diameter), they contributed a bit to the standing stock.
Sc1: Scenario 1 illustrates business as usual (BAU), without any land use changes.
Sc2: From forestry point of view, the second scenario might be very interesting. High yields were expected for the cost of the standing volume, because pure stands of pine, oak, beech, and larch were converted into mixed stands. A large amount biomass is expected to be harvested in the course of the conversion. Many young trees, which currently do not yet contribute to the harvestable volume, were planted in the formerly pure stands to create climate change adapted mixed stands.
Sc3: In scenario 3, the afforestation of pastures caused an increase in the overall volume of biomass. However, due to the young age of the new stands, the yield remained at a low level at this time step.
Sc4: A conversion of pastures into SRC, in contrast, resulted in higher yields. The assortment ‘fuel wood’ especially benefited, because yields from short rotation coppices can be expected already after five years, which corresponds to the first age class after planting (0–5 years).
Sc5: The fifth scenario had the same results as scenario 2, because in time step zero only forest conversion took place.
Figure 7.
Five scenarios for the focus area Müglitz valley at the time step zero. Yield (Y), standing volume (SV), and the assortment of fuel wood are illustrated. The colors of the scenarios correspond to
Figure 10.
Figure 7.
Five scenarios for the focus area Müglitz valley at the time step zero. Yield (Y), standing volume (SV), and the assortment of fuel wood are illustrated. The colors of the scenarios correspond to
Figure 10.
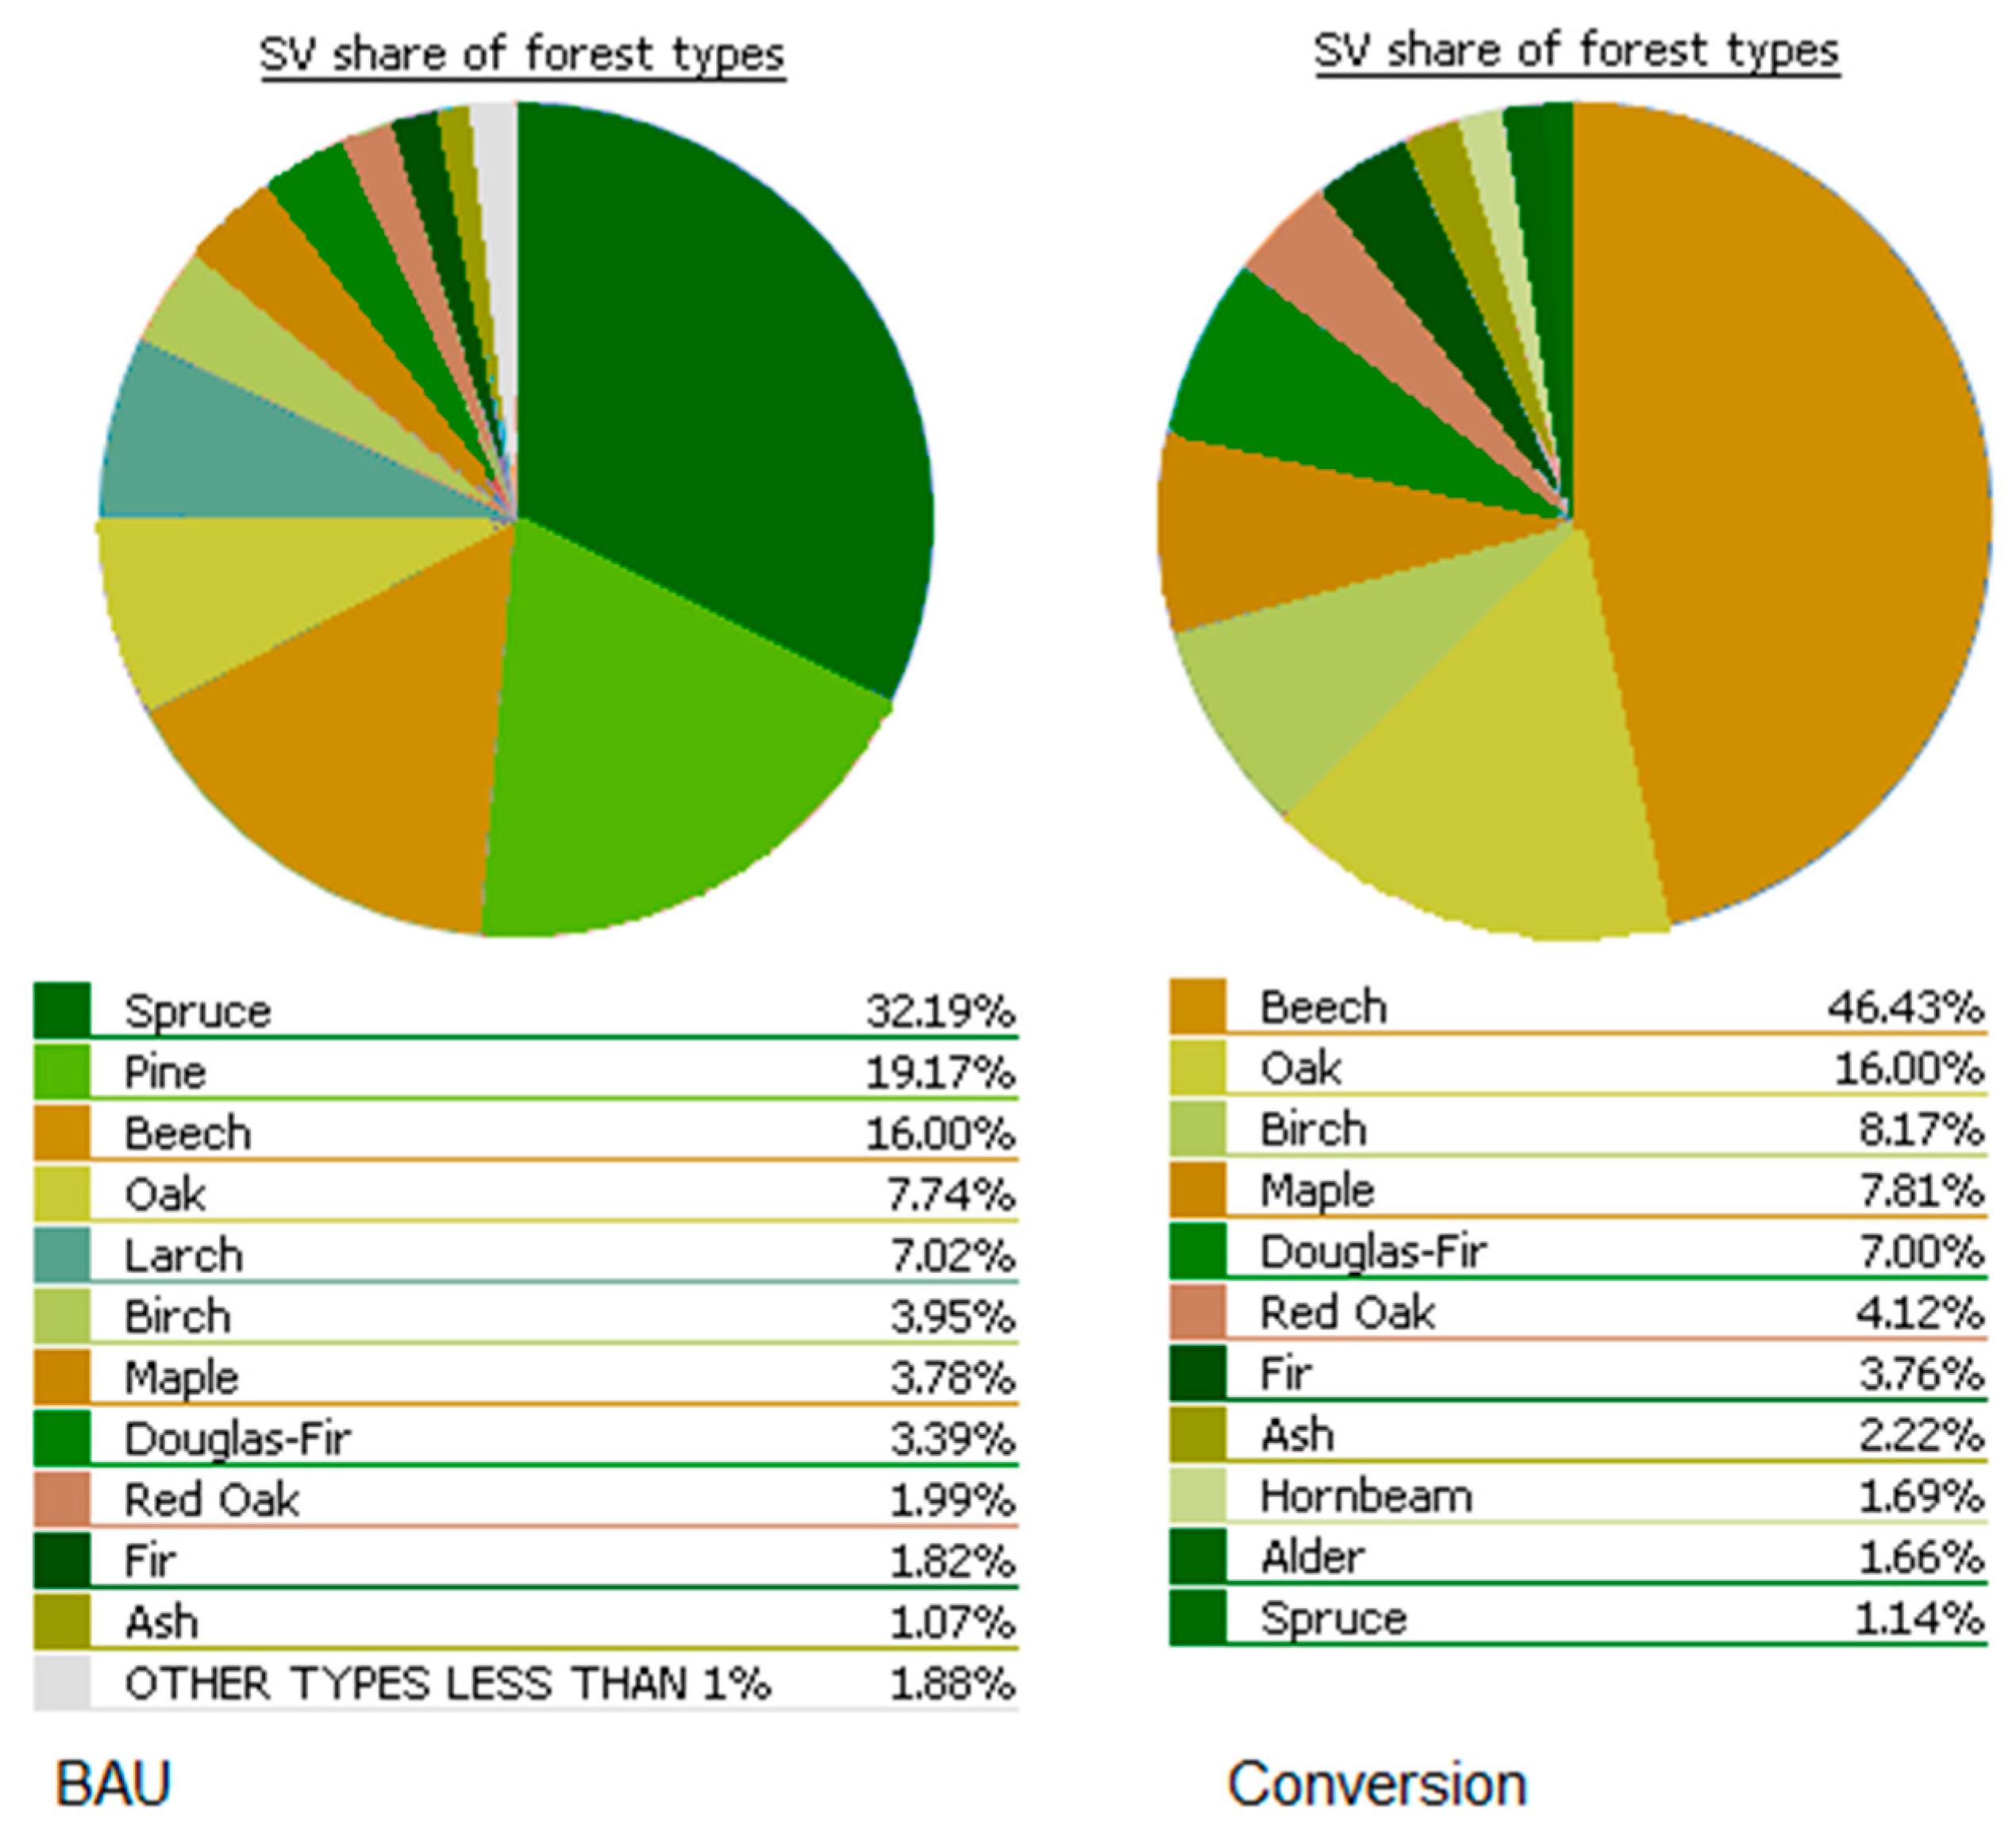
Figure 8.
Contributions to standing volumes (SV) per tree species in time step zero for the business as usual scenario (BAU scenario 1, left) and forest conversion in scenarios 2 and 5.
Figure 8.
Contributions to standing volumes (SV) per tree species in time step zero for the business as usual scenario (BAU scenario 1, left) and forest conversion in scenarios 2 and 5.
According to the management actions described in the scenario development (
Section 2.5), the shares of tree species changed in time step zero.
Figure 8 shows the percentage of tree species in the focus area for the BAU (scenario 1) and after the conversion of pure stands into mixed stands (scenarios 2 and 5). The comparison of the scenarios shows that shares of beech and oak contributing to the stocking volume significantly increased. Because the new beech- or oak-dominated stands are young, less common tree species like birch, maple and Douglas fir became relatively more important.
In the long term forest development planning (100 years), the forests are mature and their current annual increment/mean annual increments changed in comparison to the young stands (
Figure 9).
Sc5: Apparently, a forest conversion from pure to mixed stands, which did not include any measures to increase wood production (e.g., fast-growing trees like spruce in forests, or SRC in agriculture), led to increased yields, but decreasing fuel wood amounts compared to the BAU (scenario 1). The wood from the climate change-adapted forests would predominantly be used as industry wood [
42].
Sc 2: In contrast, the combination of climate change and site-adapted forest conversion combined with an iterative replacement of pastures by short rotation coppices would generate higher yields. Due to afforestation of some SRC areas in time step 3 (after 15 years), also the overall timber stock at landscape scale would increase.
Sc 3: Afforestation without introducing SRC would lead to high overall biomass volumes and high yields, but the harvest of mature oak- and beech-dominated forests would mainly serve for industrial purposes [
42].
Sc 4: The land-consuming planting of SRC on pastures would result in the long term in stable yields, especially for energy production.
Figure 9.
Five scenarios for the focus area Müglitz Valley at the time step 6 (after 100 years). Yield (Y), standing volume (SV), and the assortment fuel wood are illustrated. The colors of the scenarios correspond to
Figure 10.
Figure 9.
Five scenarios for the focus area Müglitz Valley at the time step 6 (after 100 years). Yield (Y), standing volume (SV), and the assortment fuel wood are illustrated. The colors of the scenarios correspond to
Figure 10.
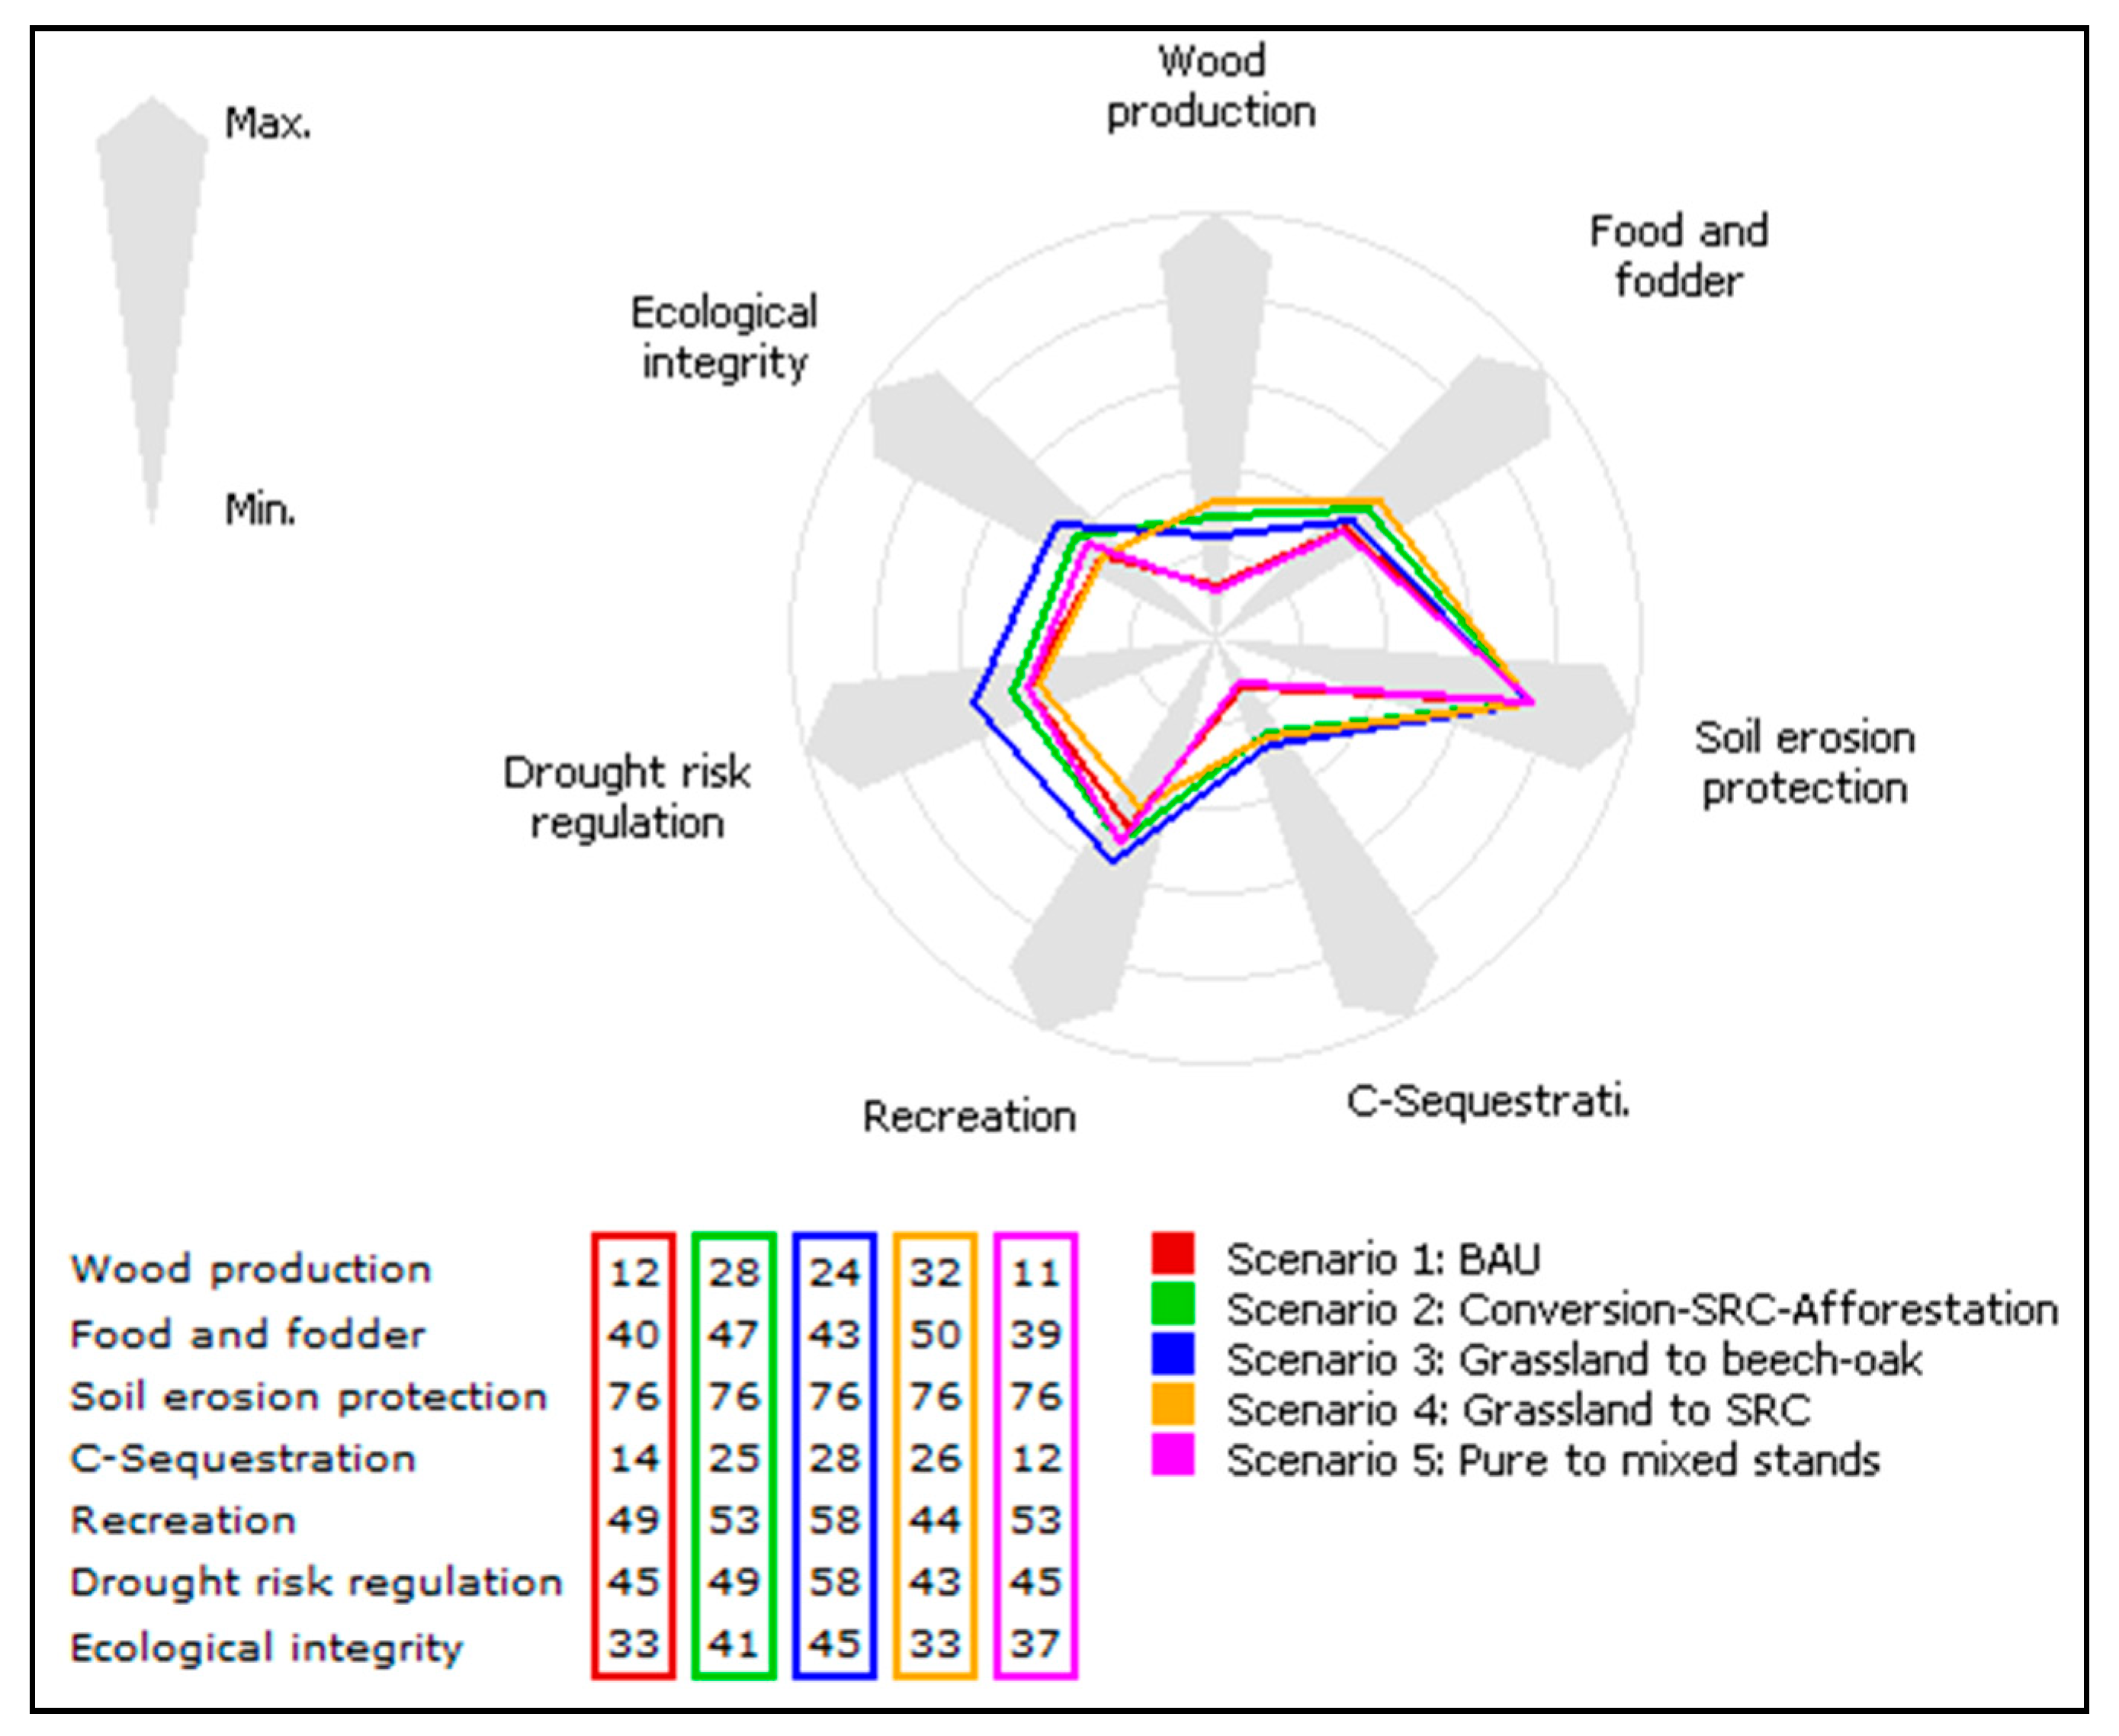
Figure 10.
Comparative analysis of the five scenarios regarding seven ecosystem services.
Figure 10.
Comparative analysis of the five scenarios regarding seven ecosystem services.
3.3. Cross-Sectoral Ecosystem Services Assessment
To consider the effects of the alternative forest management strategies on the ecosystem services in the focus area, an integrative analysis was carried out in the GISCAME. The aim was to discover possible trade-offs of sectoral planning approaches with regard to the landscape’s potential to provide ecosystem services. In GISCAME, only land use change is evaluated; the aspect of temporal fluctuations in the provisioning potential for biomass is not considered here.
Figure 10 illustrates the performance of the scenarios in a radar chart that counts from zero (no relevant potential) to 100 (maximum regional potential).
Sc2: Scenario 2 was evaluated positively from a forestry point of view (see
Section 3.2). Both wood production and food/fodder production increased. The fast-growing short rotation coppices (SRC) and the increased share of forest positively affected the carbon sequestration potential. Broad-leafed mixed stands received high values for recreation and ecological integrity. Furthermore, drought risk regulation was enhanced by the afforestation, which took place in T15. Broad-leafed forest had better water holding capacity compared to any agricultural use. Soil erosion protection was not influenced, because land use change only took place on grassland, which had good soil protection properties compared to arable land (same is true for the other scenarios).
Sc3: The afforestation of grassland with beech-oak mixed stands in scenario 3 showed even more positive results regarding the selected ecosystem services. Especially non-market goods and services, such as recreation potential, drought risk regulation and the basis for ecosystem service provision, the ecological integrity profited from this land use change. Despite good evaluations for wood production and food and fodder provision, these services did not reach the high values as observed for scenario 2.
Sc4: The best evaluation in terms of wood, food, and fodder provision was achieved by scenario 4. Also, carbon sequestration was enhanced. However, recreation potential decreased compared to the BAU scenario. SRC have high water demand and a transpiration coefficient. Therefore, drought risk regulation also suffered trade-offs. Ecological integrity could not be increased in the SRC scenario.
Sc5: Scenario 5 revealed slight, positive changes. Ecological integrity increased, while the provision of wood, food and fodder as well as carbon sequestration potential marginally decreased. A positive trend was observed for recreation.
5. Conclusion and Outlook
An extension of the land use change simulation software GISCAME was introduced. It focuses on forest management in the context of integrated landscape management. Using the new Biomass Module, land use/land management alternatives were developed and evaluated and consequences of these different courses of action were considered. The web-based approach allows institutions and stakeholders to interact irrespective of temporal or spatial constraints. At the same time, it was shown that provision of ecosystem services depends on time, which needs to be considered in decision support systems. The scenarios illustrated that not only the spatial composition and configuration of forests and agricultural land, but also its age influenced provisioning services. The Biomass Module therefore contributes to the demand for tools that support the understanding of environmental issues [
23]. Biomass Module, however, was not developed to compete with local forest management support tools or agencies, but to reflect regional behavior of a landscape as a result of management changes. A prototype was presented, meaning the technical framework with a first setup, which is now available for any kind of new (or more precise) data for this or other regions. It can and should be run in future with updated data.
In the context of climate change and increasing demand for energy wood, the following consecutive implications for regional planning can be made:
- 1)
The Saxon forest development strategy for climate change adaptation does not affect the wood production considerably. Regarding ecological integrity and landscape aesthetics, positive impacts can be expected. Such positive impacts can be intensified by extending forested areas.
- 2)
The planting of short rotation coppices can increase energy wood production, but it also involves risks in terms of drought risk regulation and landscape aesthetics.
- 3)
Not only land use change, but especially land management change, like more intensive use of private forests, has the potential to cope with rising wood demand.
Moreover, the presented study contributes a new approach for assessing regional biomass potential. While exact, process-based tree and stand models are available, there was a gap regarding mixed stand simulations at the regional scale. The approach offers advantages in comparison with existing timber supply studies. First, it offers estimations not only for state forests, but for the whole forested and agricultural area of a region. Second, besides leading tree species, mixed stands can be considered. The interface to GISCAME allows the integration of such information into regional planning and contributes to the support of rural area development.
Regarding the model approach, in addition to the already integrated restrictions (slope, ownership type, and protection status), accessibility of timber is of high interest to refine the estimation of biomass potential. In future steps, an extension of the Biomass Module by such an analysis is desirable. For this purpose, spatially explicit approaches are recommended, such as landscape metrics that are already used in another GISCAME add-on [
53,
54]. Metrics, such as road density or nearest distance to roads, might be appropriate methods to refine the information on the accessibility of timber resources.


