Article

Spatial Heterogeneity in Chinese Forest Area Change in the Early 21st Century

1
Key Laboratory of Land Surface Pattern and Simulation, Institute of Geographic Sciences and Natural Resources Research, Chinese Academy of Sciences, Beijing 100101, China
2
University of Chinese Academy of Sciences, Beijing 100049, China
*
Author to whom correspondence should be addressed.
Forests 2016, 7(10), 232; https://doi.org/10.3390/f7100232
Submission received: 14 May 2016 / Revised: 21 July 2016 / Accepted: 28 September 2016 / Published: 12 October 2016

Abstract

:
A comprehensive set of 30-m resolution land coverage data of 2000 and 2010 was used for an analysis of the spatial heterogeneity of forest area change in early 21st century China. Four regression models were built to determine the current situation of the ‘forest transition’ in China. The results show that forest area in China has grown rapidly over this period such that total forest area has increased by 102,500 km2 and forest cover has increased by 1.06%. Our results demonstrate the presence of a ‘U-shaped’ relationship, the so-called ‘forest transition’, between forest area change and per capita gross domestic product (GDP). We estimate that the inflection point in the Chinese ‘forest transition’ will be at a per capita GDP of 50,522 yuan. In the future, regions with lower elevations, or slope, should be the focus of attention because of dramatic recent forest changes. In particular, forest areas in the regions of the Xiaoxing’anling-Changbaishan Mountains and in South China have markedly decreased, and these are areas of concern. In the meantime, the government needs to strengthen the management of large-scale interconversions between forest and grassland.

1. Introduction

Forests are very important components of terrestrial ecosystems, occupying one-third of the planet’s total land area [1]. Indeed, forests play key roles in protecting and regulating climate, protecting biodiversity, and controlling soil erosion [2]. At the same time, forests often also provide the basis for large-scale economic development; thus, human requirements modify forest cover patterns and further influence these ecosystems, which is reflected in observed spatial-temporal changes in area. This is one key research issue that covers both land use and land cover change and global change biology.
Data show that changes in forest area tend to follow a ‘U-shaped’ curve that tracks economic development worldwide; this is called ‘forest transition’ theory by researchers [3,4]. To explain this trend, the ‘forest transition’ theory can be described as follows: Demand for agricultural and forest products increases as an economy and population grows, which leads to a spatial expansion of agricultural land, a reduction of forest area, and a corresponding decline in forest quality. After an economy develops to the inflection point of forest transition, agricultural production levels will increase, agricultural land expansion will cease and even start to shrink, and forest resources will begin to recover [5,6]. Specifically, the Chinese economy was maintained at a reduced level relative to its potential for a long time after the establishment of the People’s Republic of China; thus, food production is not necessarily able to meet people’s daily needs. For example, the government policy entitled ‘taking grain as the key link’ is aimed at promoting the expansion of agricultural production, but has had a considerable negative impact on forest resources. Further misguided policies, including ‘pumping out steel’, combined with the loose regulation of forestry policy have caused a huge loss of Chinese forest resources. Overall, three main periods of concentrated reductions in forest area can be identified: During the ‘Great Leap Forward Movement’ (1958–1961), during the ‘Great Revolution of Culture’ (1966–1976), and during the early years of ‘Opening-Up and Reform’ (1980s). Logging in particular seriously threatens forest resources because of the inflation in the price of timber; forest destruction has caused serious ecological problems, notably two massive flood events in the 1990s that aroused concern over the scarcity of forest resources in China among academics and the government. In response, logging was banned in China in 1998 and restrictions on the importation of forest products were loosened. The ‘Fast-Growing and High-Yielding Timber Base Construction Program in Key Areas’ was initiated to enhance the protection and regeneration of forest resources. Since the late 1990s, therefore, Chinese forest resources have been continuously increasing rather than rapidly decreasing [4,7,8,9]. According to official statistics from the State Forest Administration, during the sixth (1999–2003) and eighth (2009–2013) National Forest Resources inventories, the forest area and proportion in China grew by 32.78 million hectares and 18.74%, respectively. Although the forest coverage rate has increased to 21.63%, this rate is still lower than the global average rate (31.0%).
The rapid growth of forest resources in China has become an increasingly important topic in land use change research globally. Relevant academic research on the temporal and spatial variation in Chinese forests has focused primarily on two aspects: Firstly, the evolution of the carbon source/sink from the point-of-view of the state has been analyzed [10,11,12,13], while secondly, the relationship between the change in forest resources, economic development, and forestry policies were analyzed in order to estimate whether the ‘forest transition’ has taken place in China [14,15,16,17,18]. These studies have mainly been focused at either the national level or have concentrated on domestic regional cases [19]; to date, few studies have analyzed regional differences in domestic forest change in a meticulous manner [20,21]. Clear differences also exist in the results of studies that have addressed the ‘forest transition’ in China; some work, for example, has claimed that this transition has taken place [4,8,9,15], while other studies argue that insufficient data exist to prove a firm correlation [14,16]. While the State Forest Administration has accumulated eight sets of forest inventory data that are widely used in the study of forest resources change in China [10,16], these are provincial and lack spatial resolution, so these data are of limited application. In addition, during the fifth national forest resources inventory in 1994, the forest canopy closure standard was amended to be greater than or equal to 0.20 from greater than 0.30, while the shrubland coverage standard was changed to be greater than or equal to 30% from greater than 40%. Obviously, this also led to a lack of uniformity in the data. In addition, because the accuracy of the survey data has also been questioned by remote sensing studies [21,22], high resolution remote sensing land use data are used in this paper to determine changes in the spatial heterogeneity of forest area in the early 21st century in China. Furthermore, to determine whether forest transition has occurred in China, we developed regression models to discover the trend in forest change and its relationship with driving forces. Thus, this research both augments the ‘forest transition’ theory and has scientific implications to guide the implementation of the 13th Five Year Plan, which proposes to adjust and optimize national spatial structures, to designate red protection lines between agricultural and ecological spaces, and to build scientifically reasonable constructions of ecological civilization.

2. Data and Methods

2.1. Data Collection

2.1.1. Land Cover Data

The 30-m resolution GlobalLand30 dataset for the years 2000 and 2010 was used as our underlying data source for the analysis of forest area changes. The dataset for 2000 that we use was obtained from the Institute of Remote Sensing and Digital Earth, Chinese Academy of Sciences; the dataset for 2000 can be downloaded from this website: http://www.globallandcover.com/. This dataset was constructed between 2010 and 2013, predominantly on the basis of 30-m resolution multispectral images, including Landsat-TM5, ETM+, and HJ-1, by 18 organizations and was spearheaded by the National Geomatics Center of China. The projection system is a WGS84 coordinate system that uses a WGS84 reference ellipsoid with 6° zoning UTM projection. Thus, it has the highest global resolution of any international land cover data at present, the classification accuracy of these data is 83.51% [22]. The dataset was donated to the United Nations by the Chinese Government in 2014. The definition of forest in this dataset is ‘land covered with trees, with a vegetation cover greater than 30%, including deciduous and coniferous forests, and sparse woodland with cover 10%–30%, etc.

2.1.2. Forestry Division Data

China is divided into eight forested regions based on the standards of the forestry division office of the Forestry Department (Figure 1). Thus, these eight forestry divisions are the northeast timber sheltered-forest region (under the control of the Northeast Forestry Division), the Inner Mongolia-Xinjiang sheltered-forest region (Inner Mongolia-Xinjiang Forestry Division), the Loess plateau sheltered-forest region (Loess Plateau Forestry Division), the north China timber sheltered-forest region (North China Forestry Division), the Tibetan Plateau cold desert unsuitable forestland region (Tibet Plateau Forestry Division), the southwest canyon timber sheltered-forest region (Southwest Forestry Division), the southern timber economic forest region (Southern Forestry Division), and the south China tropical forest protected region (South China Forestry Division) [23].

2.1.3. Environment Data

A range of environmental data was used in our research, including precipitation, accumulated temperature (≥0 °C), elevation, and gradient.
For elevation, 90-m resolution SRTM digital elevation model (DEM) data was employed; from this, gradient data was generated using ArcGIS10.0. These SRTM DEM data can be downloaded from: http://srtm.csi.cgiar.org/SELECTION/inputCoord.asp.
Based on meteorological data captured by 1915 weather stations, 500-m resolution data for the average annual precipitation and accumulated temperature (≥0 °C) were calculated using an inverse distance weighted method. Of these data, the accumulated temperatures (≥0 °C) were revised by DEM according to the empirical criterion that temperature decreases 0.6 °C as altitude increases by 100 m. Climate data can be downloaded from the Resources and Environmental Science Data Center, Chinese Academy of Sciences: http://www.resdc.cn.

2.1.4. Socioeconomic Data

County-level socioeconomic data includes the following: Per capita gross domestic product (GDP) in 2010, population in 2010, rural population in 2010, and forestry investment during 2000–2005. Data on forestry investment can be found in the ‘Chinese forestry statistical yearbook’ (http://tongji.cnki.net/kns55/Navi/HomePage.aspx?id=N2013110040&name=YCSRT&floor=1). Per capita GDP data can be found in ‘China’s regional economic statistical yearbook-2011’ (http://tongji.cnki.net/kns55/Navi/Yearbook.aspx?id=N2012030056&floor=1), while population and rural population data come from the Sixth National Population Census (http://www.stats.gov.cn/tjsj/pcsj/rkpc/6rp/indexch.htm).

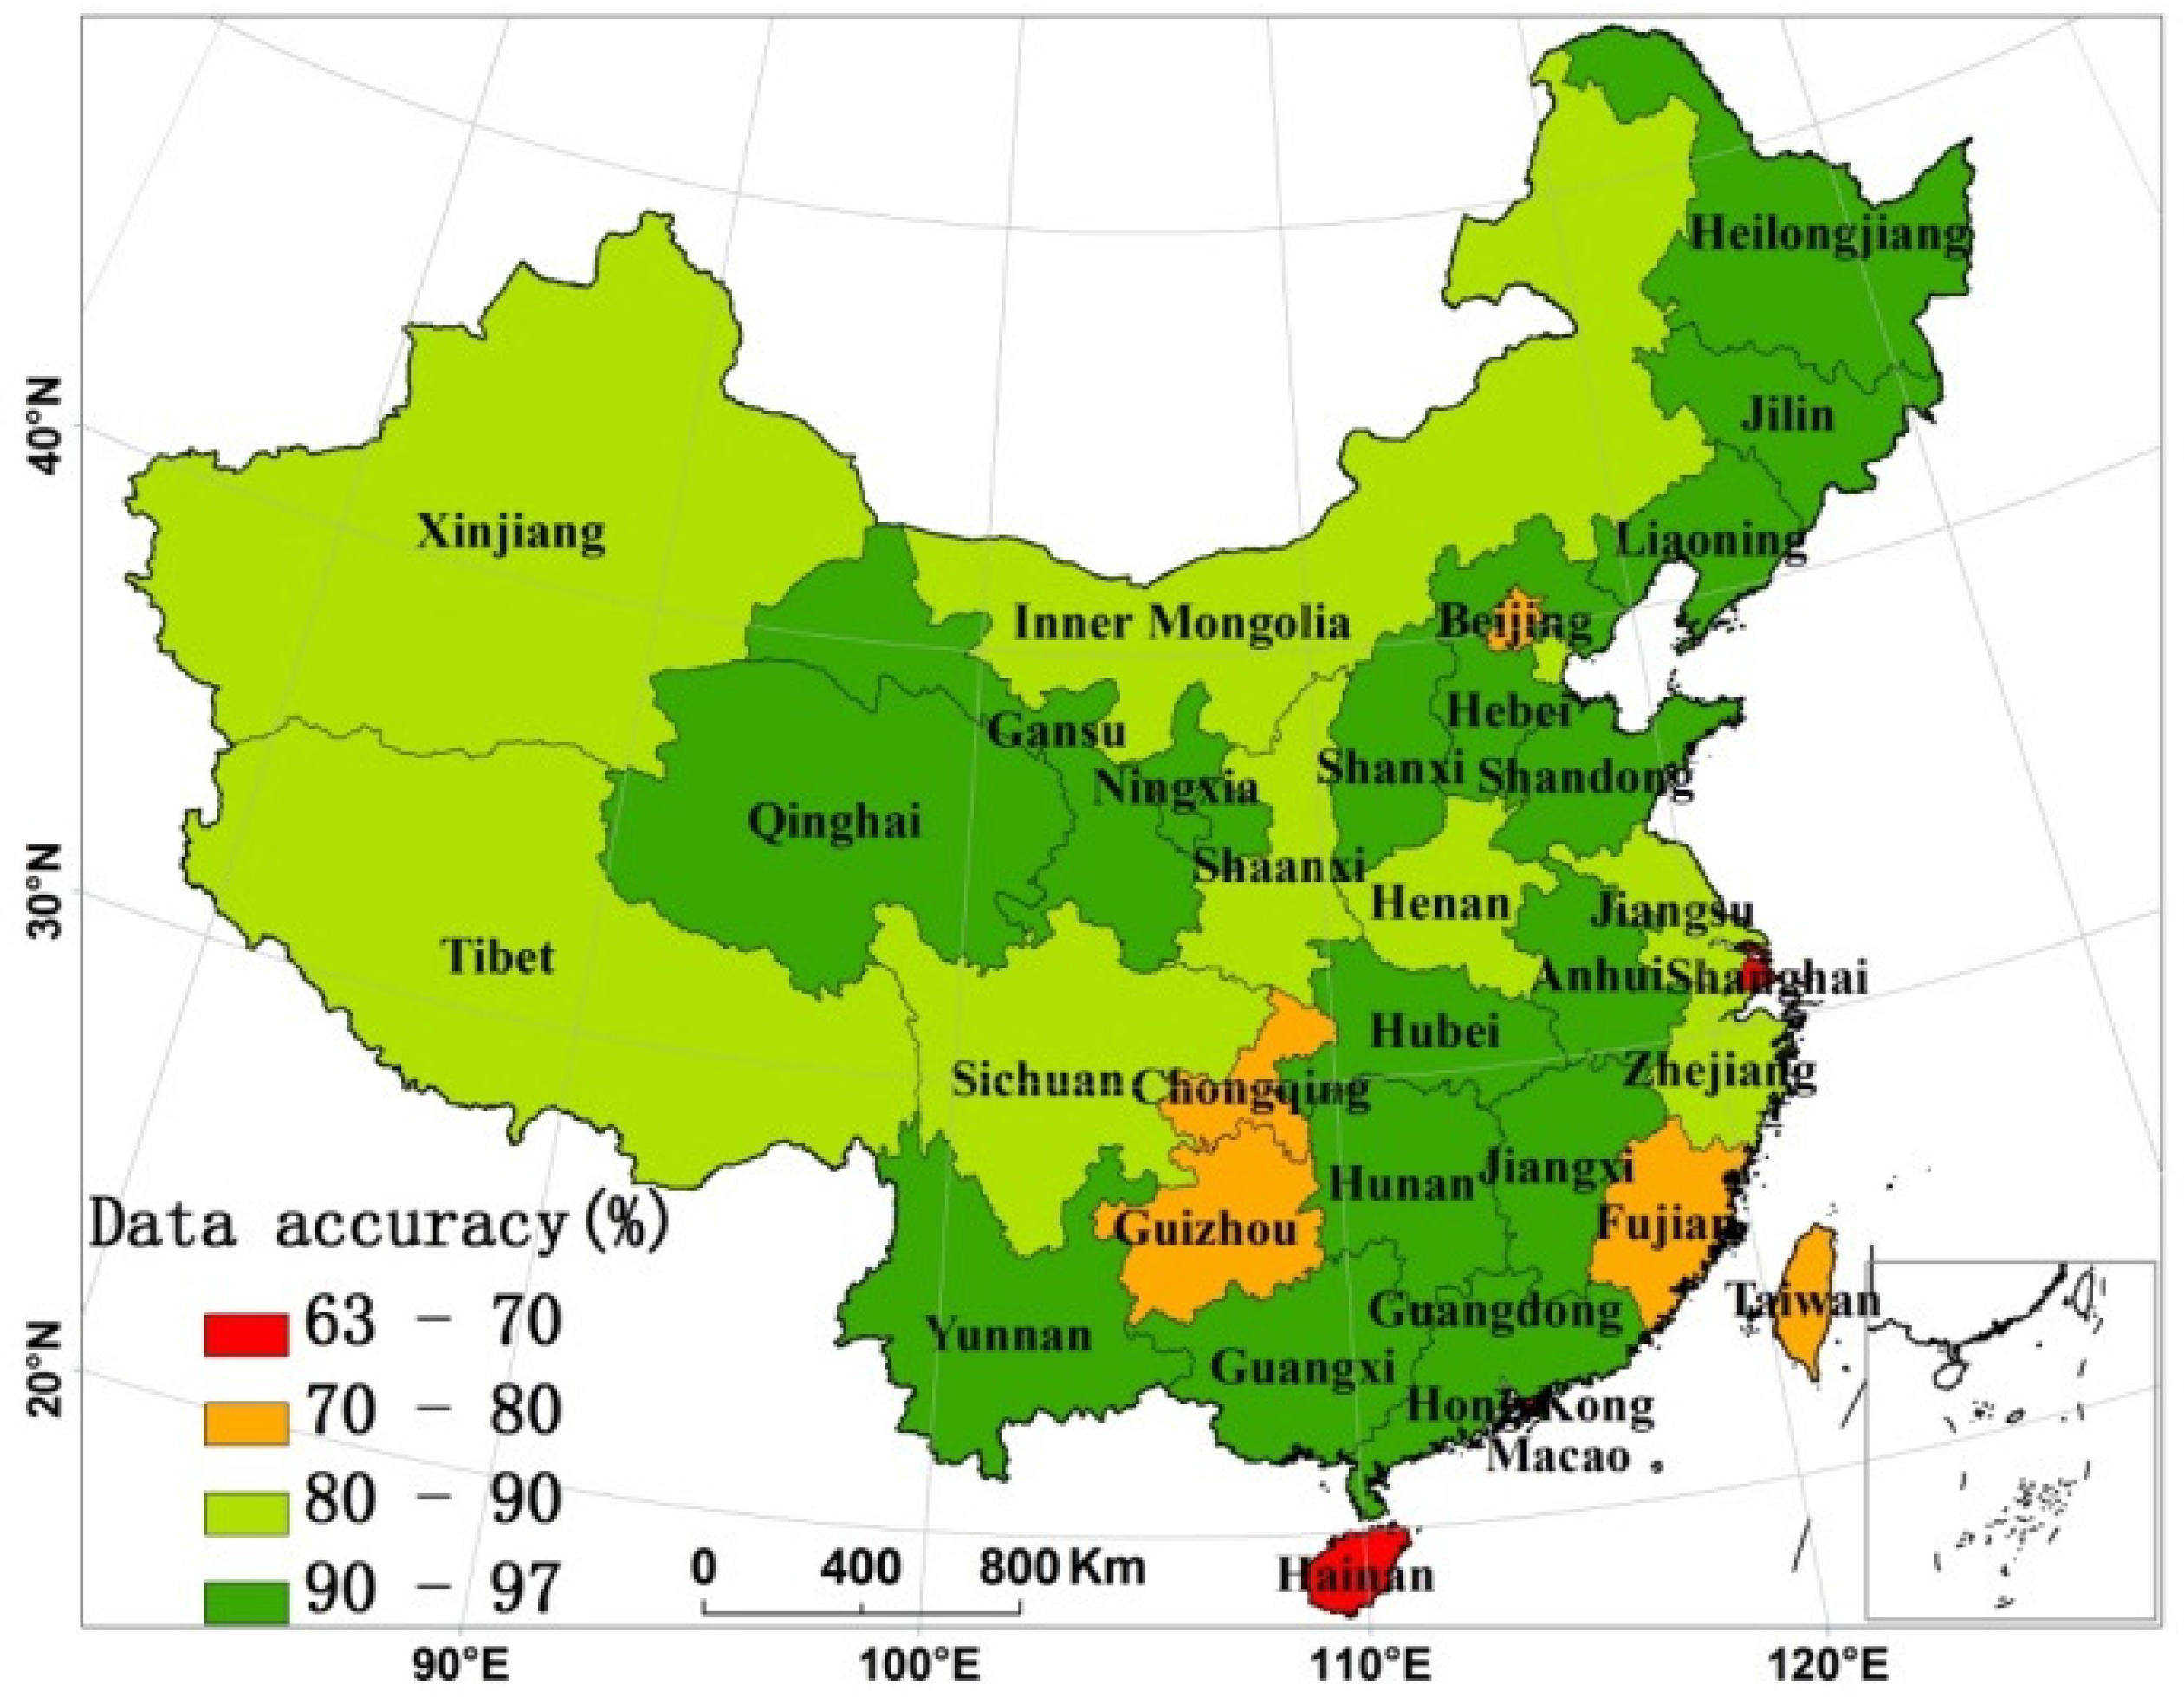
2.2. Accuracy Assessment

As for the dataset for 2000, we conducted accuracy verification with the aid of high resolution Google Earth images, which are a combination of satellite images and aerial data. For this verification, 1798 random forest sample points were selected across China. The results showed that the interpretation accuracy of forested land in China is 86.21%. From the perspective of the province (Figure 1), the interpretation accuracy of Gansu, Qinghai, and Shanxi are the highest, reaching 96.43%, 95.00%, and 93.85%, respectively. The interpretation accuracy of Shanghai, Hainan, and Chongqing are the lowest at 63.16%, 63.93%, and 74.14%, respectively. The main reason for the lower accuracy is farmland and bare land that is wrongly classified into being labelled as forested land.
Because the 2010-year dataset is open access on the internet, the accuracy verification file can also be found on their website (http://www.globallandcover.com/). Tongji University, Chinese Academy of Sciences, Chinese Academy of Agricultural Sciences, and Chinese Academy of Forestry were authorized to verify the data accuracy. They use a two stage sampling method for spatial data to verify the data accuracy, and 84 maps and 154,070 sample points were selected, involving 9 land use types. The results showed that the interpretation accuracy of the 2010 dataset is 83.51% and that the Kappa coefficient is 0.78, which indicates a high classification accuracy. Forest classification accuracy can reach 88.99%, and the error rate is less than 10%, which is significantly better than other global land cover products [22]. This dataset met the requirement for use in an analysis of the change of forest area across China. As such, we can obtain the forest change data using these 2000 and 2010 GlobalLand30 datasets.

2.3. Spatial Clustering Distribution Analysis

A cold/hot-spot analysis, a method for exploring the distribution of local-scope spatial clustering, was used to determine the high (hot spot)/low (cold spot) value region of spatial agglomeration. A hot (cold) spot is a high (low) value cluster region with significant statistical significance. For instance, the hot spots of forest gain are the regions where the increase in forest area is much larger than expected and have significant statistical significance. That means that a region with numerous increases in forest area would be considered to be one of the hot spots. We used this method to reflect the spatial clustering distribution of forest area change here. The Getis-Ord G i * index is often used to describe cold/hot spots, and if this index was a positive number with a significant statistical significance, the higher the value is the more concentrated the distribution of high value (hot spot) clustering is. The Getis-Ord G i * index was calculated in ArcGIS10.0, and it is defined as
G i * ( d ) 2 = j = 1 n W i j ( d ) X j / j = 1 n X j
where Wij represents the spatial weight matrix (a value of 1 refers to spatially adjacent areas, and in other cases this value is 0), and Xj is the spatial value of forest area changes. Thus, if G i * is a positive number with a significant statistical significance, this indicates that values around i are also relatively high, and the region is a hot spot. In contrast, if G i * is a negative number with a significant statistical significance, then the region is a cold spot.
To obtain the county level cold/hot spot distribution across China, we analyzed the GlobalLand30 data at the county level. The cold/hot spot distribution was divided into six levels according to the confidence coefficient ( G i * score; in other words, an extremely cold/hot spot scored 99%, a cold/hot spot scored 95%, and a second-level cold/hot spot scored 90%.

2.4. Driving Model of Forest Change

There are six influential factors driving forest area changes: The economic level [7], the population and urbanization [24], the property system [25], the trade in forestry products [26], the forestry policy and investment in forest planting [16], as well as the natural environment [27]. To judge the occurrence of forest transition based on the analysis of the forest change driving model, we built the driving model with the aid of forest transition theory. The theoretical basis we use is centered upon considering the forest transition mechanisms. From Figure 2, we can see that according to the forest transition theory, the forest area experienced a downtrend and an uptrend with socioeconomic development. There are two typical microscopic occurrence mechanisms of the forest transitions, the economic development and the scarcity of forest [28]. It is easy to understand that in the initial stage of social development the forest area experienced a downtrend due to a large area of deforestation. As for the uptrend, one mechanism is called economic development; the economic development increases the opportunity of non-farm employment, leading to the transfer of rural labor to non-agricultural employment. Inferior farmland was abandoned, deforestation was reduced, and forest restoration was accelerated at the same time. The other mechanism is called scarcity of forest: Urban development increases the demand for forests, and the forest price increases, promoting the cultivation of artificial forests. Meanwhile, the reduction in forest area causes a decrease of ecological service capacity, and then the government initiates forest protection policies to increase the forest area.
According to the forest transition theory and its two typical microscopic occurrence mechanisms, we set the forest area in 2010 as the explanatory variable. In an economic respect, we import per capita gross domestic product (GDP) and its quadratic term as basic explanatory variables. Regarding population and urbanization, we chose the population variation, rural population variation, and urbanization rates as explanatory variables. Similarly, for forestry policy and investment in forest planting, we selected forestry investment, and considering the lag effect, we used the sum of forestry investment during 2000–2005 as policy factors. We selected elevation, gradient, precipitation, and accumulated temperature (≥0 °C) as natural environment factors, and these natural factors were introduced as control variables. Indeed, because of the availability of data, we conducted this research at the county level, and distilled the property system and forestry products trade factors into error terms because of the difficulty in spatially expressing these data across the whole of China. Thus, taking the continuity of forest area changes into consideration, we imported a lagged variable, forest area in 2000, for the explanatory variable. The model was defined as
f o r e s t 2010 = β 0 + β 1 f o r e s t 2000 + β 2 g d p + β 3 g d p 2 + β 4 i n v e s t _ f o r e s t + β 5 u r b a n r a t e + β 6 c h a n _ t p o p + β 7 c h a n _ t r p o p + β 8 N F i + ε
where forest2010 is the explained variable that represents the quantity of county-level forest area changes, and forest2000 is the lagged variable of the explained variable. NF i is a natural factor that contains elevation, gradient, precipitation, and accumulated temperature (≥0 °C). The detailed interpretation of other factors is presented in Table 1. The collinearity problem was tested, and there is no multi-collinearity between the variables.

3. Analyses and Results

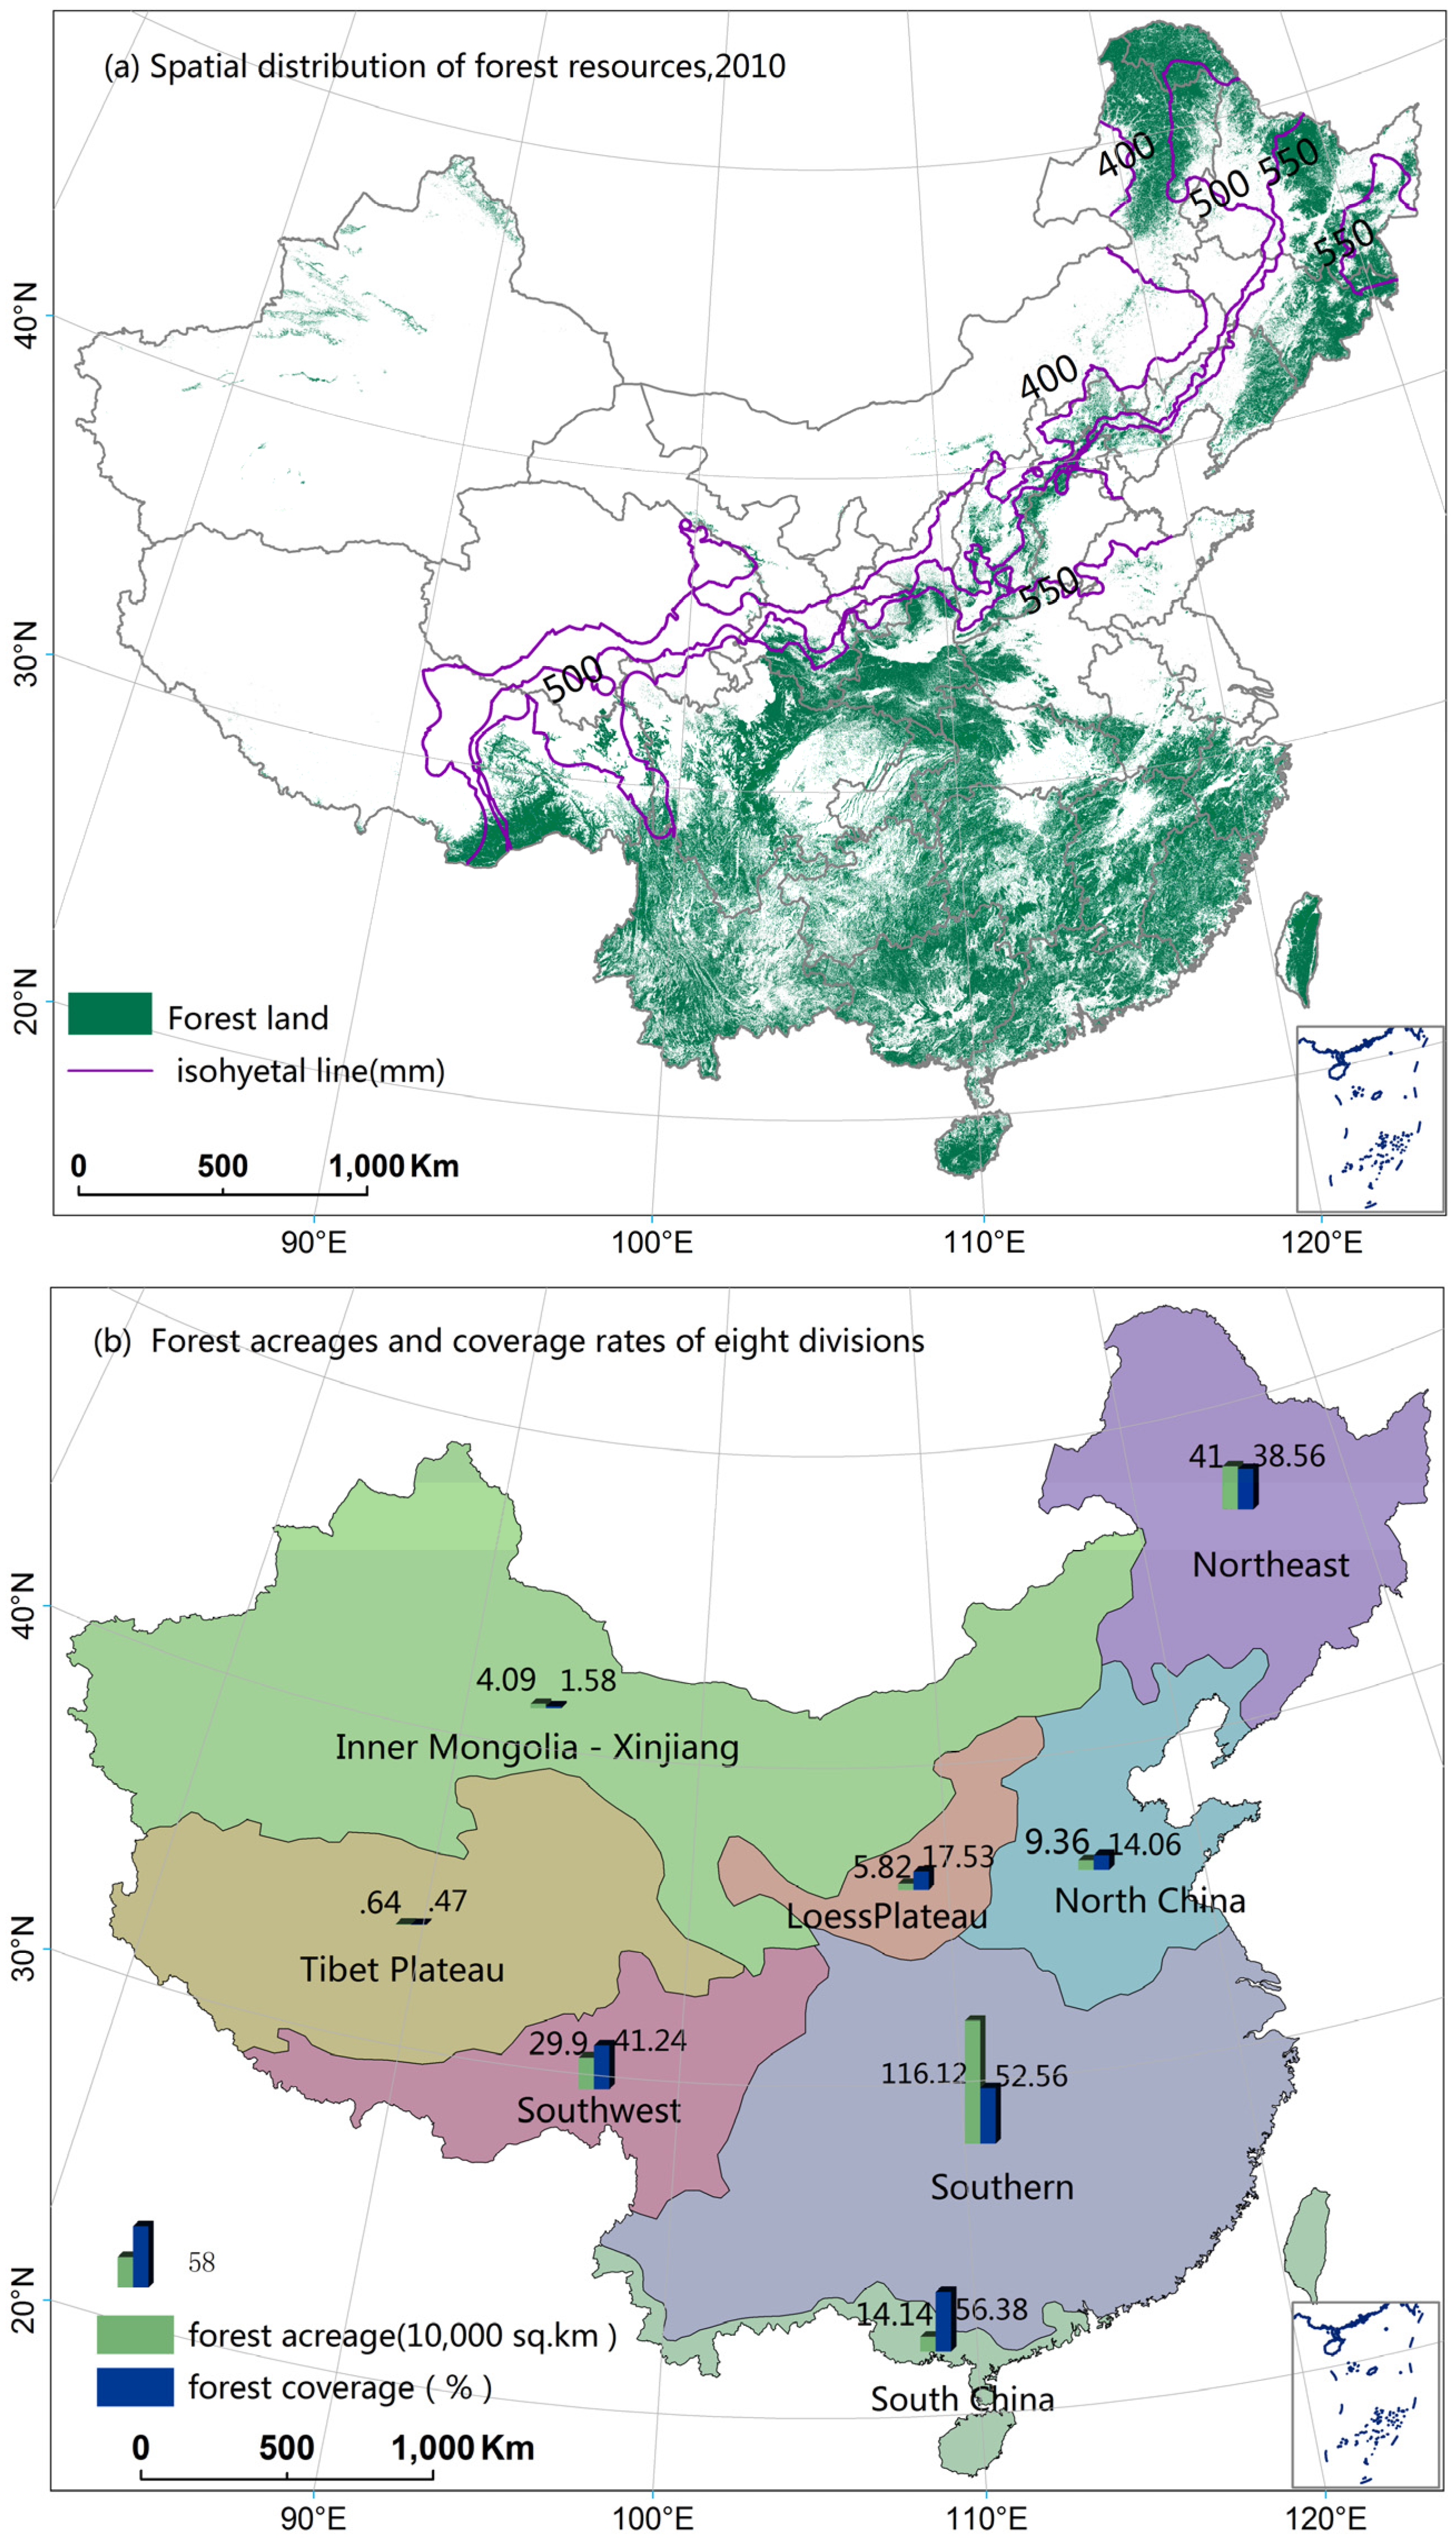
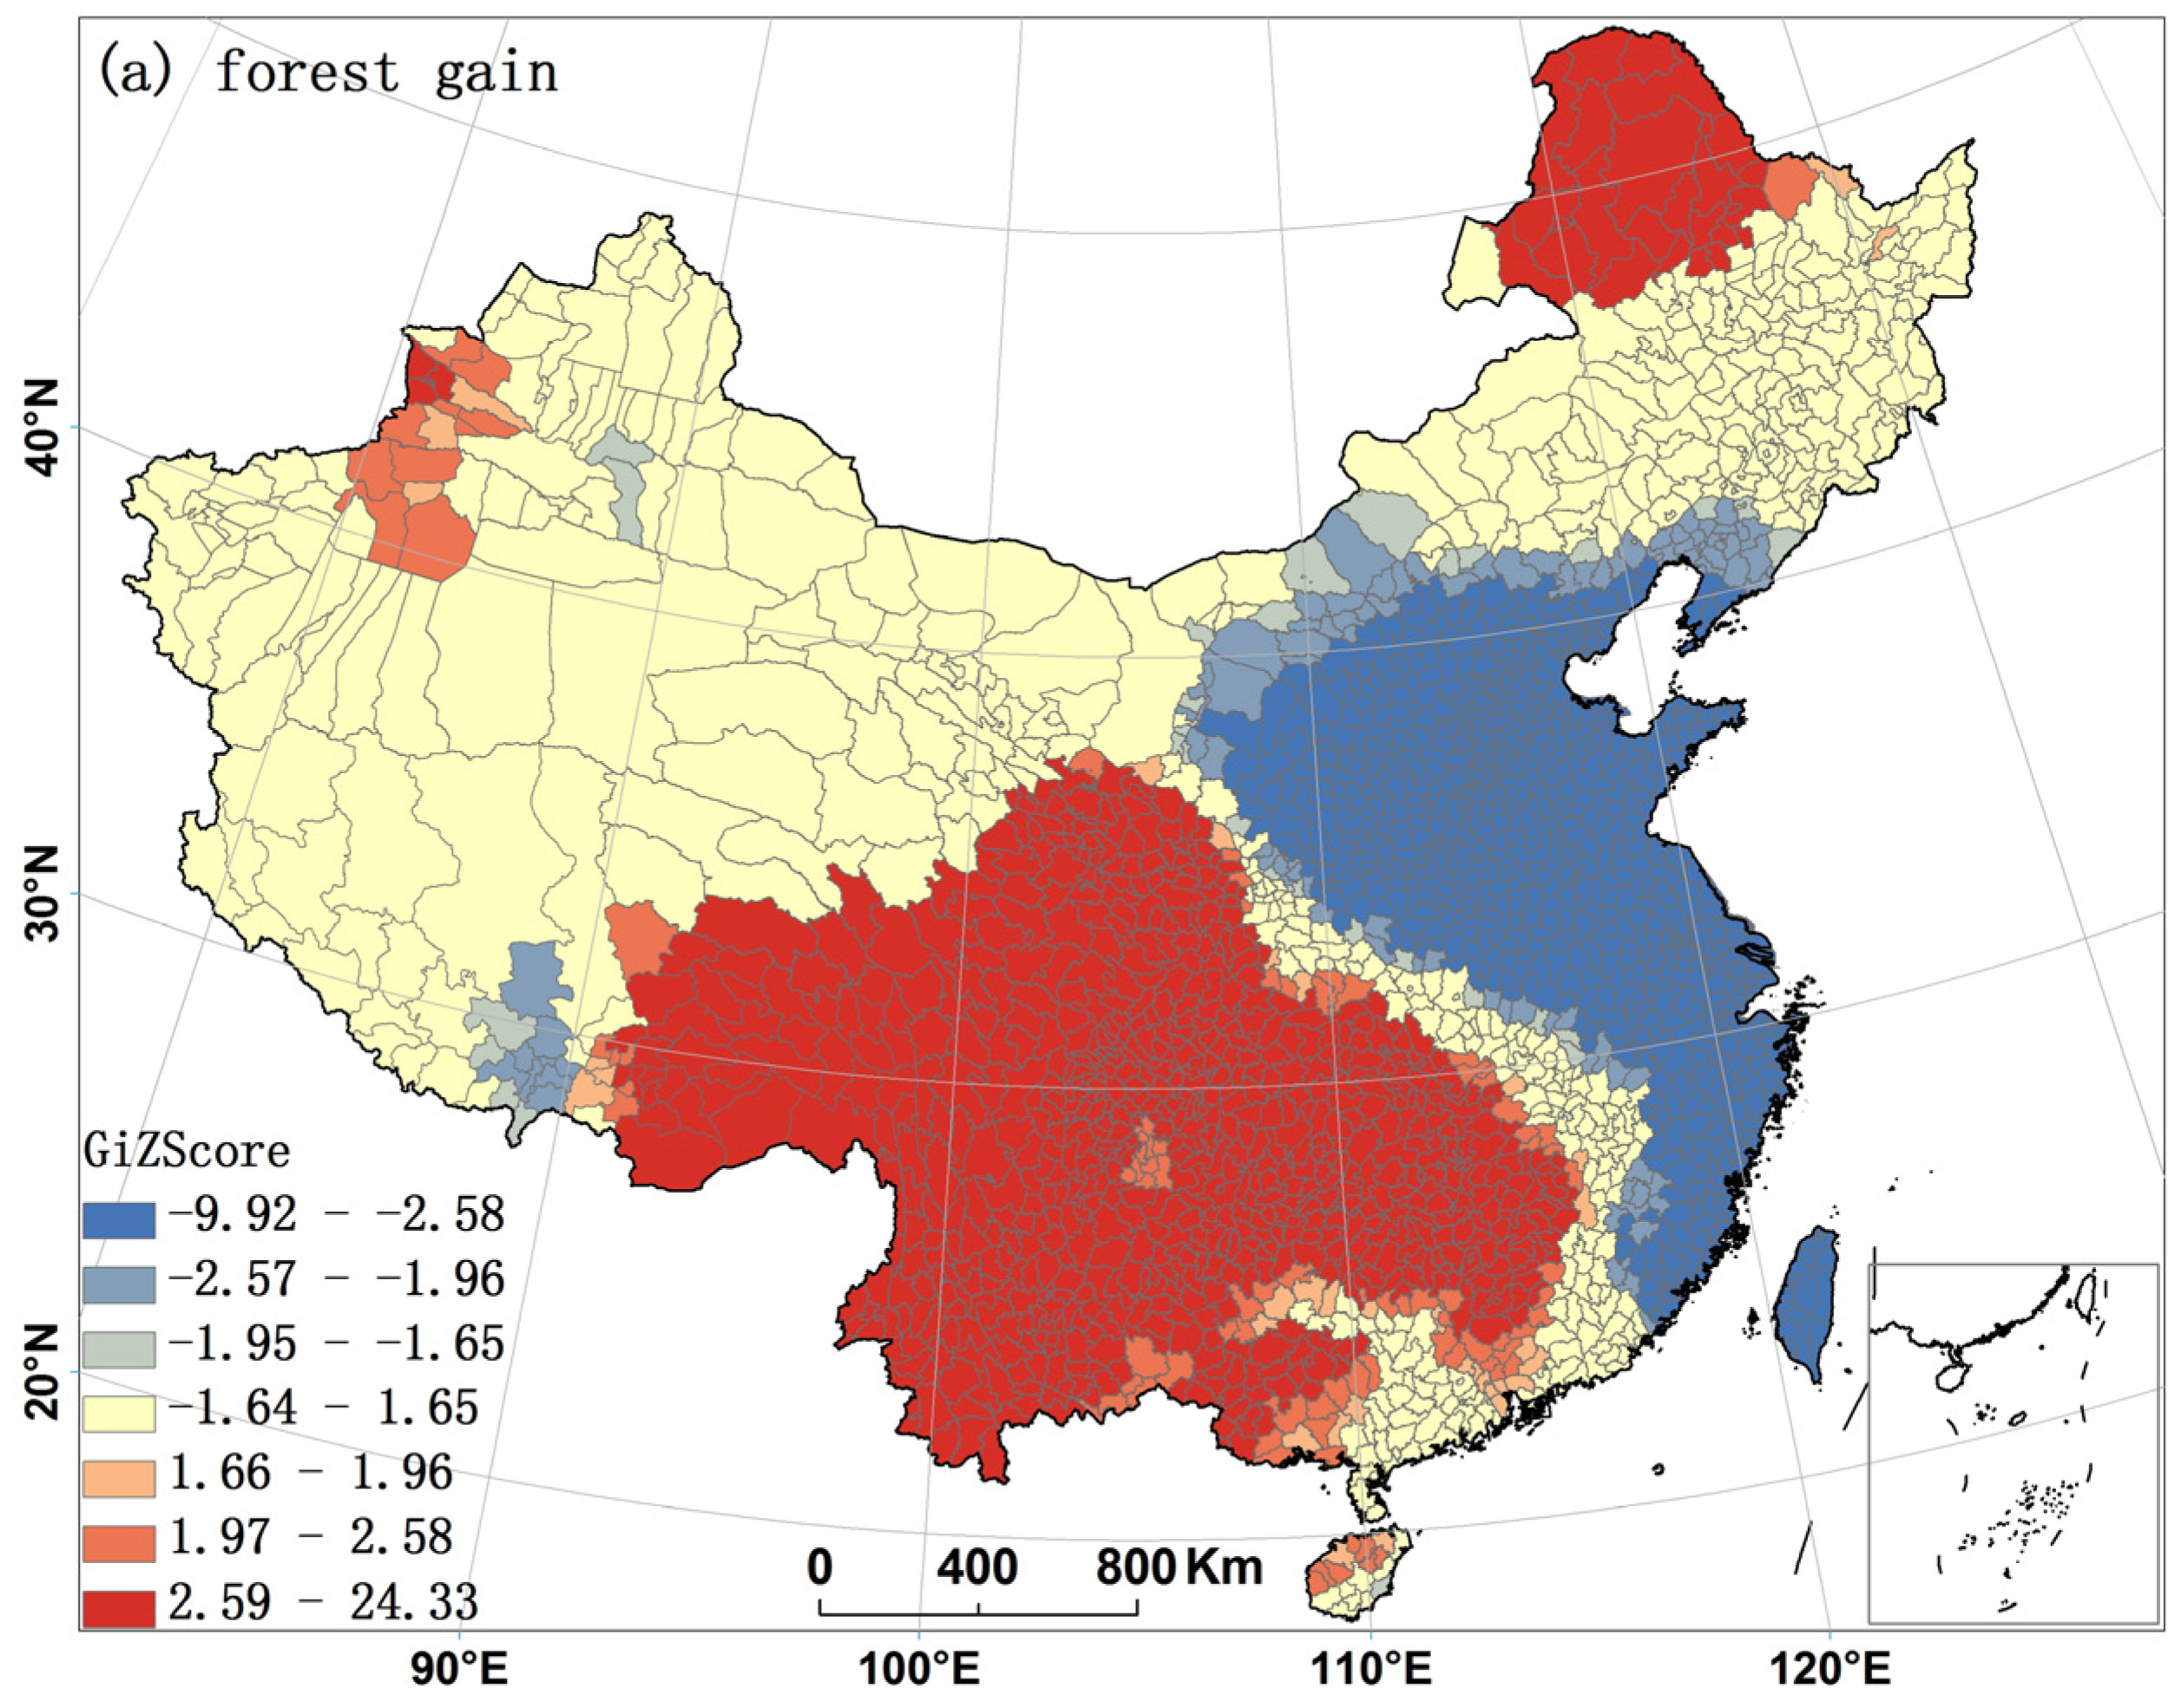
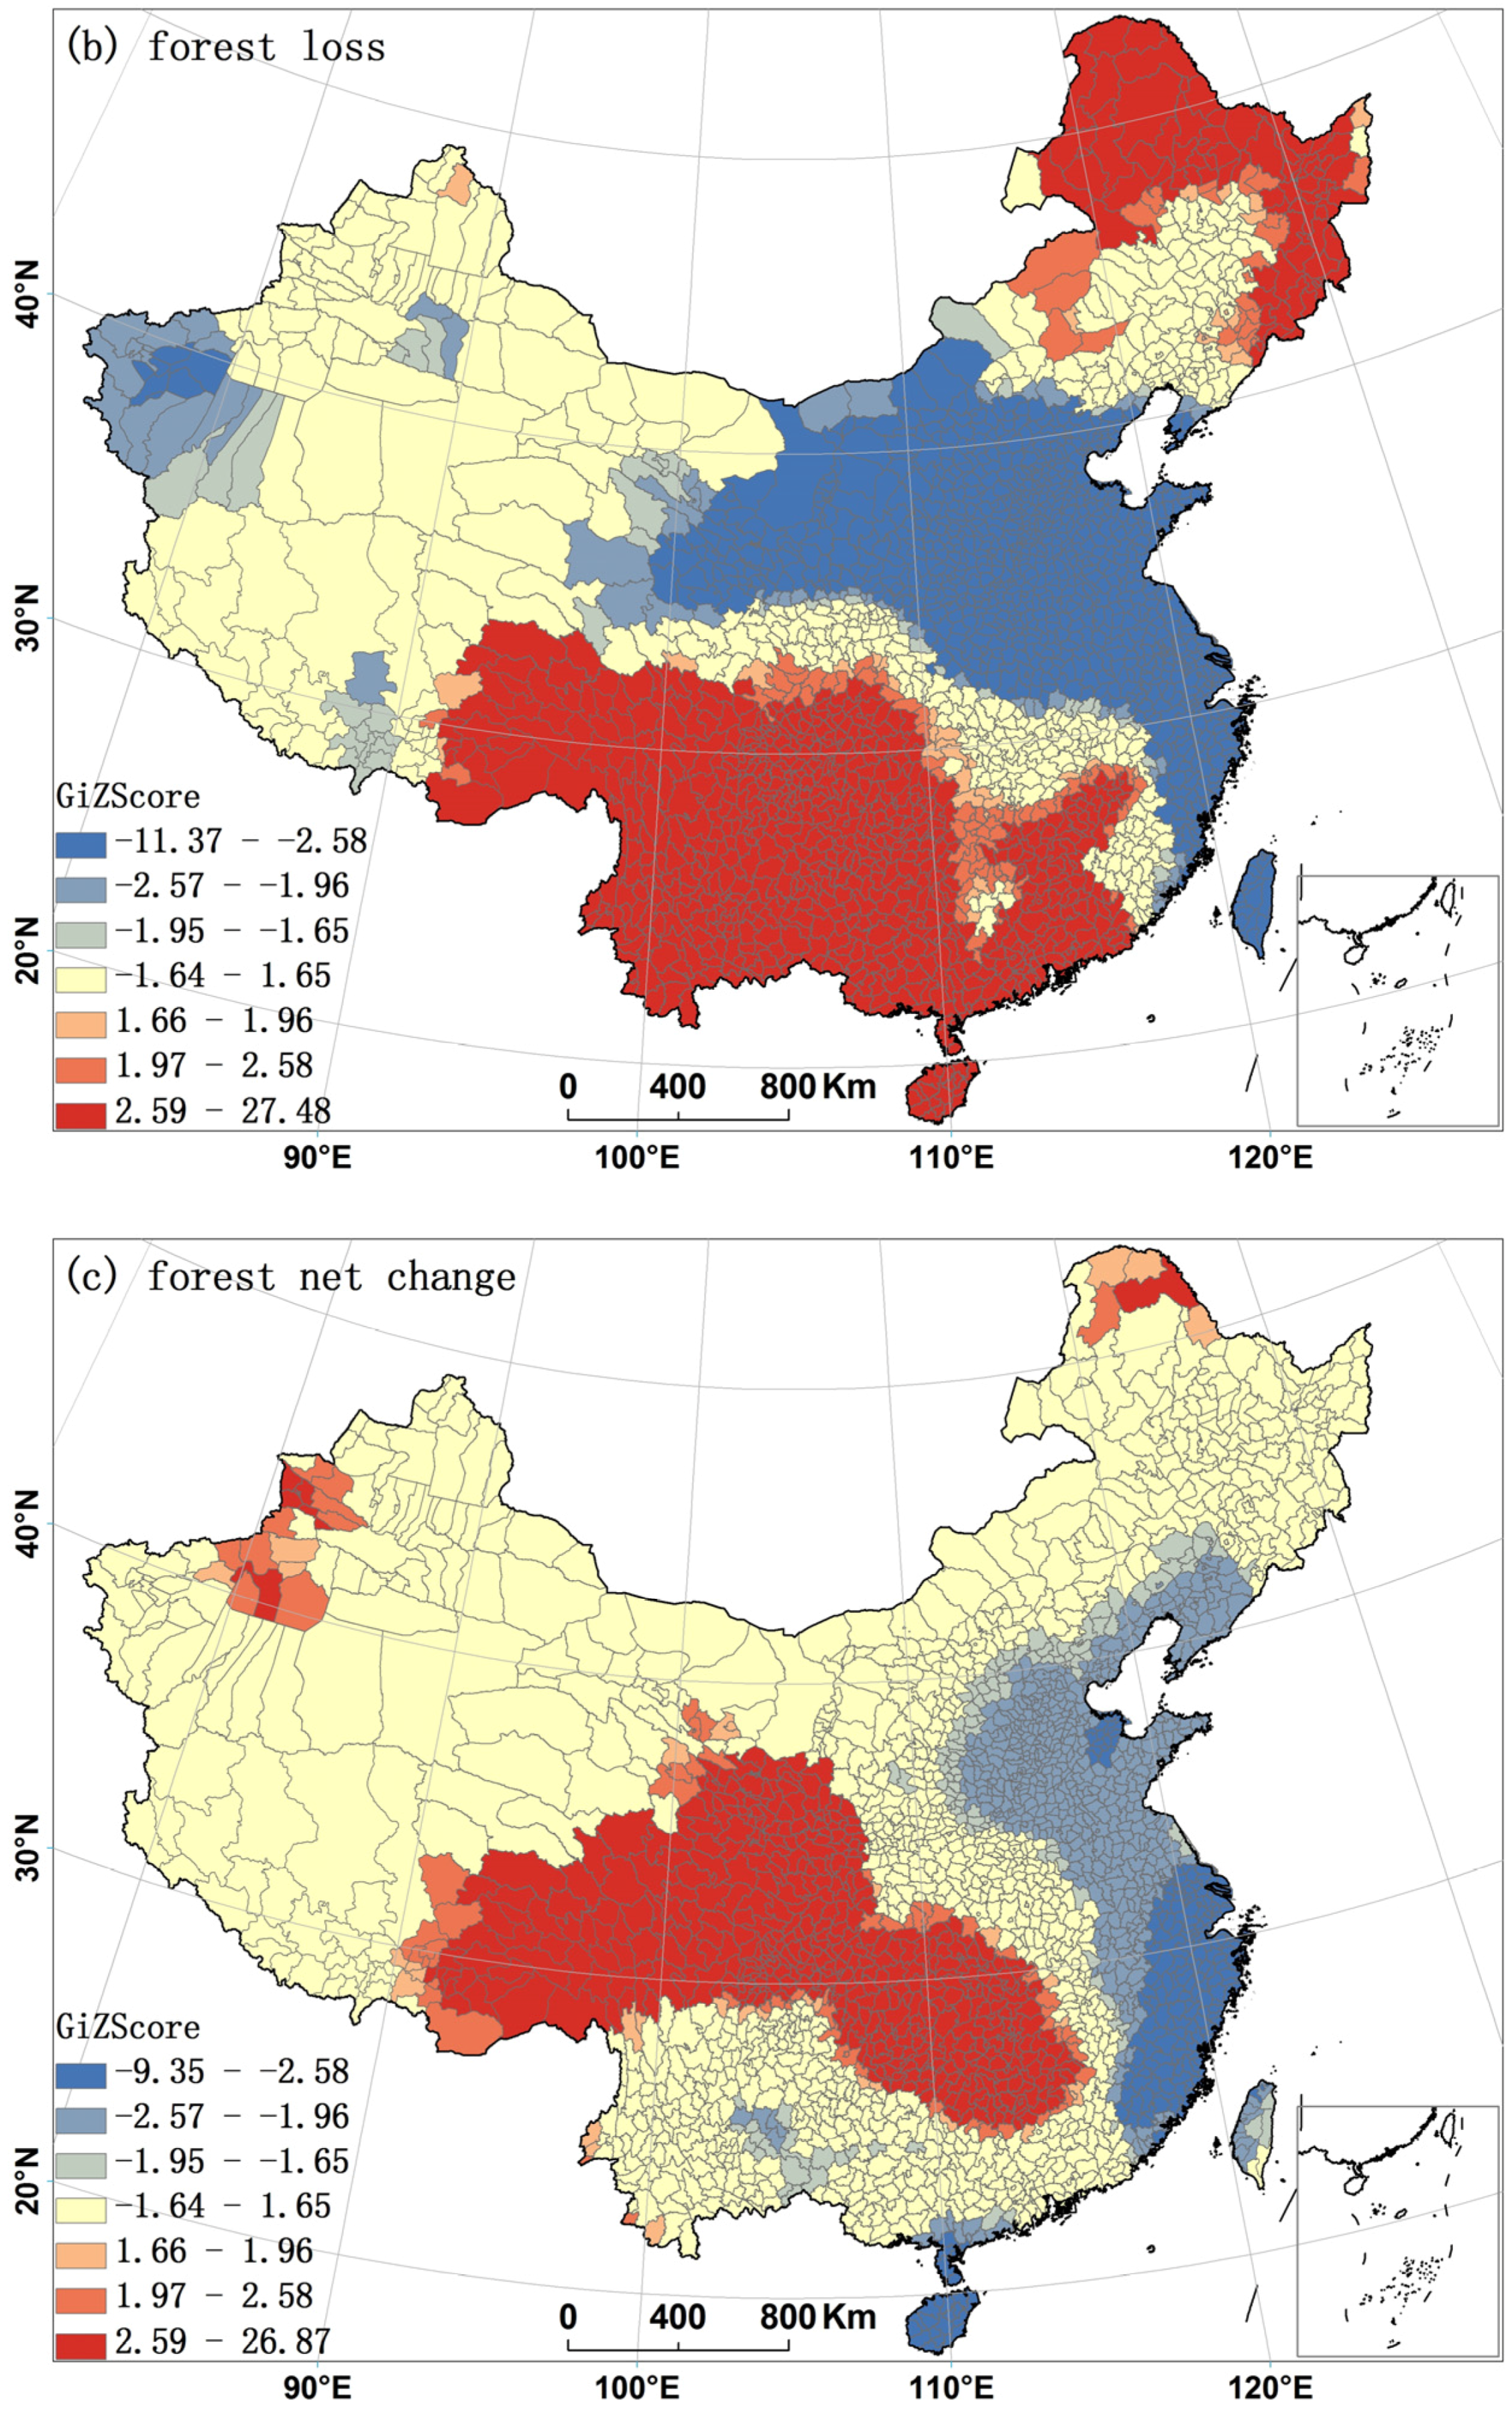
3.1. Geographical Distribution and Characteristics of Forest Variation in China

According to global land cover data (GlobalLand30), the total forest area in 2010 in China was 2,120,100 km2, while the forest coverage rate was 22.01%. This is a similar result to that reported by the eighth forest inventory (2009–2013): A value of 2,076,900 km2. Indeed, in terms of spatial distribution, China’s forestry resources are approximately divided by a boundary line comprised by the Greater Hinggan, Lvliang, and Hengduan mountains. Forests are mostly distributed to the southeast of this boundary (Figure 3a). In terms of forest area (Figure 3b), the largest concentration is found under the jurisdiction of the Southern Forestry Division (1,161,200 km2), followed by the Northeast Forestry Division (410,000 km2), the Southwest Forestry Division (299,000 km2), and the South China Forestry Division (141,400 km2). The forest area in these four forestry divisions occupied 91% of the total forest area in China, while in the mid-latitude regions, the North China Forestry Division, the Loess Plateau Forestry Division, the Inner Mongolia-Xinjiang Forestry Division, and the Tibetan Plateau Forestry Division are responsible for only 9% of the total forest area. Regarding the rate of forest coverage, the division responsible for the highest rate is the South China Forestry Division (56.38%), followed by the Southern Forestry Division (52.56%), the Southwest Forestry Division (41.24%), and the Northeast Forestry Division (38.56%). In the mid-latitude regions, the North China Forestry Division and the Loess Plateau Forestry Division are responsible for forest coverage rates of 14.06% and 17.53%, respectively, while the Inner Mongolia-Xinjiang Forestry Division and the Tibet Plateau Forestry Division are responsible for the lowest rates of all, just 1.58% and 0.47%, respectively. In conclusion, it is clear that the overall forest resources in China are unevenly distributed and there is a clear trend in reduction from the southeast to the northwest.
Between 2000 and 2010, the forest area in China grew from 2,017,600 to 2,120,100 km2, a net increase of 102,500 km2, while the total forest area increased by 5.08%. In tandem, the forest coverage rate increased from 20.94% to 22.01%, an increase of 1.06%. Thus, when compared with other countries around the world, from an overall perspective, the forest resources in China have grown rapidly: between 2000 and 2010, forest area increased by 275,000 km2, which accounted for 13.63% of the forest area in 2000. In contrast, the reduction in forest area was 179,300 km2, which accounted for 8.89% of the forest area in 2000, and there were 1,838,300 km2 of forest area that did not change, which accounted for 91.11% of the forest area in 2000.
At the forest district level (Table 2), the regional differences of China’s forest resources change are obvious. The net increases in the regions that fall under the jurisdiction of the Southern and Southwest Forestry Divisions are bigger than all others at 42,836.41 and 42,158.08 km2, respectively. These changes alone account for 81.92% of the national net increase in forest area. The South China Forestry Division is the only one who has experienced a decrease in forest area in these forest districts, a net loss of 6062.96 km2 from 2000 to 2010. These data reveal an important trend: The increases and decreases in Chinese forest resources are occurring in the same regions. From the point of view of considering the change rate of forest cover, the Tibetan Plateau Forestry Division and the Inner Mongolia-Xinjiang Forestry Division had the most obvious growth of forest, with rates of 108.21% and 58.52%, respectively.
Regarding the provincial administrative regions (Table 3), the largest increases in forest area were observed in Sichuan, Gansu, and Hunan provinces, as well as in the Tibetan autonomous region, where the net increases in forest area were all more than 14,000 km2. Hainan province, in contrast, experienced the highest loss of forest area at 6398.02 km2 between 2000 and 2010, while the forest areas in Zhejiang, Liaoning, Jilin, Anhui, and other provinces also decreased slightly. In terms of the rate of change of forest area, which is variation divided by forest area in 2000, the growth rate in Shanghai was most striking, with an increase of 287.56% between 2000 and 2010. Rapid rates were also observed in Gansu and Qinghai provinces, which have experienced growth rates of approximately 80%. In contrast, the forest growth rate in the Xinjiang autonomous region reached 20.75%, while the forest area of Hainan province declined by 20.31%.
Again, in relation to these data, it is important to note that the quantities of increases and decreases of forest in provincial administrative forest regions are synchronous; that is, the province that has a massive increase in forest area also tends to has a massive decrease in forest area coincidentally; the Pearson correlation coefficient of forest area increase and decrease at the provincial level is 0.795, which is significant at the 0.01 level. There is a clear linear positive correlation between the increase and decrease in forest area at the provincial level.
Considering the distribution of hot and cold spots in countywide areas of forest change, there is a strong spatial correlation in forest gain regions, forest loss regions, and forest net change regions. Moreover, there are obvious hot spots and cold spots of forest gain, forest loss, and forest net change. There’s a strong spatial consistency between forest gain regions and forest loss regions on the whole. The main areas of forest gain and loss are the southwestern mountainous region and the northern region of Greater Hinggan. In contrast, cold spots in county forest change include the North China Plain, the Loess plateau, and the eastern coastal area, where there has been little change in forest coverage. In terms of net changes, hot spots of forest net change are located in the mid-latitudes of China, from the west to the east, from eastern Tibet to western Jiangxi province. Cold spots of forest net change are located in the east coast regions of China, from Liaoning province to the southern Fujian and Hainan provinces, and are particularly concentrated in Hainan, Fujian, and Zhejiang provinces (Figure 4).

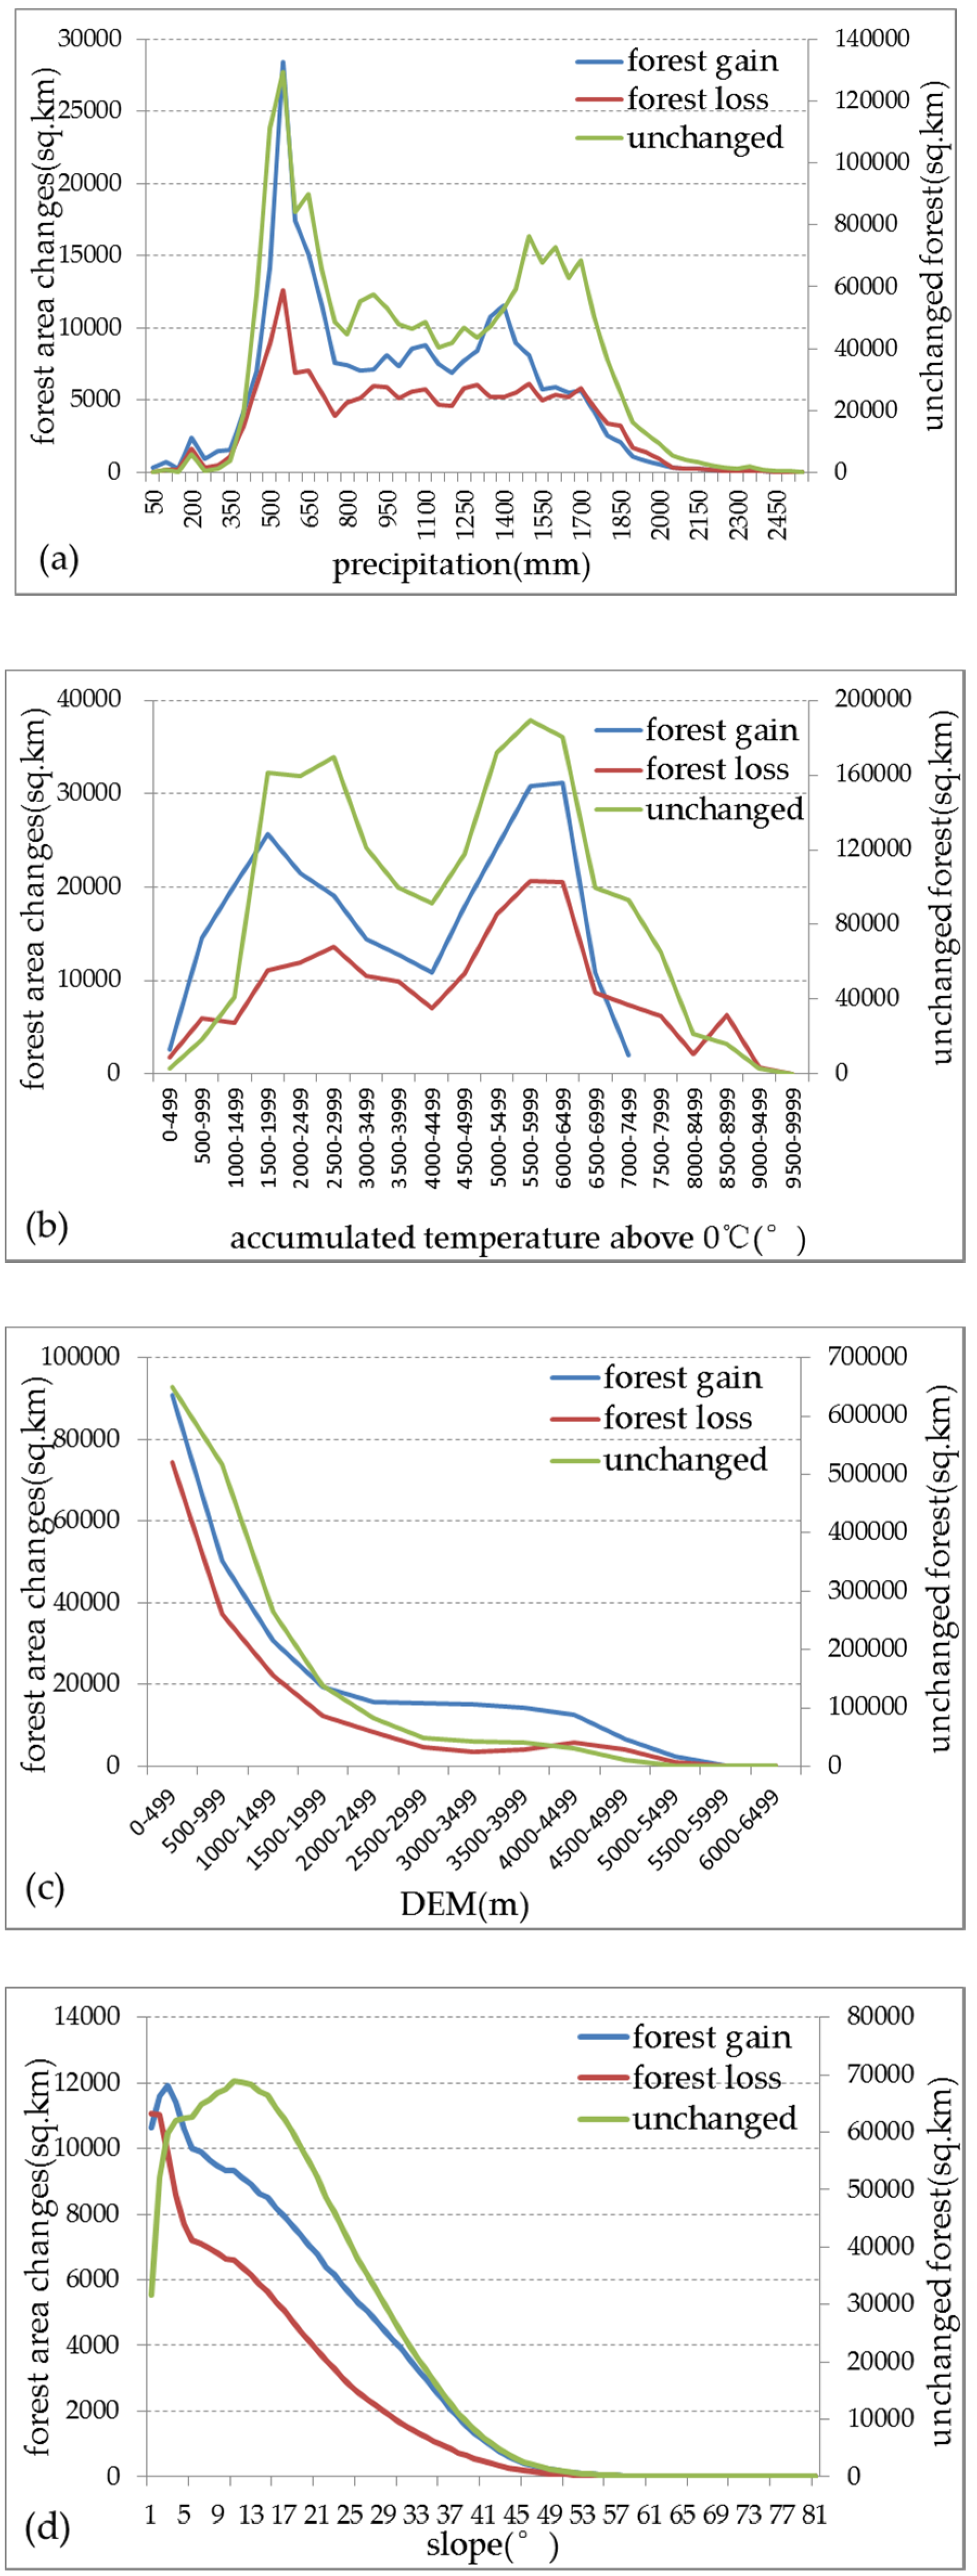
3.2. Relationships between Forest Area Changes and Natural Factors

Considering the distribution of forest resources in terms of different regional rainfall patterns (Figure 5a), it is clear that the resource distribution is irregular. Data show a bimodal curve that takes the form of two peaks at 550 mm and 1500–1700 mm, which are mainly caused by a combination of natural conditions and extensive human land use. The distribution of forest gain and loss regions coincide with the original forest distribution according to this partition in precipitation. Indeed, most forested regions are located in areas with 550 mm of precipitation; these are also the most concentrated regions where the forest is either increasing or decreasing. Spatially, precipitation of 550 mm also marks a boundary in forest distribution in the southwest mountains of China (Figure 3a). Similar to the distribution characteristics of forest resources in different rainfall areas, these resources also show an obvious bimodal curve in different accumulated temperature regions; the intervals between the two peaks are 1500–3000 °C and 5000–6500 °C. It is clear that the distribution of forest gain and loss regions are coincide with the original forest distribution according to this partition in accumulated temperature (Figure 5b).
In terms of forest resource distributions in different elevation zones (Figure 5c), it is clear that as the latter increases, the former decreases; there are less forest resources at higher elevations in China. Indeed, 70% of total Chinese forest resources occur at elevations lower than 2000 m. The distribution of forest gain and loss regions also coincide with the original forest distribution according to this partition in elevation zones. In addition, in terms of resource distribution in areas with different gradients (Figure 5d), the forest resources in China conform to an inverted U-shaped curve with respect to the gradient distribution. Data show that the apex of this inverted U-shaped curve occurs at 10°; in other words, the bulk of the forest resources in China are concentrated at a gradient of 10°. It is also clear that forest gain area, as well as the forest loss area, gradually decreases as the gradient increases; in other words, both forest gain and forest loss in China mostly occur on flat terrain. There are few areas of either original forest, or forest gain or forest loss in regions where the gradient exceeds 45°.

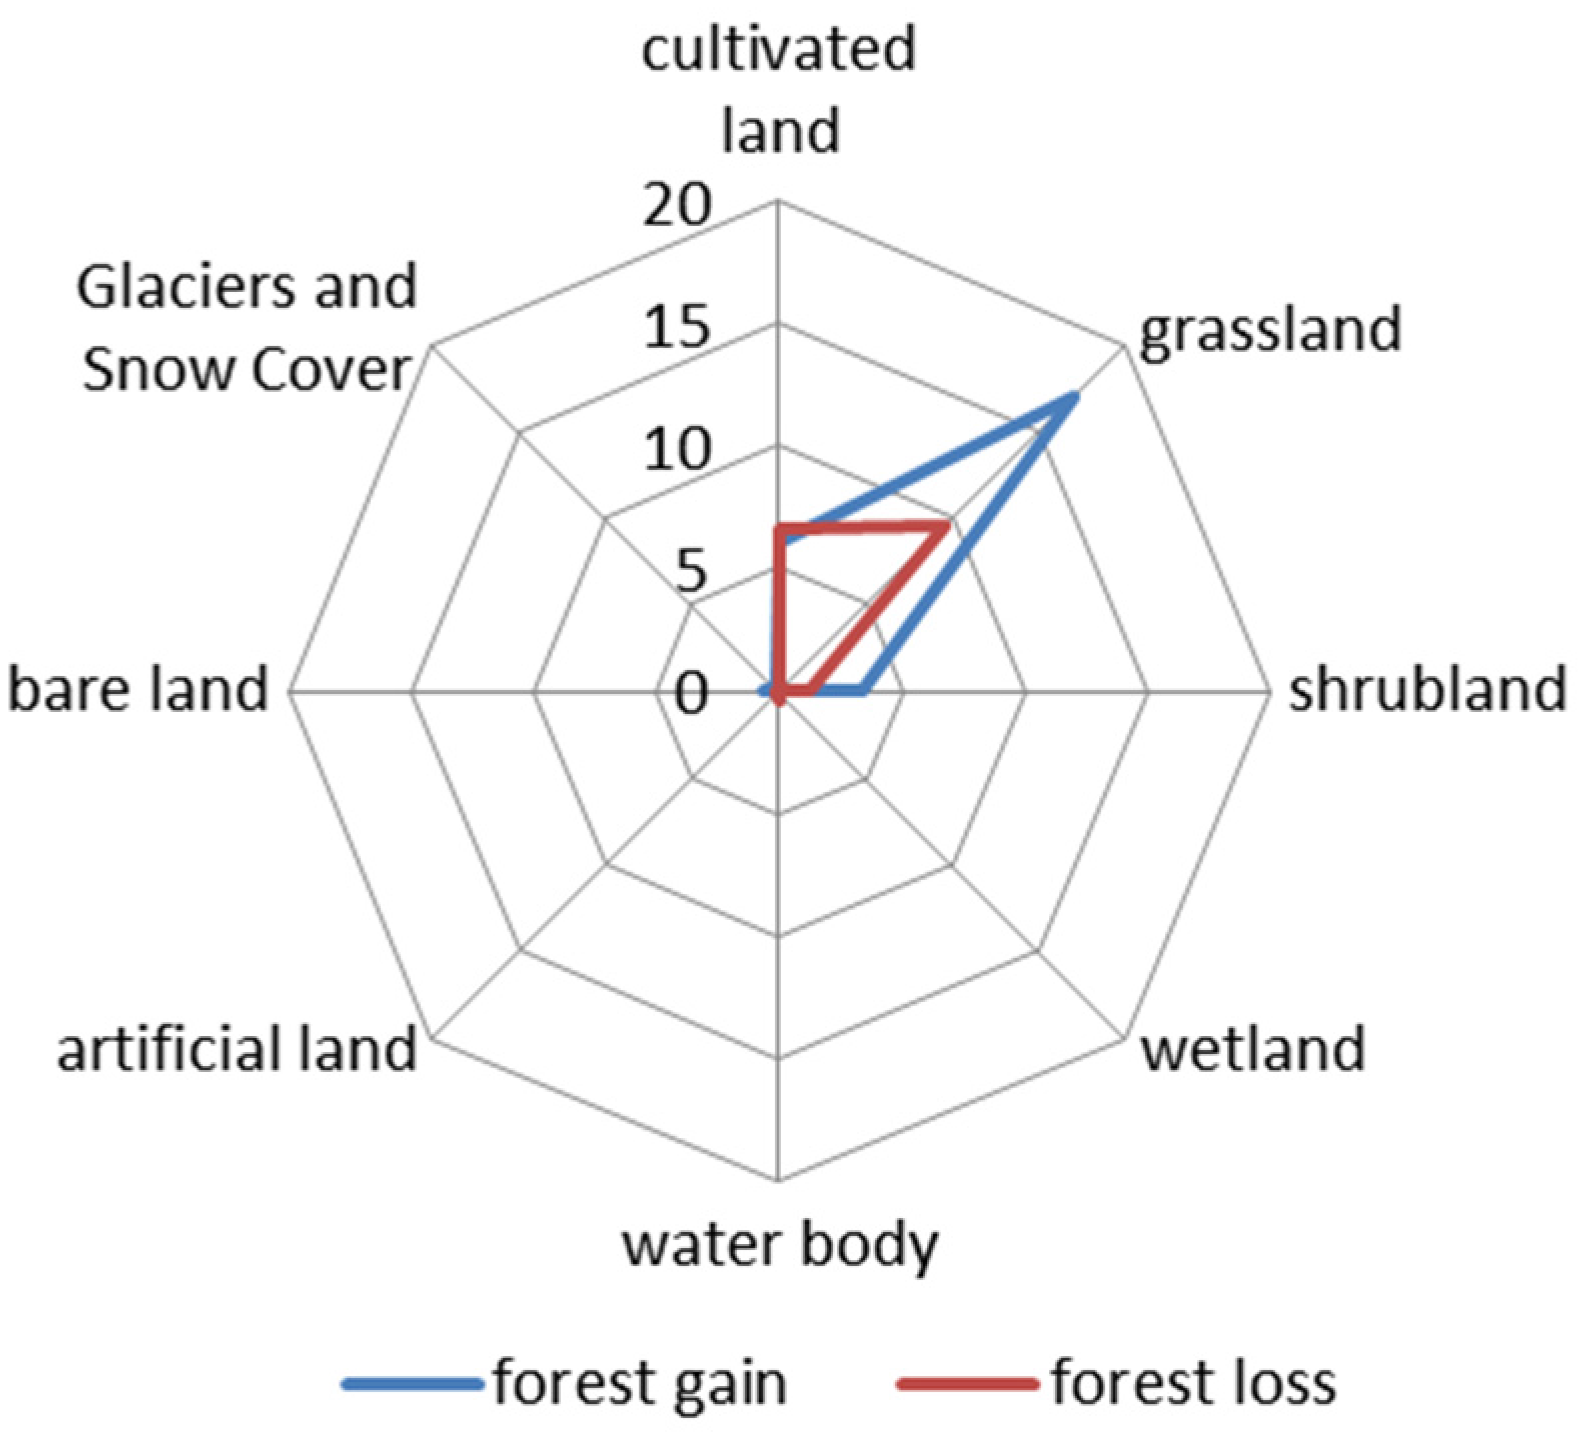
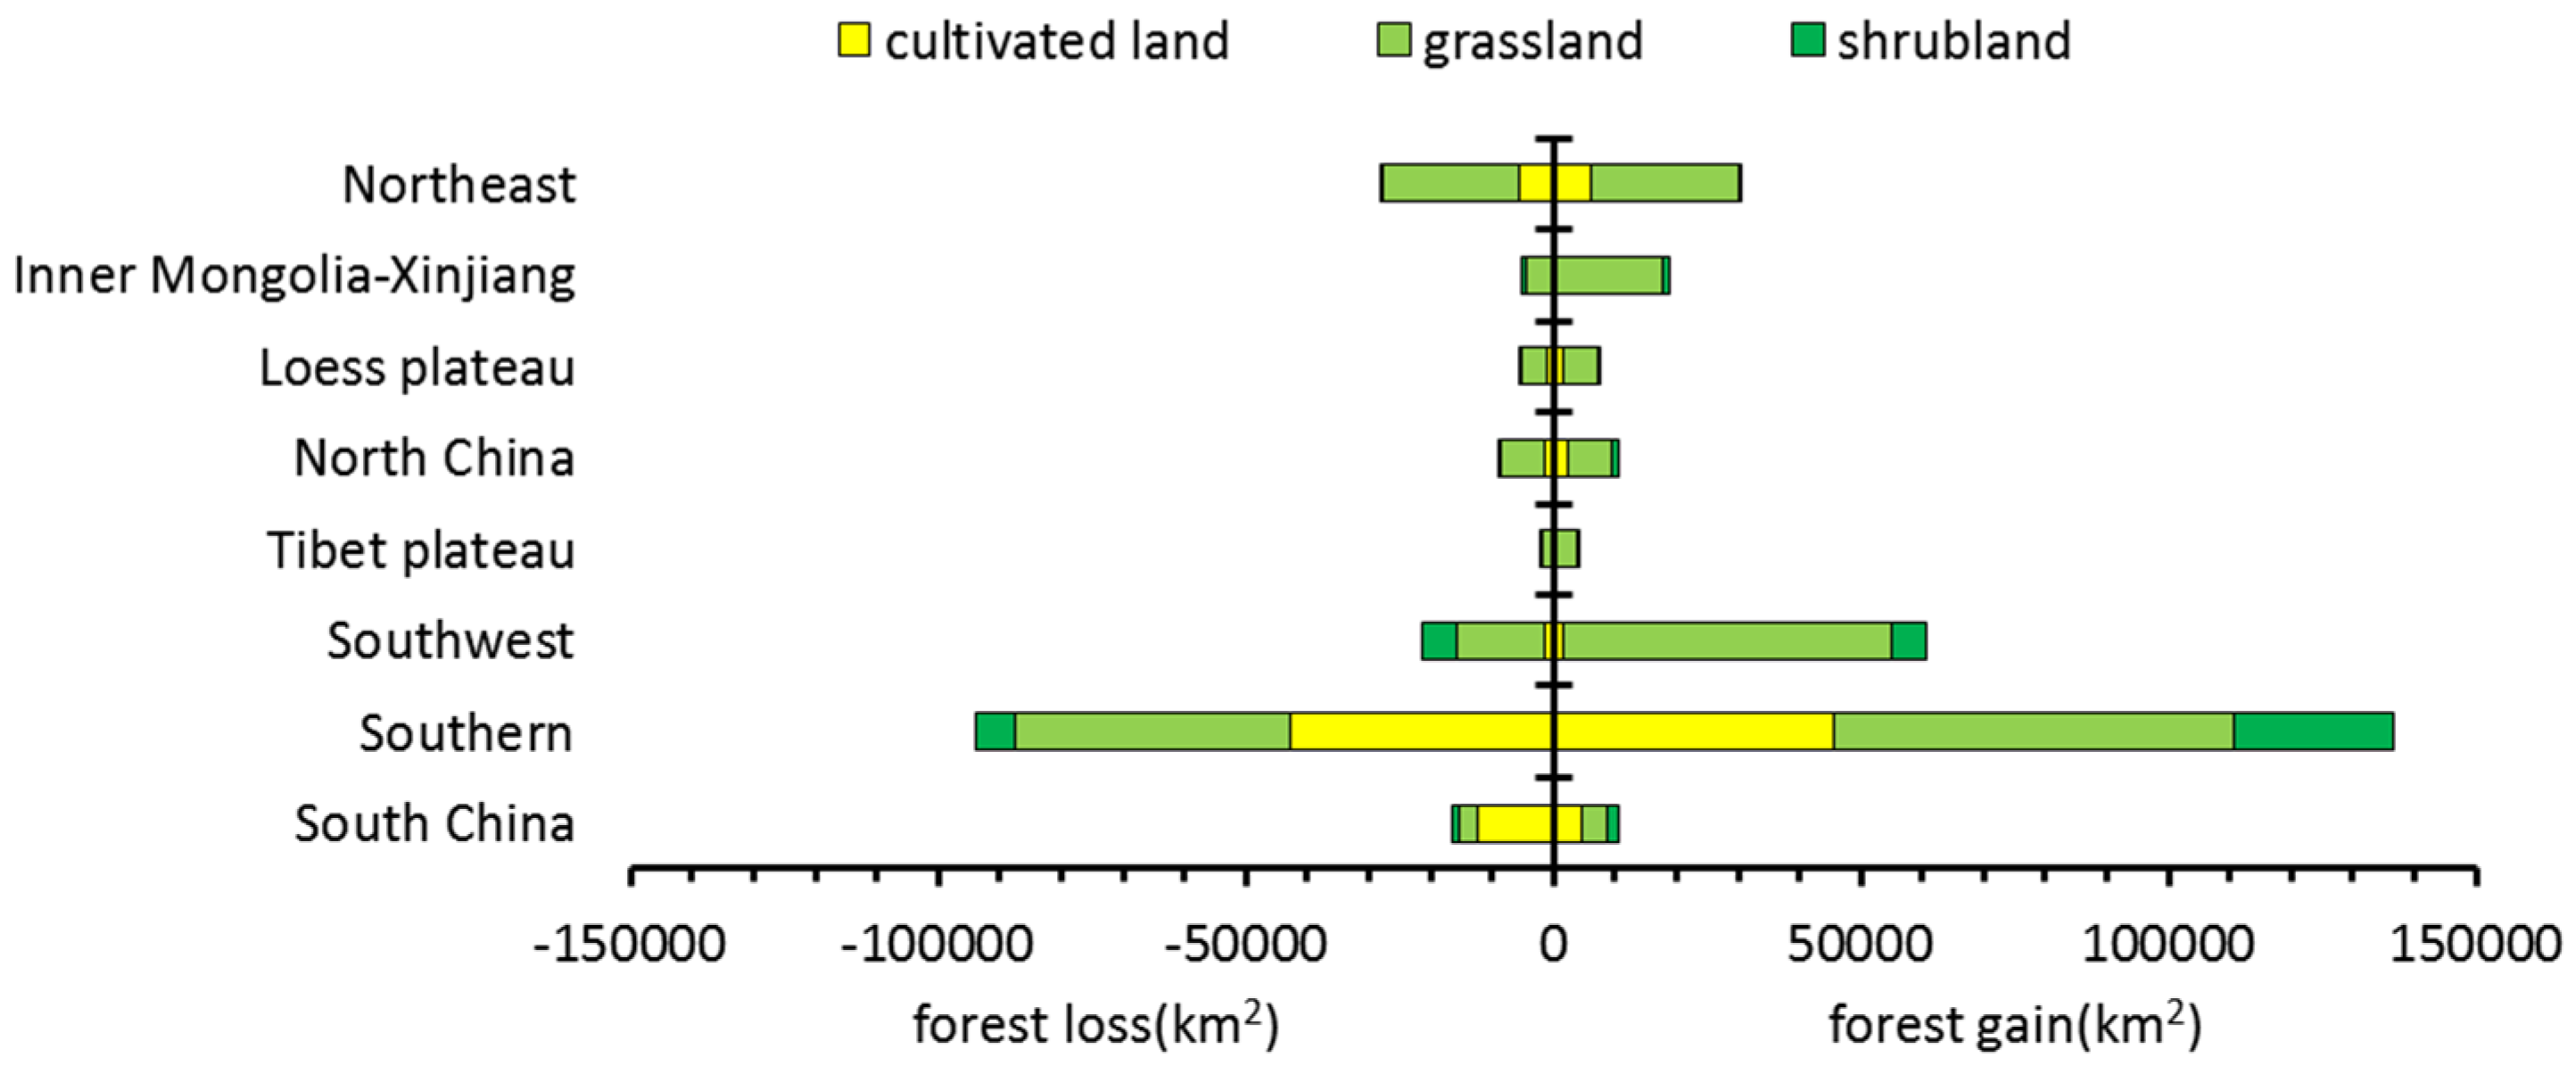
3.3. Transitions between Forest and Other Land Use Types

Grassland is the primary source of land being both converted to forest and being converted from forest in China in the early 21st century. Cultivated land and shrubland are in second and third place, respectively, as sources of land that are converted to forest (Figure 6). Between 2000 and 2010, 169,200 km2 of grassland were converted to forest in China, accounting for 61.55% of the increase. In the same period, 60,100 km2 of cultivated land, and 33,400 km2 of shrubland were also transferred to forest, accounting for 21.86% and 12.15% of the total increase, respectively. The total areas of grassland, cultivated land, and shrubland converted to forest account for 95.56% of the total increase, while at the same time, grassland, cultivated land, and shrubland are also the main beneficiaries of forest decrease. These land use types increased by 95,800, 66,200, and 12,900 km2, respectively, as a result of forest decrease, accounting for 52.44%, 36.23%, and 7.06% of the total, respectively, and adding up to 95.73% of the total decrease in forested land in China. As a result of these data, it is clear that there has been a very extensive transfer between forest and grassland in China, which is the key factor balancing forest area change. Indeed, the quantity of transfer between forest and cultivated land has enabled the maintenance of a basic balance. Nevertheless, it is important to note that 66,200 km2 of forest has been transferred to cultivated land as a result of a push to implement the Forest Conservation Policy. Thus, because of developments including the return of farmland to forest, this phenomenon deserves a deeper analysis. Indeed, when this is viewed from the perspective of the regional forestry divisions (Figure 6), land use change in regions overseen by the Southern Forestry Division is the most acute, with the Southwest and Northeast Forestry Divisions in second and third place, respectively. In terms of transformational characteristics, eight forestry divisions exhibit the same variable trend that was observed on a nationwide scale; the main sources and directions of forest increase and decrease are grassland, cultivated land, and shrubland. Finally, it is worth noting that 42,810 km2 of forest have been transferred to cultivated land in the regions overseen by the Southern Forestry Division, and a similar situation is also observed in the regions controlled by the South China and Northeast Forestry Division (12,420 km2 and 5710 km2, respectively). Therefore, one concern going forward should be to focus these three forestry divisions on the issues related to converting forests into cultivated land.

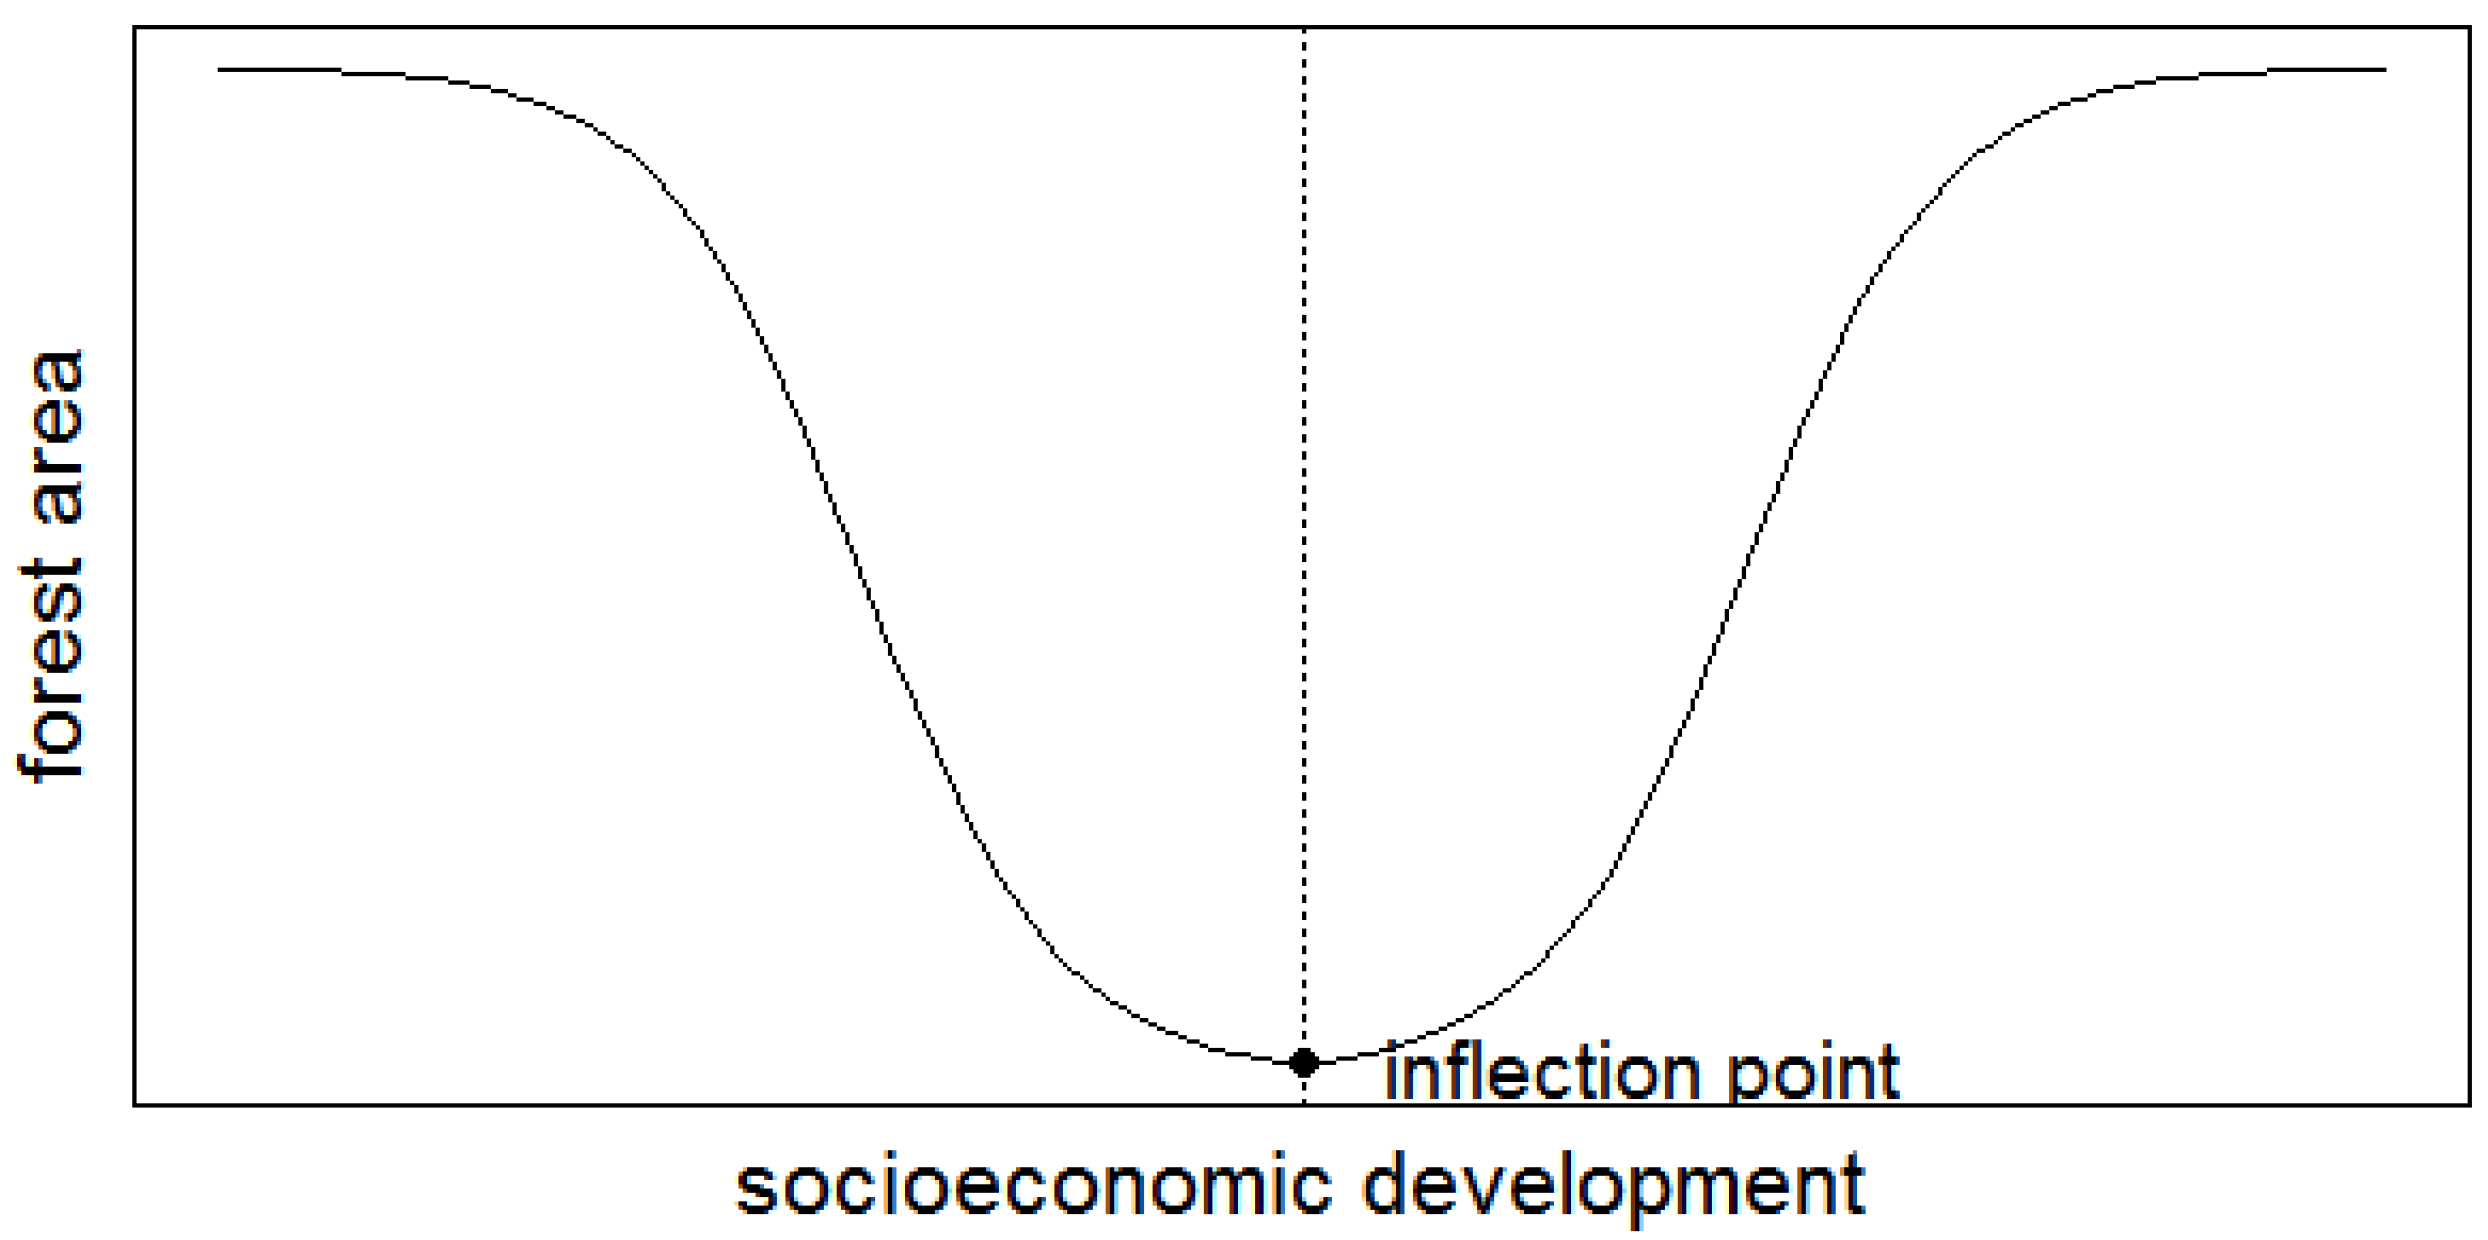
3.4. Relationships between Forest Area Changes and Socioeconomic Development

We developed four regression models to verify the relationship between forest area changes and socioeconomic development across China and in eastern regions, central regions, and western regions separately. The regions were divided by different economic levels. Thus, taking the variability of the administrative region and availability of the data into consideration, we only consider provinces, municipalities, and autonomous regions in mainland China in this analysis and exclude Hong Kong, Macao, and Taiwan. The estimated results of our regression models can be seen in Table 4.
From the point of view of socioeconomic development, we have focused on the influence of the county economy level, forestry investment, urbanization level, and demographic change on forest area changes. From the regression results, the relationship between forest area changes, per capita GDP and its quadratic term is significant in model east (for eastern counties), model west (western counties), and model total (for all counties) The regression coefficients of per capita GDP are negative, while those of its quadratic term are positive in those three models; that is, forest area changes conform to a ‘U-shaped’ curvilinear relationship along with increasing per capita GDP. These results reveal that forest resources in China have tended to decrease initially and then perform an increasing trend with economic development. The forest transitions in the eastern, central, and western parts of China have regional differences. At the national scale (model total), the inflection point in forest transition occurs at 50,522 yuan per capita GDP, overall, and 5.51% counties have passed the inflection point in 2010, so the forest transition is not obvious yet. In the eastern counties (model east), this inflection point occurs at 47,232 yuan per capita GDP, and 17.39% counties have passed the inflection point. In western counties (model west), the inflection point is at 38,000 yuan per capita GDP, and 5.75% counties have passed the inflection point. There is no forest transition caused by economic development that occurred in the central counties.
As for the forestry investment factor, a proxy variable of policy factor, it is significant across China. In looking at different regions, it is only significant in the central part at 1% level. The central region has rich forest resources originally, but its economic growth structure is single. Ecological resources have a comparative advantage across China. Governments tend to take advantage of their ecological resources by developing ecological constructions. The forest construction projects, such as Natural Forest Protection Program and Grain for Green Project, were mainly conducted here. Therefore, the increase in forest in the central part of China has no significant correlation with economic development, but it can be attributed to policy factors. Thus, we cannot conclude that no forest transition has happened, because the “scarcity of forest” type of the forest transition theory is also driven by policy factors, which is also a type of forest transition. As for verification of the forest transition caused by policy factors in the central part of China, this can be studied in future work.
Data also show that the urbanization rate has had no significant influence on forest area changes. There is no excessive consumption of forest resources in the process of urbanization; or, alternatively we can say that the government is still the major influencer of forest area change, and that timber consumption is inadequate to influence the general trends. As for the demographic changes, in model west and model total, we can see that in a county, the more the variation in total population that it has, the more forest area that it has. There is also a negative relationship between variations in the rural population and the forest areas in a county, although demographic changes do not influence the forest area directly, or the relationship between them is an open relationship that cannot be tied to a certain range. Since the effect of population change on forest area change is not significant in eastern counties (model east) and central counties (model central), the argument that forest can be overconsumed by population increase and economic development does not appear in eastern and central regions in China. Indeed, the subsistence economy of rural China appears to be no more highly dependent on natural resources.

4. Conclusions and Discussion

This study shows that the forest resources in China have increased at a faster rate in the 21st century compared to the rest of the world. Indeed, the forested area of China increased from 2,017,600 to 2,120,100 km2 between 2000 and 2010, an increase of 102,500 km2. Across the country, the forest growth rate was 5.08%, and forest coverage rate increased from 20.94% to 22.01%, a 1.06% overall increase between 2000 and 2010. Regionally, the increases in the total acreage of forest area in the zones controlled by the Southern Forestry Division and the Southwest Forestry Division accounted for 81.92% of the total national increase; only the South China Forestry Division experienced a decrease in forest area over this period. Overall, forest areas increased markedly in some western provinces, including Sichuan, Tibet, and Gansu, while a slight downward trend was observed in some eastern regions, including Zhejiang and Liaoning provinces. Across the whole country, Hainan province experienced the most extensive deforestation.
This article has also focused on the impact of socioeconomic development on forest area changes. The results show a ‘U-shaped’ relationship between change in forest area and per capita GDP; in other words, China is experiencing ‘forest transition’. Indeed, the inflection point in the Chinese ‘forest transition’ can be estimated at 50,522 yuan per capita GDP. Although a policy of strict protection of forest resources has been followed in China, and we have advocated that the country does not go down the ‘pollution first, treatment later’ road at a national level, in terms of the actual situation based on our regression results, it is clear that both economic growth and forest area changes have failed to remove the EKC (Environmental Kuznets Curve) pattern. Thus, from this perspective, developing the economy remains the most sustainable way to maintain an increase in forest resources. It is of considerable note that since Chinese reforms were initiated and the country was opened up more than 30 years ago, the economy has been developing rapidly; although growth has slowed in recent years, a high level of development in China is likely to be maintained. Against this backdrop, forest resources will continue to grow along with the development of the economy.
Our results show that the spatial heterogeneity of forest area changes in China are significant; hot spots of increases in forest area are highly consistent with hot spots of deforestation, confirming a dynamic balance of resources in space. Take Sichuan province as an example, the Sichuan forest region is one of the key forest regions in China; its forest area increased by 24.73% during 2000–2010. The main reason for this result is the construction of Yangtze River Shelter Forest Project, the implementation of the Natural Forest Protection Program since the 1990s, and the development of the Green for Grain Project since 2000 (approximately 1.85 million ha of agricultural land was transferred to forest land due to this project). The large amounts of forest resources consumed during the 1980s to the mid-1990s were under gradual recovery in these forestry projects. The subsidiary reason is attributed to inter-industry land conversions and the adjustment of planting structures in rural areas [29]. Conversely, the Sichuan forest region’s forest area decreased by 11.17% during 2000–2010. The main reason is attributed to the high demand for local forest resources from the local market, and issues surrounding the implementation of a forest resources cutting quota, which is quite difficult to implement [30]. Overall, the forest area showed a net increase of 13.56% in Sichuan, but from the view of forest structure change, different species of forest have different variation trends, and they vary considerably. Some studies have shown that there were increases of 53.3%, 104.4%, and 307.5% in forestland, shrubland, and unwooded land during 1979–2007, while the sparse woodland decreased by 77.3% [29]. From this aspect, we can also see that if one region is a hot spot of forest gain, it can also be a hot spot of forest loss at the same time. To sum it up, one region can be the hot spot of forest gain and loss at the same time because these regions have a greater change in forest resources and different species of forest lands often have different varying trends of increasing and decreasing. Note that Xiaoxing’anling-Changbaishan Mountains and South China have experienced significant decreases in forest area; these changes should be investigated. In contrast, forest areas have increased rapidly in recent years in the western provinces, including Xinjiang, Gansu and Inner Mongolia, because of artificial afforestation. However, because forest growth relies on irrigation in many regions, these forests will become composed of ‘runt trees’, or even die if a water source cannot be guaranteed. Our data show that the boundary of forest growth lies mainly in regions of more than 400 mm precipitation in northern areas, so caution is needed when planting trees in regions where precipitation is less than 400 mm so as not to waste financial resources. Indeed, we would argue that, in the future, regions with lower elevations or slopes should be considered in greater detail because of dramatic forest area changes. In the meantime, it is clear that the government needs to strengthen the management of large-scale conversions between forests and grassland.
In summary, because the factors influencing changes in forest area include regional natural conditions, protection policies, construction investment, level of economic development, and import-export trade, relationships can be complicated. Owing to the availability of the data, our study could not incorporate all factors, but more can certainly be analyzed in the future.

Acknowledgments

This study was funded by National Natural Science Foundation of China (41571095) and National Key Basic Research Program of China (2015CB452702).

Author Contributions

Jiayue Wang calculated and analyzed the data in addition to writing the paper. Liangjie Xin designed the research project and analyzed the data in addition to writing the paper. Minghong Tan gave suggestions for the whole study. Yahui Wang contributed to the regression models. Many thanks go to the anonymous reviewers for their valuable comments on the manuscript.

Conflicts of Interest

The authors declare no conflict of interest.

Abbreviations

The following abbreviations are used in this manuscript:
GDPGross Domestic Product
EKCEnvironmental Kuznets Curve
DEMDigital Elevation Model

References

  1. Food and Agriculture Organization of the United Nations. Main Report: Global Forest Resource Assessment; FAO: Rome, Italy, 2010. [Google Scholar]
  2. Foley, J.A.; DeFries, R.; Asner, G.P.; Barford, C.; Bonan, G.; Carpenter, S.R.; Chapin, F.S.; Coe, M.T.; Daily, G.C.; Gibbs, H.K.; et al. Global consequences of land use. Science 2005, 309, 570–574. [Google Scholar] [CrossRef] [PubMed]
  3. Mather, A.S. The forest transition. Area 1992, 24, 367–379. [Google Scholar]
  4. Mather, A.S. Recent Asian forest transitions in relation to forest transition theory. Int. For. Rev. 2007, 9, 491–501. [Google Scholar]
  5. Barbier, E.B.; Burgess, J.C.; Grainger, A. The forest transition: Towards a more comprehensive theoretical framework. Land Use Policy 2010, 27, 98–107. [Google Scholar] [CrossRef]
  6. Grainger, A. The forest transition: An alternative approach. Area 1995, 27, 242–251. [Google Scholar]
  7. Zhang, Y.; Tachibana, S.; Nagata, S. Impact of socio-economic factors on the changes in forest areas in China. For. Policy Econ. 2006, 9, 63–76. [Google Scholar] [CrossRef]
  8. Lambin, E.F.; Meyfroidt, P. Land use transitions: Socio-ecological feedback versus socio-economic change. Land Use Policy 2010, 27, 108–118. [Google Scholar] [CrossRef]
  9. Li, X.B.; Zhao, Y.L. Forest transition, agricultural land marginalization and ecological restoration. China Popul. Res. Environ. 2011, 21, 91–95. [Google Scholar]
  10. Fang, J.Y.; Guo, Z.D.; Amp, S.L.; Chen, A.P. Terrestrial vegetation carbon sinks in China, 1981–2000. Sci. China Ser. D Earth Sci. 2007, 50, 1341–1350. [Google Scholar] [CrossRef]
  11. Liu, S.N.; Zhou, T.; Wei, L.Y.; Shu, Y. The spatial distribution of forest carbon sinks and sources in China. Chin. Sci. Bull. 2012, 57, 1699–1707. [Google Scholar] [CrossRef]
  12. Wang, D.; Wang, B.; Niu, X. Forest carbon sequestration in China and its benefits. Scand. J. For. Res. 2014, 29, 51–59. [Google Scholar] [CrossRef]
  13. Ma, X.Z.; Wang, Z. Estimation of provincial forest carbon sink capacities in Chinese mainland. Chin. Sci. Bull. 2011, 56, 433–439. [Google Scholar] [CrossRef]
  14. Wang, S.; Liu, C.; Wilson, B. Is China in a later stage of a U-shaped forest resource curve—A re-examination of empirical evidence. For. Policy Econ. 2007, 10, 1–6. [Google Scholar] [CrossRef]
  15. Liu, C.; Lv, J.Z. Study on China’s forest resource environmental Kuznets curve. Res. Inst. Econ. 2010, 28, 138–161. [Google Scholar]
  16. Hu, A.G.; Shen, R.M.; Lang, X.J. Verification of the environmental Kuznets curve relationship between changes in China’s forest resources and economic development: Based on provincial panel data from the second to the seventh national forest statistics. China Publ. Admin. Rev. 2013, 15, 61–75. [Google Scholar]
  17. Zhang, D.; Stenger, A.; Haroud, P.A. Policy instruments for developing planted forests: Theory and practices in China, the U.S., Brazil, and France. J. For. Econ. 2015, 21, 223–237. [Google Scholar] [CrossRef]
  18. Zhang, Y.Q.; Uusivuori, J.; Kuuluvainen, J. Impacts of economic reforms on rural forestry in China. For. Policy Econ. 2000, 1, 27–40. [Google Scholar] [CrossRef]
  19. Deng, X.Z.; Jiang, Q.O.; Zhan, J.Y.; He, S.J.; Lin, Y.Z. Causes and trends of forestry area change in northeast China. Acta Geogr. Sin. 2010, 65, 224–234. [Google Scholar]
  20. Ge, Q.S.; Zhao, M.C.; Zhang, X.Q.; Zheng, J.Y.; Sun, H.N.; Zhang, P.Y. Statistical analysis about the changes of forest resource and precipitation in China over the past 50 years. J. Nat. Res. 2001, 16, 413–419. [Google Scholar]
  21. Wang, H.; Lü, Z.; Gu, L.; Wen, C. Observations of China’s forest change (2000–2013) based on the Global Forest Watch dataset. Biodivers. Sci. 2015, 23, 575–582. [Google Scholar] [CrossRef]
  22. Chen, J.; Chen, J.; Liao, A.P.; Cao, X.; Chen, L.J.; Chen, X.H.; Peng, S.; Han, G.; Zhang, H.W.; He, C.Y.; et al. Concepts and key techniques for 30 m global land cover mapping. Acta Geod. Cartogr. Sin. 2014, 43, 551–557. [Google Scholar]
  23. Office of Forest Division, Ministry of Forestry. Forest Division of China; Forestry Publishing House: Beijing, China, 1987.
  24. Sunderlin, W.D.; Resosudarmo, I.A.P. The effect of population and migration on forest cover in Indonesia. J. Environ. Dev. 1999, 8, 152–169. [Google Scholar] [CrossRef]
  25. Robinson, B.E.; Holland, M.B.; Naughton-Treves, L. Does secure land tenure save forests? A meta-analysis of the relationship between land tenure and tropical deforestation. Glob. Environ. Chang. 2014, 29, 281–293. [Google Scholar] [CrossRef]
  26. Yang, H.; Nie, Y.; Ji, C. Study on China’s timber resource shortage and import structure: Natural forest protection program outlook, 1998 to 2008. For. Prod. J. 2010, 60, 408–414. [Google Scholar] [CrossRef] [Green Version]
  27. Marisol, T.; Poorter, L.; Peña-Claros, M. Climate is a stronger driver of tree and forest growth rates than soil and disturbance. J. Ecol. 2010, 99, 254–264. [Google Scholar]
  28. Rudel, T.K.; Coomes, O.T.; Moran, E.; Achard, F.; Angelsen, A.; Xu, J.C.; Lambin, E. Forest transitions: Towards a global understanding of land use change. Glob. Environ. Chang. 2005, 15, 23–31. [Google Scholar] [CrossRef]
  29. Zhang, W.; Wang, X.K.; Liu, B.; Zhang, C.; Lai, C.H. Analysis on the dynamic change of Sichuan forest resources in the last thirty years (1979 to 2007). Sichuan For. Explor. Des. 2013, 1, 7–12. [Google Scholar]
  30. Li, Y. Analysis of forest resources change and development trend in Sichuan forest region. For. Sci. Tech. 2000, 7, 25–27. [Google Scholar]
Figure 1. Interpretation accuracy of forest data in different provinces in 2000.
Forests 07 00232 g001
Figure 2. Sketch map of the forest transition curve.
Forests 07 00232 g002
Figure 3. Geographical distribution of forest in China, 2010.
Forests 07 00232 g003
Figure 4. Hot and cold spots of forest area changes in China, 2000–2010: (a) forest gain; (b) forest loss; (c) forest net change. (Notes: Red regions represent hot spots and blue regions represent cold spots.)
Forests 07 00232 g004aForests 07 00232 g004b
Figure 5. Relationships between forest area changes and natural factors.
Forests 07 00232 g005
Figure 6. Transitions from forest to other land use types, 2000–2010.
Forests 07 00232 g006aForests 07 00232 g006b
Table 1. Definitions and statistical descriptions of variables.
VariableDefinitionUnitMeanStandard DeviationMinimumMaximumSample Size
forest2010Forest area in 2010km2712.8707.99.78022921707
forest2000Forest area in 2000km2715.4787.90.010044811707
GDPPer capita GDP in 2010thousand yuan21.0815.982.790116.11707
GDP2Quadratic term of per capita GDP in 2010thousand yuan699.714077.760134681707
invest_forestForestry investment during 2000–2005billion yuan2.3801.6500.1306.6101707
urbanrateUrbanization rate in 2010%34.6213.362.68094.251707
chan_tpopPopulation variation during 2000–201010 thousand person−0.4405.870−32.1840.581707
chan_trpopRural population variation during 2000–201010 thousand person−5.7206.670−36.0215.421707
elevElevationm763.9637.52.40019841707
slopeGradient°10.226.2500.37022.711707
preciPrecipitationmm979.8480.9120.921851707
actempAccumulated temperature (≥0 °C)°C46,94716,183467086,9581707
Table 2. Changes in forest area in eight forest districts, 2000–2010 (km2).
Forestry Division20002010IncreaseDecreaseVariationRate of Change %
Tibetan Plateau3051.176352.955098.781797.003301.78 (4)108.21
Inner Mongolia-Xinjiang25,801.0040,899.8521,039.645940.7915,098.85 (3)58.52
Southwest256,891.41299,049.4964,951.3222,793.2442,158.08 (2)16.41
Loess plateau55,820.7558,158.737619.495281.512337.98 (6)4.19
Southern1,118,323.361,161,159.77140,379.4797,543.0642,836.41 (1)3.83
North China92,073.0893,602.1710,938.299409.201529.09 (7)1.66
Northeast407,429.73409,979.6631,056.3228,506.392549.93 (5)0.63
South China147,482.94141,419.9811,280.4017,343.36−6062.96 (8)−4.11
Figures given in brackets are the rankings of forest area changes.
Table 3. Provincial changes in forest area in China, 2000–2010 (km2).
Province20002010IncreaseDecreaseVariationRate of Change (%)
Shanghai2.59.59.52.57.1 (26)287.56
Gansu29,030.252,454.626,180.62756.223,424.4 (2)80.69
Qinghai1686.93018.62145.9814.21331.7 (12)78.95
Xinjiang19,340.023,352.88145.64132.84012.8 (6)20.75
Hunan106,473.6124,357.326,831.98948.117,883.7 (3)16.8
Tianjin153.8175.549.427.721.7 (24)14.11
Sichuan188,103.4213,617.746,517.021,002.725,514.3 (1)13.56
Tibet108,922.3123,041.224,472.010,353.114,119.0 (4)12.96
Chongqing31,621.335,305.36833.53149.43684.0 (7)11.65
Hubei81,669.288,166.211,526.65029.66497.0 (5)7.96
Jiangsu1999.62149.2445.2295.7149.5 (21)7.48
Shandong3452.73637.5616.3431.5184.9 (20)5.35
Guizhou82,845.286,044.515,275.712,076.53199.2 (9)3.86
Henan32,828.033,502.82345.71670.9674.8 (15)2.06
Hebei34,686.935,396.64389.43679.7709.7 (14)2.05
Beijing7020.97128.1455.2348.0107.2 (22)1.53
Shanxi42,265.142,889.53870.93246.5624.4 (16)1.48
Inner Mongolia129,972.1131,863.012,943.011,052.21890.8 (11)1.45
Yunnan225,945.5229,162.927,595.324,377.93217.3 (8)1.42
Heilongjiang179,434.2181,415.813,916.811,935.21981.6 (10)1.1
Shaanxi94,831.695,752.55743.24822.3920.9 (13)0.97
Guangdong99,085.899,657.18296.97725.6571.3 (17)0.58
Jiangxi98,725.399,198.98952.78479.1473.6 (18)0.48
Ningxia816.5818.0241.8240.31.5 (27)0.18
Guangxi158,029.4158,251.710,167.49945.2222.2 (19)0.14
Taiwan24,123.224,132.9905.0895.39.7 (25)0.04
Fujian82,475.882,500.36646.66622.024.5 (23)0.03
Zhejiang57,435.757,429.94163.84169.7−5.8 (28)−0.01
Liaoning40,906.740,698.15127.45336.1−208.7 (29)−0.51
Jilin73,417.372,748.93361.54029.9−668.4 (31)−0.91
Anhui37,450.636,973.02488.32965.8−477.5 (30)−1.28
Hainan31,501.025,103.01635.48033.4−6398.0 (32)−20.31
Figures given in brackets are the rankings of forest area changes.
Table 4. Description of variables and modeling results.
Model EastModel CentralModel WestModel Total
GDP−2.645 **−0.594−1.930 **−2.157 ***
(−2.00)(−0.38)(−2.19)(−2.86)
GDP20.028 ***0.0010.025 ***0.022 ***
(2.78)(0.03)(3.05)(3.54)
invest_forest0.79271.056 ***0.4355.267 **
(0.09)(2.93)(0.17)(2.33)
urban_rate−0.734−1.090−0.041−0.635
(−0.98)(−1.10)(−0.14)(−1.46)
chan_tpop0.8220.0021.655 ***1.511 **
(0.76)(0.00)(2.59)(2.10)
chan_trpop−1.600−2.359−1.561 ***−1.990 **
(−1.23)(−1.40)(−2.79)(−2.25)
elev0.488 ***0.264 *−0.04100.060 *
(3.23)(1.75)(−1.19)(1.95)
slope5.763 *12.391 ***2.687 **6.654 ***
(1.74)(3.07)(2.35)(5.16)
preci−0.0340.181 ***−0.002000.109 ***
(−0.64)(2.63)(−0.07)(4.98)
actemp0.003 **0.008 **−0.002 ***−0.001
(2.18)(2.22)(−2.86)(−1.10)
forest20000.775 ***0.706 ***0.986 ***0.818 ***
(18.80)(20.33)(144.93)(37.00)
constant−105.6−416.781 ***151.647 **−9.888
(−0.94)(−3.62)(2.03)(−0.39)
R20.9580.9280.9740.938
N3915867301707
F716.7409.430411339
Values in parentheses are t statistics; ***, **, and * represent the 1%, 5%, and 10% levels of statistical significance, respectively.

