Article

Seasonal Variation in Soil Greenhouse Gas Emissions at Three Age-Stages of Dawn Redwood (Metasequoia glyptostroboides) Stands in an Alluvial Island, Eastern China

1
School of Agriculture and Biology, Research Centre for Low Carbon Agriculture, Shanghai Jiao Tong University, 800 Dongchuan Rd., Shanghai 200240, China
2
Shanghai Urban Forest Ecosystem Research Station, State Forestry Administration, 800 Dongchuan Rd., Shanghai 200240, China
3
Key Laboratory for Urban Agriculture (South), Ministry of Agriculture, 800 Dongchuan Rd., Shanghai 200240, China
4
Department of Environmental and Biological Sciences, University of Eastern Finland, P.O. Box 1627, Kuopio 70211, Finland
*
Author to whom correspondence should be addressed.
These authors contributed equally to this work.
Forests 2016, 7(11), 256; https://doi.org/10.3390/f7110256
Submission received: 26 August 2016 / Revised: 18 October 2016 / Accepted: 21 October 2016 / Published: 4 November 2016
(This article belongs to the Special Issue Forest Soil Respiration under Climate Changing)

Abstract

:
Greenhouse gas (GHG) emissions are an important part of the carbon (C) and nitrogen (N) cycle in forest soil. However, soil greenhouse gas emissions in dawn redwood (Metasequoia glyptostroboides) stands of different ages are poorly understood. To elucidate the effect of plantation age and environmental factors on soil GHG emissions, we used static chamber/gas chromatography (GC) system to measure soil GHG emissions in an alluvial island in eastern China for two consecutive years. The soil was a source of CO2 and N2O and a sink of CH4 with annual emissions of 5.5–7.1 Mg C ha−1 year−1, 0.15–0.36 kg N ha−1 year−1, and 1.7–4.5 kg C ha−1 year−1, respectively. A clear exponential correlation was found between soil temperature and CO2 emission, but a negative linear correlation was found between soil water content and CO2 emission. Soil temperature had a significantly positive effect on CH4 uptake and N2O emission, whereas no significant correlation was found between CH4 uptake and soil water content, and N2O emission and soil water content. These results implied that older forest stands might cause more GHG emissions from the soil into the atmosphere because of higher litter/root biomass and soil carbon/nitrogen content compared with younger stands.

1. Introduction

Establishment and management of forest plantations play an increasingly important role in sequestrating carbon from the atmosphere as one of the major strategies for mitigating global warming. The emissions of greenhouse gases (GHGs) are mostly related to the carbon (C) and nitrogen (N) cycle from forest soils. Forest soils are the sink of carbon in the world and contain about 704 Pg C, with varying C densities under different environmental conditions [1]. On the contrary, they are also the source of N2O [1,2]. In some countries (e.g., China, India, Russian Fedration, US, Japan, etc.), plantations represent an important part of the national forested areas, and are increasing at the rate of 3–4.5 million hectare per year [3]. China accounts for 24% of the global forest plantations [3]. In China, the plantation area increased by 5.1 million ha per year during the period from 2004–2008 [4]; it is expected that 40 million hectares plantation will be established within the period from 2005 to 2020 [5]. To further our understanding of the patterns of C and N cycles and influential factors, we need to study the soil GHG emissions and their ability to mitigate global warming.
A large number of studies have been conducted about tropical forest soil GHG emissions. For instance, soil CO2 emissions ranged from 1.45 t C ha−1 year−1 to 13.74 t C ha−1 year−1 in subtropical forests of China [6,7,8], to 10.80 t C ha−1 year−1 to 11.75 t C ha−1 year−1 in subtropical Australian rainforests [9], and 25.60 t C ha−1 year−1 in tropical Thailand forests [10]. Average soil N2O emissions varied from 1.5 kg N ha−1 year−1 to 6.07 kg N ha−1 year−1 in tropical forests [11,12,13]. Mean annual CH4 uptake in tropical forest ecosystems ranged from 3.33 kg C ha−1 year−1 to 57.49 kg C ha−1 year−1 [14,15], and net CH4 sinks in tropical Montane tree forests ranged from 0.6 kg C ha−1 year−1 to 5.9 kg C ha−1 year−1 in southern Ecuador [16]. These results show that there are drastic variations in GHG emissions in specific sites across different regional biomes, thereby suggesting that the pattern of GHG emissions and influential factors will need to be elucidated at specific sites in the context of considering the management of plantations as a strategy of sequestrating atmospheric CO2.
The dynamics of soil GHG emissions in forests are influenced by key factors such as soil properties, soil temperature, soil moisture, and vegetation [15,17,18]. In previous reports, seasonal changes in soil GHG emissions were found [19,20]. Soil CO2 and N2O emissions both displayed an increasing trend with the progression of succession in natural forests, but no difference in CH4 emission was observed at different succession stages [2,12]. Few reports had examined GHG emissions at differently aged stages of plantations. Dawn redwood (Metasequoia glyptostroboides), as a living fossil tree, is widely distributed as plantations throughout the middle and high latitudes in Eurasian and North American continents [21]. It had high natural durability under the attack of basidomycetes infection and high resistance against soft-rot fungi [22,23,24]. As a fast-growing species, Dawn redwood plays an important role in carbon stocks and other ecosystem services. To further understand the pattern of GHG emissions in different aged plantations and associated influential factors, soil GHG emissions were measured at 10, 1, 7 and 32 year old dawn redwood stands for two consecutive years in this study.
These are the following objectives of this study: (1) reveal the seasonal variation of soil GHG emissions at different age-stages of plantations; (2) show the relationship between the GHG emissions and soil temperature, and GHG emissions and moisture; (3) determine the relative importance of biomass, soil C and N content, soil temperature, and soil moisture on GHG emissions; and (4) understand the role of dawn redwood stand soil as the source or sink for CO2, CH4, and N2O at different age stages. We hypothesized that different patterns of GHG emissions could exist in differently aged forests. This is partially due to consideration of the different assimilated products of photosynthesis, some of which are allocated into the roots within a short time period after photosynthesis, for example. As such, GHG emissions are not only affected by soil temperature but are also affected by plant photosynthesis via below-ground carbon allocation.

2. Materials and Methods

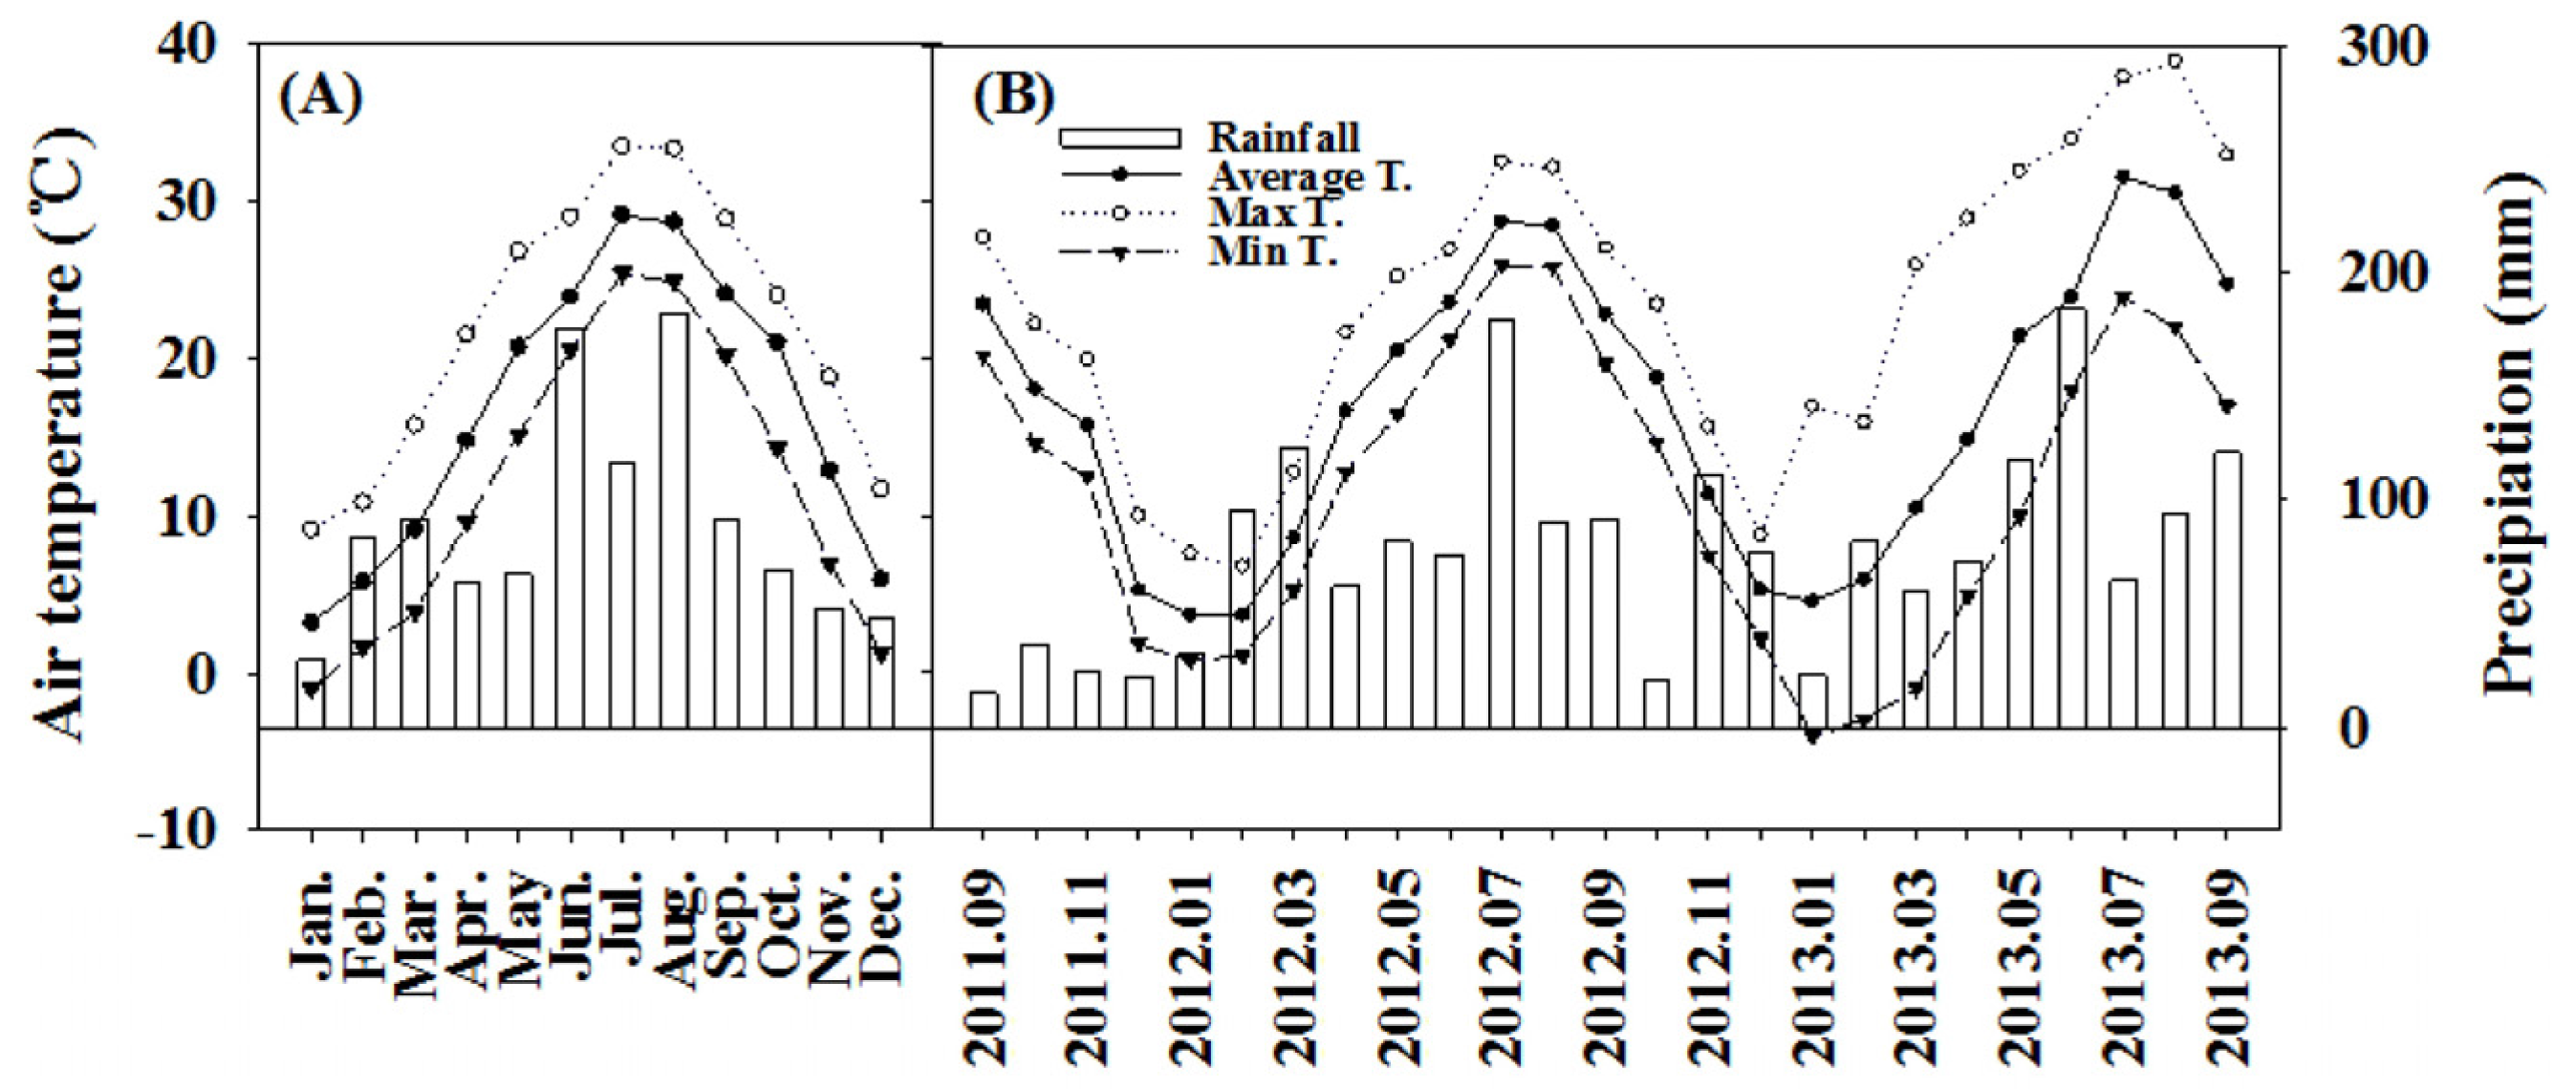
2.1. Site Description

The experimental stands are located in Dongping National Forest Park (41.68° N, 121.48° E), Chongming Island, Shanghai, China. Chongming Island, the largest alluvial island in the world, is located in the Yangtze River Estuary, which covers an area of 1267 km2 and which currently increases at the rate of 500 ha year−1 through Yangtze River-derived sediment [25]. During the period of 2009–2013, the mean annual temperature and precipitation of this area was 16.6 °C and 1072.3 mm, respectively [26]. Rainfall is concentrated mostly on May–September (Figure 1).
Dongping National Forest Park is the largest forest farm in eastern China, with 70% of the total area covered by dawn redwood plantations. Since the 1960s, plantations have been established to form different aged stands. In order to examine the effects of stand age on soil GHG emission, three different aged stands of 10, 17, and 32 years old were selected. In each stand, three plots (20 m × 20 m) were set up in August 2011 (Table 1).
Biomass carbon storage. In 2011, all trees were counted at all sites. The height of every single tree was determined by using a Haglöf Vertex III Ultrasonic Hypsometer. The diameter at breast height (1.3 m above the ground) (DBH) was measured using a measuring tape. The whole tree dry biomass was calculated by Becuwe’s allometric functions (M = 0.06291 DBH2.4841), and carbon stock in the stands was estimated by considering the carbon contents of tree dry biomasses (around 50%) [27].
Soil properties. To determine the bulk density, pH, total carbon (C), and nitrogen (N) concentrations of the soil in the stand, three soil samples were collected from each plot. Soil bulk density was obtained by the volumetric ring method [28]. Soil pH was measured by 1:5 dry soil: CaCl2 solution (0.01 M) [29]. The total soil C and N concentrations were determined by using an elemental analysis-stable isotope ratio mass spectrometer (Vario ELIII Elementar, Hessen Langenselbold, Germany).

2.2. Measurements

2.2.1. Soil Gas Emissions

Gas emission measurements were based on Forestry Standards “Observation Methodology for Long-term Forest Ecosystem Research” of PR China (LY/T 1952–2011). Because the forest sites were relatively homogeneous, three observation points were systematically arranged in each stand. The static chamber method was employed to measure soil CO2, CH4, and N2O emissions. Gas emissions were measured every two weeks (September 2011–September 2013).
The static chamber consisted of two parts. First, the stainless steel based part (0.5 m × 0.5 m × 0.2 m) was permanently inserted at a 10 cm depth in the soil for each observation point of the plots, and the second upper part was made of a polyvinyl chloride plate with a size of 0.5 m × 0.5 m × 0.5 m. A fan was installed in each upper chamber for air mixing. Next, 30 min after closing the chamber, gas samples were collected with a gastight syringe (100 mL) every 10 min for the next 40 min (0, 10 min, 20 min, 30 min, and 40 min). Five gas samples at each observation point were taken between 9:00 a.m. and 12:00 a.m. and analyzed by gas chromatography (6890N, Agilent, Santa Clara, CA, USA) with an Electron Capture Detector (ECD) for N2O detection and an Flame Ionization Detector (FID) for CH4 and CO2 detection [31,32]. The minimum detectable limit of CO2, CH4, and N2O fluxes were 0.3 mg C m−2 h−1, 4.4 μg C m−2 h−1, and 0.3 μg N m−2 h−1, respectively [33]. The gas emissions were calculated by the rate of gas concentration change during sampling. The calculation details were as follows.
F = d C d t × m P V A R T = H × d C d t × m P R T ,
where F is the gas emissions (mg m−2 h−1 for CO2 and CH4, and μg m−2 h−1 for N2O), and d C d t (μL L−1 min−1 for CO2 and CH4, and nL L−1 min−1 for N2O) is the emission rate of CO2, CH4, or N2O concentration in the chamber. A linear regression is used to calculate the emission rate. The m (g mol−1) is the molecular weight of trace gas. P indicates the atmospheric pressure (P = 1.013 × 10⁵ Pa). R is the gas constant (R = 8.314 J mol−1 K−1). T (K) is the air temperature in the chamber. V (cm3), H (cm), and A (cm2) are the volume, height, and area of the static chamber, respectively.

2.2.2. Soil Temperature and Soil Water Content

The probe of digital thermometer JM 624 (Jinming Insturment Co., LTD, Tianjin, China) was inserted at 5 and 10 cm soil depth to detect the soil temperature on the outside of each chamber when we collected the gas samples. Soil samples were taken by soil auger from 0 cm to 10 cm and 10 cm to 20 cm depths to determine soil water contents gravimetrically by measuring the fresh and dry weights after drying in an oven at 105 °C for two days.

2.3. Data Analysis

Generally, the growing season of dawn redwood in Shanghai is from May to November, and the non-growing season is from December to April. We split our observed data into two parts according to the growing or non-growing season to determine whether soil respiration increases simultaneously with increasing photosynthesis.

2.3.1. Q10 Values

The temperature sensitivity of the soil respiration rate at the three stands was calculated by a non-linear regression model with the van’t Hoff function, as follows:
RS = αeβT,
where RS is the soil respiration (mg CO2 m−2 h−1), α and β are fitted constants, and T is soil temperature, which was measured at 5 cm and 10 cm depths in the soil [34,35]. Q10 is the factor explaining the temperature sensitivity of soil respiration, and it is calculated as follows: Q10 = e10β [36,37].

2.3.2. The Relationship between GHG Emissions and Environmental Factors

One-sample Kolmogorov-Smirnov testing was used to determine whether the GHG emissions, soil temperature, and soil moisture were normally distributed. Soil temperature and soil moisture were normally distributed. Data variation among the sites was tested for significance by using the Duncan test following ANOVA. Pearson correlation analyses were used to analyze the relationship between greenhouse gas and the environment factors. Statistical analysis was conducted using IBM SPSS Statistics 21 software.
Canonical correspondence analysis (CCA) was conducting by using the CCA procedure in PAST 3 to detect the relationship between soil GHG emissions and environmental factors, such as soil temperature, soil water content, soil C and N concentration, and foliage C and N concentrations. A plot of the first two canonical variables (Can 1 and Can 2) was made to visually show the correlation among gases and environmental variables.

3. Results

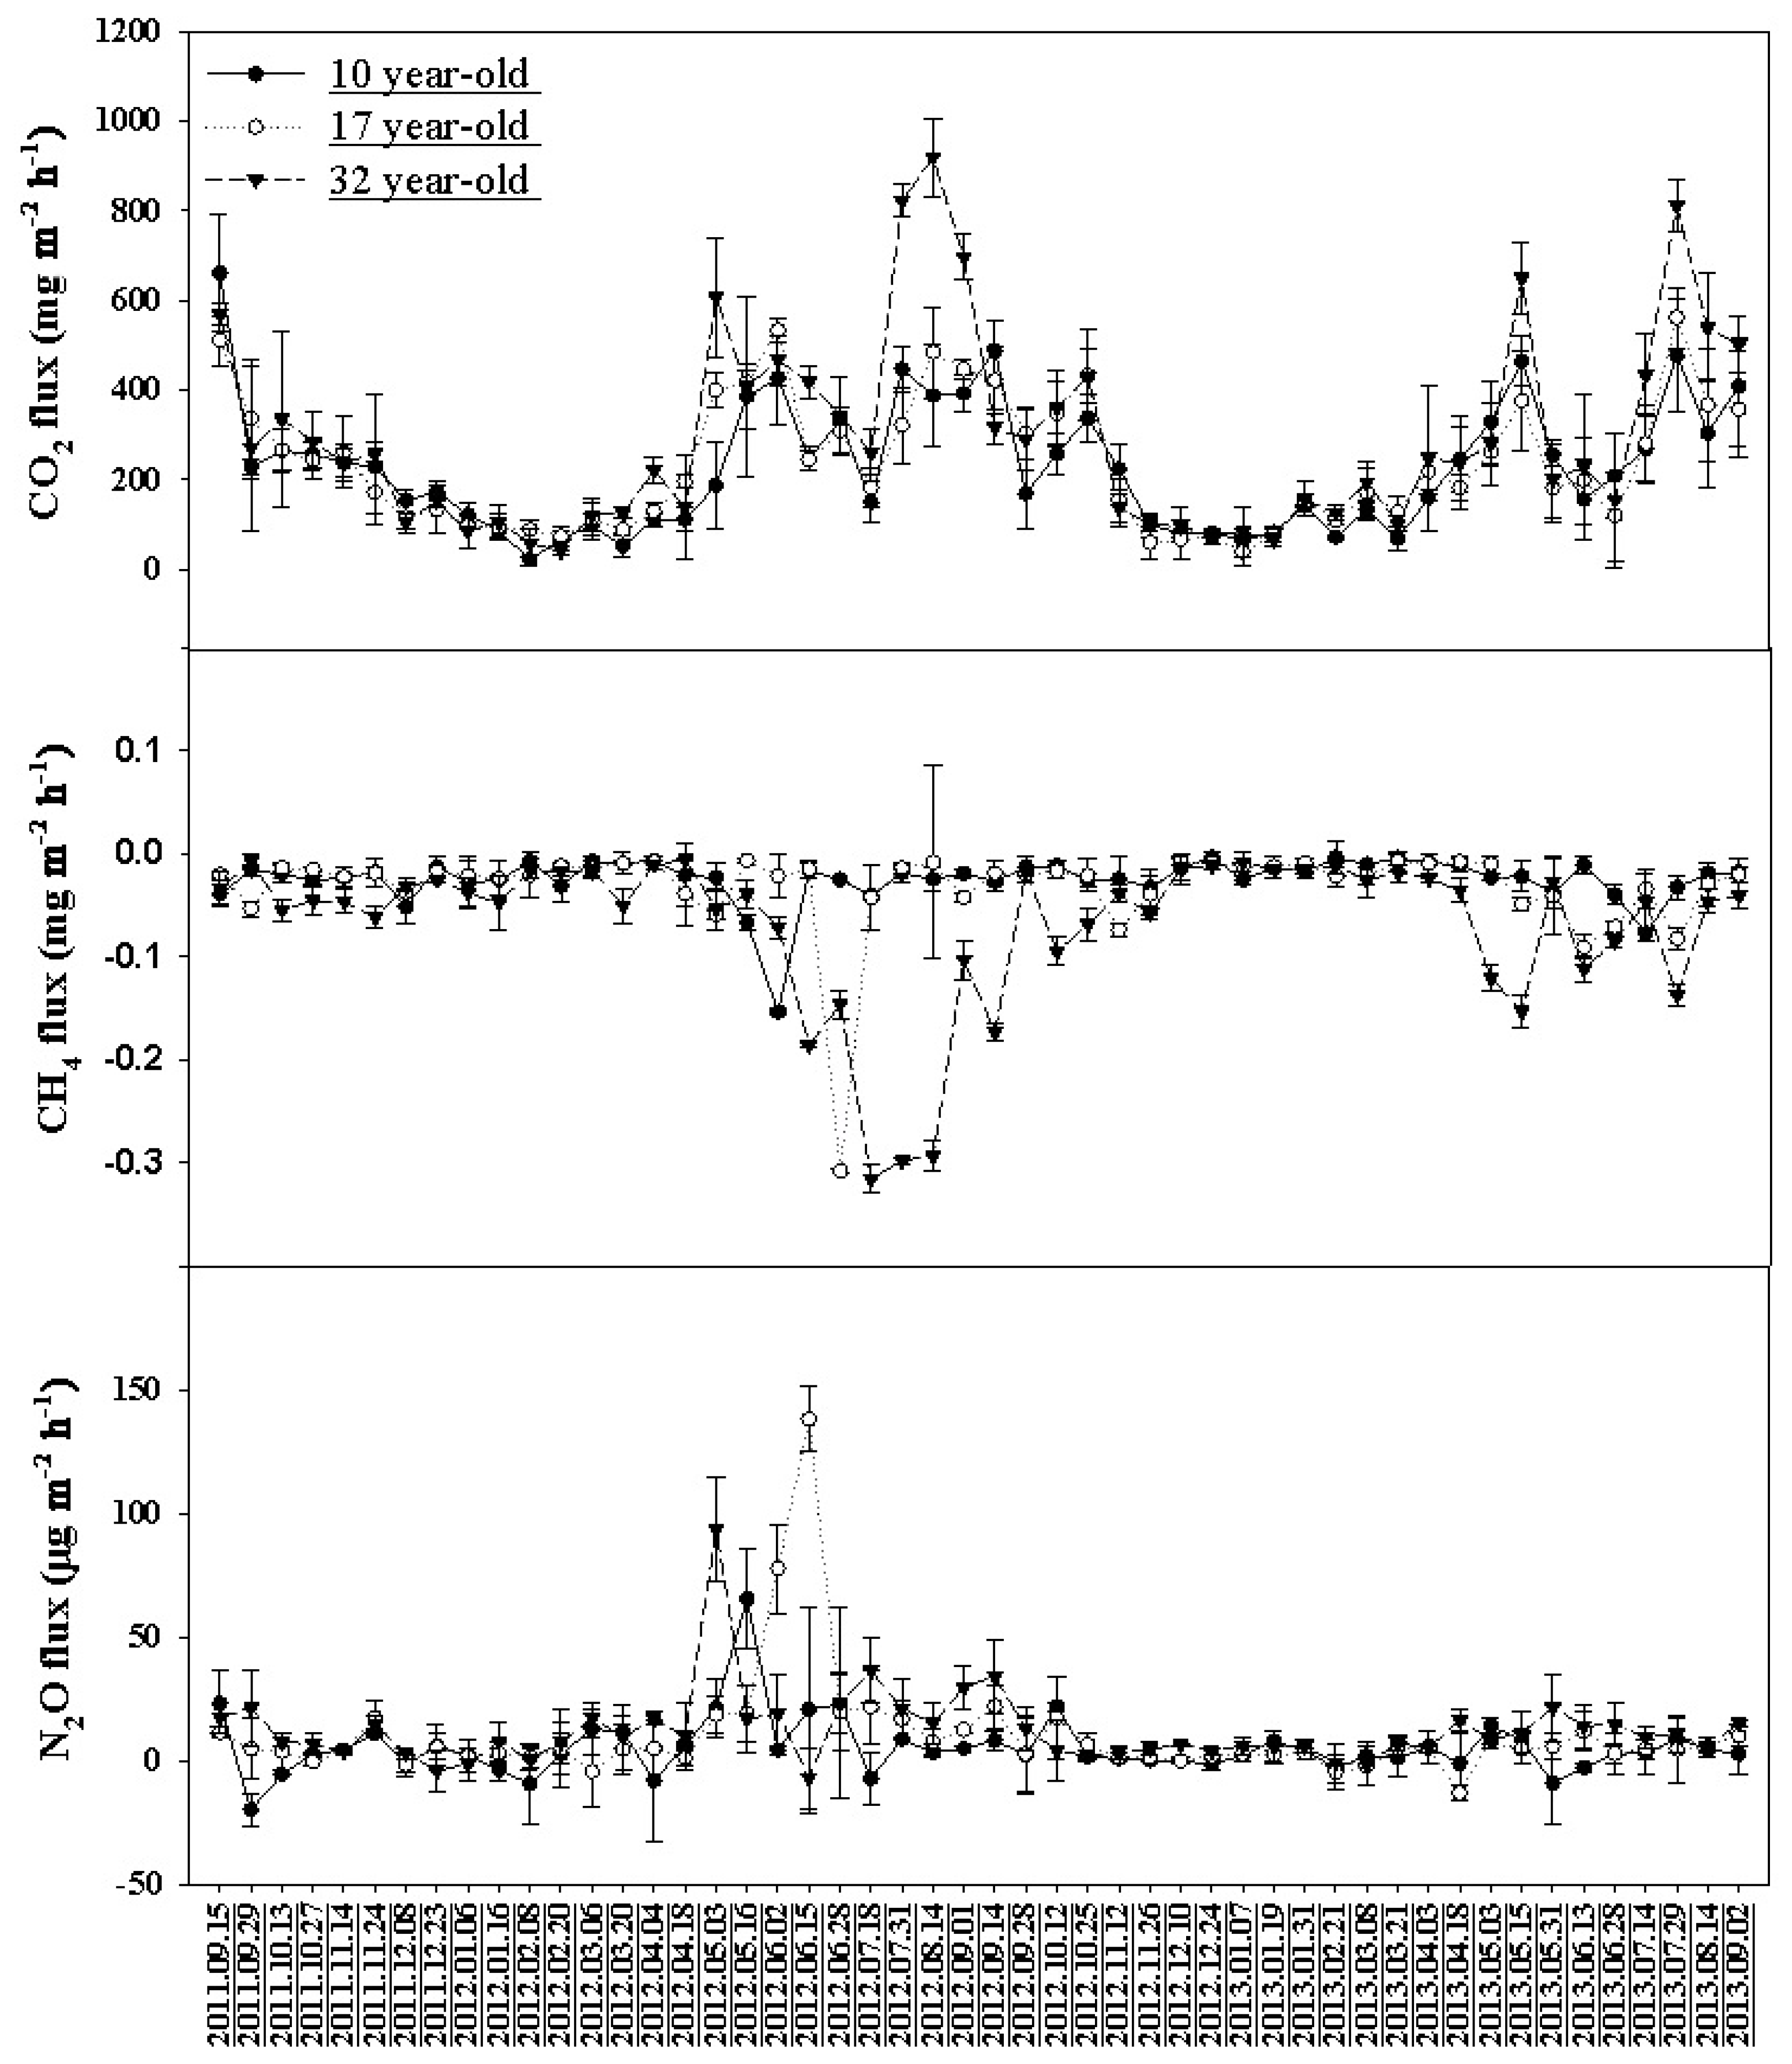
3.1. Soil Respiration Rate

During the experimental period of 2011 to 2013, the mean CO2 emission rate was 228.30 ± 142.40 mg m−2 h−1, 238.14 ± 142.20 mg m−2 h−1, and 297.71 ± 218.09 mg m−2 h−1 in the 10, 17, and 32-year-old stands, respectively (Table 2). Maximum soil CO2 emissions were observed in May and August in every year, and the smallest emissions in January and February (Figure 2). The mean soil CO2 emissions were 346.47 ± 164.23 mg m−2 h−1 and 117.09 ± 52.34 mg m−2 h−1 in the growing season and non-growing season, respectively (Figure 3).

3.2. Soil CH4 Uptake

The soil was a sink of CH4 in all three stands, with the highest uptake of CH4 occurring in the summer (Figure 2). During 2011–2013, the mean soil CH4 uptake rates were 0.026 mg m−2 h−1, 0.032 mg m−2 h−1, and 0.069 mg m−2 h−1 in the 10, 17, and 32-year-old stands, respectively (Table 2). The CH4 uptake rates were significantly higher in the older stand compared to the younger stands (p < 0.05). The highest CH4 uptakes were measured in the growing season (Figure 3).

3.3. Soil N2O Emission

There were large differences in N2O emissions among the three stands, ranging from −19.78 μg m−2 h−1 to 65.39 μg m−2 h−1, −13.02 μg m−2 h−1 to 138.00 μg m−2 h−1, and −6.98 μg m−2 h−1 to 93.45 μg m−2 h−1 in the 10, 17, and 32-year-old stands, respectively (Figure 2). The mean N2O emissions were 5.29, 10.09, and 12.25 μg m−2 h−1, respectively (Table 2), thereby showing that the older stand had larger N2O emissions compared with the younger stands, but it was not significant (p = 0.113). The N2O emissions were higher during the growing season compared to the non-growing season (p < 0.05) (Figure 3).

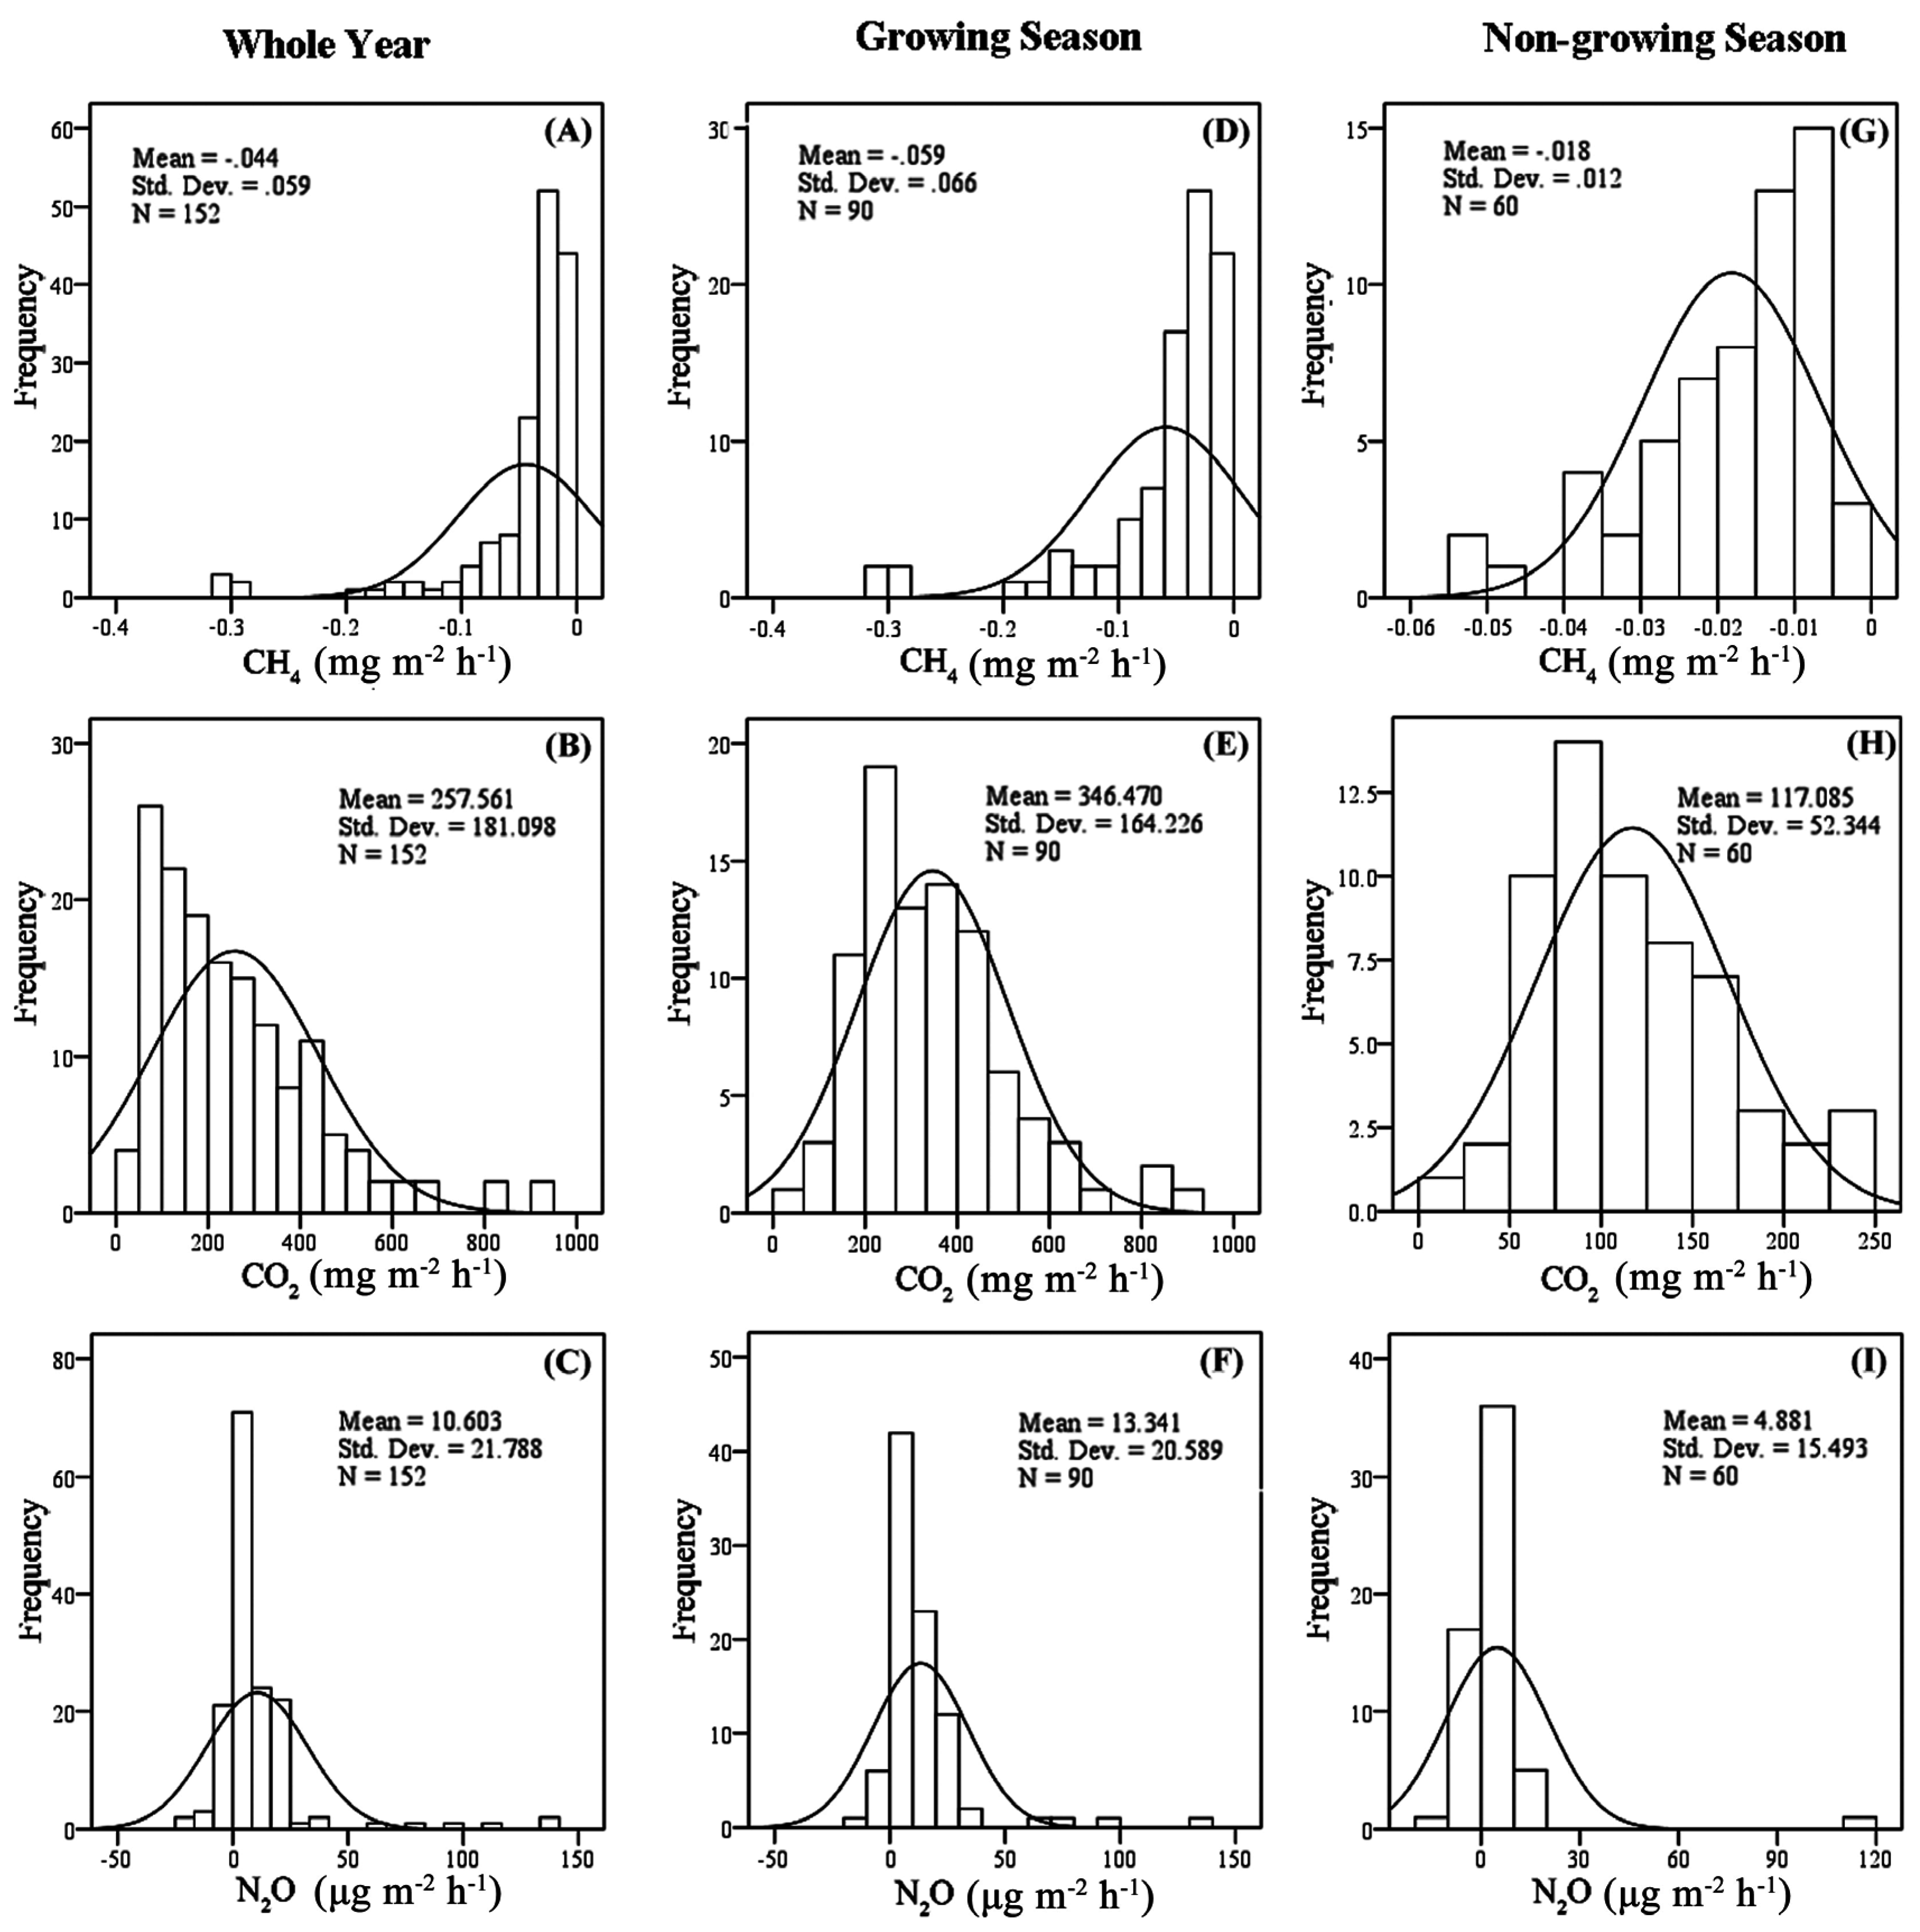
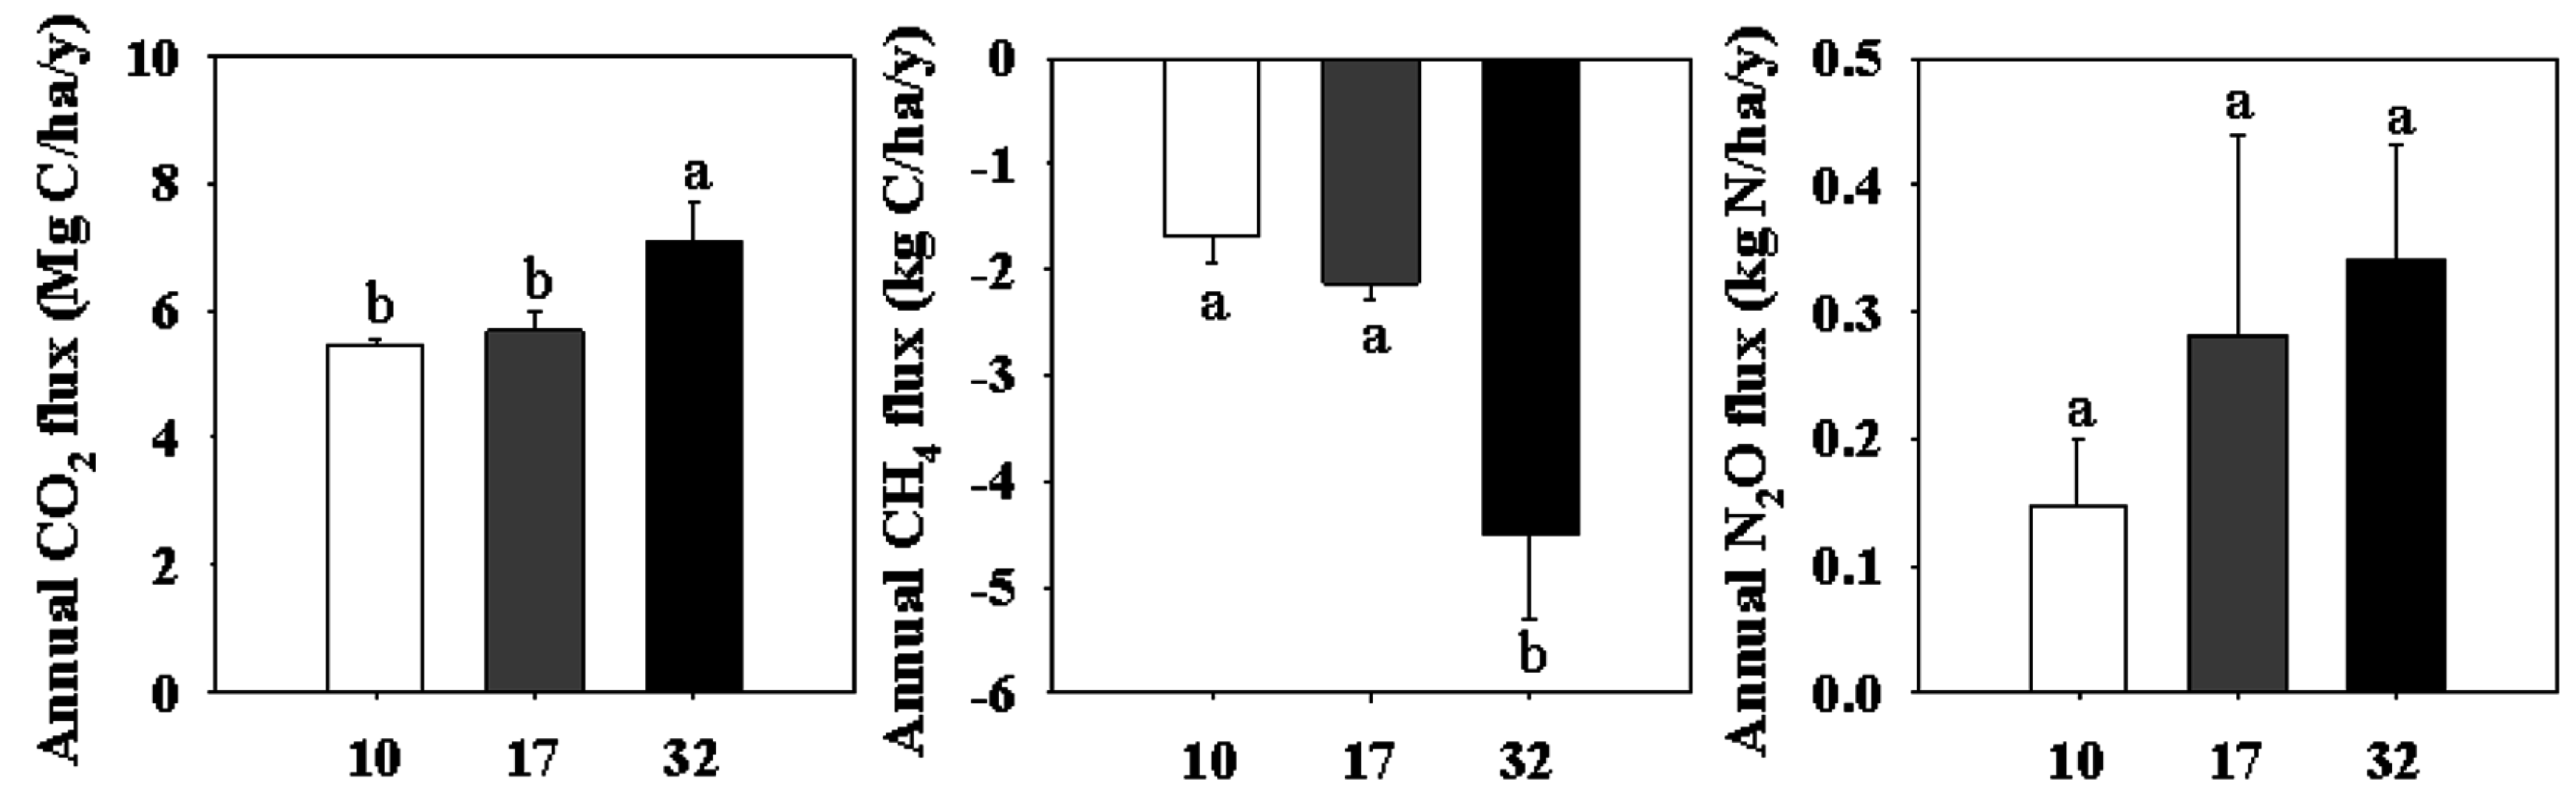
3.4. Annual GHG Emissions

The annual CO2 emissions were significantly higher in the 32-year-old stand compared to the other two younger stands (p < 0.05) (Figure 4). The emissions were 23.3% and 20.0% higher in the 32-year-old stand than those in the 10 and 17-year-old stands, respectively. Moreover, the annual soil CH4 uptake had significant differences among the three stands. The annual CH4 uptake was highest in the 32-year-old stand and lowest in the 10-year-old stand.
The highest annual soil N2O emission was observed in the 32-year-old stand and we noted that the 32-year-old stand had a 56.8% higher annual N2O emission than the 10-year-old stand and a 17.7% higher annual emission than the 17-year-old stand. However, the N2O emissions among the three stands were not significantly different.

3.5. The Effect of Soil Temperature on GHG Emissions

In this research, soil CO2 emissions increased exponentially with soil temperature both at 5 cm and at 10 cm soil depths (RS = 62.78e0.075T at 5 cm soil depth, and RS = 61.89e0.077T at 10 cm soil depth). The exponential model could explain 68% or 69% (p < 0.001) of the seasonal variation in soil CO2 emissions (Table 3). The Q10 values were calculated to be 2.12 and 2.15 at 5 cm and at 10 cm soil depths, respectively (Table 3). Usually, Q10-values were almost 3%–51% higher in the non-growing season than in the growing season.
CH4 uptakes and N2O emissions were significantly correlated with soil temperature at both 5 cm and 10 cm depths. There was a positive correlation between the CH4 uptake and soil temperature (Pearson correlation, −0.3). In addition, N2O and soil temperature had a positive correlation (Pearson Correlation, 0.3) (shown in Table 4).

3.6. Effects of Soil Water Content on GHG Emissions

Soil water content contributed substantially to the GHG emissions. The relationship between soil CO2 emissions and soil water content at both 0–10 cm and 10–20 cm depths was negative. However, no significant relationship was found between CH4 emission and soil water content, or N2O emission and soil water content. (Table 4).

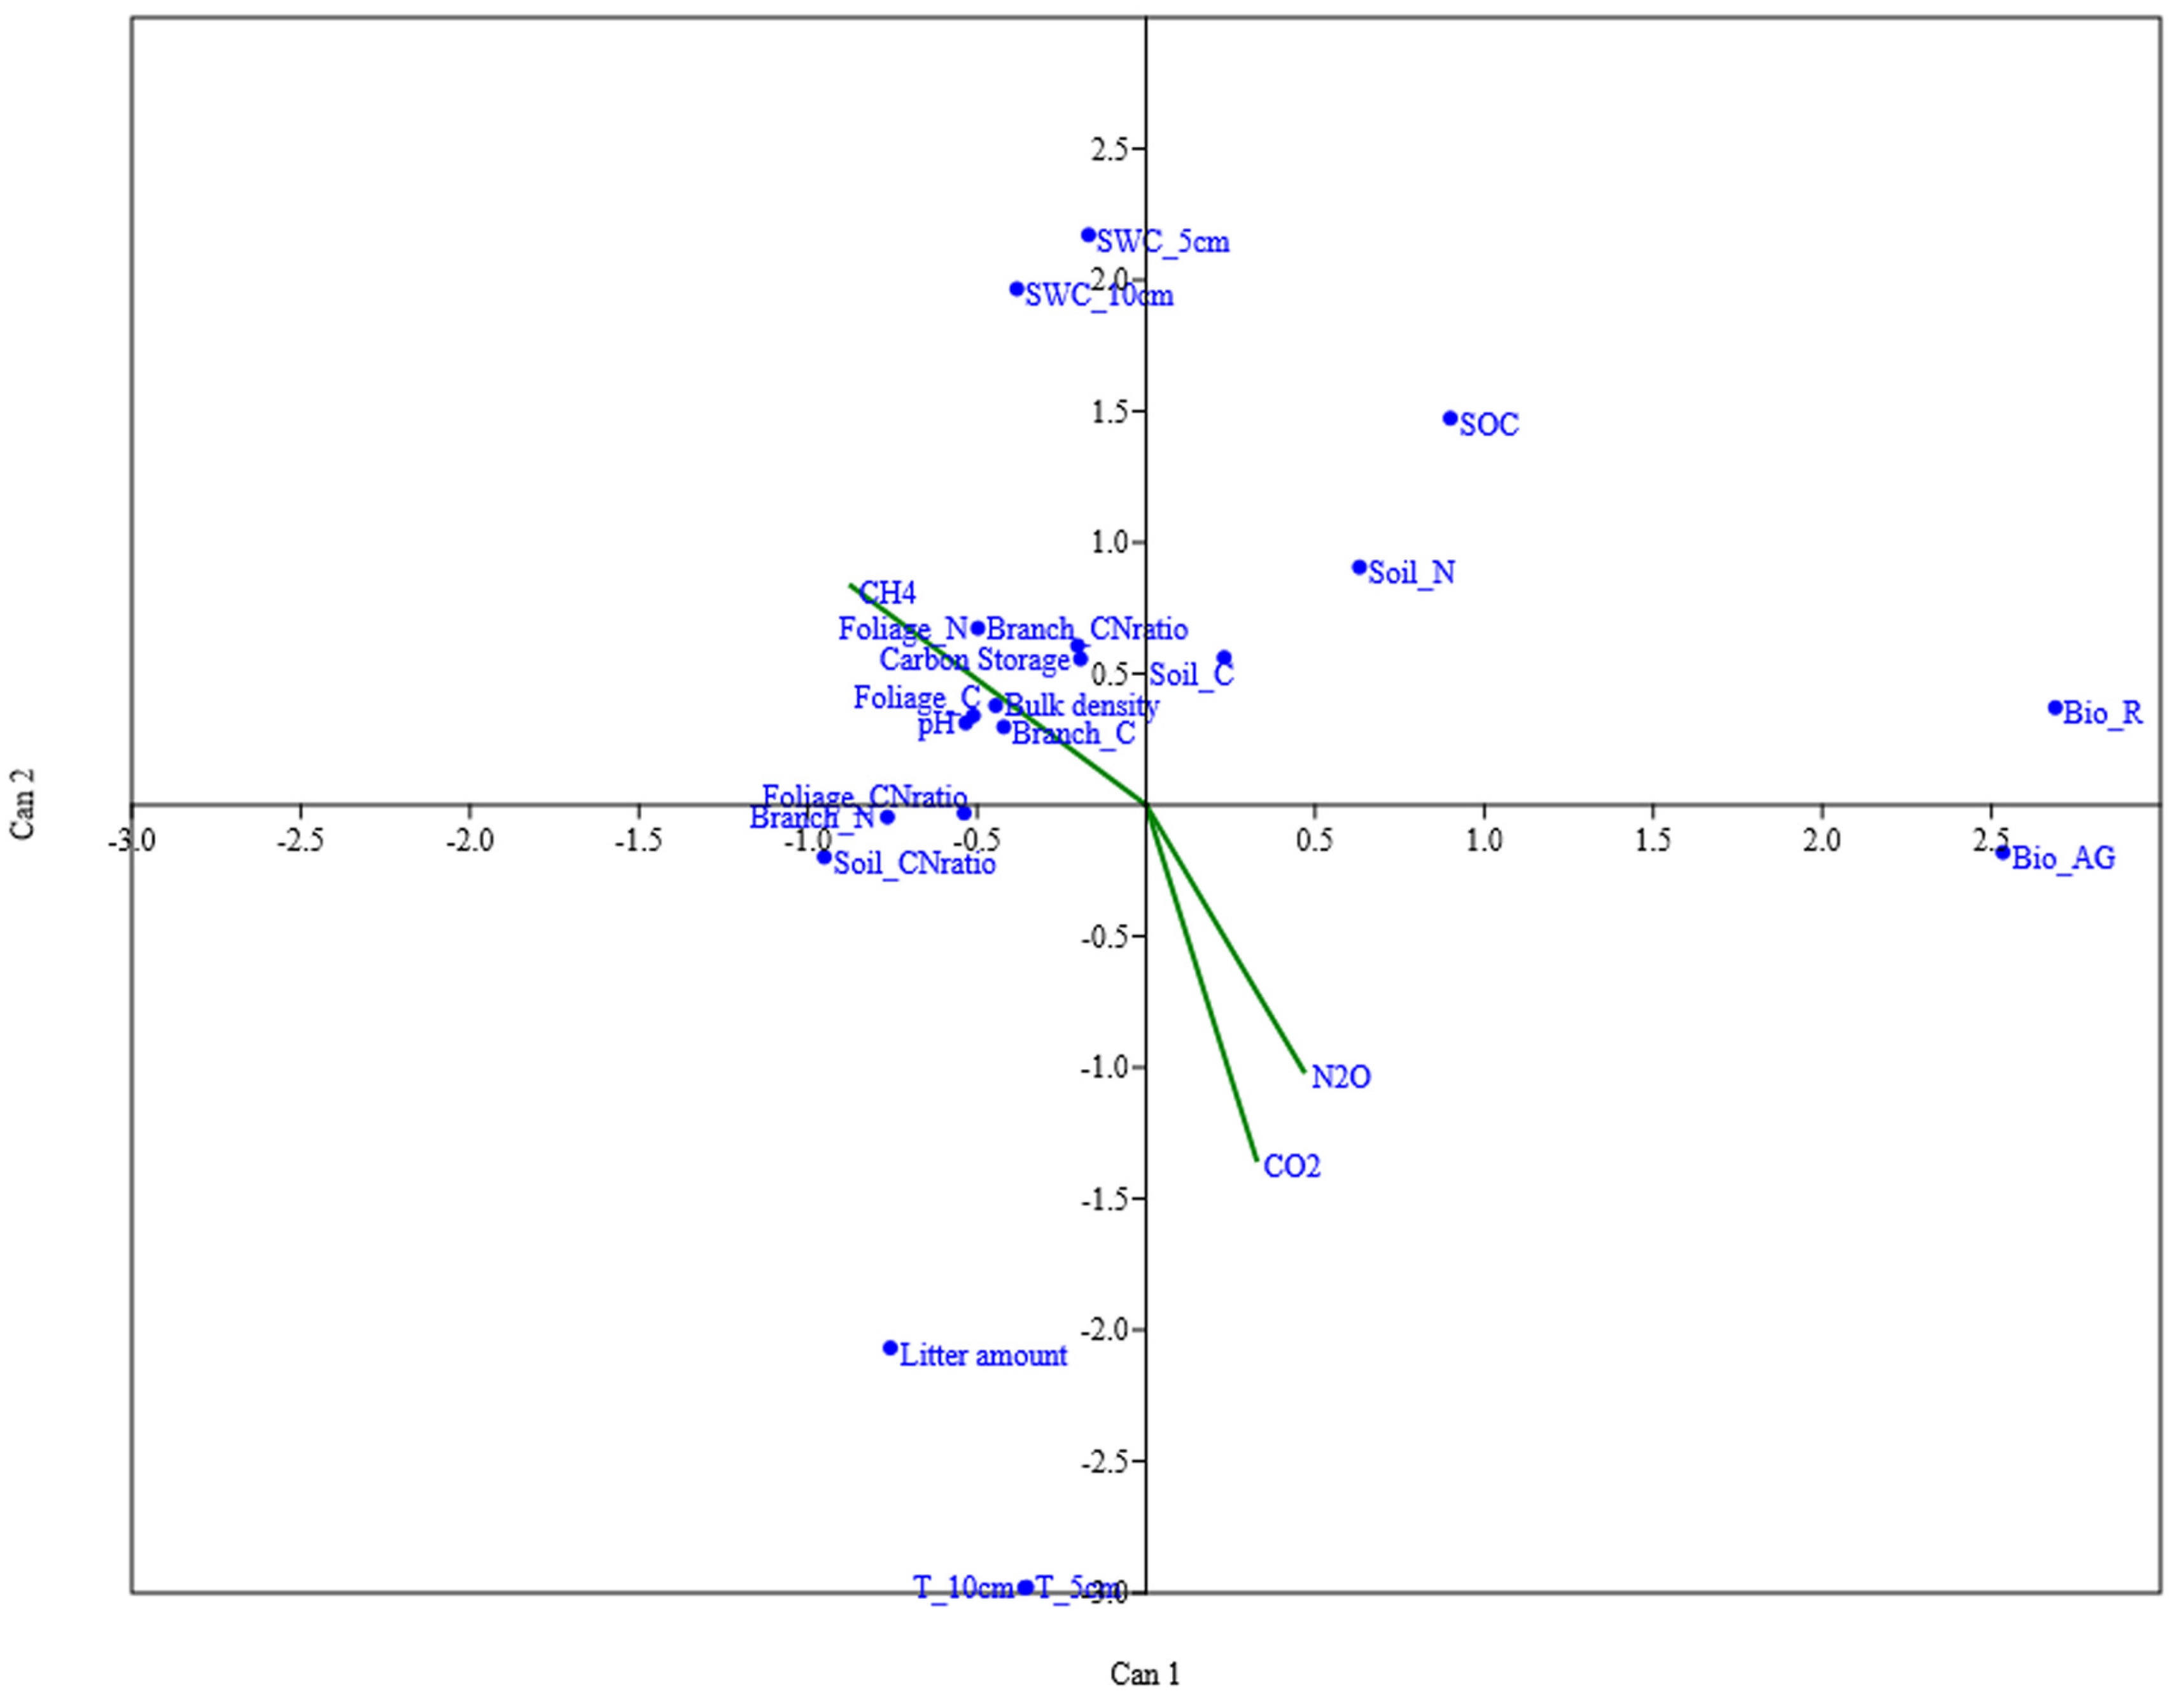
3.7. The Main Influencing Factors of Soil Greenhouse Gas Emissions

The variations in vegetation carbon, nitrogen, and soil properties were described by two significant canonical components (explaining 100% of the variance) (Figure 5). The first, Can 1, accounted for 98.65% of the total variance and was highly related to the trees’ biomass, and C and N content in soil and foliage. Can 2 accounted for 1.21% of the total variance with close correlation among soil water content and soil temperature. The CO2 and N2O emissions, and CH4 uptake all have positive correlations with Can 1 and negative correlations with Can 2.

4. Discussion

4.1. Soil Carbon Dynamic in Different-Age Stands

The soil was a source of CO2 and sink of CH4 in the three stands in both growing and non-growing seasons. The annual soil CO2 emissions (5.5–7.1 Mg C ha−1 year−1) were within the same range observed in other subtropical forests. For instance, annual soil CO2 emission was 3.1–7.3 Mg C ha−1 year−1 in the seasonal tropical primary forests in Xishuangbanna region, southwest China, and from 3.1–7.3 to 11.1–12.0 Mg C ha−1 year−1 in the subtropical forests [9,38]. In subtropical and tropical forests, annual soil CH4 uptake rates ranged from 0.8 kg C ha−1 year−1 to 4.3 kg C ha−1 year−1 [12,16,39]. Our study showed a similar uptake (1.7 kg C ha−1 year−1 to 4.5 kg C ha−1 year−1) in plantations located in northern subtropical areas, thereby suggesting that annual CH4 uptake does not significantly vary with subtropical or tropical biomes.
Soil CO2 significantly varied with soil temperature and water content in the three stands in both growing and non-growing seasons. A positive relationship existed between soil temperature and CO2 emission in these three stands, and a negative relationship was found between soil water content and CO2 emission. The effects of soil temperature and soil water content on CO2 emissions were statistically confounded. As such, we excluded the soil temperature effect through normalizing the soil respiration values with RS = 62.78e0.075T at 5 cm soil depth and RS = 61.89e0.077T at 10 cm soil depth, and found that the effect of soil water content on CO2 emissions was not significantly negative (with Pearson correlation from −0.18 to −0.19). Respiration rates generally decreased with decreasing water content. Soil temperature was probably the key factor regulating soil respiration. However, soil water content also restricted soil respiration [40]. Both soil CO2 emission and CH4 uptake peaked in the period of May–November because of the wet-hot climate. The laboratory and field studies have verified that soil temperature and soil water content could account for most of the seasonal variation in soil CO2 emission and CH4 uptake [40,41,42].
Soil temperature and water content explained 76%–87% of soil CO2 emission and 67%–75% of total annual emission in the wet season (April to September) of lower subtropical forests [6]. Q10, an exponential relationship, has been commonly used to estimate soil respiration rates from soil temperature [36]. In previous literature, the mean Q10 values were 2.14 for tropical regions and 2.26 for temperate regions [43]. In our study, Q10 ranged from 1.9 to 2.4 during the whole year, and soil respiration in the non-growing season was more sensitive to soil temperature. The higher Q10 in the non-growing season could be associated with the phonological cycle of photosynthesis as compared to the growing season, which has consequences on the belowground carbon allocation. In the summer, about 50% or more of the soil CO2 emissions could be originated from recently assimilated C, which trees allocate to the belowground system (root and rhizosphere) [44]. The values of Q10 increased with soil depth, and this result was the same as that obtained by Pavelka [45]. The seasonal variation in soil temperature was lower in the deeper layers and soil respiration rate was relatively more sensitive to temperature fluctuations [46]. During the growing and non-growing seasons the different values of Q10 were noted with different R2 values, and the lower R2 values were calculated in the growing season. During the growing season, soil temperature causes little changes in soil CO2 emissions. The primary reason might be the low temperature amplitude during the growing season. Second, the other factors (except soil temperature) could explain the soil CO2 emission such as the changes in photosynthesis and precipitation.
The soil temperature positively affected CH4 uptake, and no significant relationship existed between CH4 uptake and soil water content. Kiese and Werner observed that CH4 uptake was negatively correlated with soil temperature and soil water content [38,39]. In mid-subtropical China, the highest CH4 uptake (17.12 g C ha−1 day−1) occurred in the summer-autumn season with increasing soil temperature and water content, but the relationships between CH4 uptake and soil temperature and CH4 uptake and soil water content were not significant [47]. In earlier studies, CH4 uptake had decreased with increasing soil water content during the summer season [48,49]. Maximum CH4 uptake rate was clearly associated with the lowest soil moisture and the highest soil temperature both in temperate and tropical forests [50]. Before oxidization by methanotrophs, the soil CH4 was emitted from anaerobic environments to the atmosphere. In the forest’s soil, a certain amount of CH4 from the atmosphere was consumed by methanotrophs [51]. The optimum conditions for growth of methanotrophic bacteria and induction of methane oxidation activity were 20%–35% water contents and 25 °C–35 °C temperatures [52]. In our study, the water content ranged from 11% to 33%, which was almost in the optimum range, and temperatures showed a larger range from 1.4 °C to 30 °C. Soil temperature could be more important than water content in regulating CH4 consumption in this study, which is in agreement with the results of previous reports [53].

4.2. Soil Nitrogen Dynamic in Different-Aged Stands

We observed highly dynamic N2O emissions with low values in our study (i.e., 0.81–1.87 g N ha−1 day−1), which were lower than some previously reported emissions. For example, our results are similar to the N2O emissions from undrained forests in southern Sweden (i.e., 1.62 g N ha−1 day−1) [54], but they are substantially lower than the 8.77 g N ha−1 day−1 previously recorded in the subtropical forest in southern China [12].
A seasonal variation in N2O emissions has been reported in tropical and subtropical forests. For instance, the highest N2O emissions have been observed during the spring and summer months with mean values of 2–5 g N ha−1 day−1. The lowest emissions were obtained during winter seasons, with less than 0.5 g N ha−1 day−1 [9]. The higher N2O emissions were emitted from temperate and tropical forest ecosystems during the wet and hot season [50]. The magnitude of N2O emissions was very closely linked to rainfall events [55]. The soil N2O was produced by microbes through nitrification in aerobic conditions and through denitrification under anaerobic conditions [56]. Factor, such as precipitation, was observed to exert some influence on the soil aeration, but soil aeration could affect N2O production. In our study, the highest soil N2O emissions were observed between May and November when higher rainfall occurred with a mean value of 2.04 g N ha−1 day−1. The lowest soil N2O emissions were recorded between December and April with a mean value of 0.75 g N ha−1 day−1.
N2O emissions showed a positive correlation with soil temperature; no significant correlation with soil water content was observed, which was similar to a previous study in Japan [57]. However, some previous reports have shown that N2O emissions have a positive correlation with soil temperature and soil water content [42].

4.3. Factors Affecting Soil Greenhouse Gas Emissions

The present study showed that soil GHG emissions differed among the three stands. The 32-year-old stand had significantly higher CO2 emissions, CH4 uptake, and N2O emissions than the 10 and 17-year-old stands. Basically, these three stands differed in biomass/litter carbon storage, nitrogen content, and soil properties. The soil CO2, N2O, and CH4 were produced by microbial activity, and these processes were controlled by environmental factors [58,59].
Forest soil CO2 emissions were the sum of heterotrophic (microbes) and autotrophic respiration (roots), and the contribution of root respiration rates which were higher during the growing season [60]. The soil CO2 emissions were a good indicator of total below-ground allocation of carbon and of ecosystem productivity. Among these stands, the older stands maintained higher productivity than the younger stands; it was not surprising that the older stand had the highest rates of soil respiration. Older stands released higher CO2, and the major difference was that the older stand had higher soil carbon, which could probably reflect higher root and litter carbon storage [61]. The research in Loess Plateau of China [62] indicated that 48% of the variations in annual soil CO2 emissions were explained by the combined carbon stock in top soil and litter, 77% by the root carbon stock, and 63% by the combined carbon stock in roots, litter, and top soil. The aboveground litter mineralization and decomposition contributed to about 8% of the soil respiration in a subtropical Montane cloud forest in Taiwan [63]. In our study, the total carbon storage of litter, soil, and roots in the older stands was higher than the two younger stands, which indicated higher annual CO2 emissions in the older stands. Based on the principal component analyses, the litter composition was an important stimulator for soil CO2 emissions because of the simultaneous effects on production and consumption of the soil surface organic matter [64].
Methane emissions of soils were correlated with microbial activities, and the upper soil layer were generally CH4 sinks [65]. The rate of CH4 uptake was regulated by the soil C and N levels as well as soil water content, and there was a close link between labile C, N, and CH4 uptake in forest soils [66,67]. This research has shown that carbon and nitrogen contents of litter, soil, and root in older stands were higher than in younger stands, which indicates higher annual CH4 uptake in older stands.
In contrast to the pattern of soil CO2 and CH4 emissions, no distinctly different trend in N2O emission was observed among differently aged stands. According to the reported study, soil N2O production and consumption were mainly influenced by the amount of mineral N in soils, and low N availability was linked with N2O emissions [2]. Highly dynamic emissions of N2O were found among different forest soil types [68]. The primary controlling factors of N2O production were found to be soil pH and C/N ratio, and these soil properties could explain most of the variability of N2O emissions [9,69]. However, we used three stands in our study but the results indicating similar annual N2O emissions despite the different soil properties.

5. Conclusions

Soil respiration in each of the stands was strongly and positively related to soil temperature, and negatively related to soil water content. The soil CH4 uptake was positively related to soil temperature, and soil N2O emission had a positive relation with soil temperature. Affected by the annual climatic conditions (e.g., temperature and precipitation), soil respiration showed a clear seasonal variation, with high emissions in the wet-hot season (from May to November) and low emissions in the dry-cool season (from December to April).
Different stages of forest stands strongly affected soil respiration and CH4 emission rates through root respiration and/or microbial activities, but had no significant relationship with soil N2O emission. Carbon storage, nitrogen, and C/N ratio (soil, litter, and root) were the main factors affecting CH4 uptake and N2O emission. Soil properties such as soil water content and soil pH were important indicators for soil respiration.

Acknowledgments

We thank Umair Muhammad for his language assistance. This research was co-funded by the National Natural Science Foundation of China (31400605), National Key Technology R&D Program of China (2013BAD11B01), the National Natural Science Foundation of China (71333010), SJTU Agri-X Program (2014007), Shanghai Landscaping Administration Bureau (G141207), CFERN & GENE Award Funds on Ecological Paper, and the Strategic Priority Research Program of the Chinese Academy of Sciences (XDA05050200).

Author Contributions

S.Y., G.S., and C.L. conceived and designed the experiments; S.Y., X.Z., and F.X. performed the experiments; X.Z. analyzed the data; S.Y., X.Z., and J.P. wrote this manuscript.

Conflicts of Interest

The authors declare no conflict of interest.

References

  1. Lal, R. Forest soils and carbon sequestration. For. Ecol. Manag. 2005, 220, 242–258. [Google Scholar] [CrossRef]
  2. Chapuis-Lardy, L.; Wrage, N.; Metay, A.; Chotte, J.; Bernoux, M. Soils, a sink for N2O? A review. Glob. Chang. Biol. 2007, 13, 1–17. [Google Scholar] [CrossRef]
  3. Carle, J.; Vuorinen, P.; Del Lungo, A. Status and trends in global forest plantation development. For. Prod. J. 2002, 52, 12–23. [Google Scholar]
  4. Dai, L.; Wang, Y.; Su, D.; Zhou, L.; Yu, D.; Lewis, B.J.; Qi, L. Major forest types and the evolution of sustainable forestry in China. Environ. Manag. 2011, 48, 1066–1078. [Google Scholar] [CrossRef] [PubMed]
  5. Central Committee of the Communist Party of China and China State Council. The Programming Outline for the Protection and Utilization of National Forestland (2010–2020); Central Committee of the Communist Party of China and China State Council: Beijing, China, 2010.
  6. Zhang, D.; Sun, X.; Zhou, G.; Yan, J.; Wang, Y.; Liu, S.; Zhou, C.; Liu, J.; Tang, X.; Li, J. Seasonal dynamics of soil CO2 effluxes with responses to environmental factors in lower subtropical forests of China. Sci. China Ser. D Earth Sci. 2006, 49, 139–149. [Google Scholar] [CrossRef]
  7. Yang, Y.; Chen, G.; Guo, J.; Xie, J.; Wang, X. Soil respiration and carbon balance in a subtropical native forest and two managed plantations. Plant Ecol. 2007, 193, 71–84. [Google Scholar] [CrossRef]
  8. Iqbal, J.; Ronggui, H.; Lijun, D.; Lan, L.; Shan, L.; Tao, C.; Leilei, R. Differences in soil CO2 flux between different land use types in mid-subtropical China. Soil Biol. Biochem. 2008, 40, 2324–2333. [Google Scholar] [CrossRef]
  9. Rowlings, D.; Grace, P.; Kiese, R.; Weier, K. Environmental factors controlling temporal and spatial variability in the soil-atmosphere exchange of CO2, CH4 and N2O from an Australian subtropical rainforest. Glob. Chang. Biol. 2012, 18, 726–738. [Google Scholar] [CrossRef]
  10. Hashimoto, S.; Tanaka, N.; Suzuki, M.; Inoue, A.; Takizawa, H.; Kosaka, I.; Tanaka, K.; Tantasirin, C.; Tangtham, N. Soil respiration and soil CO2 concentration in a tropical forest, Thailand. J. For. Res. 2004, 9, 75–79. [Google Scholar] [CrossRef]
  11. Davidson, E.; Ishida, F.; Nepstad, D. Effects of an experimental drought on soil emissions of carbon dioxide, methane, nitrous oxide, and nitric oxide in a moist tropical forest. Glob. Chang. Biol. 2004, 10, 718–730. [Google Scholar] [CrossRef]
  12. Tang, X.; Liu, S.; Zhou, G.; Zhang, D.; Zhou, C. Soil-atmospheric exchange of CO2, CH4, and N2O in three subtropical forest ecosystems in southern China. Glob. Chang. Biol. 2006, 12, 546–560. [Google Scholar] [CrossRef]
  13. Yan, J.; Zhang, W.; Wang, K.; Qin, F.; Wang, W.; Dai, H.; Li, P. Responses of CO2, N2O and CH4 fluxes between atmosphere and forest soil to changes in multiple environmental conditions. Glob. Chang. Biol. 2014, 20, 300–312. [Google Scholar] [CrossRef] [PubMed]
  14. Dutaur, L.; Verchot, L.V. A global inventory of the soil CH4 sink. Glob. Biogeochem. Cycles 2007, 21, 7949–7950. [Google Scholar] [CrossRef]
  15. Megonigal, J.P.; Guenther, A.B. Methane emissions from upland forest soils and vegetation. Tree Physiol. 2008, 28, 491–498. [Google Scholar] [CrossRef] [PubMed]
  16. Wolf, K.; Flessa, H.; Veldkamp, E. Atmospheric methane uptake by tropical montane forest soils and the contribution of organic layers. Biogeochemistry 2012, 111, 469–483. [Google Scholar] [CrossRef]
  17. Smith, K.; Ball, T.; Conen, F.; Dobbie, K.; Massheder, J.; Rey, A. Exchange of greenhouse gases between soil and atmosphere: Interactions of soil physical factors and biological processes. Eur. J. Soil Sci. 2003, 54, 779–791. [Google Scholar] [CrossRef]
  18. Yan, Y.; Sha, L.; Cao, M.; Zheng, Z.; Tang, J.; Wang, Y.; Zhang, Y.; Wang, R.; Liu, G.; Wang, Y. Fluxes of ch4 and n2o from soil under a tropical seasonal rain forest in xishuangbanna, Southwest China. J. Environ. Sci. 2008, 20, 207–215. [Google Scholar] [CrossRef]
  19. Moore, K.; Fitzjarrald, D.; Sakai, R.; Goulden, M.; Munger, J.; Wofsy, S. Seasonal variation in radiative and turbulent exchange at a deciduous forest in central massachusetts. J. Appl. Meteorol. 1996, 35, 122–134. [Google Scholar] [CrossRef]
  20. Livesley, S.; Grover, S.; Hutley, L.; Jamali, H.; Butterbach-Bahl, K.; Fest, B.; Beringer, J.; Arndt, S. Seasonal variation and fire effects on CH4, N2O and CO2 exchange in savanna soils of northern Australia. Agric. For. Meteorol. 2011, 151, 1440–1452. [Google Scholar] [CrossRef]
  21. LePage, B.; Williams, C.; Yang, H. The Geobiology and Ecology of Metasequoia; Springer: Dordrecht, The Netherlands, 2005; Volume 22. [Google Scholar]
  22. Chu, K.; Cooper, W. An ecological reconnaissance in the native home of Metasequoia glyptostroboides. Ecology 1950, 31, 260–278. [Google Scholar] [CrossRef]
  23. Bajpai, V.; Rahman, A.; Kang, S. Chemical composition and anti-fungal properties of the essential oil and crude extracts of Metasequoia glyptostroboides miki ex hu. Ind. Crops Prod. 2007, 26, 28–35. [Google Scholar] [CrossRef]
  24. Polman, J.; Michon, S.; Militz, H.; Helmink, A. The wood of Metasequoia glyptostroboides (hu et cheng) of dutch origin. Holz als Roh-und Werkstoff 1999, 57, 215–221. [Google Scholar] [CrossRef]
  25. Bureau C.S.S. Chapter 1 Comprehensive. In Chongming Statistical Yearbook; Shanghai Statistics press: Chongming, Shanghai, China, 2016. [Google Scholar]
  26. SMC. Shanghai Meteorological data. Available online: http://www.smb.gov.cn/ (accessed on 27 Feberury 2014).
  27. Xiaver, B. Allometric Estimation of the Aboveground Biomass and Carbon in Metasequoia Glyptostroboide Plantations in Shanghai; Cranfield University: Bedfordshire, UK, 2009. [Google Scholar]
  28. Pedrotti, A.; Pauletto, E.; Crestana, S.; Holanda, F.; Cruvinel, P.; Vaz, C. Evaluation of bulk density of albaqualf soil under different tillage systems using the volumetric ring and computerized tomography methods. Soil Tillage Res. 2005, 80, 115–123. [Google Scholar] [CrossRef]
  29. Schofield, R.; Taylor, A. The measurement of soil pH. Soil Sci. Soc. Am. J. 1955, 19, 164–167. [Google Scholar] [CrossRef]
  30. Xiao, C. Characteristics and Carbon-Storage Estimation of Metasequoia glyptostroboides Plantation Ecosystems at Different Age Stages in Chongming Island. Master’ Dissertation, Shanghai Jiao Tong University, Shanghai, China, 2010. [Google Scholar]
  31. Wang, Y.; Wang, Y.; Ling, H. A new carrier gas type for accurate measurement of N2O by GC-ECD. Adv. Atmos. Sci. 2010, 27, 1322–1330. [Google Scholar] [CrossRef]
  32. Zheng, X.; Mei, B.; Wang, Y.; Xie, B.; Wang, Y.; Dong, H.; Xu, H.; Chen, G.; Cai, Z.; Yue, J. Quantification of n2o fluxes from soil–plant systems may be biased by the applied gas chromatograph methodology. Plant Soil 2008, 311, 211–234. [Google Scholar] [CrossRef]
  33. Yao, Z.; Wolf, B.; Chen, W.; Butterbach-Bahl, K.; Brüggemann, N.; Wiesmeier, M.; Dannenmann, M.; Blank, B.; Zheng, X. Spatial variability of N2O, CH4 and CO2 fluxes within the xilin river catchment of inner mongolia, China: A soil core study. Plant Soil 2010, 331, 341–359. [Google Scholar] [CrossRef]
  34. Hoff, J. Lectures on Theoretical and Physical Chemistry; Edward Arnold: London, UK, 1899. [Google Scholar]
  35. Davidson, E.; Janssens, I. Temperature sensitivity of soil carbon decomposition and feedbacks to climate change. Nature 2006, 440, 165–173. [Google Scholar] [CrossRef] [PubMed]
  36. Janssens, I.; Carrara, A.; Ceulemans, R. Annual Q10 of soil respiration reflects plant phenological patterns as well as temperature sensitivity. Glob. Chang. Biol. 2004, 10, 161–169. [Google Scholar]
  37. Zimmermann, M.; Bird, M.; Zechmeister-Boltenstern, S. Q10 values of tropical forest soil respiration increases with ongoing decomposition. In Proceedings of the EGU General Assembly, Vienna, Austria, 22–27 April 2012; p. 4347.
  38. Werner, C.; Zheng, X.; Tang, J.; Xie, B.; Liu, C.; Kiese, R.; Butterbach-Bahl, K. N2O, CH4 and CO2 emissions from seasonal tropical rainforests and a rubber plantation in Southwest China. Plant Soil 2006, 289, 335–353. [Google Scholar] [CrossRef]
  39. Kiese, R.; Hewett, B.; Graham, A.; Butterbach-Bahl, K. Seasonal variability of N2O emissions and CH4 uptake by tropical rainforest soils of Queensland, Australia. Glob. Biogeochem. Cycles 2003, 17, 469–474. [Google Scholar] [CrossRef]
  40. Davidson, E.; Belk, E.; Boone, R. Soil water content and temperature as independent or confounded factors controlling soil respiration in a temperate mixed hardwood forest. Glob. Chang. Biol. 1998, 4, 217–227. [Google Scholar] [CrossRef]
  41. Bowden, R.; Newkirk, K.; Rullo, G. Carbon dioxide and methane fluxes by a forest soil under laboratory-controlled moisture and temperature conditions. Soil Biol. Biochem. 1998, 30, 1591–1597. [Google Scholar] [CrossRef]
  42. Schaufler, G.; Kitzler, B.; Schindlbacher, A.; Skiba, U.; Sutton, M.; Zechmeister-Boltenstern, S. Greenhouse gas emissions from european soils under different land use: Effects of soil moisture and temperature. Eur. J. Soil Sci. 2010, 61, 683–696. [Google Scholar] [CrossRef]
  43. Tjoelker, M.; Oleksyn, J.; Reich, P. Modelling respiration of vegetation: Evidence for a general temperature-dependent Q10. Glob. Chang. Biol. 2001, 7, 223–230. [Google Scholar] [CrossRef]
  44. Högberg, P.; Read, D. Towards a more plant physiological perspective on soil ecology. Trends Ecol. Evol. 2006, 21, 548–554. [Google Scholar] [CrossRef] [PubMed]
  45. Pavelka, M.; Acosta, M.; Marek, M.; Kutsch, W.; Janous, D. Dependence of the Q10 values on the depth of the soil temperature measuring point. Plant Soil 2007, 292, 171–179. [Google Scholar] [CrossRef]
  46. Lloyd, J.; Taylor, J. On the temperature dependence of soil respiration. Funct. Ecol. 1994, 8, 315–323. [Google Scholar] [CrossRef]
  47. Chen, C.; Yang, Z.; Xie, J.; Liu, X.; Zhong, X. Seasonal variations of soil CH4 uptake rate in castanopsis carlesii forest in mid-subtropical China. J. Appl. Ecol. 2012, 23, 17–22. [Google Scholar]
  48. Adamsen, A.; King, G. Methane consumption in temperate and subarctic forest soils: Rates, vertical zonation, and responses to water and nitrogen. Appl. Environ. Microbiol. 1993, 59, 485–490. [Google Scholar] [PubMed]
  49. Singh, J.; Singh, S.; Raghubanshi, A.; Singh, S.; Kashyap, A.; Reddy, V. Effect of soil nitrogen, carbon and moisture on methane uptake by dry tropical forest soils. Plant Soil 1997, 196, 115–121. [Google Scholar] [CrossRef]
  50. Luo, G.; Kiese, R.; Wolf, B.; Butterbach-Bahl, K. Effects of soil temperature and moisture on methane uptake and nitrous oxide emissions across three different ecosystem types. Biogeosciences 2013, 10, 3205–3219. [Google Scholar] [CrossRef]
  51. Yavitt, J.; Downey, D.; Lang, G.; Sexston, A. Methane consumption in two temperate forest soils. Biogeochemistry 1990, 9, 39–52. [Google Scholar] [CrossRef]
  52. Hanson, R.; Hanson, T.E. Methanotrophic bacteria. Microbiol. Rev. 1996, 60, 439–471. [Google Scholar] [PubMed]
  53. Whalen, S.; Reeburgh, W. Moisture and temperature sensitivity of CH4 oxidation in boreal soils. Soil Biol. Biochem. 1996, 28, 1271–1281. [Google Scholar] [CrossRef]
  54. Von Arnold, K.; Nilsson, M.; Hånell, B.; Weslien, P.; Klemedtsson, L. Fluxes of CO2, CH4 and N2O from drained organic soils in deciduous forests. Soil Biol. Biochem. 2005, 37, 1059–1071. [Google Scholar] [CrossRef]
  55. Breuer, L.; Papen, H.; Butterbach-Bahl, K. N2O emission from tropical forest soils of Australia. J. Geophys. Res. Atmos. 2000, 105, 26353–26367. [Google Scholar] [CrossRef]
  56. Pihlatie, M.; Syväsalo, E.; Simojoki, A.; Esala, M.; Regina, K. Contribution of nitrification and denitrification to N2O production in peat, clay and loamy sand soils under different soil moisture conditions. Nutr. Cycl. Agroecosyst. 2004, 70, 135–141. [Google Scholar] [CrossRef]
  57. Morishita, T.; Aizawa, S.; Yoshinaga, S.; Kaneko, S. Seasonal change in N2O flux from forest soils in a forest catchment in japan. J. For. Res. 2011, 16, 386–393. [Google Scholar] [CrossRef]
  58. Gundersen, P.; Christiansen, J.; Alberti, G.; Brüggemann, N.; Castaldi, S.; Gasche, R.; Kitzler, B.; Klemedtsson, L.; Lobo-do-Vale, R.; Moldan, F. The response of methane and nitrous oxide fluxes to forest change in Europe. Biogeosciences 2012, 9, 3999–4012. [Google Scholar] [CrossRef]
  59. Wang, H.; Liu, S.; Wang, J.; Shi, Z.; Lu, L.; Zeng, J.; Ming, A.; Tang, J.; Yu, H. Effects of tree species mixture on soil organic carbon stocks and greenhouse gas fluxes in subtropical plantations in China. For. Ecol. Manag. 2013, 300, 4–13. [Google Scholar] [CrossRef]
  60. Hanson, P.; Edwards, N.; Garten, C.; Andrews, J. Separating root and soil microbial contributions to soil respiration: A review of methods and observations. Biogeochemistry 2000, 48, 115–146. [Google Scholar] [CrossRef]
  61. Schlesinger, W.H.; Lichter, J. Limited carbon storage in soil and litter of experimental forest plots under increased atmospheric CO2. Nature 2001, 411, 466–469. [Google Scholar] [CrossRef] [PubMed]
  62. Zhou, Z.; Zhang, Z.; Zha, T.; Luo, Z.; Zheng, J.; Sun, O. Predicting soil respiration using carbon stock in roots, litter and soil organic matter in forests of Loess Plateau in China. Soil Biol. Biochem. 2013, 57, 135–143. [Google Scholar] [CrossRef]
  63. Chang, S.; Tseng, K.; Hsia, Y.; Wang, C.; Wu, J. Soil respiration in a subtropical montane cloud forest in taiwan. Agric. For. Meteorol. 2008, 148, 788–798. [Google Scholar] [CrossRef]
  64. Raich, J.; Tufekciogul, A. Vegetation and soil respiration: Correlations and controls. Biogeochemistry 2000, 48, 71–90. [Google Scholar] [CrossRef]
  65. Le Mer, J.; Roger, P. Production, oxidation, emission and consumption of methane by soils: A review. Eur. J. Soil Biol. 2001, 37, 25–50. [Google Scholar] [CrossRef]
  66. Koehler, B.; Corre, M.; Steger, K.; Well, R.; Zehe, E.; Sueta, J.; Veldkamp, E. An in-depth look into a tropical lowland forest soil: Nitrogen-addition effects on the contents of N2O, CO2 and CH4 and N2O isotopic signatures down to 2-m depth. Biogeochemistry 2012, 111, 695–713. [Google Scholar] [CrossRef]
  67. Fender, A.; Pfeiffer, B.; Gansert, D.; Leuschner, C.; Daniel, R.; Jungkunst, H. The inhibiting effect of nitrate fertilisation on methane uptake of a temperate forest soil is influenced by labile carbon. Biol. Fertil. Soils 2012, 48, 621–631. [Google Scholar] [CrossRef]
  68. Vanitchung, S.; Conrad, R.; Harvey, N.; Chidthaisong, A. Fluxes and production pathways of nitrous oxide in different types of tropical forest soils in Thailand. Soil Sci. Plant Nutr. 2011, 57, 650–658. [Google Scholar] [CrossRef]
  69. Heil, J.; Liu, S.; Vereecken, H.; Brüggemann, N. Mechanisms of inorganic nitrous oxide production in soils during nitrification and their dependence on soil properties. In Proceedings of the EGU General Assembly, Vienna, Austria, 27 April–2 May 2014; p. 4208.
Figure 1. Monthly mean air temperature and precipitation during 2009–2013 (A); the monthly mean temperature and precipitation from September 2011 to September 2013 (B).
Forests 07 00256 g001
Figure 2. Soil CO2, CH4, and N2O emissions measured in 10, 17, and 32-year-old stands during 2011–2013. The error bars shown in the figure are standard deviations.
Forests 07 00256 g002
Figure 3. The frequency distribution histogram of CH4, CO2, and N2O emissions during the whole year, growing season (from 1 May to 30 November), and non-growing season (from 1 December to 30 April), respectively. (AC) in the upper-right corner represent the greenhouse gas (GHG) emissions during the whole year; (DF) represent the GHG emissions during the growing season; and (GI) represent the GHG emissions during the non-growing season.
Forests 07 00256 g003
Figure 4. Annual cumulative CO2, CH4, and N2O emissions measured during 2011 to 2013. Symbols on the x-axis (10, 17, and 32) mean the 10-year-old, 17-year-old, and 32-year-old stands. (Error bars in the figures means standard error, and different lower case letters indicate significant differences between the treatments, each with p < 0.05).
Forests 07 00256 g004
Figure 5. GHG emissions defined by the first two canonical variables (Can 1 and Can 2) extracted from the canonical correspondence analysis (CCA). In this plot, the position of points relative to the direction of vectors approximates correlations between soil GHG emissions and environmental factors. Vector length indicates the overall contribution of the variables to the analysis, and vector direction indicates the correlation of the variables with each axis.
Forests 07 00256 g005
Table 1. Selected sites and soil characteristics for three stands in Dongping National Park, Chongming Island.
10-Year-Old Stand17-Year-Old Stand32-Year-Old Stand
Tree Growth
Tree density (stems/ha)1050725550
Average height (m)8.1 ± 1.516.2 ± 2.228.3 ± 3.4
Average DBH (cm)10.5 ± 3.117.5 ± 3.427.2 ± 3.0
Biomass carbon stock (t ha−1)13.9629.7664.93
Litter (a)
Litter amount (t ha−1)1.04 ± 0.0082.67 ± 0.0123.87 ± 0.027
Fallen leaf C (%)47.35 ± 0.6148.11 ± 0.3247.67 ± 0.40
Fallen branch C (%)44.40 ± 0.3344.86 ± 0.3246.07 ± 0.37
Fallen leaf N (%)1.60 ± 0.091.84 ± 0.051.69 ± 0.08
Fallen branch N (%)0.75 ± 0.040.63 ± 0.040.64 ± 0.05
Fallen leaf C:N ratio29.626.128.2
Fallen branch C:N ratio59.271.272.0
Soil Properties
Bulk density1.55 ± 0.011.62 ± 0.011.62 ± 0.01
pH8.18 ± 0.0688.19 ± 0.0978.12 ± 0.063
Total N (%)0.11 ± 0.0140.19 ± 0.0380.22 ± 0.002
SOC (%)0.711.781.94
Total C (%)1.40 ± 0.0141.85 ± 0.0362.11 ± 0.054
C:N ratio131010
Soil carbon storage (t ha−1)31.87 ± 2.2037.68 ± 1.0740.01 ± 2.49
Note: (a) The source of litter data was Xiao’s dissertation [30]. DBH, diameter at breast height; SOC, soil organic carbon.
Table 2. Average forest soil CO2, CH4, and N2O emissions measured in the 10, 17, and 32-year-old stands during the period from 2011–2013.
Stand Age2011–20122012–20132011–2013
CH4 (mg m−2 h−1)10−0.030 ± 0.029 b−0.021 ± 0.016 b−0.026 ± 0.024 b
17−0.035 ± 0.059 b−0.030 ± 0.025 b−0.032± 0.045 b
32−0.081 ± 0.093 a−0.056 ± 0.049 a−0.069 ± 0.075 a
CO2 (mg m−2 h−1)10233.35 ± 152.28 a223.25 ± 134.76 a228.30 ± 142.40 a
17250.42 ± 146.93 a225.86 ± 139.22 a238.14±142.20 a
32322.40 ± 241.16 a273.01 ± 194.12 a297.71 ± 218.09 a
N2O (μg m−2 h−1)107.17 ± 16.12 a3.40 ± 6.05 a5.29 ± 12.20 a
1715.79 ± 29.95 a4.38 ± 6.68 a10.09 ± 22.23 a
3215.46 ± 19.23 a9.04 ± 7.56 b12.25 ± 14.82 a
Note: The periods of 2011–2012 and 2012–2013 are 15 September 2011–1 September 2012 and 14 September 2012–2 September 2013, respectively. The contents in this table refer to mean average greenhouse gas emissions ± standard deviation. Different lower case letters after these contents indicate significant differences between the treatments, each with p < 0.05.
Table 3. Parameters of the exponential model for soil CO2 emissions as a function of soil temperature at 5 and 10 cm depths in the three stands.
Sites10-Year-Old Stand17-Year-Old Stand32-Year-Old StandThree Stands
Soil Depth (cm)510510510510
Whole YearR20.580.650.720.660.790.780.680.69
α67.6159.7162.0165.9958.2360.6062.7861.89
β0.06590.07520.07320.06890.08720.08560.07520.0767
Q101.932.122.081.992.392.352.122.15
Growing SeasonR20.240.230.360.230.520.510.360.69
α132.36129.4089.30113.7577.0284.0996.8261.89
β0.03830.03970.05690.04480.07460.07080.05680.0767
Q101.471.491.771.572.112.031.762.15
Non-growing SeasonR20.180.330.590.540.610.570.350.69
α71.5651.8655.8555.5253.1552.7065.2461.89
β0.0360.08110.08080.08240.09470.09860.05990.0767
Q101.432.252.242.282.582.681.822.15
Table 4. Pearson correlation coefficients between greenhouse gas and soil temperature and water content.
CH4CO2N2OT 5 cmT 10 cmSWC 0−10 cmSWC 10–20 cm
CH41.000−0.377 **−0.041−0.301 **−0.317 **−0.0120.169
CO21.0000.380 **0.765 **0.776 **−0.211 *−0.276 **
N2O1.0000.274 **0.274 **0.141−0.047
T 5 cm1.0000.972 **−0.319 **−0.364 **
T 10 cm1.000−0.324 **−0.385 **
SWC 0–10 cm1.0000.671 **
SWC 10–20cm1.000
Note: ** Correlation is significant at the 0.01 level (2-tailed). * Correlation is significant at the 0.05 level (2-tailed). T 5 cm and T 10 cm mean soil temperature at 5 cm soil depth and at 10 cm soil depth, respectively. SWC 0–10 cm and SWC 10–20 cm mean soil water content at 0–10 cm soil depth and at 10–20 cm soil depth, respectively.

