Article

Effects of Lakes on Wildfire Activity in the Boreal Forests of Saskatchewan, Canada

1
Department of Renewable Resources, University of Alberta, 751 General Services Building, Edmonton, AB T6G 2H1, Canada
2
Northern Forestry Centre, Canadian Forest Service, Natural Resources Canada, 5320 122nd Street, Edmonton, AB T5H 3S5, Canada
*
Author to whom correspondence should be addressed.
Forests 2016, 7(11), 265; https://doi.org/10.3390/f7110265
Submission received: 21 August 2016 / Revised: 28 October 2016 / Accepted: 31 October 2016 / Published: 5 November 2016

Abstract

:
Large lakes can act as firebreaks resulting in distinct patterns in the forest mosaic. Although this is well acknowledged, much less is known about how wildfire is affected by different landscape measures of water and their interactions. Here we examine how these factors relate to historic patterns of wildfire over a 35-year period (1980–2014) for the boreal forest of Saskatchewan, Canada. This includes the amount of water in different-sized neighborhoods, the presence of islands, and the direction, distance, and shape of nearest lake of different sizes. All individual factors affected wildfire presence, with lake sizes ≥5000 ha and amount of water within a 1000-ha surrounding area the most supported spatial scales. Overall, wildfires were two-times less likely on islands, more likely further from lakes that were circular in shape, and in areas with less surrounding water. Interactive effects were common, including the effect of direction to lake as a function of distance from lakeshore and amount of surrounding water. Our results point to a strong, but complex, bottom-up control of local wildfire activity based on the configuration of natural firebreaks. In fact, fire rotation periods predicted for one area varied more than 15-fold (<47 to >700 years) depending on local patterns in lakes. Old-growth forests within this fire-prone ecosystem are therefore likely to depend on the surrounding configuration of larger lakes.

1. Introduction

Boreal forests are shaped by wildfires that are affected by spatial and temporal factors that influence both individual fire characteristics (e.g., size, shape, severity) and more generally the local landscape’s fire cycle [1,2]. Although temporal factors affect when a fire occurs, its intensity (energy release), and its severity (ecological impacts), the landscape structure and physiography influence where fires are more likely to burn, and thus the spatial pattern of the forest mosaic [3,4,5,6]. More complex landscapes have more heterogeneous patterns in vegetation, which results in more complicated fire patterns [4,7]. One element of a landscape’s physiography that is particularly important in the boreal forest is the amount and location of water bodies, since these features can act as natural firebreaks and thus barriers to fire spread [8,9,10].
There are a number of different landscape characteristics of water bodies that may affect the adjacent upland’s fire patterns and local fire cycles, including the size, shape, and orientation of water bodies [11]. Large lakes are especially important in stopping the spread of fires, whereas smaller water bodies (or other natural firebreaks) may stop the spread of smaller fires and those fires perpendicular to the dominant wind direction [12]. In the boreal and hemi-boreal forest of central Canada where winds are dominantly from the west, forest stands on the eastern sides of larger lakes often have longer fire cycles [11]. Indeed, in some places, old-growth forests may be much more common on the eastern shore of large lakes and on islands within the lake [8,11,13]. Likewise, fire-intolerant tree species, such as white cedar (Thuja occidentalis L.) that are uncommon in upland forest locations away from lakes, are often associated with the downwind stretches of lake shorelines [14]. Although white cedar is most often considered a wet-adapted species given where it most often grows, it is also known to occur in the most extreme dry conditions along bedrock ridges and cliffs where fires are limited [15], thus suggesting that some combination of fire and moisture limits its distribution, and not solely water availability [16]. Landscape patterns of lakes may therefore not only influence distribution of where fires occur and thus associated patterns in forest age, but also forest composition.
Although it is well acknowledged that natural firebreaks such as lakes, a common feature of the boreal biome, exert a strong (if localized) bottom-up control on boreal wildfires, the mechanisms by which this occurs requires further examination. For instance, the “edge effect” of lakes, whereby wildfires are less likely closer to the edge of large lakes, has been described previously by others [9,14,17], but it is still unclear how this is affected by lake size, lake shape, and orientation (bearing) around lakes. Given that both landscape patterns and prevailing winds are non-random [12], the effect of lake proximity on wildfires should be dependent on and interacting with other factors. Similar to individual lake size, the overall proportion of natural firebreaks (including lakes) has been shown to affect wildfire activity in the boreal forest of Sweden [18]. This concept of vegetation fragmentation is in fact one of the principles guiding landscape fuel reduction [19]. However, simulation studies suggest that there is more to the “more nonfuel equates to fewer fires” concept, as the effectiveness of firebreaks is also a function of landscape configuration and fire regime characteristics (e.g., fire size, ignition patterns) [20]. A better understanding of the effects of large lakes on boreal wildfire activity thus implies the need to capture both primary effects of adjacent lake characteristics (e.g., proximity, proportion) and the synergistic effects of factors describing configuration and orientation.
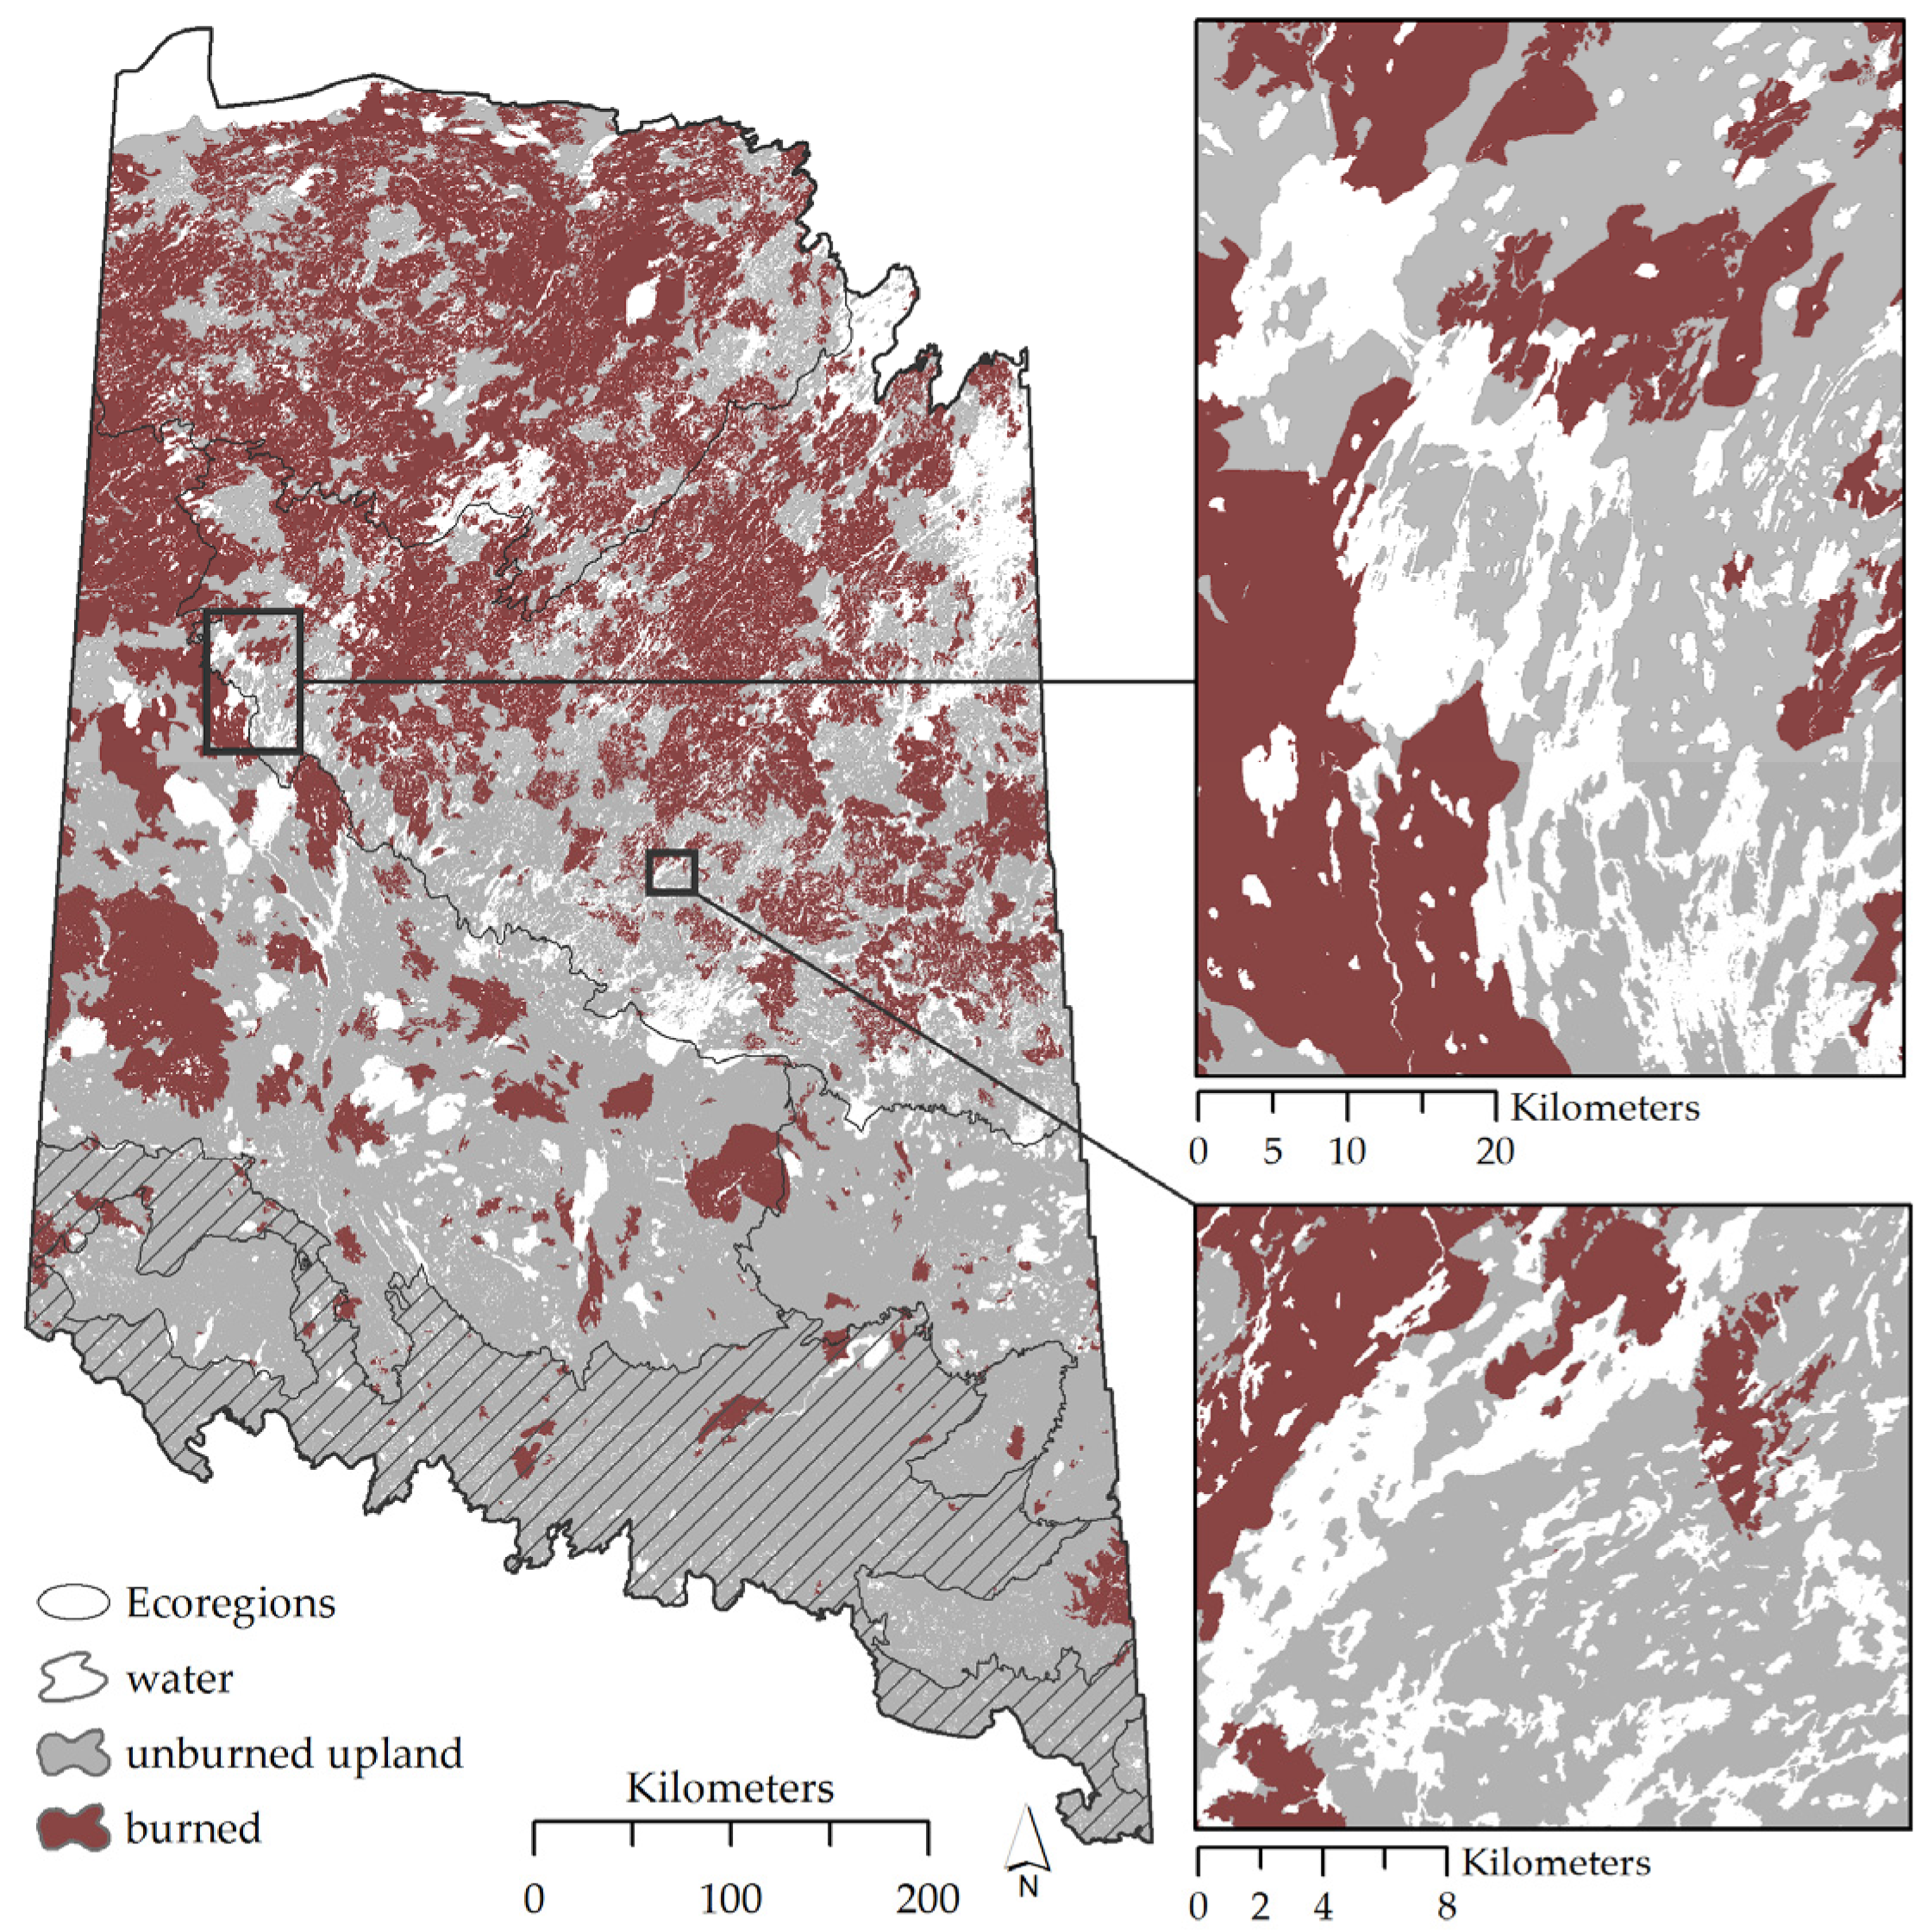
The objective of this paper is to examine the landscape effects of lake size, lake shape, amount of surrounding water, presence of islands, and the distance and direction to lakes on wildfire patterns in the boreal forest of Saskatchewan, Canada. Specifically, we examine how the distance to different sized lakes interacts with direction to lakes, shape of lakes, and amount of surrounding water to influence wildfire patterns, thus helping to identify the conditions where old-growth forests are most likely within a fire-prone forested ecosystem. We did this by examining a 35-year history (1980–2014) of wildfires in northern Saskatchewan’s boreal forest where fire perimeters have been mapped using aerial imagery and compared this information with landscape measures of water.

2. Materials and Methods

2.1. Study Area

The study area was defined as the Boreal Shield and Boreal Plain ecozones of northern Saskatchewan, Canada (Figure 1). This 361,924 km2 area is bounded in the north by Lake Athabasca, Black Lake, and Wollaston Lake, which delimits the northern limit of boreal forests and the start of taiga forests. Taiga forests were excluded from this study given the smaller size of this ecozone in Saskatchewan and lower amounts of forest cover. The Boreal Plain ecozone represents the southern part of the study area (178,225 km2) where boreal forest transitions to the Prairie ecozone. The area’s largest human imprint is, by far, at this transition (i.e., the Boreal Transition ecoregion) (Figure 1c). Large tracts of land in this area have been converted to agriculture and, given its higher population density than areas to the north, are subject to more intensive fire suppression effort. The Boreal Plain is underlain by sedimentary rock with thick glacial deposits with water bodies being common (8.4% water). Forest exploitation occurs in the Boreal Plain but is relatively minor and is localized. The Boreal Shield ecozone covers the northern parts of the study area (183,699 km2) and is characterized by rolling terrain of Precambrian bedrock (Canadian Shield) with shallow soils derived from thin glacial deposits and numerous water bodies (19.9% of the ecozones is water). There is no forestry in the Boreal Shield. North of the Boreal Transition ecoregion, the anthropogenic impact on fire activity in Saskatchewan is generally considered to be relatively minor, given the extreme nature of fire-conducive weather (i.e., thereby limiting fire suppression effectiveness) and the lack of fire management activities beyond the immediate vicinity of communities [21].
The boreal ecozones of Saskatchewan have a continental climate with cold winters and warm summers with an average annual (1981–2010) temperature of 0.2 °C and an average annual precipitation of 486 mm with 31% falling as snow [22]. Common tree species to both ecozones include black and white spruce (Picea mariana (Mill.) BSP and P. glauca (Moench) Voss), jack pine (Pinus banksiana Lamb.), eastern larch (Larix larciana (Du Roi) K. Koch), balsam fir (Abies balsamea (L.)), trembling aspen (Populus tremuloides Michx.), balsam poplar (Populus balsamifera L.), and white birch (Betula papyrifera Marsh.). Fire is common to the region with some of the highest fire frequencies recorded in the Canadian boreal forests with annual area burned ranging from a 0.1% to >1.5% [1,22]. The area north of the Churchill River, which approximately divides the Boreal Plain in the south from the Boreal Shield in the north, maintains a relatively natural fire regime as there is little forest protection (i.e., “let it burn” policy). Active fire suppression in this area only occurs around communities and infrastructure (no active timber leases/management). Although there is fire suppression south of the Churchill River, wildfires are still common, including large intense wildfires such as those that occurred around La Ronge during the summer of 2015.

2.2. Historical Mapping of Wildlife Patterns

We used mapped fire perimeters from 1980 to 2014 (35 years) for Saskatchewan’s Boreal ecozones and a 50-km buffer around the study area to ensure moving window landscape analyses were not biased by edge effects. Fire data were obtained from the Canadian Forest Service National Fire Database [2]. Only fires greater than 200 ha were retained as those smaller than that size are inconsistently reported (fires <200 ha account for less than 3%–4% of the area burned, [1]). Fire perimeters were then rasterized into a binary burned/unburned (0/1) grid using a cell size of 25 m (0.0625 ha). Estimates of fire frequency were derived for each ecoregion to compare with local predicted variation in fire frequency from our models. Fire frequency was defined as the fire rotation period based on the proportion of landscape burned over the study time period [16]. For this study, we defined the study period as 35 years (1980–2014). Rather than estimate, as standard practice, the proportion of the landscape burned based on total area, we first removed water pixels to represent the area that was truly “burnable”. This resulted in shorter fire rotation periods, especially for the Boreal Shield where the amount of water approached 20%.

2.3. Landscape Measures of Water Bodies

Water bodies and island boundaries were defined by National Hydrographic Network (NHN) data [23]. Most water bodies in the boreal ecozone were lakes (81.5% for all water features ≥500 ha and 96.4% for all water features ≥5000 ha). Five landscape predictors relating to landscape measures of water were derived from NHN data and used to relate to local patterns in wildfire occurrence (Table 1). This included: (1) amount (proportion) of water in surrounding area; (2) distance (in 100 m units) to nearest water body; (3) direction to nearest water body (“eastness” index); (4) shape index (round to more irregular) of nearest water body; and (5) presence of islands. Table 1 includes a description of expected (predicted) linear responses of wildfire likelihood for each factor.
Amount (proportion) of water in the surrounding area was measured in moving circular windows of three different sizes (1000, 10,000, and 100,000 ha) using the focal statistics tool in ArcGIS. Distance to water was measured using the Euclidean distance tool in ArcGIS and transformed to log10 scale (distance +1) since distance values where highly left skewed. Direction to nearest water body was calculated using the formula: COS (“bearing to lake”−90), with the bearing calculated in a geographic information system (GIS) using the ArcGIS raster calculator tool. Using this index a maximum value of 1 represented locations that were on the west side of water bodies with the bearing to water bodies being east. Conversely, a minimum value of −1 represented a location that was on the east side of water bodies with the bearing to water bodies being west. Finally, north and south directions had an equivalent and intermediate value of 0. Shape of water bodies was calculated with the spatial statistics tool in the Patch Analyst extension [24] where more round-shaped water bodies approached a minimum possible value of 1, while more irregular-shaped water bodies were much greater than 1 (our data ranged from ~2 to 44).
We evaluated a range of spatial scales for each of the water variables, except islands, which were simply noted as a binary variable based on whether the location was on a mainland (0) or island (1). The island variable was included in addition to the other landscape measures of water to test whether such a well-defined firebreak further reduced the probability of a wildfire beyond that of which can be explained by the other landscape measures of water. For amount of surrounding water, we examined three moving window sizes of 1000, 10,000, and 100,000 ha (Figure 2).
In comparison to surrounding amount of water, distance to nearest water body (Figure 3), direction (eastness) to nearest water body (Figure A1), and shape of nearest water body (Figure A2) were assessed for four different water body size thresholds of 500, 1000, 5000, and 10,000 ha. For instance, the 500-ha threshold required that water bodies be ≥500 ha in size before measuring their distance, direction, and shape. All variables were mapped in a GIS at a 25-m resolution.

2.4. Regression Modeling

We randomly sampled 50,000 non-water sites (25-m pixels) in the Boreal ecozone that were at least (minimum distance) 100 m apart. This large sample size was chosen given high local variability in landscape factors (e.g., distance from water, amount of surrounding water, etc.) and due to the large size of our study area. Because the Boreal Transition ecoregion along the southern border of the boreal forest was dominated by agricultural conversion (65%) with wildfire activity altered [22], we subsequently removed this ecoregion from all analyses. This resulted in a total of 41,713 sample locations with an overall sample intensity of 0.175 locations per km2 and an average nearest neighbor distance between sample locations of 1325 m (SD = 716 m). For each sample pixel, we queried the presence of recent (1980–2014) wildfires (binary response variable), the ecoregion identity, and all landscape measures of water. Although other factors, such as vegetation configuration, fire-conducive weather, the spatial-temporal patterns of fire ignitions, and anthropogenic features (e.g., roads, cutblocks) also affect fire spread, these were not considered in this study in order to focus on the effect of large water bodies.
We used a mixed effects logistic regression model (xtmelogit command in STATA; [25]) with ecoregion set as a random effect (intercept) to estimate the probability that a site (25-m pixel) would burn from wildfires over the 35-year fire history based on the amount of surrounding water, distance to water, direction to water body (eastness index), shape irregularity of water feature, and presence of islands (Table 1). Correlations among linear terms were assessed for each model to identify possible collinearity issues as defined by Pearson correlations greater than |0.7|. The random effect accounted for non-independence of samples (random pixels) within ecoregions, as well as accounting for ecoregion differences in fire frequency (i.e., a random intercept for each ecoregion).
Because we expected a priori that the presence of wildfires around water bodies depended on a combination of landscape factors and their interactions (particularly with distance), we fit a number of two-way and three-way interactions (Table 2). Six two-way interactions were tested that included: (1) distance to water and amount of surrounding water; (2) distance and direction to water; (3) distance and shape of nearby water; (4) shape of nearby water and amount of surrounding water; (5) shape and direction of nearby water; and (6) direction to nearby water and amount of surrounding water (Table 2). Finally, we considered three three-way interactions that included: (1) amount of surrounding water and direction and distance to nearest water body; (2) amount of surrounding water and distance and shape of nearest water bodies; and (3) amount of surrounding water and direction (eastness) and shape of nearest water body. See Table 2 for a list of hypothesized predictions.

2.5. Model Building

Model building followed a hierarchical approach given the large number of possible scales and variable combinations. First, each of the four water body size thresholds (500, 1000, 5000, and 10,000 ha; Table 1) were evaluated to determine which water body size threshold most affected the likelihood of a site burning from wildfires. All models included the island variable and the distance to nearest water body, direction (eastness) to nearest water body, and shape of nearest water body. Second, we evaluated support among the three different window sizes measuring amount of surrounding water (1000, 10,000, 100,000 ha; Table 1) after holding the water body size threshold identified in the first analysis constant. Third, we assessed support of interactions for the most supported “linear” model (scale) that included both the selected water body size threshold variable and window size measuring the amount of surrounding water. Only linear responses among predictors and wildfire presence were tested as we did not expect a priori non-linear responses between water variables and wildfire probability.

2.6. Model Selection and Assessment

Model selection (support) was evaluated using Akaike’s Information Criteria (AIC), which assesses the trade-off between model fit and complexity [26], thus representing a measure of model parsimony [27]. For the most supported final model, we examined model predictions (responses) relative to our hypothesized predictions (Table 1 and Table 2) based on the model parameters and predicted responses (graphs and maps). Basic descriptive statistics of model predictions by ecoregion were also used to help interpret local landscape variation in wildfire likelihood as compared to ecoregion-scale averages. Finally, we assessed model predictive accuracy of the most supported model based on a non-parametric Receiver Operating Characteristic (ROC) Area Under the Curve (AUC) estimate using the “roctab” command in STATA [25] with the 95% confidence interval reported. Models with AUC values ranging from 0.5 to 0.7 were considered to have “low” model accuracy, values between 0.7 and 0.9 were considered to have “good” model accuracy, and finally those above 0.9 were considered to have “high” model accuracy [28,29]. A model that is no different than random would have an AUC of 0.5.

2.7. Predicting Local Variation in Fire Frequency

Local fire frequency was estimated from model predictions based on the probability of wildfire over the 35-year study period. For the purpose of comparison with ecoregion estimates, we modified the definition of the fire rotation period [e.g., 16] for model-based local predictions of wildfire by swapping the proportion of the landscape burned with the probability (p) of the site being burned (e.g., fire rotation period = 35/p). When site (pixel) probabilities are summed across the landscape they estimate the total predicted area burned and thus when divided by landscape area (in this case “burnable” area) they represent the proportion of landscape burned. However, unique in this situation is that local landscape conditions can be assessed for how they change the fire rotation period. Local variation in the fire rotation period due to the landscape effects of water was then compared to regional estimates to illustrate the influence of water bodies on local patterns in the fire regime.

3. Results

3.1. Fire History (1980–2014)

A total of 38.9% of Saskatchewan’s boreal forest burned between 1980 and 2014 (Figure 4), resulting in an average fire rotation period of 90 years. However, when considering individual ecozones the Boreal Shield burned substantially more area at 62.6%, resulting in an average fire rotation period of 56 years. In contrast, the Boreal Plain burned 17.5% of the area resulting in a fire rotation period of 200 years; however, when removing the Boreal Transition ecoregion, 23.9% of the Boreal Plain ecozone burned resulting in an average 146 year fire rotation period.

3.2. Wildfire Patterns as It Relates to Landscape Characteristics of Water Bodies

3.2.1. Water Body (Lake) Size Thresholds

The most supported water body size threshold for measuring distance, direction, and shape to nearby water bodies (all models included the presence of islands) was 5000 ha (Table 3). The second most supported scale was 10,000 ha, thereby indicating that moderately-large to large water bodies were more influential in acting as firebreaks than smaller (<5000 ha) water bodies. Given that only 3.6% of water features ≥5000 ha were defined as rivers, we simplify hereto our terminology of water features from “water bodies” to “lakes”.

3.2.2. Scale of Window Size for Amount of Surrounding Water

After holding lake size threshold for distance, direction, and shape of nearest lake constant at the 5000 ha size (Table 3), the window size (scale) measuring the amount (proportion) of surrounding water was most supported at a 1000 ha window size (Table 4). This indicated a more local effect of surrounding water on wildfire probability, particularly given the lack of support for the largest window size examined of 100,000 ha (ΔAIC = 93.0).

3.2.3. Support for Interacting Landscape Effects on Wildfires

When considering two-way interactions between landscape measures of water (Table 2), the most supported (lowest AIC) interaction term was between amount of surrounding water (1000 ha) and direction to nearest water body ≥5000 ha, followed by direction and distance to nearest water body (Table A1). Three other two-way interactions were marginally more supported than the null base model of linear factors without interactions. Finally, the interaction between distance and shape of nearest water body had no model support (higher AIC values than that of the null model; Table A1). Models considering different combinations of two-way interactions supported a model with four of the five two-way interactions with only the interaction of distance and shape to nearest lake less supported than the base null model (Table A2). Finally, two of the three tested three-way interactions were supported (Amount × Distance × Direction and Amount × Distance × Shape) after holding the most supported two-way interactions constant (Table A3).

3.2.4. Model Parameters, Predictions, and Accuracy

The most supported model had 11 landscape variables (Table 5) and good overall model predictive accuracy with a ROC AUC of 0.759 (95% CI = 0.754–0.763). Main hypothesized predictions for linear variables (see Table 1 for list of predictions) were supported for four of the five linear terms in the models (predictions in Table 1; Table 5 with results) and four of the five two-ways interactions (see Table 2 for predictions). Correlation among linear terms in the final model (i.e., model collinearity) was minimal (Pearson |r| < 0.442). Supported hypothesized predictions included island, distance to lake, amount of surrounding water, and shape of lake, while the unsupported prediction was related to direction to lake. All of these factors, however, depended on interactions with each other making interpretations complex. Finally, three 3-way interactions were evident for distance, amount, and direction of lakes (negatively related) and distance, amount, and shape of lakes (positively related) (Table 5).
When considering linear terms, the probability of wildfire was approximately two-times less likely on islands (odds ratio = 0.504) than mainland sites after controlling for other landscape factors, 36% more likely (odds ratio = 1.36) per 10-fold increase in distance from lakes, 7.7 times (odds ratio = 0.13) more likely for areas with no surrounding water compared with areas completely surrounded by water, and 1.5 times less likely (odds ratio = 0.66) on the west side (eastern direction) of lakes compared to north or south orientations, although the orientation-effect depended on the distance from the lake, amount of surrounding water, and shape of nearby lake (Table 5). Finally, wildfire presence decreased marginally (odds ratio = 0.98) as the lake shape became more irregular. Figure 5 illustrates the predicted responses for each landscape variable in the Churchill River Uplands (excluding islands) with variability in responses representing the variation in predicted wildfire probability as influenced by other landscape factors of water. Major differences along landscape gradients in water were most apparent for distance to lake (Figure 5a) and amount of surrounding water (Figure 5b). The effect of distance to lakes was most pronounced within 2.5 km where wildfire likelihood was dramatically reduced and also much lower when amount of surrounding water was greater than 20% (Figure 5).
Due to the complexity of interpreting interactions from coefficients, model predictions were also graphed based on different combinations of factors (Figure 6), as well as mapped for one example area in the Churchill Uplands Ecoregion (Figure 7). Predictions in Figure 6 illustrate changes in probability of wildfire for a 35-year period as a function of amount (proportion) of surrounding water (1000-ha window) and distance to nearest lake ≥5000 ha for different distance classes of 10, 100, 1000, and 10,000 m. This was done for both the west-side (Figure 6a) and east-side of lakes (Figure 6b) since the amount of water, distance from lake, and direction to lake represented the strongest interaction. The interaction between the distance to large lakes and the proportion of water is typical of the hypothesized predictions of wildfire patterns on the west side of lakes that represent in this region the direction of prevailing winds, with the likelihood of wildfire being greater further from lakes when amount of surrounding water was low (Figure 6a). However, there was less variation in wildfire likelihood by distance to lake for the east side of lakes when there was little surrounding water (Figure 6b). This variation is likely the result of complex interactions among the different landscape factors, given that this effect is not observed in the singular relationships illustrated in Figure 5. Regardless, a strong “edge effect” of lakes can be observed on both sides of lakes as illustrated by the consistent low likelihood of burning when adjacent to lakes (10 m). Specifically, the risk ratio of wildfire probability on the west side of lakes was 3.5 times more likely for sites 100 m distant from lakes than 10 m distant and 6.6 times more likely for sites 10,000 m distant from lakes than 10 m distant (Figure 6).
Figure 7 illustrates local spatial patterns in predicted wildfire probability (assuming a 35-year period) for the southern part of Reindeer Lake in the Churchill River Upland ecoregion where fire is common (i.e., 62.6% of Boreal Shield uplands burned in the 35-year period). Differences in predicted wildfire activity were evident when comparing wildfire probability around Reindeer Lake (large lake in center and top of map) with smaller, circular-shaped lakes (but still >5000 ha) in the southeast corner of the map (Figure 7). Wildfire probabilities on some islands (especially eastern sides of islands) and some shorelines along Reindeer Lake were predicted to be less than 0.05 (per 35-year period) resulting in a fire rotation period that exceeded 700 years. Many of the larger islands and immediate shorelines of larger lakes had wildfire probabilities between 0.05 and 0.25 or a fire rotation period between 140 and 700 years. In contrast to these longer fire rotation periods, some areas were estimated to have wildfire probabilities exceeding 0.75 over the 35-year period with a corresponding fire rotation period of less than 47 years. Overall, landscape variability in fire rotation periods within this small area was predicted to vary more than 15-fold depending on local landscape characteristics of the lakes. This local variability in probability of wildfire and thus variability in fire rotation cycle was also pronounced in the Mid-Boreal Upland and Athabasca Plain ecoregions, but less so for the Mid-Boreal Lowland ecoregion (Table A4, Figure A3).

4. Discussion

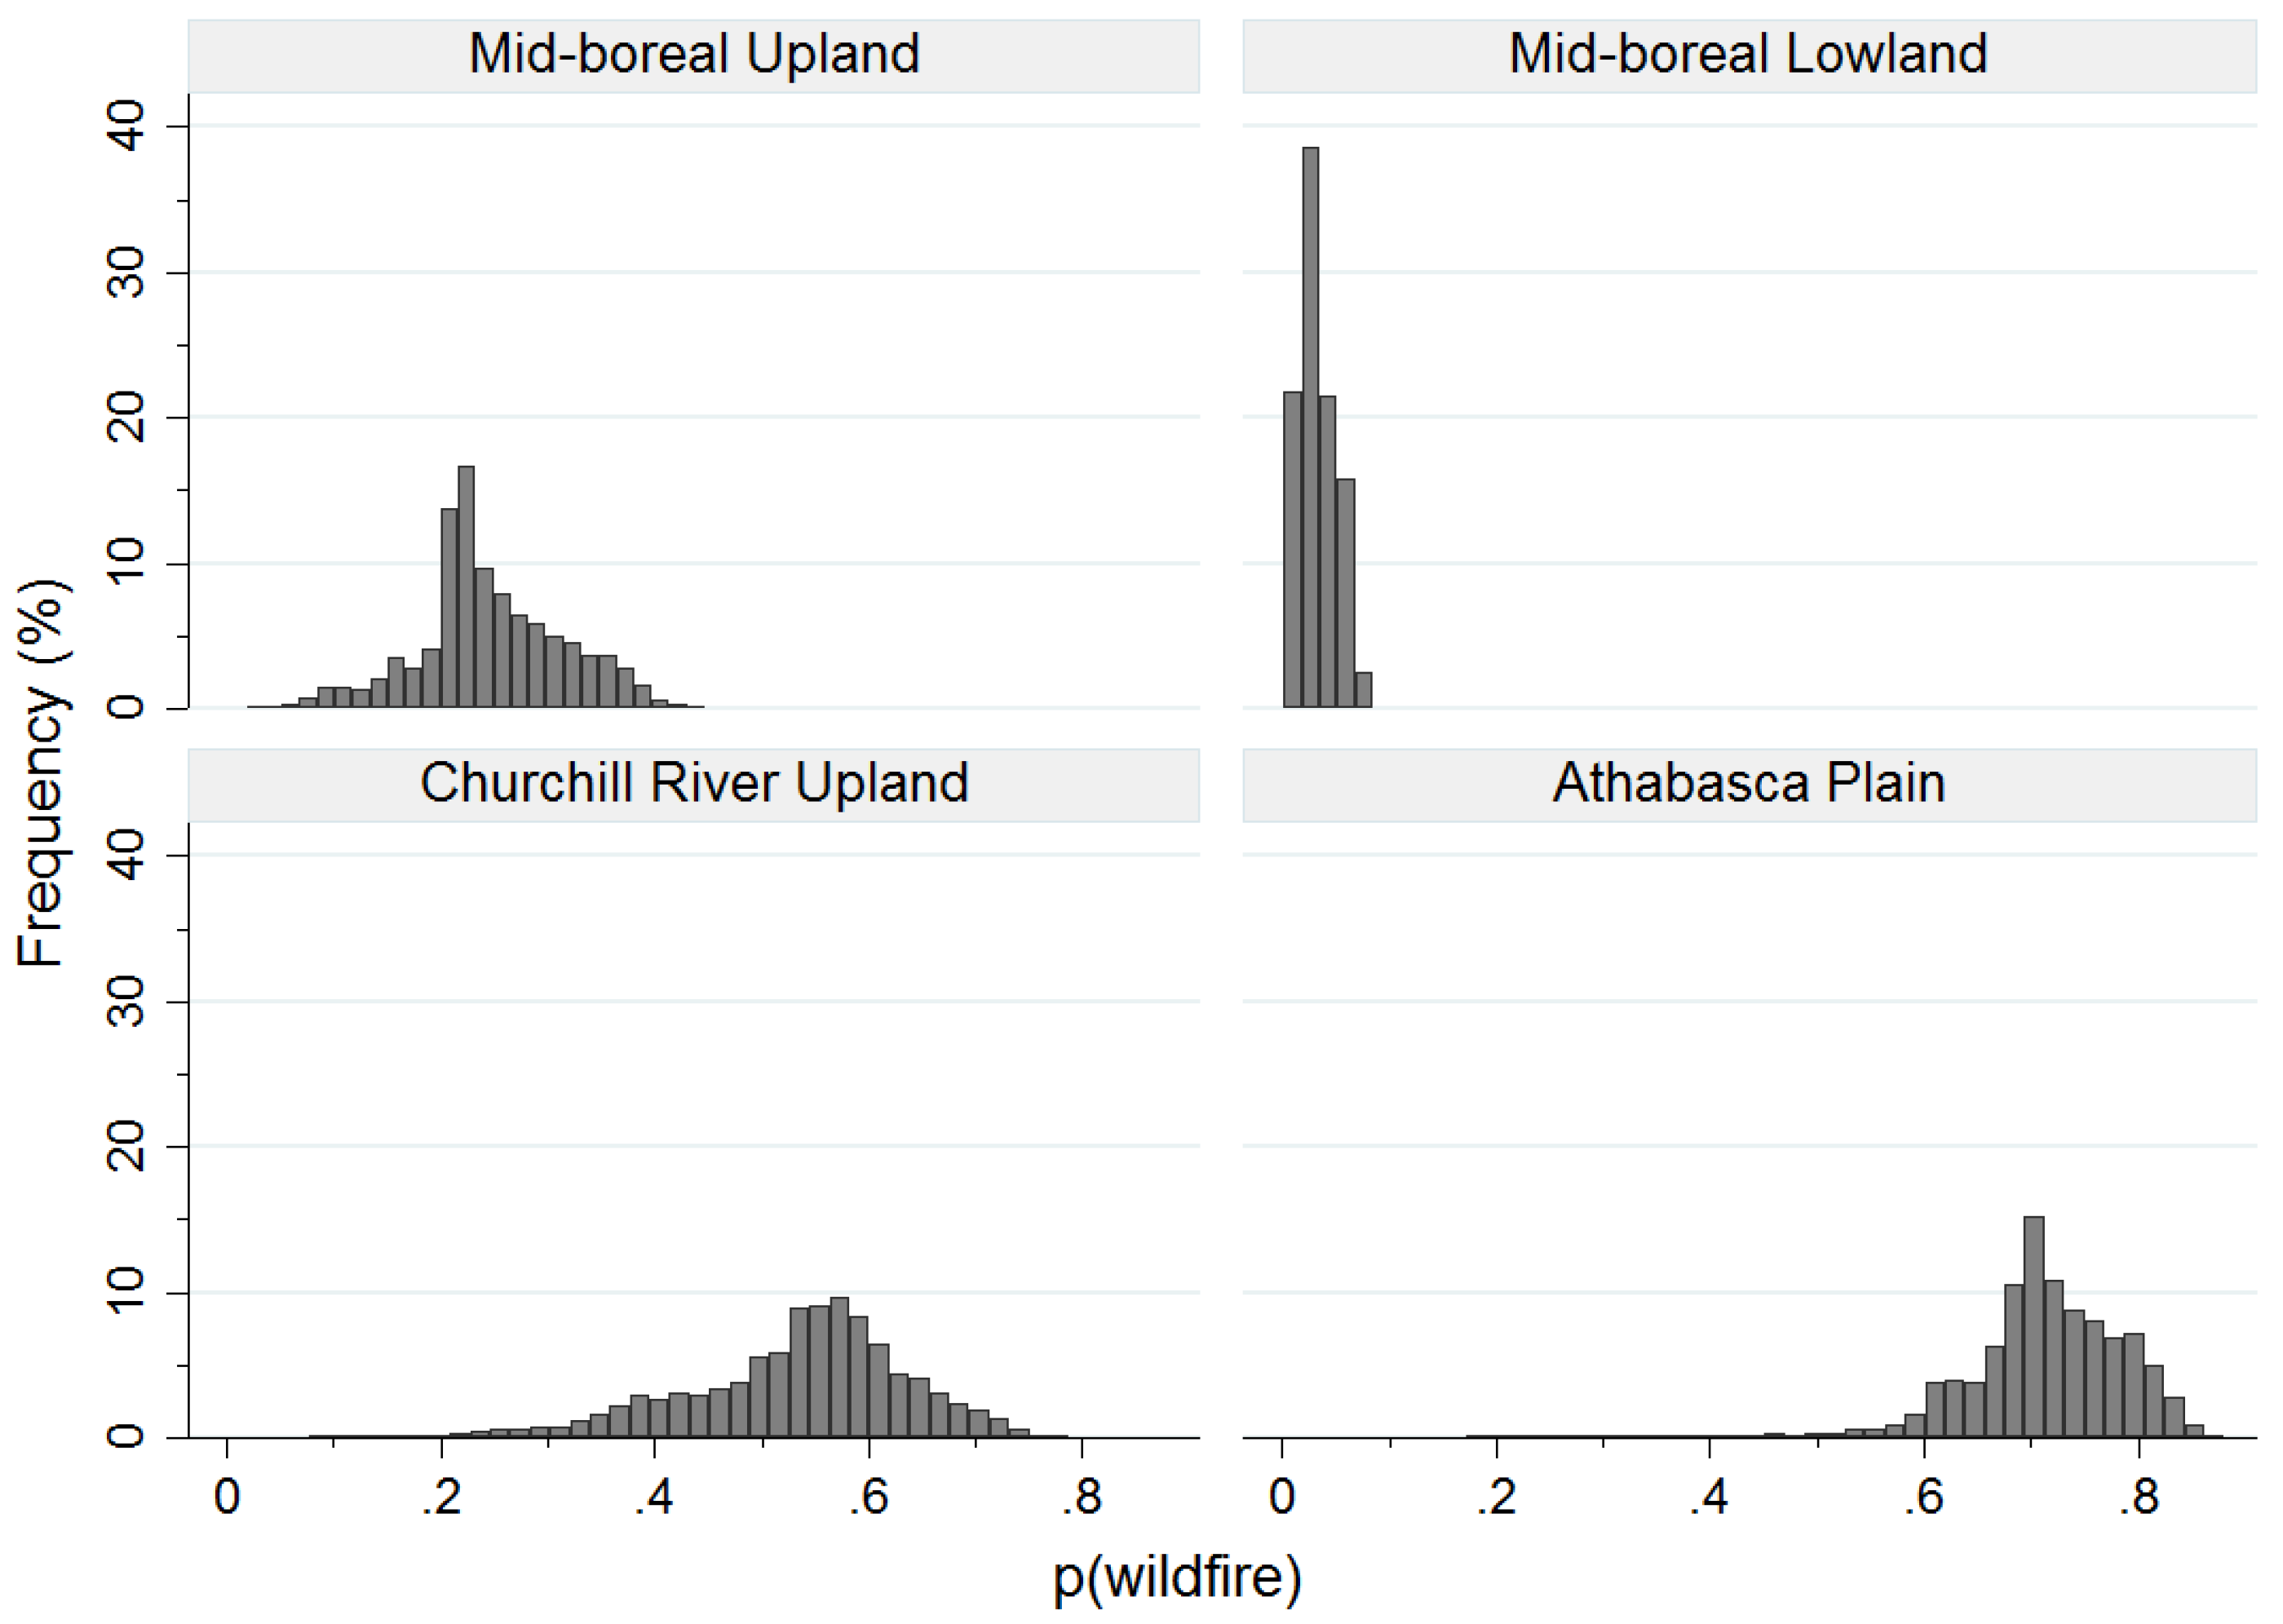
The results of this study support the idea that spatial patterns, and more specifically the local likelihood, of wildfires are not uniformly distributed within the boreal forest. Natural firebreaks, particularly large lakes, represent a strong bottom-up control on wildfire activity. Despite the stochastic nature of wildfire, all of the hypothesized landscape measures of water affected wildfire patterns. This includes the amount of water, the distance to large lakes, the direction to large lakes, the shape of the lake and, finally, insularity. Although the primary effect of these individual factors has been documented in different biomes of the world, we show here that they interact amongst themselves to yield highly heterogeneous patterns of wildfire likelihood.
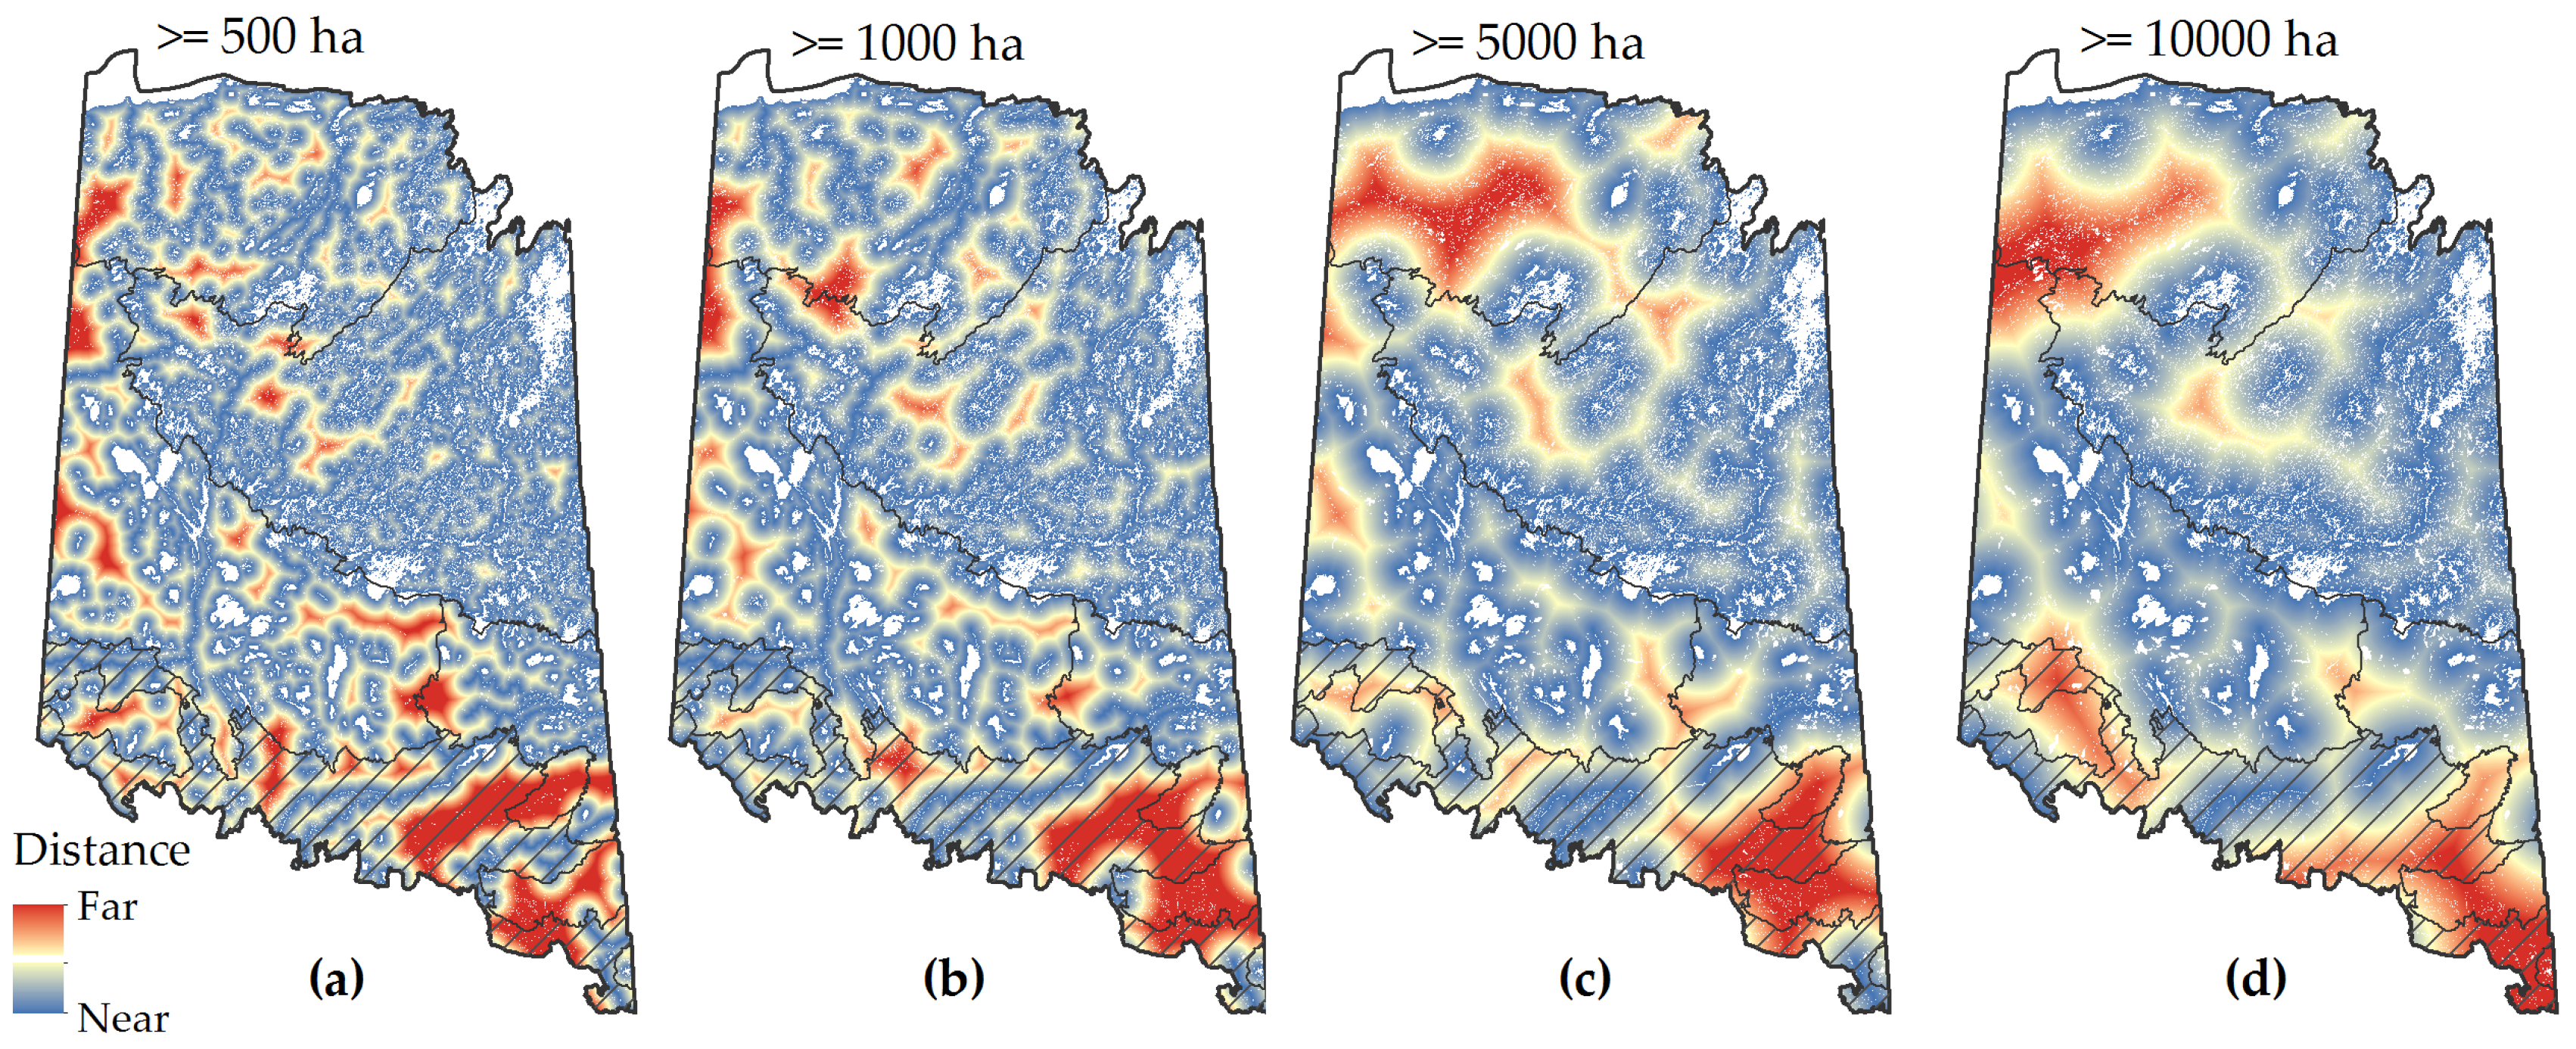
Perhaps the most common measure of assessing the effect of natural firebreaks on wildfire occurrence is the distance of wildfire from those breaks. When fires burn less frequently near lakes, “fire shadow” patterns develop [14]. Our results are in agreement with those reported elsewhere in the Canadian boreal forest that the effect of large lakes may extend several kilometers beyond the edge of the lakes and wetlands [9,10]. The most pronounced effects of lakes are, however, within the first 100 m of the lakeshore [
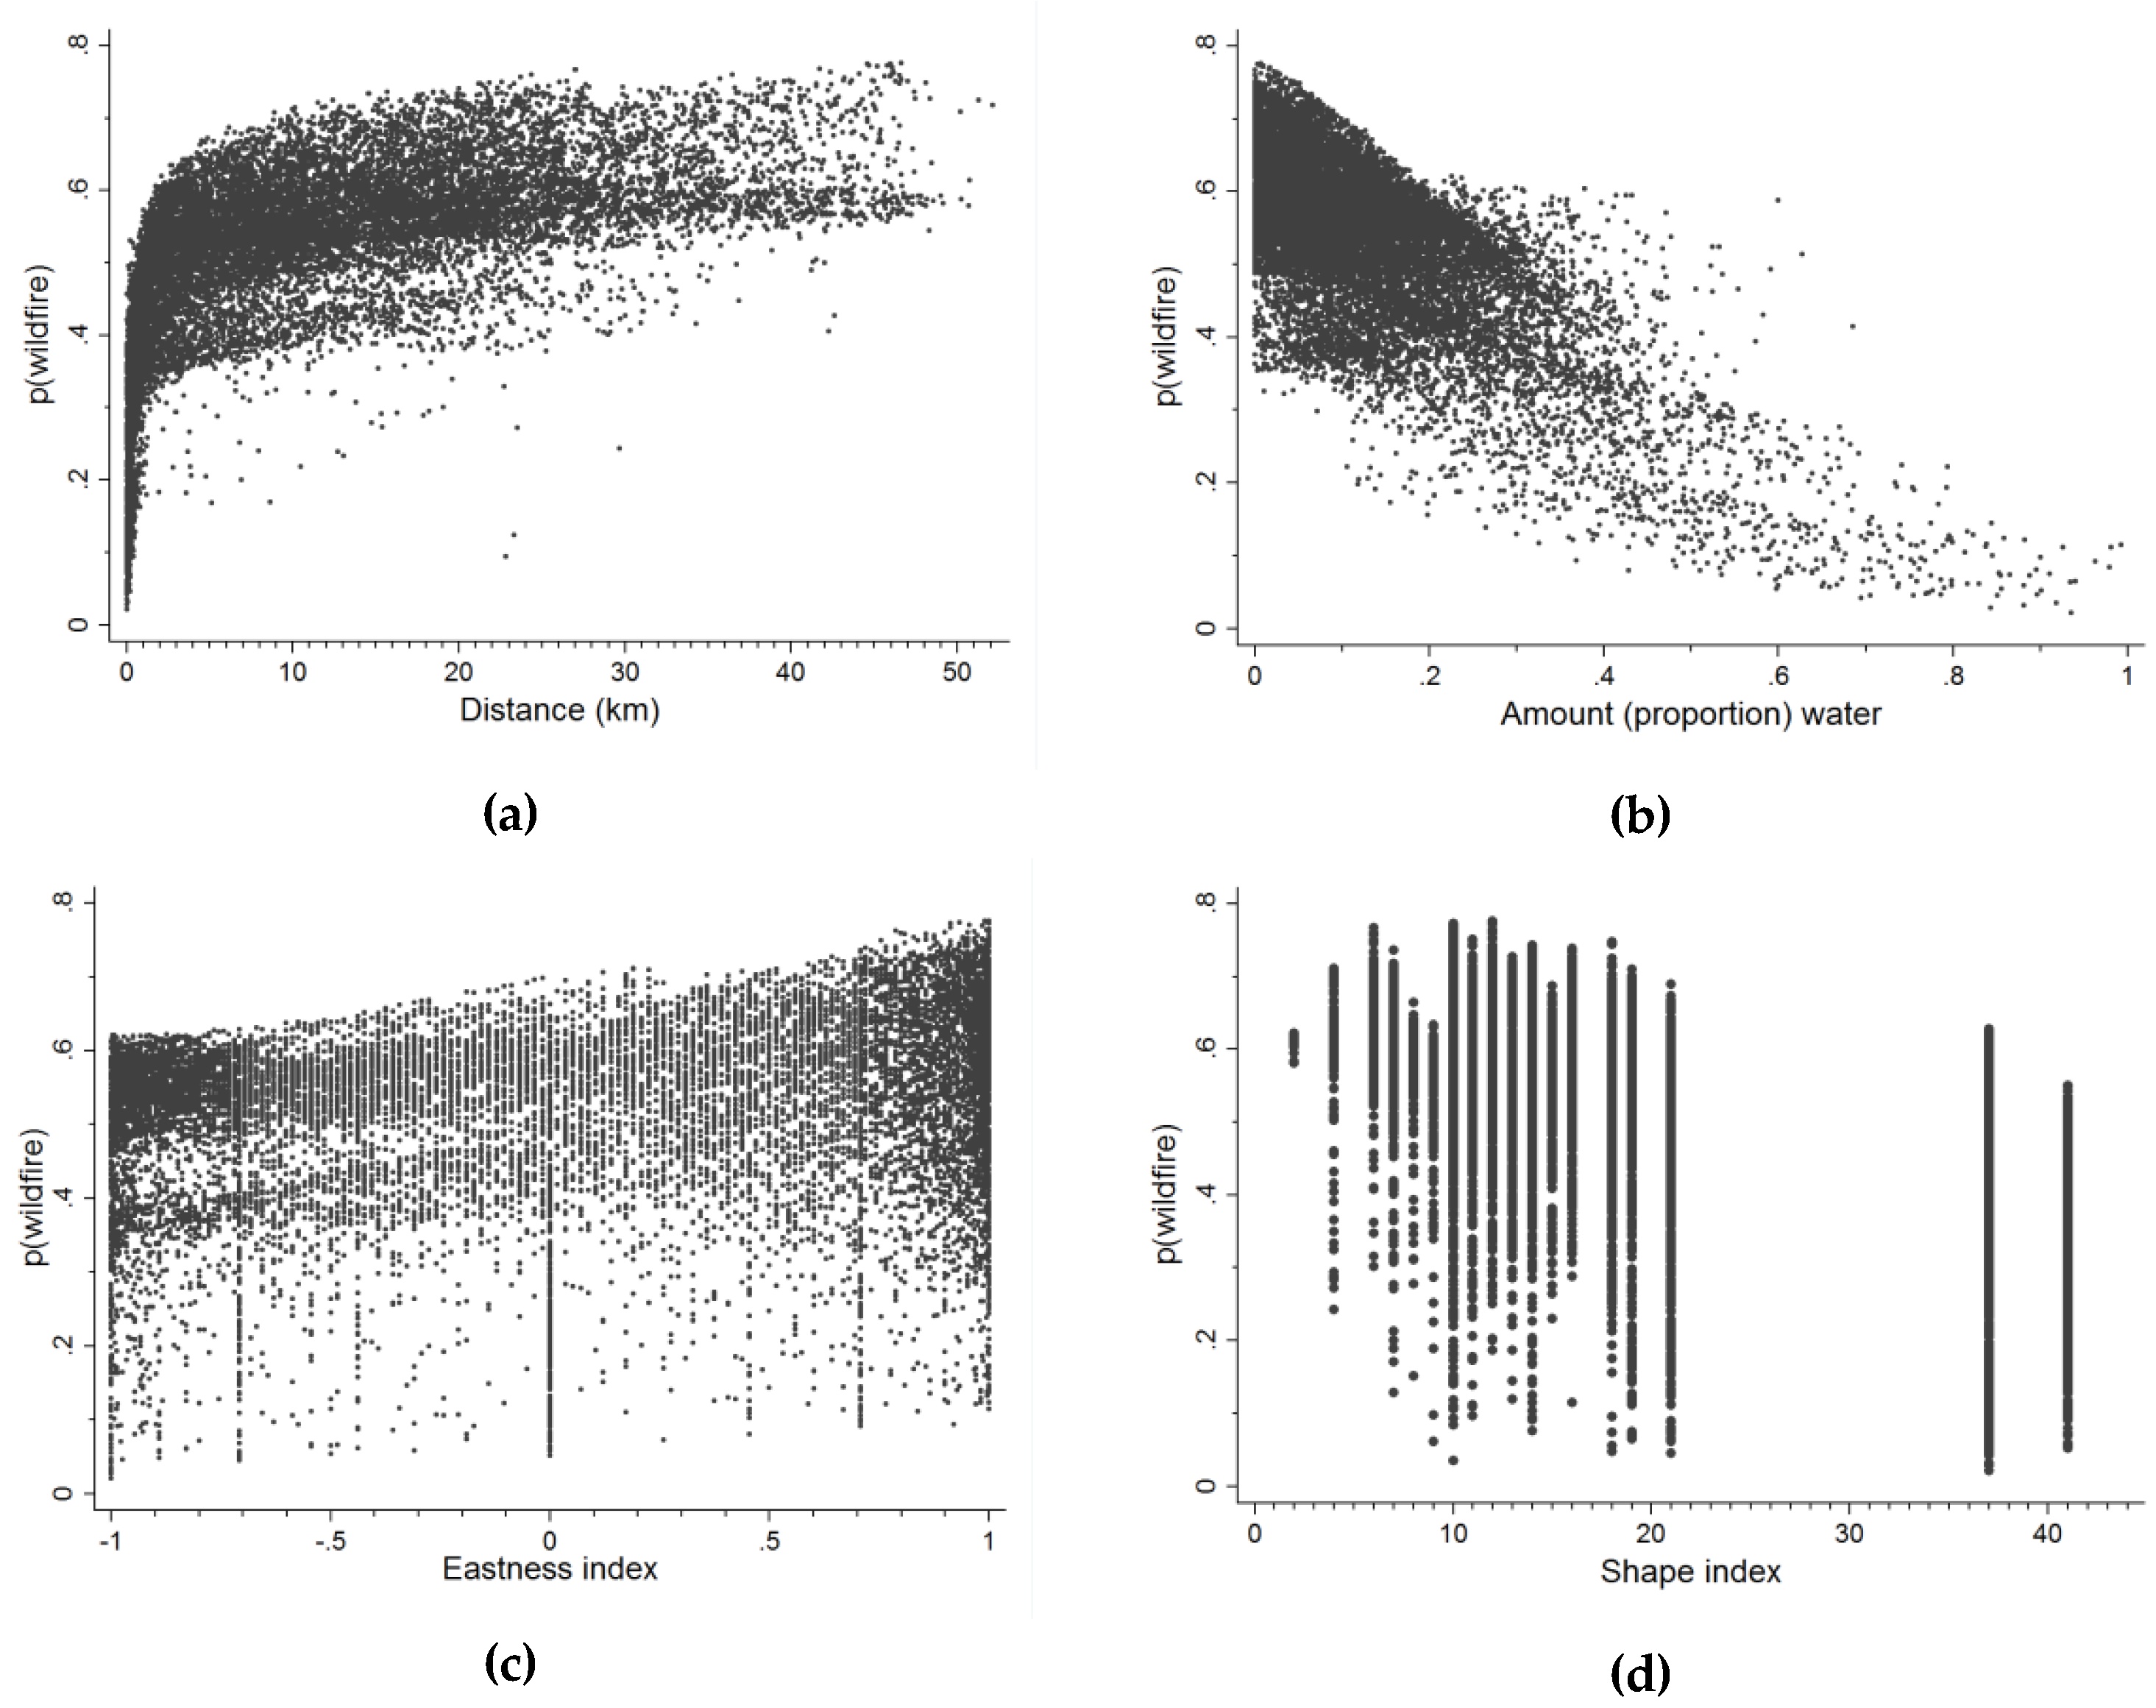
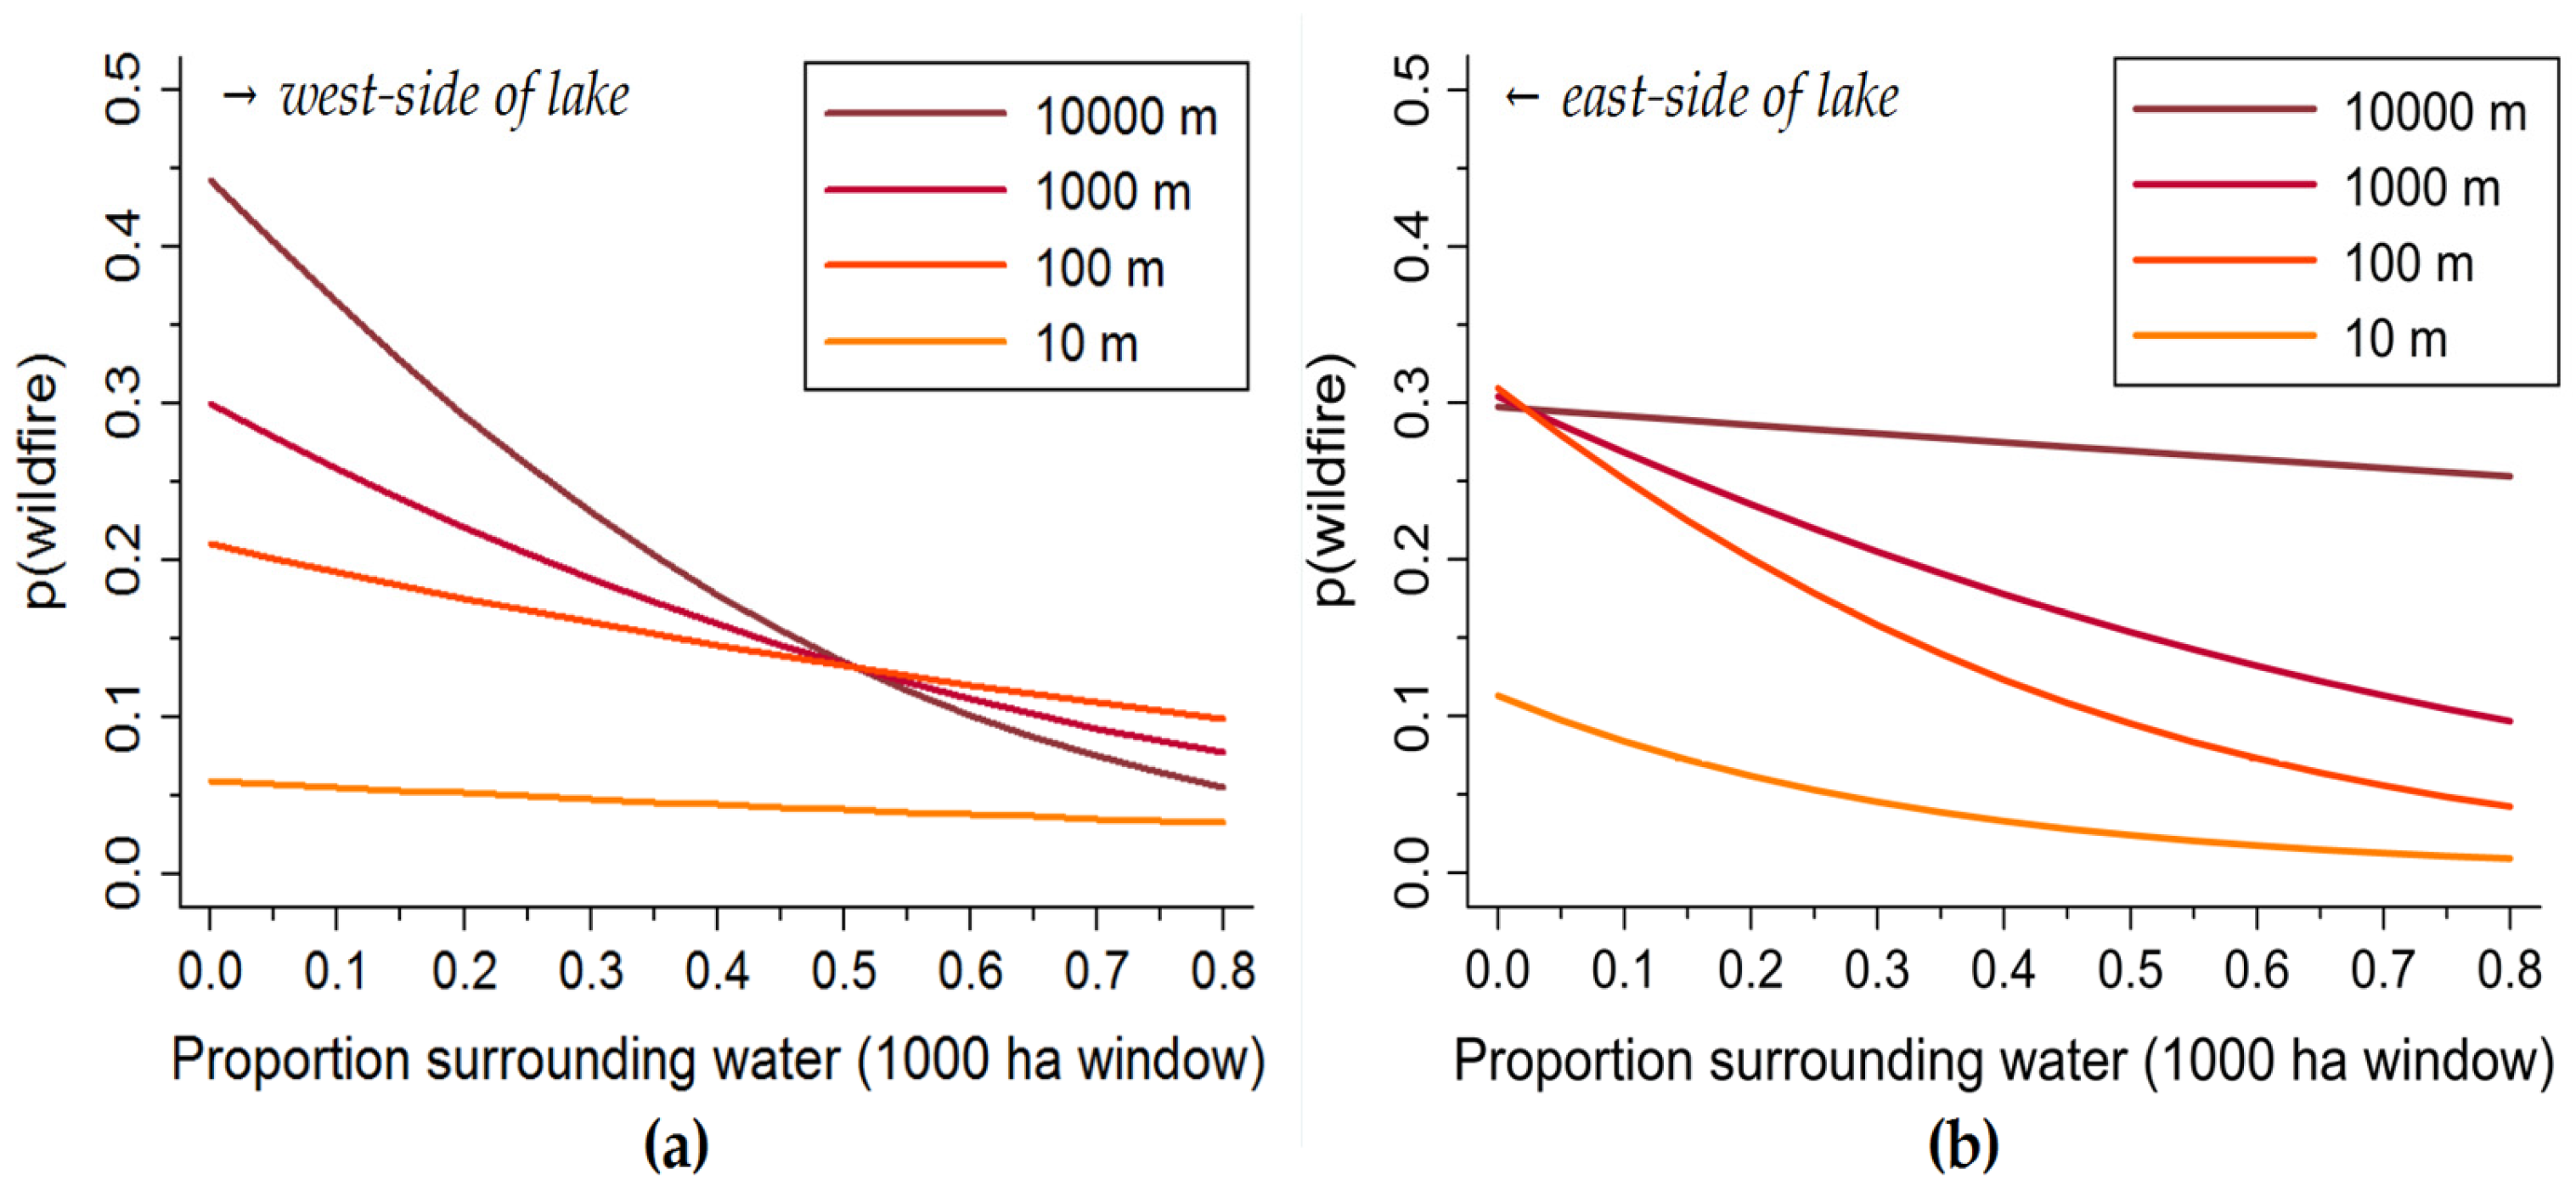
17]. Our results suggest a 3.5-fold increase in risk of wildfire between 10 and 100 m lake distances. The increase in wildfire risk with distance from lakes stabilized at ~2.5 km, which is similar to that reported elsewhere [30].
Amount of open water in the surrounding landscape also influenced wildfire patterns. In northern Saskatchewan’s boreal forest, the amount of surrounding water appears to be as important to wildfire distribution as proximity to lakes. These results are similar to those in boreal Sweden, where mean fire intervals were correlated to wetland density, provided that these wetlands were moist enough to limit fire ignition and spread [18]. Given the strength of this control, fragmented landscapes simply do not burn as well as those with highly continuous fuels. Indeed, the proportion of natural firebreaks is often identified as a key variable explaining broad-scale wildfire patterns in the boreal forests of Canada [31,32]. The specific mechanism by which reductions in wildfire frequency occurs is, however, complex. Not only are lakes (and other non-fuels) limiting the potential spread of large wildfires, but they also eliminate possible sources of ignition. Fire shadows therefore develop from both a lack of ignition in lakes and the impossibility of a fire growing out of the nonfuel [33].
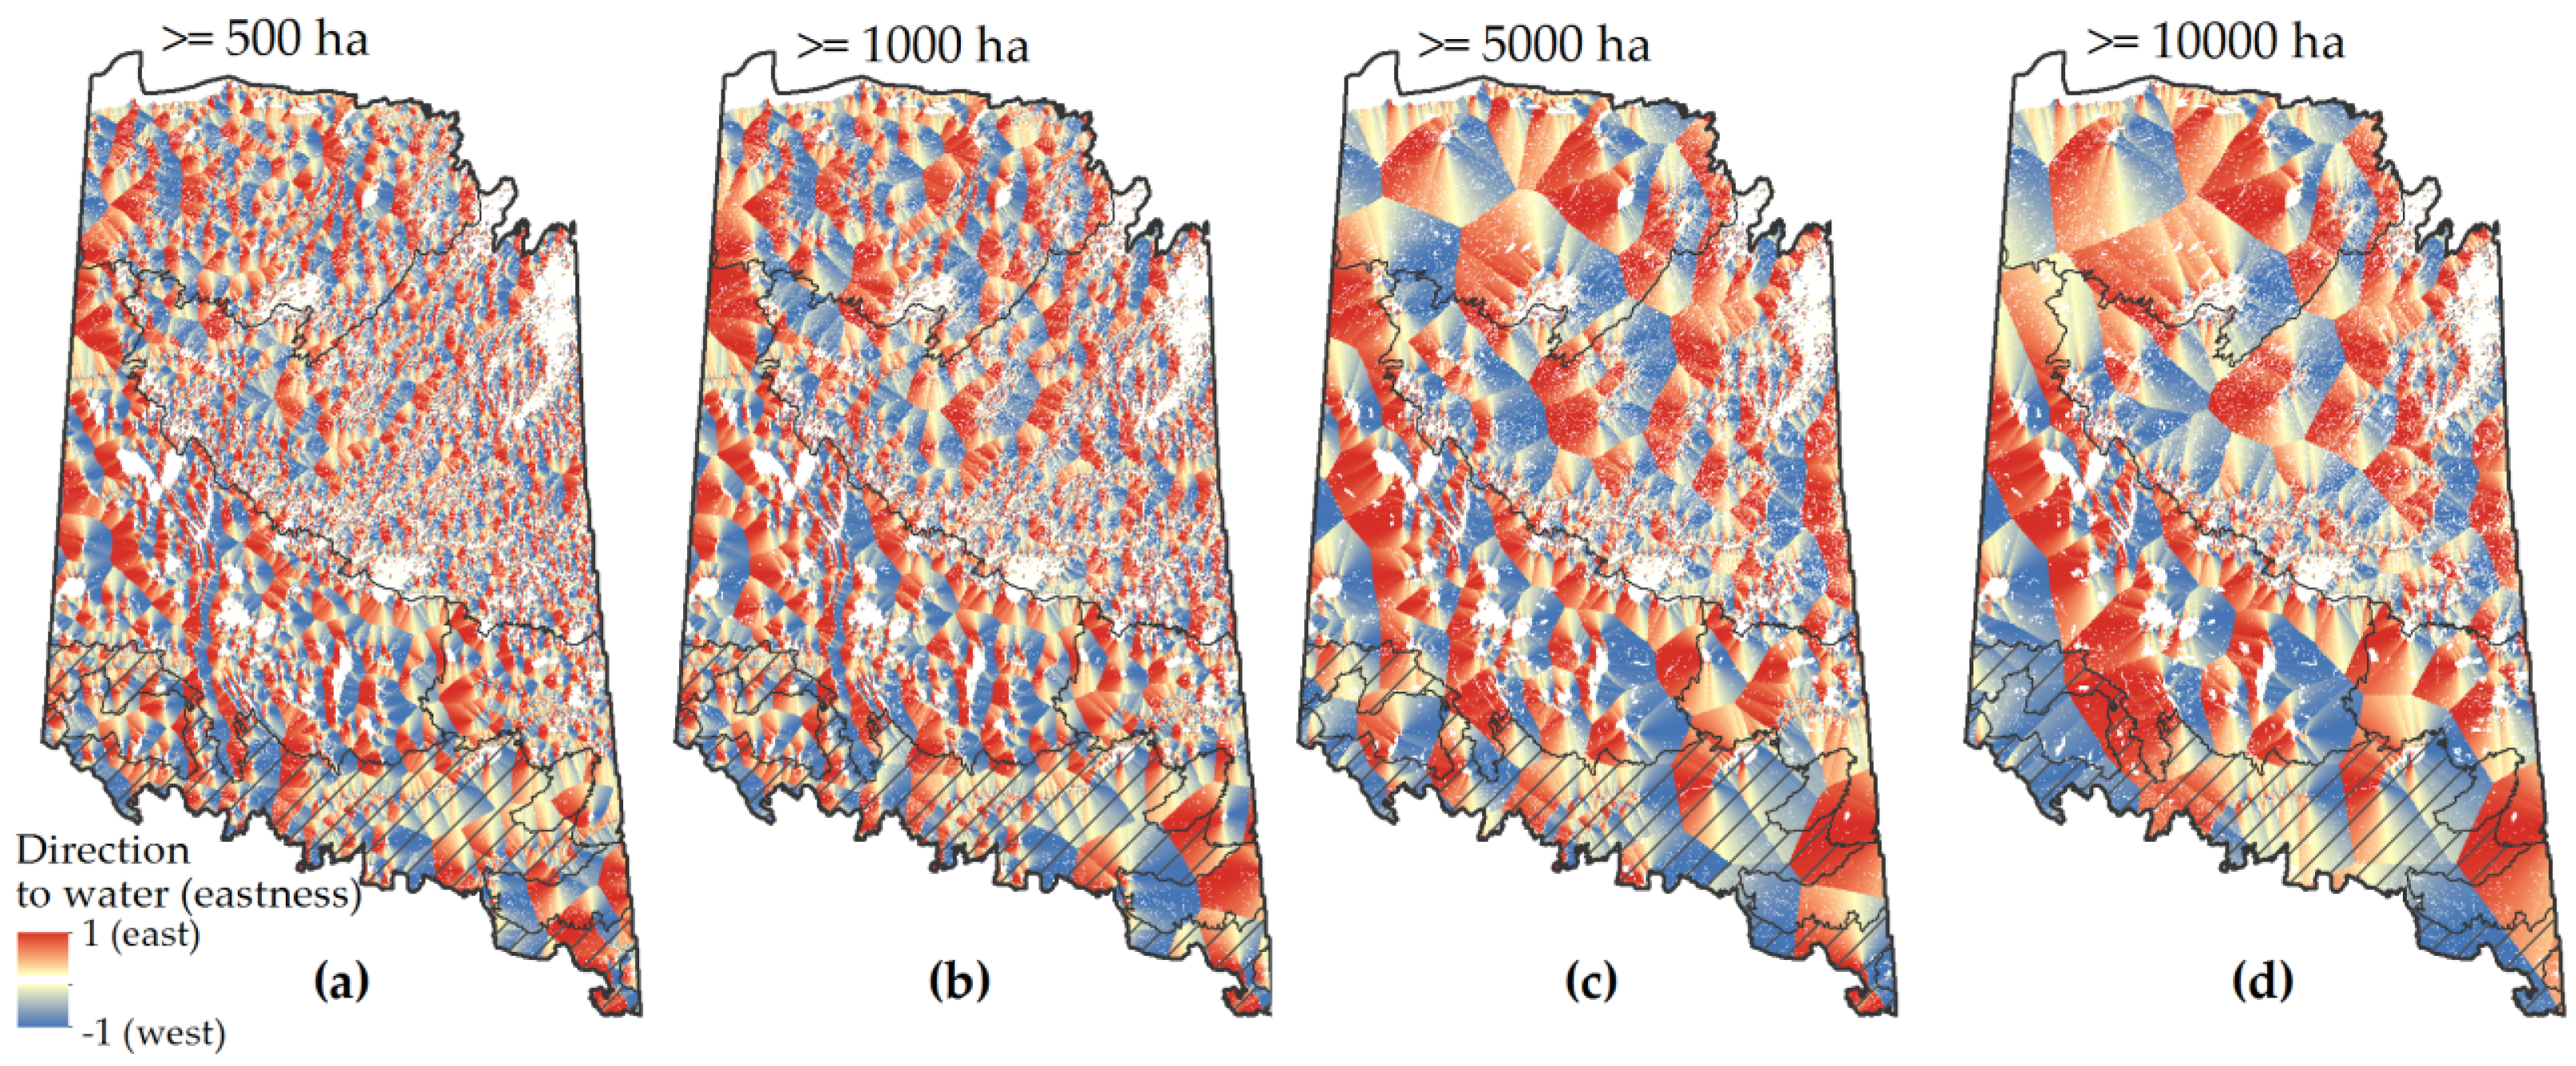
To provide a more comprehensive assessment of the effects of large lakes on boreal wildfire activity, this study incorporated a number of known or suspected factors that affect fire ignition and spread. For instance, our results support others who demonstrate that orientation of landscape features may impede or promote (e.g., river valleys parallel to dominant winds) the spread of large wildfires [12]. Although this remains to be fully investigated in the boreal forest, the orientation of natural firebreaks may not just affect the frequency of wildfires, but also the type. For instance, crown fires may wrap around firebreaks and burn as less-intense surface fires [
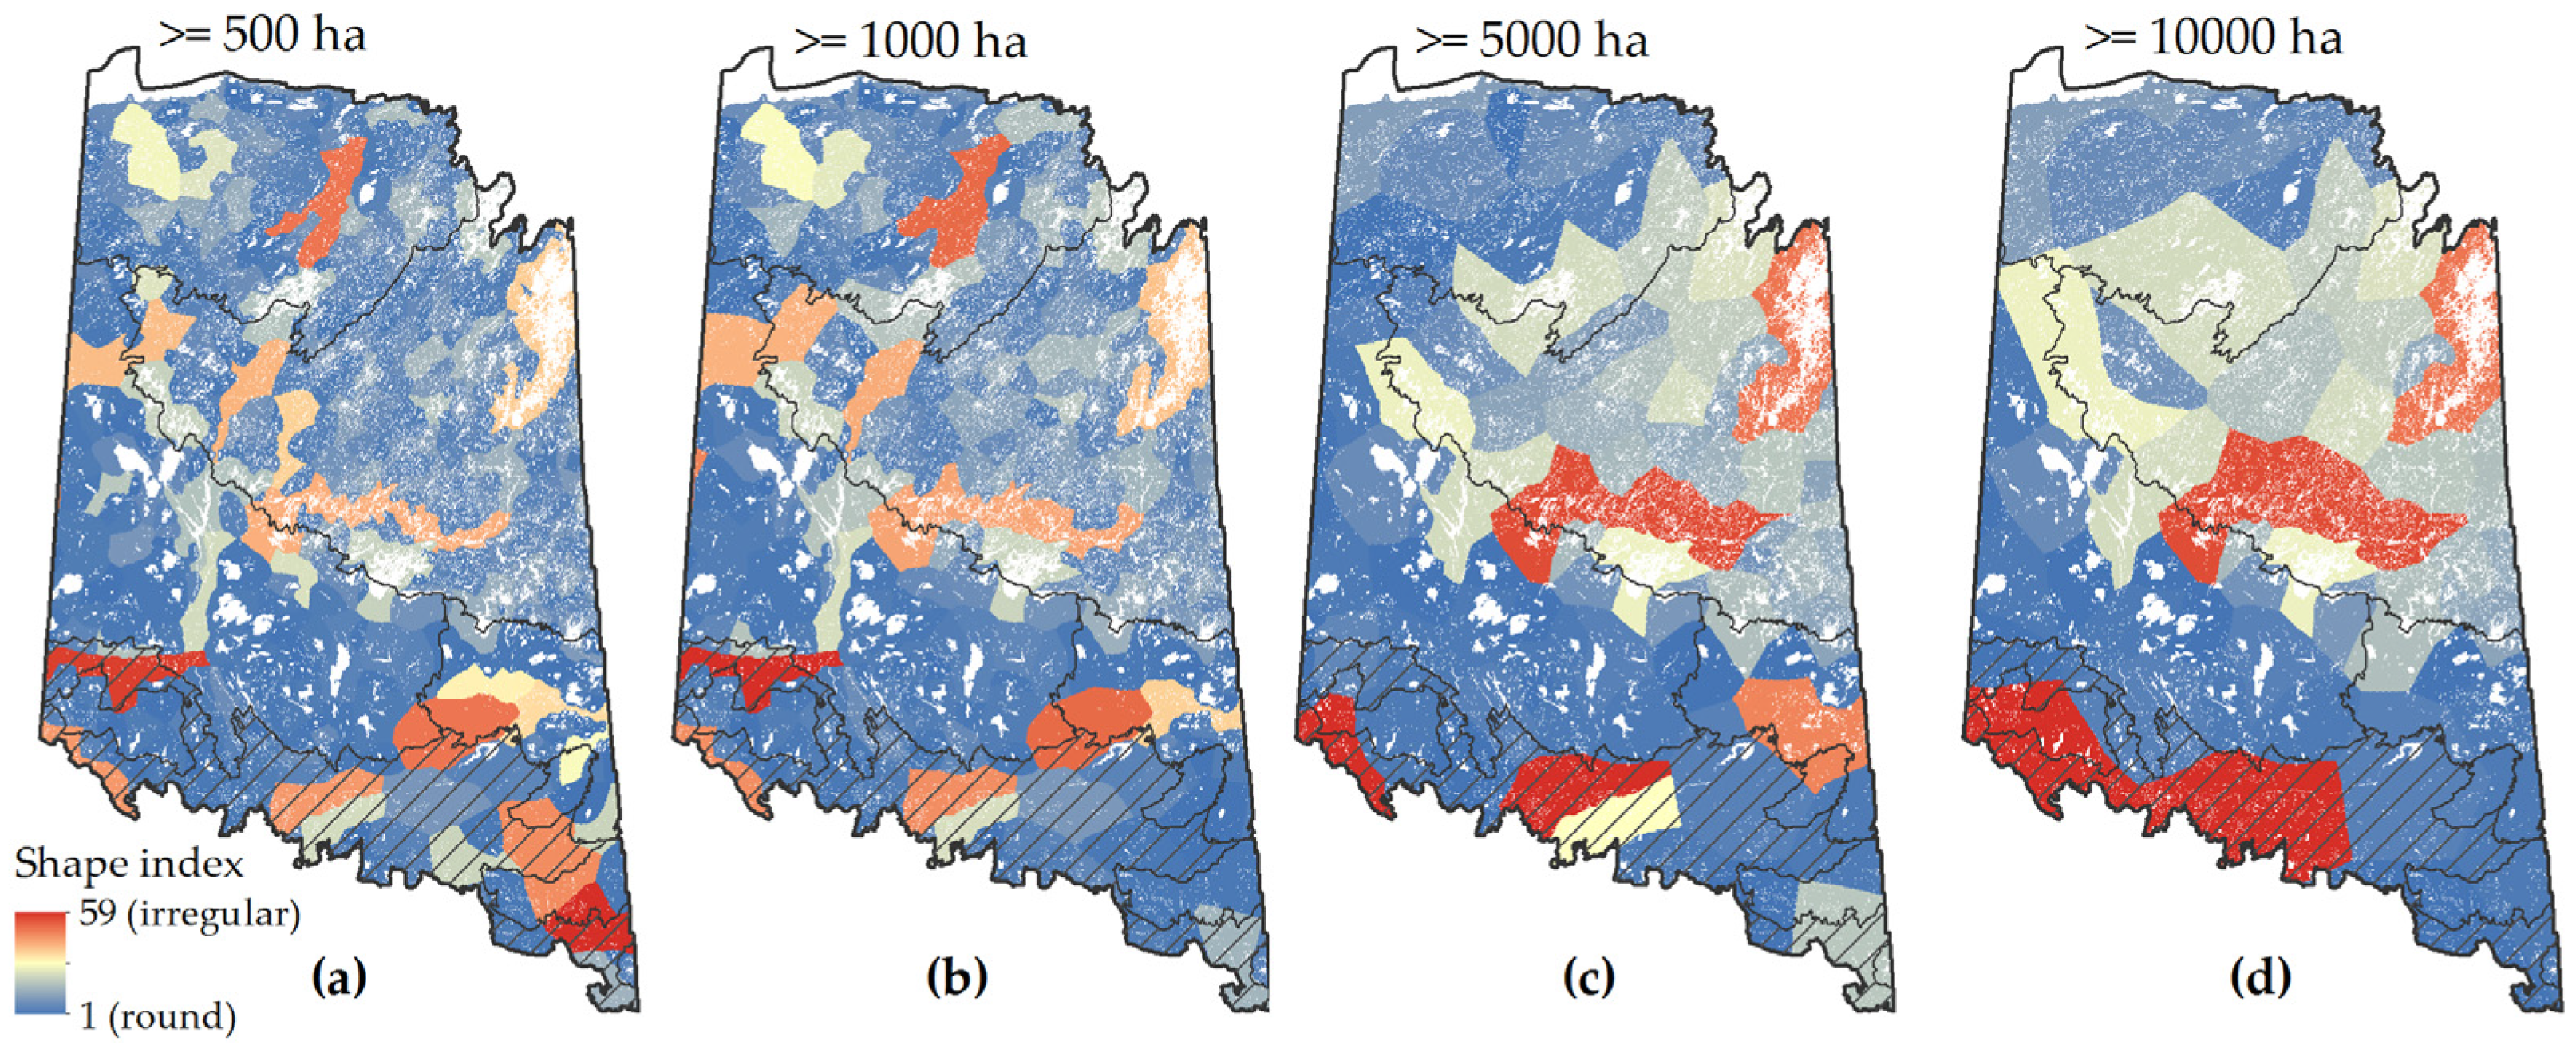
34]. The shape of firebreaks, including lakes, is also important [35]. We found that more irregular-shaped lakes reduce wildfire activity in Saskatchewan, but that the effect of this factor is highly dependent on other factors, notably size and orientation to nearest large lake. For example, elongated features perpendicular to an incoming fire may provide a more effective fuel break than a round-shaped lake [12]. However, if the lake is too narrow wildfires may simply breach (i.e., through fire spotting) the firebreak.
Interactions among factors further highlight the complexity of the relationship between wildfire patterns and natural firebreaks. Interestingly, the top-two most supported interactions in our analysis (amount × direction and distance × direction) include the orientation relative to the lake, which emphasizes the importance of the direction of incoming fires in identifying and predicting potential fire refugia. Whereas our results point to important multiplicative effects between variables, the interpretation of these interactions is not straightforward. For instance, predicted patterns of wildfire probability on the east side of large lakes were less related to distance to lake when amount of surrounding water was low. This could be interpreted as a higher-level interaction among factors. Given the high density of large lakes in the region, the effect of a given lake on wildfire patterns is assuredly influenced by that of nearby lakes. Likewise, we found evidence for three-way interactions that support the idea that there is a high degree of complexity in the fire–environment relationship, which in turn leads to complex landscape patterns [36].
Whereas the likelihood of wildfire occurrence is highly dependent of transient factors, such as forest type [37] and daily fire weather [38], our results highlight the effects of quasi-permanent landscape features that can reduce wildfire likelihood for decades or centuries. Areas close to large or numerous lakes are simply more likely to lead to long-term fire refugia, which can be defined as parts of the landscape where intense crown fires are rare. These areas are therefore likely to support old-growth components that are not common elsewhere in the landscape [39]. Fire refugia have a potentially important—though still poorly understood—role in the maintenance of biodiversity and ecological processes in the boreal forest (but see [40]). In a matrix of high fire frequency, areas of the boreal forest that rarely burn may support isolated populations of organisms not found elsewhere in the landscape. For instance, species ill-adapted to fire, such as balsam fir, have survived on islands of large lakes in northern Québec [41], while common fire-adapted species, such as jack pine, have been absent from fire-sheltered sites for millennia in northern Wisconsin [42]. Spatial variability in wildfire occurrence also affects fundamental ecosystem properties [13] that, in turn, further affect community composition [43].
Results from this modeling study are contingent on their assumptions and data quality. For instance, some wildfire perimeters do not include unburned islands which would attenuate the strength of the effect of islands on wildfire probability. The somewhat coarse resolution of the fire perimeter mapping will invariably affect the strength of the other relationships, although we do not expect these to be directionally biased in a way that adversely affects our inferences. Likewise, we did not consider non-water related variables that are known to affect wildfires (e.g., land cover, daily fire weather, lightning, topography [44]). Lack of inclusion of these factors limits the predictive ability of our models, although the five landscape water variables considered here were predictive and largely supported our hypothesized relationships. Of note is the effect of humans, which is pervasive (if not intense) in the boreal plains portion of our study area [45]. Although large boreal wildfires are virtually uncontrollable and burn more or less “freely” once they escape initial attack, humans may have a subtle yet considerable influence on wildfire activity through direct (igniting or extinguishing fires) or indirect (land-use change) means [46].

5. Conclusions

Natural firebreaks, particularly large lakes, represent a strong bottom-up control on wildfire activity in the boreal forest of Saskatchewan, Canada. Landscape measures of water including presence of islands, amount of surrounding water, and distance and direction from lakeshore interacted to yield highly heterogeneous patterns of wildfire likelihood. These patterns were strongest for lake sizes ≥5000 ha and in the immediate 1000 ha surrounding area. Overall, we found that long-term fire refugia were more likely in places near lakeshores of irregularly-shaped larger (≥5000 ha) lakes and in areas (1000-ha window) surrounded by high amounts of water. This has implications for forest management and conservation of sites most likely to contain old-growth elements.

Acknowledgments

We thank Natural Sciences and Engineering Research Council (NSERC) of Canada for provided funding to support Scott E. Nielsen.

Author Contributions

Scott E. Nielsen, Krista Reinhardt, and Marc-André Parisien conceived and designed the study; Scott E. Nielsen, Evan R. DeLancey, and Krista Reinhardt prepared spatial data; Scott E. Nielsen analyzed the data; Scott E. Nielsen and Marc-André Parisien wrote the paper with contributions from Evan R. DeLancey and Krista Reinhardt.

Conflicts of Interest

The authors declare no conflict of interest.

Appendix A

Table A1, Table A2, Table A3, Table A4 and Figure A1, Figure A2 and Figure A3 contain additional supporting information on landscape variables, model selection, and summary statistics.
Table A1. Evaluation of support for individual two-way interaction terms among landscape water variables that are predicted to affect local occurrence of fires in the boreal forest ecozone of Saskatchewan, Canada between 1980 and 2014. Null model here represents the best fitting model from Table 3 (island presence, amount of surrounding water [1,000 ha], and distance to lake, direction to lake, and shape of nearest lake ≥5000 ha). Models are ranked from most to least supported using Akaike’s Information Criteria (AIC). “Response” represents the direction of response with bold, italicized text supporting our initial hypotheses from Table 3. See Table 3 in the text for definition of terms used in the table. Note that “N.A.” is “not applicable”.
ModelResponseKAICΔAICwi
Amount × DirectionNegative848,198.90.001.00
Distance × DirectionPositive848,218.319.3<0.01
Shape × AmountPositive848,252.653.6<0.01
Direction × ShapeNegative848,255.456.4<0.01
Distance × AmountNegative848,255.856.8<0.01
Null model (water size & amount)N.A.748,256.057.0<0.01
Distance × ShapeN.A.848,258.059.0<0.01
Table A2. Evaluation of support for individual two-way interaction terms among landscape water variables that are predicted to affect local patterns in location of wildfires in the boreal forest ecozone of Saskatchewan, Canada between 1980 and 2014. Null model here represents the best fitting model from Table 4 and null model used in Table A1. Models are ranked from most to least supported using Akaike’s Information Criteria (AIC). See Table 3 in the text for definition of other terms used in the table.
ModelKAICΔAICwi
Top four two-way interactions1148,184.30.00.68
Top three two-way interactions1048,186.32.00.25
Top two two-way interactions948,188.74.40.07
Top single two-way interaction848,198.914.6<0.01
Top five two-way interactions1248,255.871.5<0.01
Null model (water size and amount)748,256.071.7<0.01
Table A3. Evaluation of support for models with three-way interaction terms among landscape water variables that are predicted to affect local patterns in location of wildfires in the boreal forest ecozone of Saskatchewan, Canada between 1980 and 2014. Null model here represents the best fitting two-way interaction model (Table A2). Models are ranked from most to least supported using Akaike’s Information Criteria (AIC). See Table 3 in the text for definition of other terms used in the table.
ModelKAICΔAICwi
4a Amount × Distance × Direction; Amount × Distance × Shape1348,131.50.00.43
5 (all three three-way interactions)1448,132.30.80.29
1 Amount × Distance × Direction 1248,133.41.90.16
4b Amount × Distance × Direction; Amount × Direction × Shape1348,134.12.60.12
4c Amount × Direction × Shape; Amount Dist × Shape1348,181.449.9<0.01
2 Amount × Shape × Distance1248,182.050.5<0.01
3 Amount × Direction × Shape1248,183.652.2<0.01
Null model (top four two-way interactions and linear terms)1148,184.352.8<0.01
Table A4. Summarized model predictions by Ecoregion depicting the likelihood of wildfire over a 35-year period and its associated fire rotation period. Statistics reported include the 1st, 50th, and 99th centiles.
p(wildfire)Fire Rotation Period (Years)
Ecoregion1%50%99%1%50%99%
Mid-boreal Upland0.0940.2680.45078131372
Mid-boreal Lowland0.0110.0360.0824299753253
Churchill River Upland0.2300.5480.7304864152
Athabasca Plain0.4420.7140.841424979
All ecoregions0.0180.4410.82243791909
Figure A1. Direction to nearest water body of defined sizes in the boreal ecozones of Saskatchewan, Canada using an “eastness” index where an east direction is scaled to 1 and a west direction scaled to −1. Threshold water body sizes of: (a) ≥500 ha; (b) ≥1000 ha; (c) ≥5000 ha; (d) ≥10,000 ha. Areas of red color have an east bearing to water, while areas of blue have a west bearing to water (water bodies are shown in white).
Forests 07 00265 g008
Figure A2. Shape index of nearest water body of defined threshold sizes in the boreal ecozones of Saskatchewan, Canada. Shape of water body size threshold of: (a) ≥500 ha; (b) ≥1000 ha; (c) ≥5000 ha; (d) ≥10,000 ha. Areas of red color have more irregular shaped nearby water bodies, while areas of blue have more round-shaped nearby water bodies (water bodies are shown in white).
Forests 07 00265 g009
Figure A3. Distribution (variation) in predicted wildfire likelihood (probability of burning within 35 years, 1980–2014) by ecoregion in Saskatchewan, Canada’s boreal forest based on histograms of model predictions.
Forests 07 00265 g010

References

  1. Stocks, B.J.; Mason, J.A.; Todd, J.B.; Bosch, E.M.; Wotton, B.M.; Amiro, B.D.; Flannigan, M.D.; Hirsch, K.G.; Logan, K.A.; Martell, D.L.; et al. Large forest fires in Canada, 1959–1997. J. Geophys. Res. 2002, 108, FFR 5-1–FFR 5-12. [Google Scholar] [CrossRef]
  2. Parisien, M.-A.; Peters, V.S.; Wang, Y.; Little, J.M.; Bosch, E.M.; Stocks, B.J. Spatial patterns of forest fires in Canada 1980–1999. Int. J. Wildland Fire 2006, 15, 361–374. [Google Scholar] [CrossRef]
  3. Dansereau, P.-R.; Bergeron, Y. Fire history in the southern boreal forest of northwestern Quebec. Can. J. For. Res. 1993, 23, 25–32. [Google Scholar] [CrossRef]
  4. Turner, M.G.; Romme, W.H. Landscape dynamics in crown fire ecosystems. Landsc. Ecol. 1994, 9, 59–77. [Google Scholar] [CrossRef]
  5. Niklasson, M.; Granström, A. Numbers and sizes of fires: Long-term spatially explicit fire history in a Swedish boreal landscape. Ecology 2000, 81, 1484–1499. [Google Scholar] [CrossRef]
  6. Schulte, L.A.; Mladenoff, D.J.; Burrows, S.N.; Sickley, T.A.; Nordheim, E.V. Spatial Controls of Pre–Euro-American Wind and Fire Disturbance in Northern Wisconsin (USA) Forest Landscapes. Ecosystems 2005, 8, 73–94. [Google Scholar] [CrossRef]
  7. Heinselman, M.L. Fire and Succession in the Conifer Forests of Northern North America. In Forest Succession: Concept and Application; West, D.C., Shugart, H.H., Botkin, D.B., Eds.; Springer-Verlag: New York, NY, USA, 1981; pp. 374–405. [Google Scholar]
  8. Bergeron, Y. The influence of island and mainland lakeshore landscapes on Boreal forest fire regimes. Ecology 1991, 72, 1980–1992. [Google Scholar] [CrossRef]
  9. Larsen, C.P.S. Spatial and temporal variations in boreal forest fire frequency in northern Alberta. J. Biogeogr. 1997, 24, 663–673. [Google Scholar] [CrossRef]
  10. Cyr, D.; Bergeron, Y.; Gauthier, S.; Larouche, A.C. Are the old-growth forests of the Clay Belt part of a fire-regulated mosaic? Can. J. For. Res. 2005, 35, 65–73. [Google Scholar] [CrossRef]
  11. Heinselman, M.L. The Boundary Waters Wilderness Ecosystem; University of Minnesota Press: Minneapolis, MN, USA, 1996; pp. 72–73. [Google Scholar]
  12. Mansuy, N.; Boulanger, Y.; Terrier, A.; Gauthier, S.; Robitaille, A.; Bergeron, Y. Spatial attributes of fire regime in eastern Canada: influences of regional landscape physiography and climate. Landsc. Ecol. 2014, 29, 1157–1170. [Google Scholar] [CrossRef]
  13. Wardle, D.A.; Hörnberg, G.; Zackrisson, O.; Kalela-Brundin, M.; Coomes, D.A. Long-term effects of wildfire on ecosystem properties across an island area gradient. Science 2003, 300, 972–975. [Google Scholar] [CrossRef] [PubMed]
  14. Heinselman, M.L. Fire in the Virgin Forests of the Boundary Waters Canoe Area, Minnesota. Quat. Res. 1973, 3, 329–382. [Google Scholar] [CrossRef]
  15. Larson, D.W.; Kelly, P.E. The extent of old-growth Thuja occidentalis on cliffs of the Niagara Escarpment. Can. J. Bot. 1991, 69, 1628–1636. [Google Scholar] [CrossRef]
  16. Frelich, L.E. Forest Dynamics and Disturbance Regimes, 1st ed.; Cambridge University Press: Cambridge, UK, 2002; pp. 1–266. [Google Scholar]
  17. Araya, Y.H.; Remmel, T.K.; Perera, A.H. What governs the presence of residual vegetation in boreal wildfires? J. Georg. Syst. 2016, 18, 159–181. [Google Scholar] [CrossRef]
  18. Hellberg, E.; Niklasson, M.; Granström, A. Influence of landscape structure on patterns of forest fires in boreal forest landscapes in Sweden. Can. J. For. Res. 2004, 34, 332–338. [Google Scholar] [CrossRef]
  19. Loehle, C. Applying landscape principles to fire hazard reduction. For. Ecol. Manag. 2004, 198, 261–267. [Google Scholar] [CrossRef]
  20. Parisien, M.A.; Parks, S.A.; Miller, C.; Krawchuk, M.A.; Heathcott, M.; Moritz, M.A. Contributions of ignitions, fuels, and weather to the spatial patterns of burn probability of a boreal landscape. Ecosystems 2011, 14, 1141–1155. [Google Scholar] [CrossRef]
  21. Parisien, M.-A.; Hirsch, K.G.; Lavoie, S.G.; Todd, J.B.; Kafka, V. Saskatchewan Fire Regime Analysis; Information Report NOR-X-394; Natural Resources Canada, Canadian Forest Service, Northern Forestry Centre: Edmonton, AB, Canada, 2004; pp. 1–49.
  22. Saskatchewan, L.R. Canadian Climate Normals 1981–2010 Station Data. Available online: http://climate.weather.gc.ca/climate_normals/index_e.html (accessed on 16 March 2016).
  23. Government of Canada. Atlas of Canada National Hydro Network. Natural Resources Canada: Edmonton, AB, Canada, 2015. Available online: http://geogratis.cgdi.gc.ca/geogratis (accessed on 1 May 2016). [Google Scholar]
  24. Rempel, R.S.; Kaukinen, D.; Carr, A.P. Patch Analyst and Patch Grid; Ontario Ministry of Natural Resources, Centre for Northern Forest Ecosystem Research: Thunder Bay, ON, Canada, 2012.
  25. StataCorp. Stata: Release 13, Statistical Software; StataCorp LP: College Station, TX, USA, 2013.
  26. Akaike, H. Likelihood of a model and information criteria. J. Econom. 1981, 16, 3–14. [Google Scholar] [CrossRef]
  27. Burnham, K.P.; Anderson, D.R. Model Selection and Inference; Springer: New York, NY, USA, 1998; pp. 1–31. [Google Scholar]
  28. Swets, J.A. Measuring the accuracy of diagnostic systems. Science 1988, 240, 1285–1293. [Google Scholar] [CrossRef] [PubMed]
  29. Manel, S.; Williams, H.C.; Ormerod, S.J. Evaluating presence–absence models in ecology: the need to account for prevalence. J. Appl. Ecol. 2001, 38, 921–931. [Google Scholar] [CrossRef]
  30. Erni, S.; Arseneault, D.; Parisien, M.-A.; Bégin, Y. Spatial and temporal dimensions of fire activity in the fire-prone eastern Canadian taiga. Global Change Biol. 2016. [Google Scholar] [CrossRef] [PubMed]
  31. Boulanger, Y.; Gauthier, S.; Gray, D.R.; Le Goff, H.; Lefort, P.; Morissette, J. Fire regime zonation under current and future climate over eastern Canada. Ecol. Appl. 2013, 23, 904–923. [Google Scholar] [CrossRef] [PubMed]
  32. Parisien, M.-A.; Parks, S.A.; Krawchuk, M.A.; Little, J.M.; Flannigan, M.D.; Gowman, L.M.; Moritz, M.A. An analysis of controls on fire activity in boreal Canada: comparing models built with different temporal resolutions. Ecol. Appl. 2014, 24, 1341–1356. [Google Scholar] [CrossRef]
  33. Parks, S.A.; Miller, C.; Holsinger, L.M.; Baggett, S.; Bird, B.J. Wildland fire limits subsequent fire occurrence. Int. J Wildland Fire 2016, 25, 182–190. [Google Scholar] [CrossRef]
  34. Frelich, L.E.; Lorimer, C.G. Natural disturbance regimes in hemlock-hardwood forests of the upper Great Lakes region. Ecol. Monograph 1991, 61, 145–164. [Google Scholar] [CrossRef]
  35. Andison, D.W. The influence of wildfire boundary delineation on our understanding of burning patterns in the Alberta foothills. Can. J. For. Res. 2012, 42, 1253–1263. [Google Scholar] [CrossRef]
  36. Parisien, M.-A.; Miller, C.; Parks, S.A.; DeLancey, E.R.; Robinne, F.-N.; Flannigan, M.D. The spatially varying influence of humans on fire probability in North America. Environ. Res. Lett. 2016, 11, 075005. [Google Scholar] [CrossRef]
  37. Cumming, S.G. A parametric model of the fire-size distribution. Can. J. For. Res. 2001, 31, 1297–1303. [Google Scholar] [CrossRef]
  38. Flannigan, M.D.; Harrington, J.B. A study of the relation of meteorological variables to monthly provincial area burned by wildfire in Canada (1953–80). Bull. Am. Meteorol. Soc. 1988, 27, 441–452. [Google Scholar] [CrossRef]
  39. Robinson, N.M.; Leonard, S.W.J.; Ritchie, E.G.; Bassett, M.; Chia, E.K.; Buckingham, S.; Gibb, H.; Bennett, A.F.; Clarke, M.F. Refuges for fauna in fire-prone landscapes: Their ecological function and importance. J. Appl. Ecol. 2013, 50, 1321–1329. [Google Scholar] [CrossRef]
  40. Ouarmim, S.; Ali, A.A.; Asselin, H.; Hély, C.; Bergeron, Y. Evaluating the persistence of post-fire residual patches in the eastern Canadian boreal mixedwood forest. Boreas 2015, 44, 230–239. [Google Scholar] [CrossRef]
  41. Sirois, L. Distribution and dynamics of balsam fir (Abies balsamea [L.] Mill.) at its northern limit in the James Bay area. Ecoscience 1997, 4, 340–352. [Google Scholar] [CrossRef]
  42. Lynch, E.A.; Calcote, R.; Hotchkiss, S.C.; Tweiten, M. Presence of lakes and wetlands decreases resilience of jack pine ecosystems to late-Holocene climatic changes. Can. J. For. Res. 2014, 44, 1331–1343. [Google Scholar] [CrossRef]
  43. Clarke, P.J. Habitat islands in fire-prone vegetation: do landscape features influence community composition? J. Biogeogr. 2002, 29, 677–684. [Google Scholar] [CrossRef]
  44. Birch, D.S.; Morgan, P.; Kolden, C.A.; Abatzoglou, J.T.; Dillon, G.K.; Hudak, A.T.; Smith, A.M.S. Vegetation, topography and daily weather influenced burn severity in central Idaho and western Montana forests. Ecosphere 2015, 6, 1–23. [Google Scholar] [CrossRef]
  45. Lehsten, V.; de Groot, W.; Sallaba, F. Fuel fragmentation and fire size distributions in managed and unmanaged boreal forests in the province of Saskatchewan, Canada. For. Ecol. Manag. 2016, 376, 148–157. [Google Scholar] [CrossRef]
  46. Peterson, G.D. Contagious disturbance, ecological memory, and the emergence of landscape pattern. Ecosystems 2002, 5, 329–338. [Google Scholar] [CrossRef]
Figure 1. Location of study area in Saskatchewan, Canada. (a) Boreal and taiga forests of North America (dark gray), Saskatchewan boundary (hollow polygon), and boreal ecozone (crosshatch); (b) Ecozones of Saskatchewan with major lakes and rivers in white; (c) Ecoregions within the boreal ecozone of Saskatchewan where fire patterns were studied (note boundary line delineating plains from shield).
Forests 07 00265 g001
Figure 2. Amount of water in different moving window sizes in the boreal forest of Saskatchewan, Canada. Window sizes include: (a) 1000 ha; (b) 10,000 ha; (c) 100,000 ha. Areas of dark blue represent areas dominated by water, while yellow areas represent areas with very low amounts of surrounding water.
Forests 07 00265 g002
Figure 3. Distance to nearest water body of defined sizes in the boreal forest of Saskatchewan, Canada. Maps represent distance to water at (a) ≥500 ha; (b) ≥1000 ha; (c) ≥5000 ha; (d) ≥10,000 ha. Areas of red are further from water; while areas of blue are close to water (water bodies are white).
Forests 07 00265 g003
Figure 4. Wildfire patterns in the boreal ecoregions of Saskatchewan, Canada between 1980 and 2014. Mapped water bodies are in white. Stippled area represents the Boreal Transition that was removed from analyses due to significant agricultural conversion and few wildfires.
Forests 07 00265 g004
Figure 5. Model predictions of wildfire probability, p(wildfire), at sample locations (25-m pixel) in the Churchill River Upland over a 35-year period (1980–2014) as a function of: (a) distance from lake ≥5000 ha; (b) amount (proportion) of water within 1000 ha; (c) eastness to nearest lake ≥5000 ha (−1 is east side/west bearing to water; +1 is west side/east bearing); and (d) shape of nearest lake ≥5000 ha (larger values are more irregular shaped). Variation in predictions for any one variable represents the effects of other linear and interacting factors.
Forests 07 00265 g005
Figure 6. Model predictions of wildfire probability, p(wildfire), for sites (25-m pixels) within the Churchill River Upland ecoregion over a 35-year period (1980–2014) as a function of the amount (proportion) of water in 1000 ha surrounding windows and distance classes (10, 100, 1000, 10,000 m) to lakes ≥5000 ha for either the west-side of lakes (a) or east-side of lakes (b). All sites were assumed to be mainland sites with lake shape held at its mean value.
Forests 07 00265 g006
Figure 7. Model predictions of the likelihood of a wildfire, p(wildfire), over a 35 year period (1980–2014) as a function of the presence of islands and the amount of water, distance, direction, and shape of nearest large lake. (a) Map of Saskatchewan indicating location of boreal forests (dark gray) and the location of mapped predictions (small black polygon with leader line); (b) predicted probability of wildfire, p(wildfire), per 35-year period for the area around the southern parts of Reindeer Lake in northeast Saskatchewan, Canada.
Forests 07 00265 g007
Table 1. Landscape predictors of wildfire presence based on landscape measures of water bodies, including scale (ha) at which they were measured. All predictor variables were assumed to linearly relate to the probability of wildfire at a site.
Landscape Measure of WaterScales (ha)Prediction (Probability of a Site (25 m Pixel) Burning)
Amount (proportion)1000, 10,000, 100,000Negative—Wildfire decreases as amount of water surrounding a site increases
Distance to (100 m units)Water body: 500, 1000, 5000, and 10,000Positive—Wildfire increases as the distance from water increases
Direction to (eastness index)Water body: 500, 1000, 5000, and 10,000Positive—Wildfire increases as the direction to water becomes more eastern (i.e., west side of lakes)
Shape index (irregularity)Water body: 500, 1000, 5000, and 10,000Negative—Wildfire decreases as shape of water bodies becomes more irregular
IslandsN.A. (binary)Negative—Wildfire decreases on islands after accounting for other landscape measures of water
Table 2. Hypothesized interactions among landscape predictors of wildfire presence based on landscape measures of water bodies. Scale of variables chosen reflects the best fit scale from linear terms.
InteractionsPrediction (Probability of a Site (25-m Pixel) Burning)
Distance × AmountPositive—Wildfire increases more with distance from lakes when surrounded by more water
Distance × DirectionPositive—Wildfire increases more with distance from lakes with an east bearing (west shores that represent the source of prevailing winds)
Distance × ShapeNegative—Wildfire decreases more with distance from lakes when nearby lakes are irregularly shaped
Direction × AmountNegative—Wildfire decreases more on west shores when surrounded by more water
Direction × ShapeNegative—Wildfire decreases more on west shores if nearby lake is irregularly shaped
Shape × AmountNegative—Wildfire decreases more when nearby lake is irregular shaped and surrounded by more water
Amount × Distance × DirectionDistance depends on amount of surrounding water and direction (can be further from east shores when surrounding amount of water is high)
Amount × Distance × ShapeDistance depends on both amount of surrounding water and shape of lakes
Amount × Direction × ShapeDirection depends on amount of surrounding water and shape of lakes
Table 3. Evaluation of lake threshold sizes (scales) on probability of a site being burned in the boreal forest ecozone of Saskatchewan, Canada between 1980 and 2014. Null model represents mean probability of burning across all sites. Models are ranked from most to least supported using Akaike’s Information Criteria (AIC). Number of parameters in the model (K), change in AIC from the top-model (ΔAIC), and Akaike weights (wi) are listed.
Model, Scale (ha)KAICΔAICwi
5000648,466.20.01.00
10,000648,675.0208.8<0.01
500648,833.2367.0<0.01
1000648,857.6391.4<0.01
Null (mean) model157,281.48815.2<0.01
Table 4. Evaluation of different window size thresholds of the amount of surrounding water on wildfire presence (1980–2014) in the boreal forest ecozone of Saskatchewan, Canada. Null model represents the best fitting model using island, distance to lake, direction to lake, and shape of lake with a lake size threshold of 5000 ha (see Table 3). Models are ranked from most to least supported using Akaike’s Information Criteria (AIC). See Table 3 for definition of terms.
Model, Scale (ha)KAICΔAICwi
1000748,256.00.00.99
10,000748,265.69.70.01
100,000748,349.093.0<0.01
Null water size model648,466.2210.2<0.01
Table 5. Model parameters for the most supported model describing the probability of wildfire between 1980–2014 as a function of landscape characteristics of water in the boreal forest of Saskatchewan, Canada. Note parameter coefficient (β) is also reported as an odds ratio. Random intercepts for ecoregions of Mid-boreal Uplands, Mid-boreal Lowlands, Churchill River Upland, and Athabasca Plain were −0.330, −2.569, 1.267, and 1.635, respectively.
95% C.I.Odds
VariableβS.E.LowerUpperratio
Island −0.6840.142−0.962−0.4060.504
Amount of water (1000 ha)−2.1790.190−2.551−1.8060.133
Distance to water (5000 ha)0.3040.0270.2520.3561.356
Direction to water (5000 ha)−0.4200.100−0.615−0.2240.657
Shape of nearby water (5000 ha)−0.0230.002−0.026−0.0200.977
Amount × Direction1.3130.3570.6142.0123.718
Distance × Direction0.3370.0430.2520.4221.401
Amount × Shape0.0110.011−0.0110.0331.011
Direction × Shape0.0050.0020.0020.0091.005
Distance × Amount × Direction−1.3970.193−1.776−1.0190.247
Distance × Amount × Shape0.0120.006<0.0010.0251.012
Intercept−1.075 0.833−2.7060.5580.341

