Article

Spatial Distribution of Soil Nitrogen, Phosphorus and Potassium Stocks in Moso Bamboo Forests in Subtropical China

Key laboratory of Bamboo and Rattan, International Centre for Bamboo and Rattan, Beijing 100102, China
*
Authors to whom correspondence should be addressed.
Forests 2016, 7(11), 267; https://doi.org/10.3390/f7110267
Submission received: 15 August 2016 / Revised: 24 October 2016 / Accepted: 31 October 2016 / Published: 7 November 2016
(This article belongs to the Special Issue Nutrient Cycling and Plant Nutrition in Forest Ecosystems)

Abstract

:
Moso bamboo is famous for fast growth and biomass accumulation, as well as high annual output for timber and bamboo shoots. These high outputs require high nutrient inputs to maintain and improve stand productivity. Soil nitrogen (N), phosphorus (P), and potassium (K) are important macronutrients for plant growth and productivity. Due to high variability of soils, analysing spatial patterns of soil N, P, and K stocks is necessary for scientific nutrient management of Moso bamboo forests. In this study, soils were sampled from 138 locations across Yong’an City and ordinary kriging was applied for spatial interpolation of soil N, P, and K stocks within 0–60 cm. The nugget-to-sill ratio suggested a strong spatial dependence for soil N stock and a moderate spatial dependence for soil P and K stocks, indicating that soil N stock was mainly controlled by intrinsic factors while soil P and K stocks were controlled by both intrinsic and extrinsic factors. Different spatial patterns were observed for soil N, P, and K stocks across the study area, indicating that fertilizations with different ratios of N:P:K should be applied for different sites to maintain and improve stand productivity. The total soil N, P, and K stocks within 0–60 cm were 0.624, 0.020, and 0.583 Tg, respectively, indicating soils were important pools for N, P, and K.

1. Introduction

Soil nitrogen (N), phosphorus (P), and potassium (K) are important macronutrients which can limit or co-limit plant growth [1,2]. Human activities, such as fertilization, reclamation, and weeding, have greatly affected the biogeochemical cycling of N, P, and K, thereby altering the pattern, magnitude, and extent of nutrient limitation on land [3]. Effective, efficient, and site-specific management and estimation of soil N, P, and K have attracted great interests for scientists looking to improve nutrient input efficiency, thus increasing stand productivity and reducing environmental risks [4]. Due to various climatic conditions [5], parent materials [6], topography [7], vegetation types [8], soil texture [9], and land use [10], soils are characterized by a highly spatial and temporal variability. This has made the accurate estimation of spatial nutrient content difficult. However, rational soil management requires a deep understanding of the spatiotemporal variability of soil N, P, K, and their maps. For example, areas of particular concern, such as nutrient deficiency, can be identified. Additionally, soil N and P levels are closely related to soil organic carbon cycling [11], which may lead to dynamic effects on greenhouse gas emissions that potentially result in feedback to global climate change. Therefore, it is necessary to improve our understanding of the spatial distribution of soil N, P, and K stocks when evaluating current and potential soil productivity, identifying potential environmental protections, and assessing climate change [12].
Fast developments of geostatistical techniques, such as kriging [11], have significantly advanced the estimation of spatial variability of soil N, P, and K stocks. The most common interpolation techniques calculate the unmeasured property at a given place using measured neighbours data with a weighted mean [13]. The core of geostatistics is that experimental semivariograms are calculated to analyse the spatial autocorrelation of the edaphic variables and determine the range of spatial dependence [13]. The spatial data structure, choice of variogram models, search radius, and number of closest neighbouring points can determine the performance of Kriging approaches. Compared to other interpolation approaches (e.g., Inverse Distance Weighting and splines methods [14,15]), ordinary kriging (OK) can provide more accurate estimates of the spatial distribution of soil nutrients because: (1) OK can provide the best linear unbiased estimates and information on the distribution of the estimation error [15]; (2) OK has relatively strong statistical advantages [16]. Additionally, OK is easy to conduct with high accuracy compared to other kriging approaches, such as cokriging, universal kriging, and factorial kriging. For example, cokriging requires an additional correlated covariant, which leads to the substantial increase of field and lab work and does not increase the statistical power [15]. Thus, OK has been widely used in spatial interpolation for different soil properties. For example, Liu et al. [11] predicted the spatial patterns of soil N and P stocks for the whole Loess Plateau using OK, and total N and P stocks amounted to 0.217 and 0.205 Pg (1 Pg = 1015 g), respectively. Martín et al. [17] predicted the spatial distribution of soil carbon stocks within 0–30 cm with OK across Spain.
Bamboo is an important forest type in Southern China, representing an area of 6.16 million ha, more than 70% of which are Moso bamboo (Phyllostachys heterocycla (Carr.) Mitford cv. Pubescens) forests. Moso bamboo forests are famous for their rapid growth and fast biomass accumulation. However, annual timber harvest and bamboo shoots remove a large amount of nutrients, which means that Moso bamboo forests require more nutrient input compared to other forest types in order to maintain high stand productivity. Consequently, intensive management with fertilization, reclamation, and regular understory removal is becoming increasingly popular in Southern China, especially in the main bamboo producing provinces, such as Zhejiang and Fujian Provinces [18,19,20]. These activities have significantly changed the nutrient levels by affecting the microbial processes, soil structures, and chemical compositions [21,22]. Although many studies focus on the spatial patterns of soil N, P, and K stocks in different ecosystems [23,24], site specific maps of soil N, P, and K stocks for scientific management of Moso bamboo forests are still lacking in our study area. In contrast, a better understanding of the spatial distribution of soil N, P, and K stocks is strongly required for land management and for maintaining and improving stand productivity of Moso bamboo forests. Therefore, the objectives of this study were to: (1) predict the spatial variability of soil N, P, and K stocks of Moso bamboo forests in Yong’an City, China and (2) estimate total soil N, P, and K stocks within 0–60 cm.

2. Materials and Methods
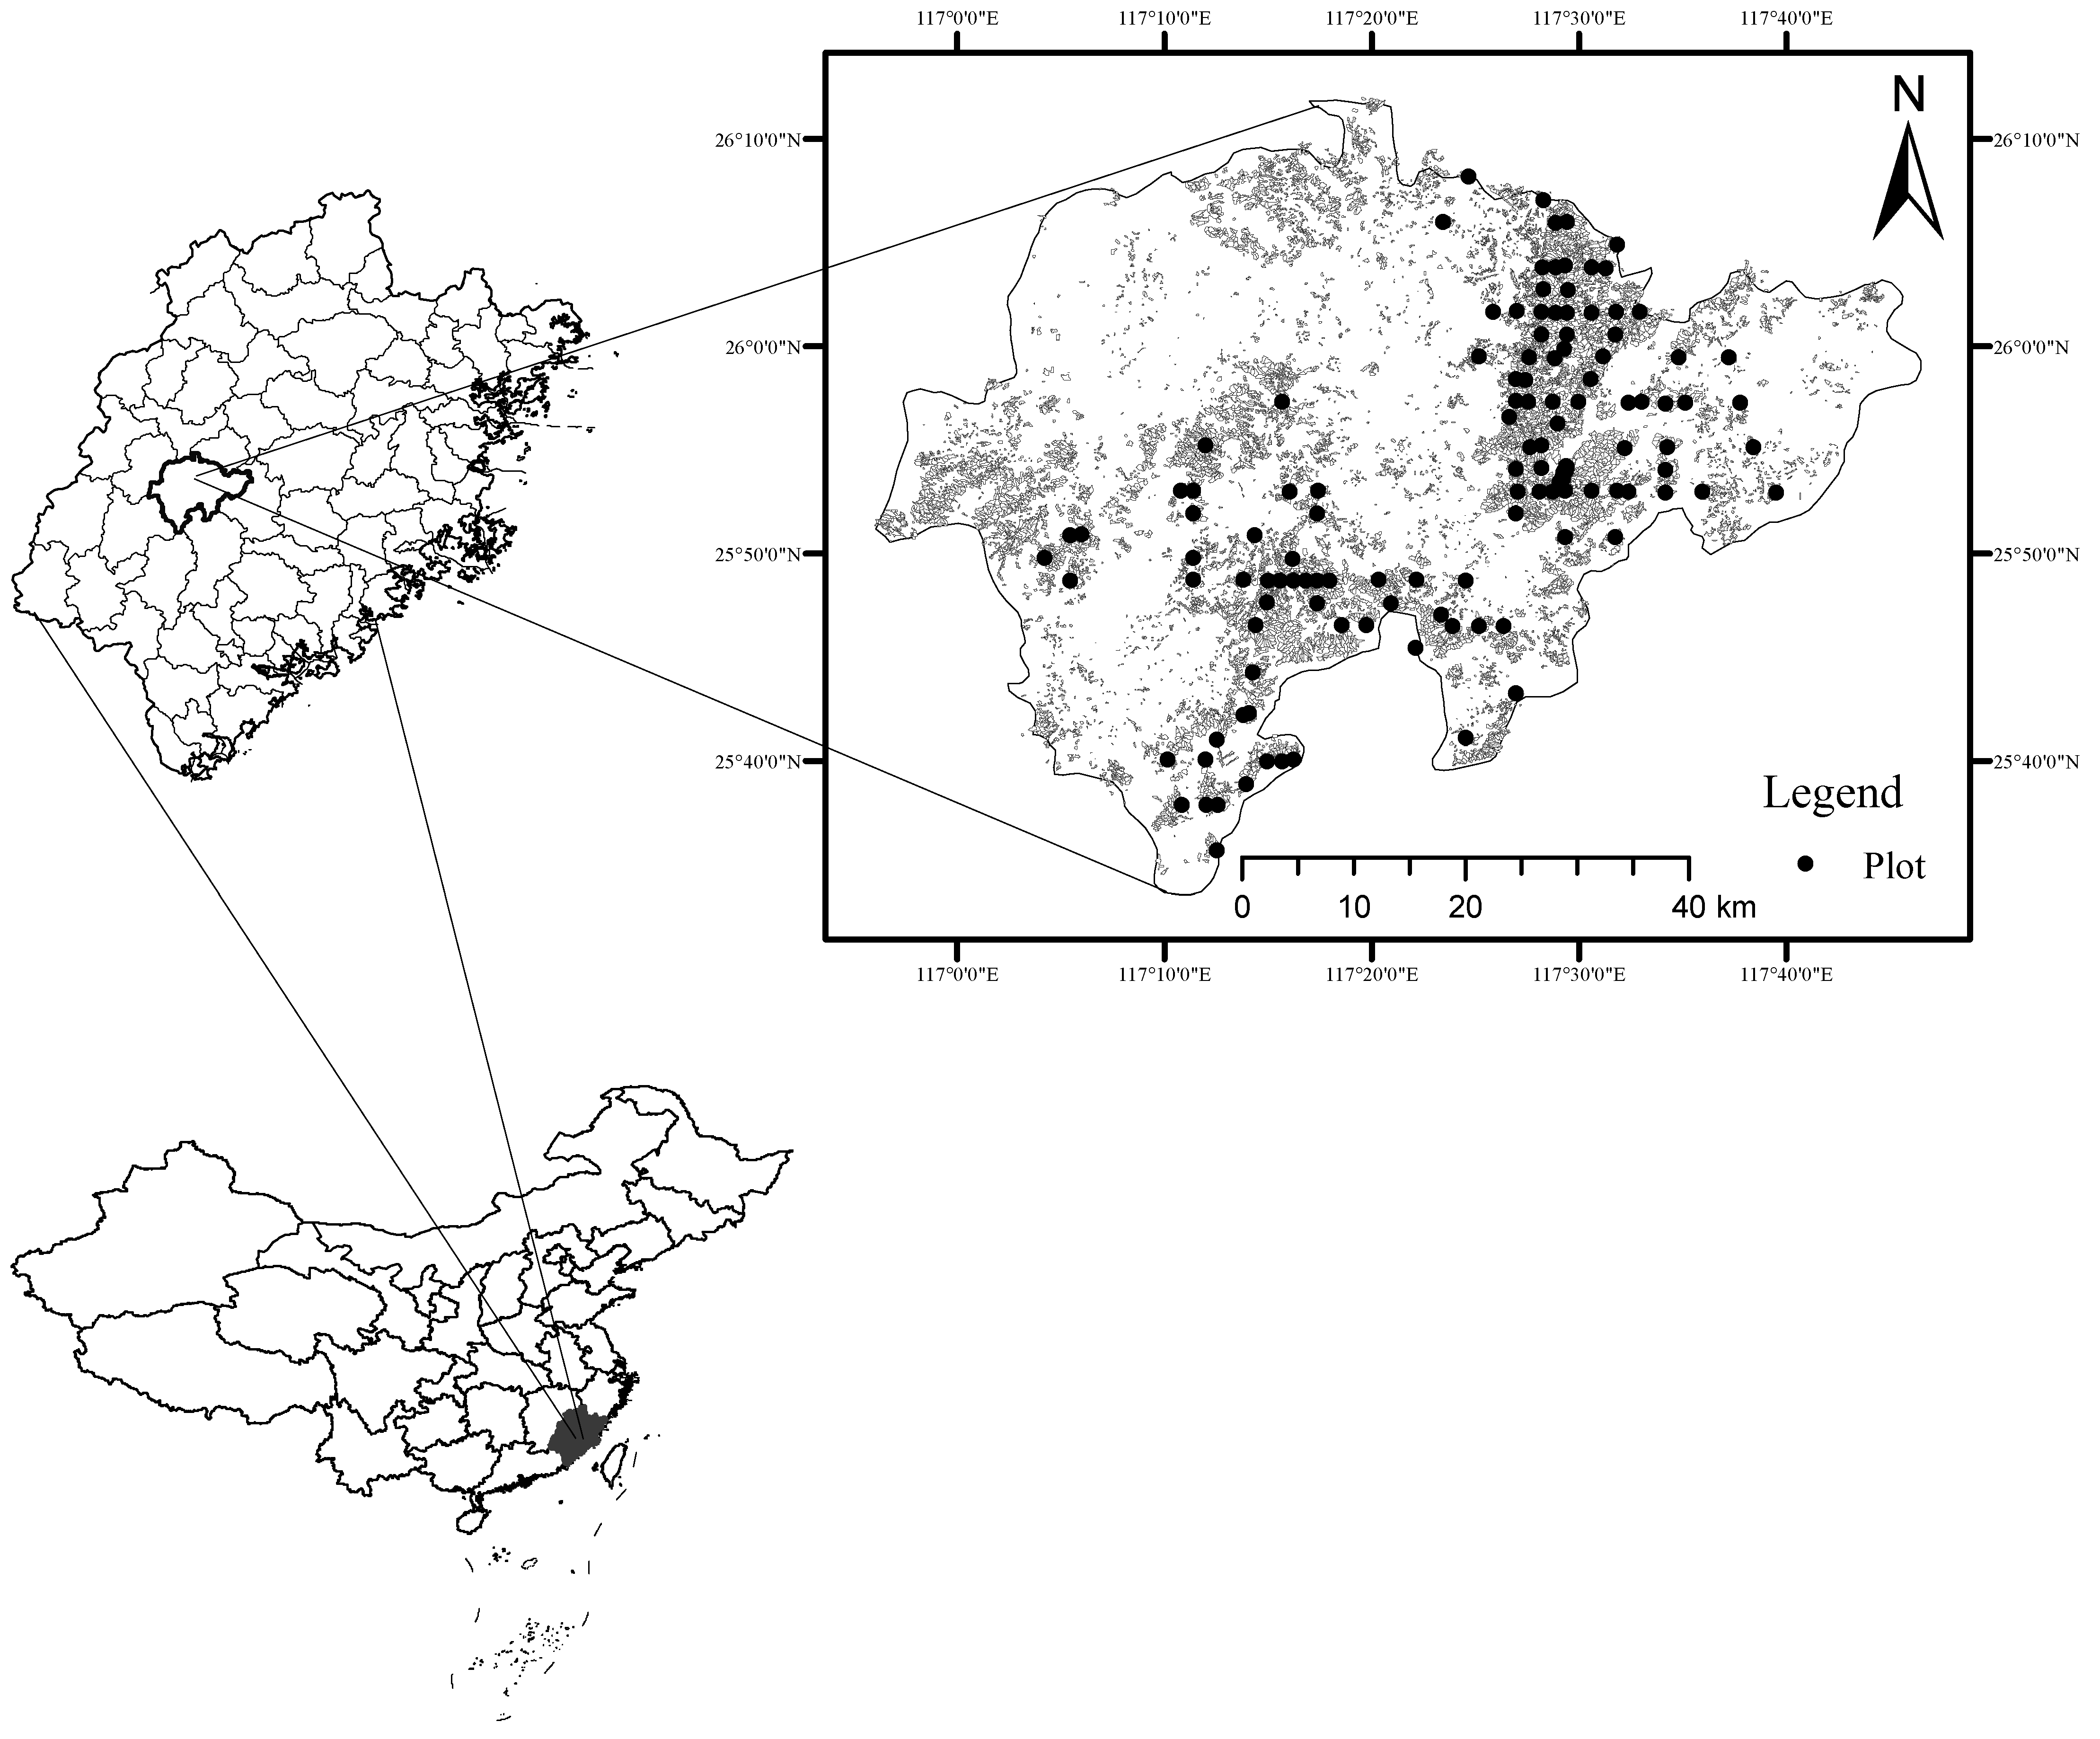
2.1. Study Area

The study was conducted in the Moso bamboo forests (Figure 1, polygons) across Yong’an City, Fujian Province, Southern China (117°56′–117°47′ E, 25°33′–26°12′ N). It has a subtropical southeast monsoon climate with a mean annual temperature of 19.3 °C, while the lowest temperature is −11°C and the highest temperature is 40 °C. The average annual precipitation is about 1600 mm [25,26]. The elevation of the study area ranged from 580 m to 1605 m above sea level [25]. The accumulated temperature of ≥10 °C is 4520–5800 °C, lasting for 225–250 days, and the relative humidity is about 80% [25]. The main soil type is Oxisol. Yong’an City has a forest cover of 82%, including an area of 5.85 × 10⁴ ha of Moso bamboo forests [26]. Moso bamboo forests are mainly distributed below 800 m, most of which are pure stands and sometimes mixed with Keteleeria cyclolepis Flous., Cunninghamia lanceolata (Lamb.) Hook., Myrica rubra (Lour.) S. et Zucc., Choerospondias axillaris (Roxb.) Burtt et Hill., Liriodendron chinense (Roxb.) Burtt et Hill., and Schima Superba Gardn. et Champ., etc. To improve the stand productivity and increase the income, fertilization treatment has been widely applied in most of the Moso bamboo forests. The fertilization treatment was conducted across the whole study area using the same protocol established by the local Forest Bureau. Similar fertilization types—organic fertilizers with N, P, and K addition, were offered every year by the Forest Bureau because the residents can get an economic subsidy if they follow the protocol and use the recommended fertilizers.

2.2. Soil Sampling

The representative soils were sampled in the sub-compartments of forest resource management sites in Fujian province, China. These sample sites are established by the local Forest Bureau for soil mapping according to the protocol of forest management inventory [27] (Figure 1). In the targeted sub-compartments, a total of 138 sites were selected and a cluster of three circular plots with a size of 33.3 m2 were established for each site. Due to the unfavourable access of sampling plots, most of the samples were collected in the East and Southern portions of the study area, which covered 78% of the total Moso bamboo forests. Thus, it is acceptable with these plots to study the spatial distribution of soil N, P, and K stock across the whole study area using the unbiased interpolation approach of OK (see below).
In each plot centre, soils were sampled down to 60 cm by the consideration of three layers: 0–20 cm, 20–40 cm, and 40–60 cm. In the field, soil samples in the sample layer were mixed for one cluster of the three circular plots. In the laboratory, soil samples were air-dried at room temperature and prepared for sieving through 2-mm and 0.15-mm for N, P, and K content analysis. Identifiable plant residues and root materials were removed during sieving. Because the majority of bamboo roots were distributed within 0–40 cm [28], soil samples down to 60 cm were able to meet the research purpose to study spatial patterns of soil N, P, and K stocks. Soil bulk density was determined by a cutting ring approach for each soil layer [29]. During the implementation of fertilization, stones and rocks were removed in Moso bamboo forests. As a result, few stones and rocks were observed in core samples, thus, we did not correct for gravel content. Additionally, site information about elevation, coordinate, soil depth, soil type, soil organic matter content, and bamboo diameters were recorded and determined.
Soil N content (g kg−1) was analysed using the Kjeldahl digestion procedure (5 mL concentrated H2SO4, 1 g of soil passed through a 0.15-mm sieve, heated for 90 min, titrated with 0.2 mol L−1 standardized Na2B4O7). Soil total phosphorus concentration (g kg−1) was determined by alkaline digestion (NaOH 0.2 g, <0.25 mm soil 0.25 g, 300 °C for 15 min and then 750 °C for 15 min) followed by molybdate colorimetric measurement. Soil K content (g kg−1) was determined by sodium hydroxide flame photometer (NaOH 0.2 g, <0.25 mm soil 0.25 g, 300 °C for 15 min and then 750 °C for 15 min, 80 °C water 10 mL). All the analyses followed the national standard protocol of China [29].
Thus, soil N, P, and K stocks were calculated as [30,31,32]:
S O N   ( or   P   or   K )   stock   =   S O N   ( P , K )   ×   B D   ×   D / 10
where SON (or P or K) are the soil N, P, and K contents (g kg−1); BD is bulk density (g cm−3); D is the depth of soil layer (cm). Total soil N, P, and K stocks within 0–60 cm were summed for all soil layers.

2.3. Statistical and Geostatistical Analyses

A standard statistical analysis (mean, standard deviation, first quartile, third quartile, etc.) was conducted in R to illustrate trends of the soil N, P, and K stocks [33]. The coefficient of variation (CV) was used to describe the degree of general variation. To meet the assumption of normality for geostatistical analysis, the raw data was log-transformed and transformed back by weighted mean in GS + 10.0 [34]. OK was performed in GS + 10.0 and the distribution maps of soil N, P, and K stocks were produced in ArcGIS 10.2 [35].

2.4. OK

In the last several decades, many spatial interpolation approaches have been developed, such as kriging; OK normally performed better and is easier to apply compared to other approaches, thereby it has been widely used in the spatial interpolation of soil properties [11,17,23]. In the OK process, semivariograms are used to describe the spatial autocorrelation and provide parameters for optimal spatial interpolation based on the theory of regionalized variables [36]. Well-known theoretical models (e.g., exponential, Gaussian, and spherical models) are commonly used to fit the experimental semivariograms [37]. The experimental semivariograms are expressed as a function of the distance between the sampled points and calculate the integrity of spatial continuity in one or multiple directions using the following expression [38]:
γ ( h ) = 1 2 N ( h ) i = 1 N ( h ) [ z ( x i ) z ( x i + h ) ] 2
where z (xi), and z (xi + h) are values of z at locations xi and xi +h, respectively; h is the lag, and N(h) is the number of pairs of sample points separated by h. In this study, spherical, exponential, linear and Gaussian models were used to attempt to describe the semivariograms of soil N, P, and K stocks within 0–60 cm, then the best models determined by the smallest residuals and the largest determination coefficients were selected for spatial interpolation.
In the semevariograms, three major parameters were derived—the nugget (C0), the sill (C + C0), and the range (A0)—in order to identify the spatial structure of soil N, P, and K stocks at a given scale. The sill (C + C0) represents the total variation and the ratio of nugget and sill is considered as a criterion to classify the spatial dependence [17]. The range (A0) represents the separation distance when semivariogram is stabilized, beyond which the measured data are spatially independent [39]. More details about semivariograms and the kriging approach can be found in Goovaerts [37]. In our study, OK was applied for the spatial patterns of soil N, P, and K stocks. The most likely value which could be expected in a particular grid cell when using m neighbouring observations was defined as [17]:
R ( x ) = j = 1 m δ j z ( x i )
where δ j means the optimal weight under the condition of δ j = 1 , m = 16 in this study.

2.5. Model Validation

To evaluate the prediction accuracy of soil N, P, and K stocks, leave-one-out cross-validation was used [11,17,40]. In the validation process, one datum was omitted and this value was estimated by the remaining data. Thereafter, the estimated value was compared with the real value of the omitted point [17]. This process was repeated for all the observations. Four commonly used indices (i.e., absolute mean error (AME), mean error (ME), root mean square error (RMSE), and determination coefficient (R2)) were used to compare the interpolation accuracy. These indices were calculated as follows [11,15]:
AME = 1 n i = 1 n | ( P i M i ) |
ME = 1 n i = 1 n ( P i M i )
RMSE = 1 n i = 1 n ( P i M i ) 2
R 2 = 1 i = 1 n ( P i M i ) 2 i = 1 n ( M i M ¯ ) 2
where Pi, Mi, and M ¯ are predicted values, measured values, and the mean values of the measured data, respectively.

3. Results and Discussion

3.1. Descriptive Statistics

The summary of statistics of soil N, P, and K stocks within 0–60 cm is shown in Table 1. N stock in Moso bamboo forest increased from a minimum of 5.30 Mg ha−1 to a maximum of 20.20 Mg ha−1 with an average of 11.57 Mg ha−1. These values fell within the range of N stocks in different forest types across China (1.0–49.9 Mg ha−1) [41]. However, the mean N stock was even higher than the average N stock of China’s forests within one meter (8.4 Mg ha−1) [41] and the Moso bamboo in Jiangxi Province (2.82 Mg ha−1 within 60 cm) [42]. These differences were mainly attributed to the fertilization application in Moso bamboo forests in the study area, whereas no stand management occurs in most of China’s forests.
Soil P stock ranged from 0.18 to 0.68 Mg ha−1 and the mean value was 0.38 Mg ha−1. Although this range lied within the reported values of main Chinese soil types, the mean value was much lower than the average across China (6 Mg ha−1 within 60 cm) [43]. Similarly, average soil K was 10.80 Mg ha−1 and the lowest soil K stock was 5.73 Mg ha−1 and highest soil K stock was 18.72 Mg ha−1, which were lower than soil K stocks in subtropical forests in China [44]. These low values of soil P and K stocks may be related to the high output of P and K due to the high output of timber and bamboo shoots every year. In Moso bamboo forests, P is the most limited nutrient for stand productivity [4]. Although fertilization was applied in Moso bamboo forests, P and K input could not compensate for the P and K output from the stand. This result further indicated that more P and K fertilization should be applied in Moso bamboo forest in order to maintain and improve stand productivity.
A CV of 10% indicates a low variability and 10%–90% indicates a moderate variability, and CV >90% indicates higher variability [45]. In this study, the CVs of soil N, P, and K stocks were 28%–29%, indicating a moderate variability of soil N, P, and K stocks within 0–60 cm. p values of Shapiro-Wilk test were 0.053 for N stock, 0.010 for P stock, and 0.014 for K stock, indicating a normal distribution of N stock and a non-normal distribution of P and K stocks at a significance level of 0.05. However, in order to make the comparison of spatial interpolation of soil N, P, and K stocks consistent, a natural log-transformation was conducted for the three stocks in order to meet the assumption of normal distribution.

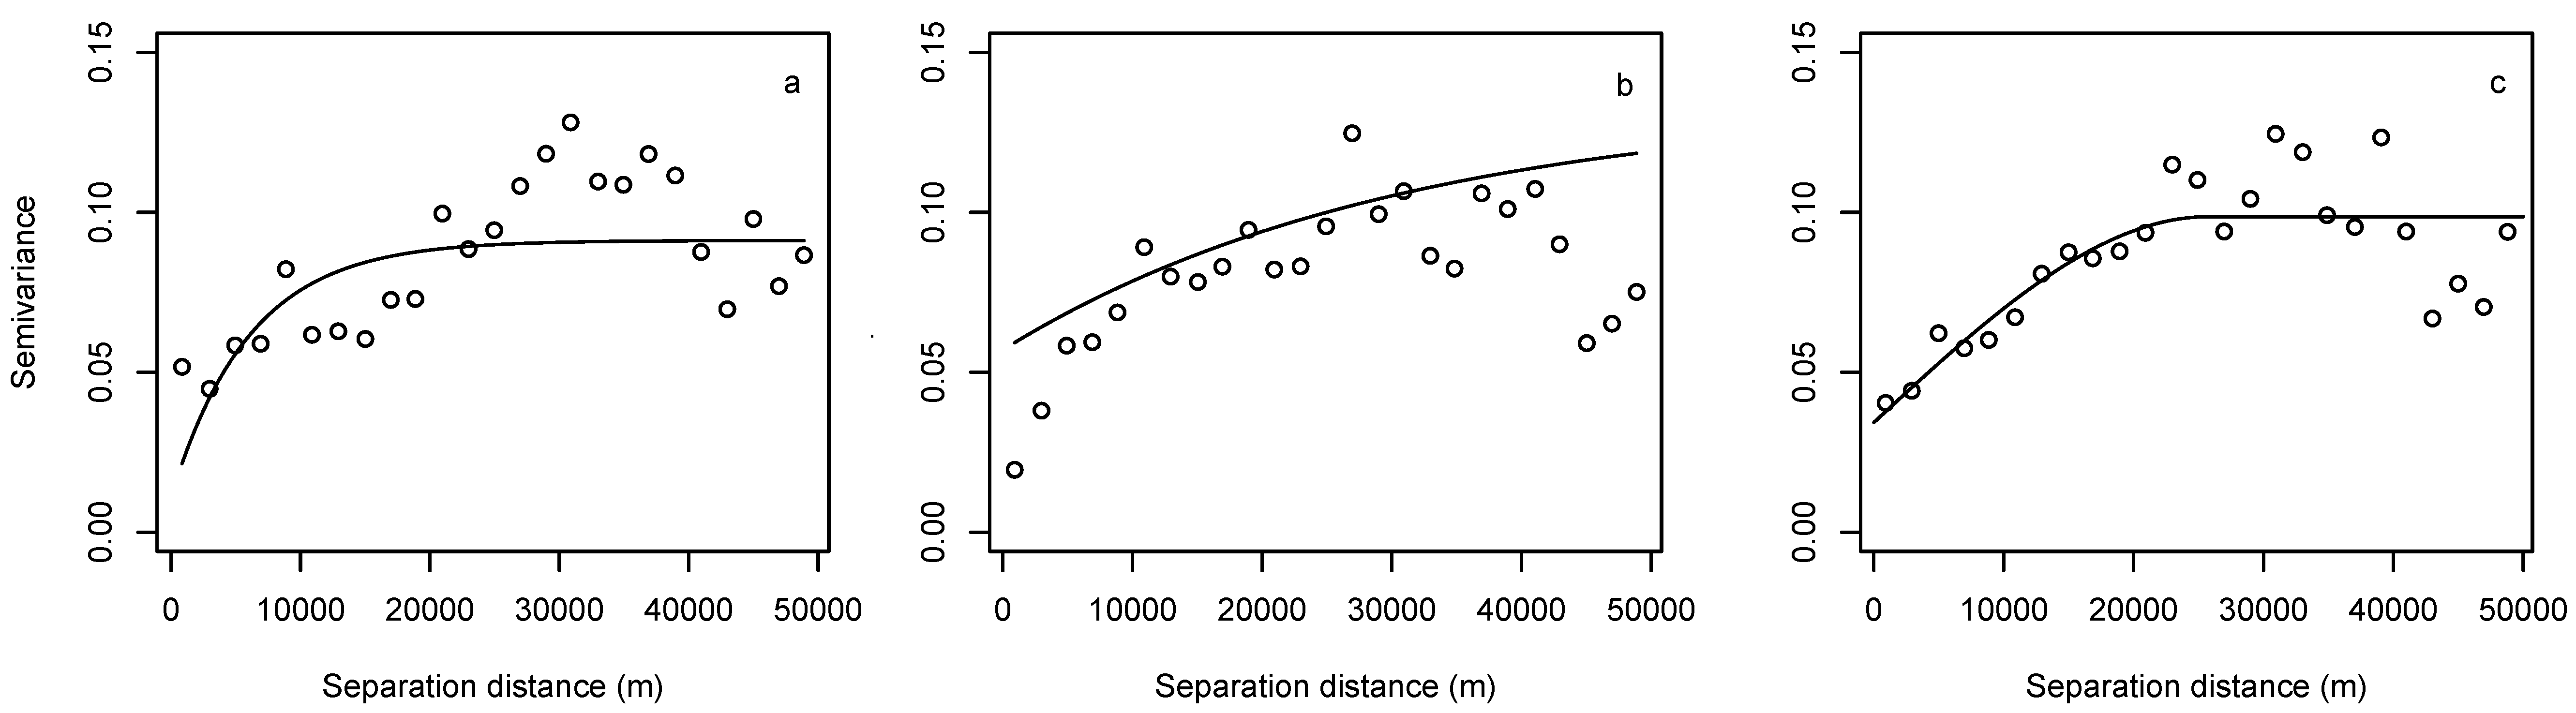
3.2. Geostatistical Analysis of Soil N, P, and K Stocks

The semevariograms are presented in Figure 2 and their parameters are shown in Table 2. The exponential model performed best for soil N and P stocks while the spherical model was best for soil K stock based on the smallest residuals and the highest determination coefficient. These models produced high determination coefficients, ranging from 0.64 to 0.74.
Nugget values present undetectable experimental errors, field variation within the minimum sampling space, and inherent variability [23]. In this study, nugget values were lowest for soil N stock (0.0111), and highest for soil P stock (0.0570). These positive values suggested a positive nugget effect, a sampling error, or random and inherent variability of soil N, P, and K stocks [23]. Sill values represent total spatial variation [11]. The sill values ranged from 0.0912 for N stock to 0.1340 for P stock.
The ratio of nugget-to-sill represents a spatial dependence. If the ratio is lower than 25%, it indicates a strong spatial dependence. If the ratio is higher than 75%, it indicates a weak spatial dependence, while a ratio between 25% and 75% indicates a moderate spatial dependence [46]. A strong spatial dependence is attributed to soil intrinsic properties, such as soil parent material, soil texture, topography, and vegetation [23,47]. A weak spatial dependence indicates that the spatial variability is mainly regulated by extrinsic variations, such as soil fertilization and cultivation practices [23,46]. Therefore, a moderate spatial dependence is controlled by both intrinsic and extrinsic factors. In this study, the nugget-to-sill ratio was 12% for soil N stock, indicating that soil N stock in the study area was mainly controlled by intrinsic factors and that external factors exerted little effects on soil N stock. This may be related to N fertilization application in Moso bamboo forests in that the N input from fertilization can meet the requirement of N output from timber and bamboo shoot harvest. This conclusion was also consistent with the above result (Table 1) that N stock in this study area was higher than other forest types. The nugget-to-sill ratios were 43% for soil P stock and 35% for soil K stock, indicating a moderate spatial dependence that was controlled by both intrinsic and extrinsic factors. This was evidenced by local stand management and complex topography. Intensive managements, such as fertilization and weeding, were widely conducted in Moso bamboo forests in order to improve timber and bamboo shoot output in the study area [19,25]. Meanwhile, the study area was characterized by a high variability of elevations varying from 580 to 1605 m above sea level [25], which could directly affect the soil processes and nutrient contents [11]. In the study area, intensive fertilization treatment was conducted every year, which was expected to be the dominant factor that led to the change of the spatial variability of soil N, P, and K stocks. However, our results (nugget-to-sill ratio) indicated that intrinsic factors played a more important role in controlling spatial patterns of soil N, P, and K stocks.
The ranges (A0) indicate different influence zones of environmental factors at different scales [23]. Within the range, soil properties are not spatially independent, while beyond the range, soil properties were spatially independent [39]. In this study, the smallest range was found for soil N stock (6100 m), and increased to 25,700 m for soil K stock and 30,570 m for soil P stock. The results indicated that soil N stock was more heterogeneous compared to soil P and K stocks, which was associated with soil processes because soil N stock was mainly controlled by intrinsic factors (see above). Generally, the spatial range was larger than the sampling intervals (Figure 1), which suggested that the sampling strategy in this study was appropriate for studying spatial patterns of soil N, P, and K stocks. However, only a small number of sampling plots were located in the northwest of the study area due to a low cover of bamboo forests. In contrast, the majority of the sampling sites were located in the southern and eastern part of the study area, where most of the bamboo forests were distributed, thus the sampling strategy could meet our research purpose and could predict the spatial distributions of soil N, P, and K stocks accurately.

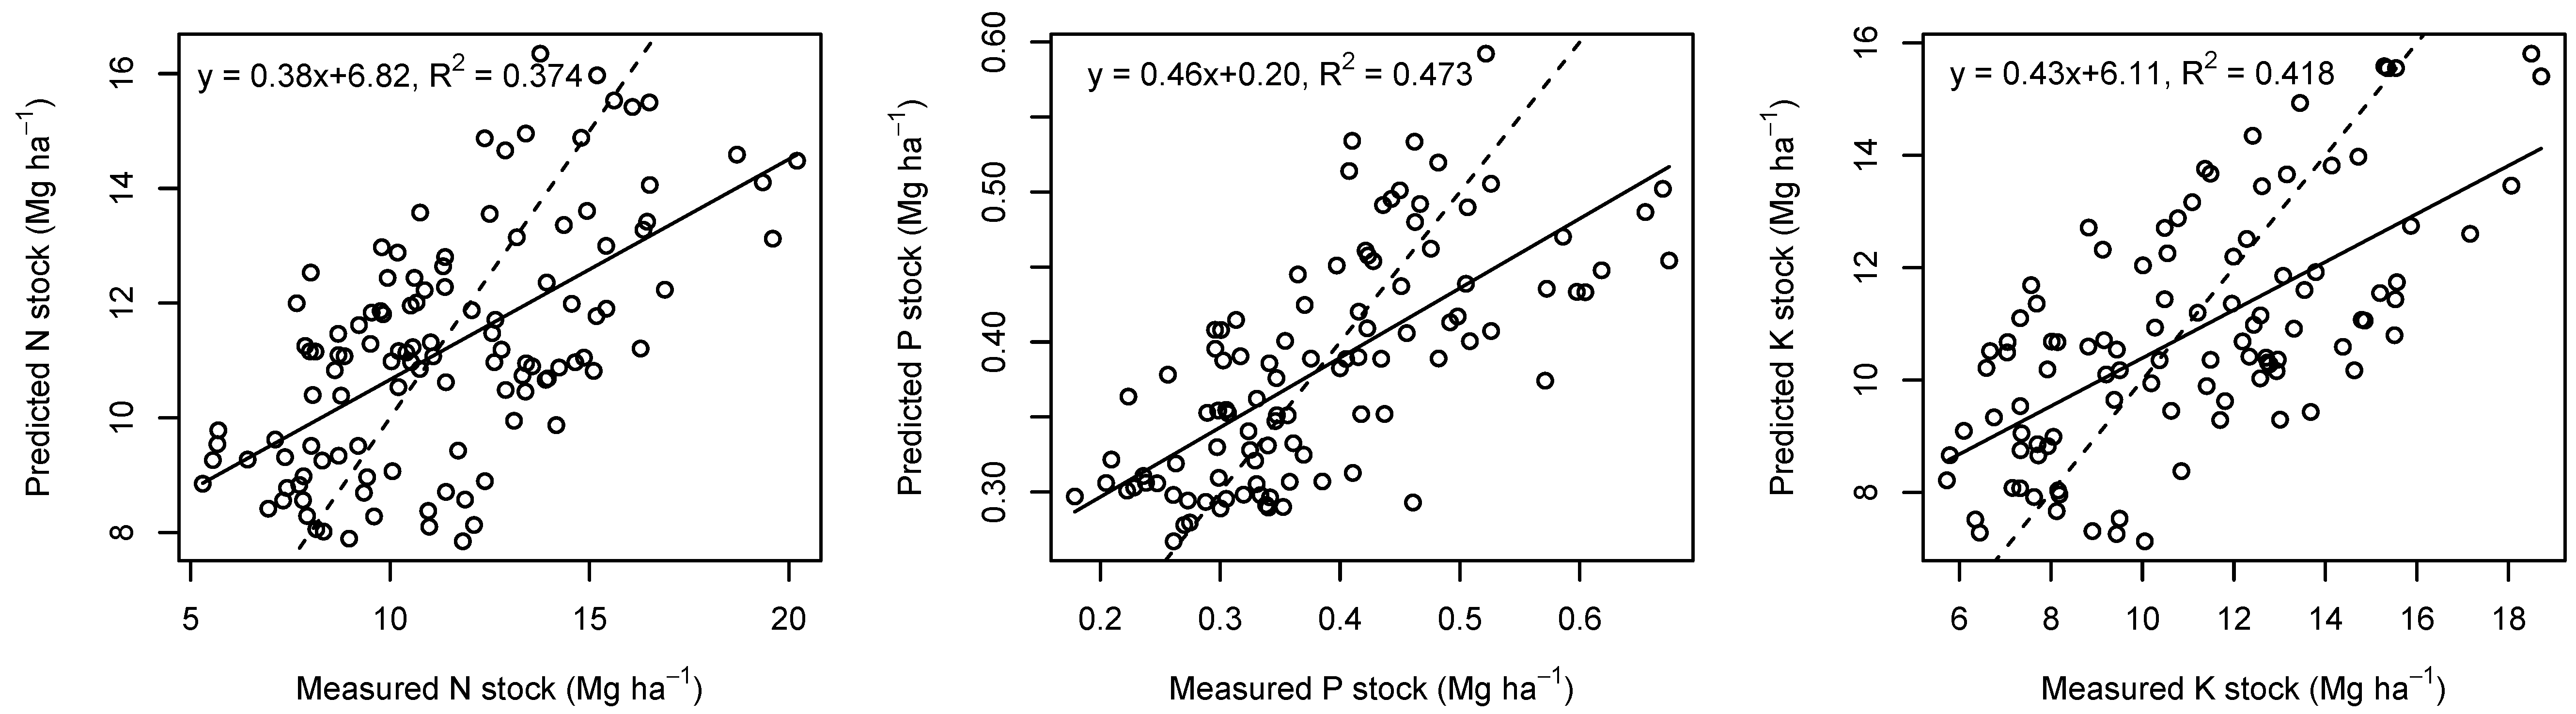
3.3. Cross-Validation of OK

The predicted values of OK were plotted against the measured values to evaluate the interpolation performance (Figure 3). The linear model and 1:1 dashed line intersected for soil N, P, and K stocks. Before the intersection, the linear model overestimated soil N, P, and K stocks, and vice versa. This conclusion supported the findings of many previous studies because of the nature of the algorithms of OK, which aimed to achieve unbiased predictions of mean values [11,15]. AME, ME, and RMSE were calculated and presented in Table 3. The closer that the AME, ME, and RMSE values are to zero, the better the model performed. ME of soil N, P, and K stocks ranged from −0.0022 to −0.2115, which were close to zero, indicating that OK produced relatively unbiased values for spatial interpolation. The ME values were negative, illustrating that OK generally underestimated soil N, P, and K stocks.
Determination coefficients ranged from 0.37 to 0.47 (Figure 3), which may appear relatively low, but they were similar to many previous studies regarding the spatial interpolation of soil properties [47,48]. This problem is associated with the dataset, which was not sampled with a probabilistic design [48]. For example, the majority of sampling plots were allocated in the southern and eastern parts of Yong’an City in the current study (Figure 1). Therefore, a dataset with a probabilistic design is recommended for spatial interpolation of soil properties. Another possible explanation might be the strong local variation of soil N, P, and K stocks caused by the variability in environmental conditions and fertilization practices. On the other hand, the low correlation between the predicted and measured data indicates that a better methodology, such as one using Artificial Neural Network and Random Forest, should be developed to improve the accuracy of spatial interpolation of soil N, P, and K stocks, including consideration of both intrinsic and extrinsic factors.

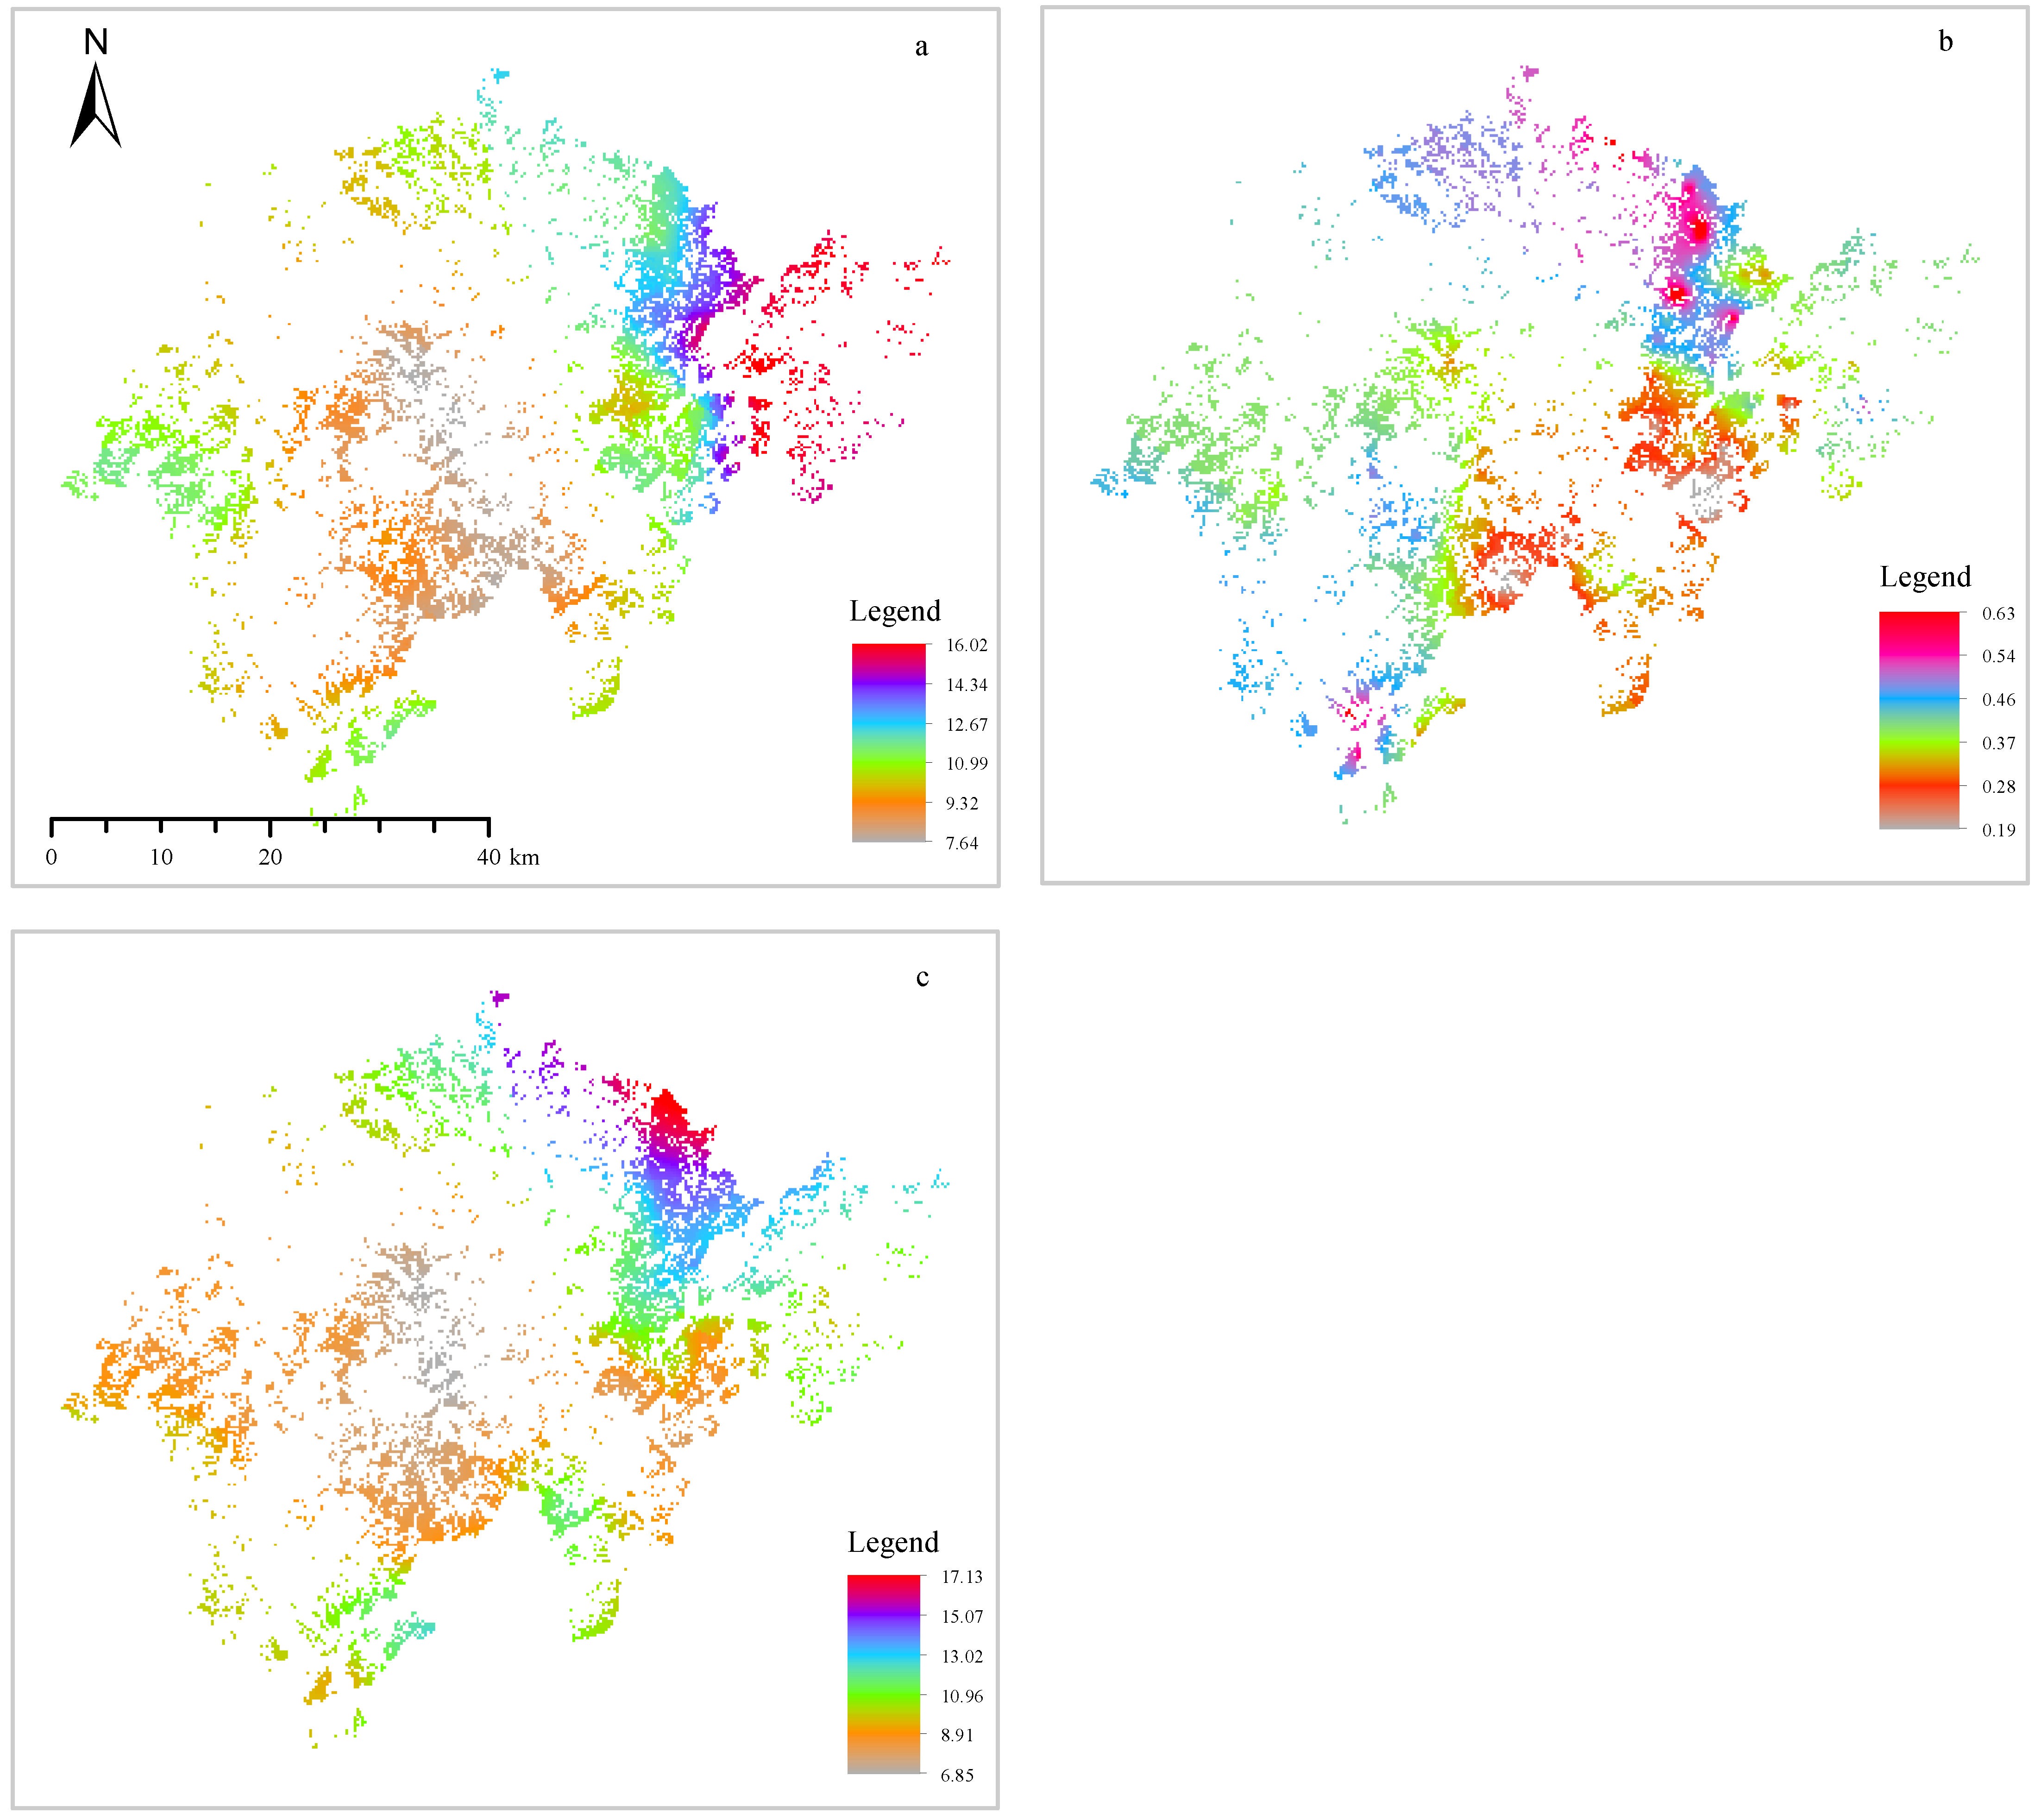
3.4. Spatial Prediction of Soil N, ,P and K Stocks

The spatial patterns of soil N, P, and K stocks predicted by OK are shown in Figure 4. Predicted soil N, P, and K stocks ranged from 7.64 Mg ha−1 to 16.02 Mg ha−1, from 0.19 Mg ha−1 to 0.63 Mg ha−1, and from 6.85 Mg ha−1 to 17.13 Mg ha−1, respectively. The lowest soil N, P, and K stocks were found in the middle or southern part of study area, where the city centre was located with a high population, indicating that human activities led to a significant decrease of soil N, P, and K stocks. The highest soil N stock was observed in the east of the study area, the highest soil P stock was found in the southwest and north, and the highest soil K stock was in the north. However, plant growth was constrained by the most limited nutrient. These different spatial distribution patterns suggested that fertilizers with different N:P:K ratios should be applied to maintain and improve the stand productivity. For instance, a relatively lower ratio of P but higher K ratio fertilizer should be applied in the south of the study area (Figure 4b,c), while a relatively lower ratio of N fertilization should be implemented in the east (Figure 4a). Further studies are strongly encouraged to study the N:P:K ratio for the whole study area in order to manage Moso bamboo forests scientifically. The total soil N, P, and K stocks of the whole study area were 0.624, 0.020, and 0.583 Tg (1 Tg = 1 × 10¹² g), respectively, indicating soils were important pools of soil N, P, and K.

4. Conclusions

In this study, the current status and spatial interpolation of soil N, P, and K stocks within 0–60 cm were analysed using the measured data from 138 locations in Moso bamboo forests in Yong’an City, China. OK was applied for spatial interpolation of soil N, P, and K stocks across the whole study area. Exponential and spherical models performed well in describing the spatial distribution of soil N, P, and K stocks with determination coefficient from 0.64 to 0.74, and cross-validation demonstrated that OK performed well for the spatial interpolation of soil N, P, and K stocks. Soil N stocks showed a strong spatial dependence, indicating soil N stocks were mainly controlled by intrinsic factors. Soil P and K stocks showed a moderate spatial dependence, suggesting that soil P and K stocks were controlled by both intrinsic (e.g., soil parent material, soil texture, topography) and extrinsic (e.g., soil fertilization and cultivation practices) factors. Soil N, P, and K stocks showed different spatial patterns across the whole study area, indicating that fertilizers with different ratios of N:P:K should be applied for different sites.

Acknowledgments

This study was supported by special research fund of International Centre for Bamboo and Rattan (1632013010) and “Twelfth Five-year” National Technology Support Program (2012BAD23B04). We thank Yanfang Gao for support with fieldwork and Ping He for the technical support.

Author Contributions

Xiaolu Tang, Fengying Guan, and Shaohui Fan conceived and designed the experiments; Xiaolu Tang, Mingpeng Xia, and Shaohui Fan analysed the data; Xiaolu Tang, Mingpeng Xia, Fengying Guan, and Shaohui Fan wrote the paper. All authors contributed to the review of the manuscript.

Conflicts of Interest

The authors declare no conflict of interest.

Abbreviations

The following abbreviations are used in this manuscript:
AME
Absolute Mean Error
BD
Bulk Density
D
Depth
K
Potassium
ME
Mean Error
N
Nitrogen
OK
Ordinary Kriging
P
Phosphorus
RMSE
Root Mean Square Error

References

  1. Li, Y.; Niu, S.L.; Yu, G.R. Aggravated phosphorus limitation on biomass production under increasing nitrogen loading: A meta-analysis. Glob. Chang. Biol. 2016, 22, 934–943. [Google Scholar] [CrossRef]
  2. Tripler, C.E.; Kaushal, S.S.; Likens, G.E.; Walter, M.T. Patterns in potassium dynamics in forest ecosystems. Ecol. Lett. 2006, 9, 451–466. [Google Scholar] [CrossRef]
  3. Marklein, A.R.; Houlton, B.Z. Nitrogen inputs accelerate phosphorus cycling rates across a wide variety of terrestrial ecosystems. New Phytol. 2012, 193, 696–704. [Google Scholar] [CrossRef]
  4. Du, M.Y.; Fan, S.H.; Liu, G.L.; Feng, H.Y.; Guo, B.H.; Tang, X.L. Stoichiometric characteristics of carbon, nitrogen and phosphorus in Phyllostachys pubescens forests of China. Chin. J. Plant Ecol. 2016, 40, 760–774, (In Chinese with English Abstract). [Google Scholar]
  5. Patil, R.H.; Laegdsmand, M.; Olesen, J.E.; Porter, J.R. Effect of soil warming and rainfall patterns on soil N cycling in Northern Europe. Agric. Ecosyst. Environ. 2010, 139, 195–205. [Google Scholar] [CrossRef]
  6. Lin, J.S.; Shi, X.Z.; Lu, X.X.; Yu, D.S.; Wang, H.J.; Zhao, Y.C.; Sun, W.X. Storage and spatial variation of phosphorus in paddy soils of China. Pedosphere 2009, 19, 790–798. [Google Scholar] [CrossRef]
  7. Rezaei, S.A.; Gilkes, R.J. The effects of landscape attributes and plant community on soil chemical properties in rangelands. Geoderma 2005, 125, 167–176. [Google Scholar] [CrossRef]
  8. Rodríguez, A.; Durán, J.; Fernández-Palacios, J.M.; Gallardo, A. Spatial pattern and scale of soil N and P fractions under the influence of a leguminous shrub in a Pinus canariensis forest. Geoderma 2009, 151, 303–310. [Google Scholar] [CrossRef]
  9. Gami, S.K.; Lauren, J.G.; Duxbury, J.M. Influence of soil texture and cultivation on carbon and nitrogen levels in soils of the eastern Indo-Gangetic Plains. Geoderma 2009, 153, 304–311. [Google Scholar] [CrossRef]
  10. Ross, D.J.; Tate, K.R.; Scott, N.A.; Feltham, C.W. Land-use change: Effects on soil carbon, nitrogen and phosphorus pools and fluxes in three adjacent ecosystems. Soil Biol. Biochem. 1999, 31, 803–813. [Google Scholar] [CrossRef]
  11. Liu, Z.P.; Shao, M.A.; Wang, Y.Q. Spatial patterns of soil total nitrogen and soil total phosphorus across the entire Loess Plateau region of China. Geoderma 2013, 197–198, 67–78. [Google Scholar] [CrossRef]
  12. Jennings, E.; Allott, N.; Pierson, D.C.; Schneiderman, E.M.; Lenihan, D.; Samuelsson, P.; Taylor, D. Impact of climate change on phosphorus loading from a grassland catchment: Implication for future management. Water Res. 2009, 43, 4316–4326. [Google Scholar] [CrossRef]
  13. Yasrebi, J.; Saffari, M.; Fathi, H.; Karimian, N.; Moazallahi, M.; Gazni, R. Evaluation and comparison of ordinary kriging and inverse distance weighting methods for prediction of spatial variability of some soil chemical parameters. Res. J. Biol. Sci. 2009, 4, 93–102. [Google Scholar]
  14. Wang, Z.; Liu, G.B.; Xu, M.X.; Zhang, J.; Wang, Y.; Tang, L. Temporal and spatial variations in soil organic carbon sequestration following revegetation in the hilly Loess Plateau, China. Catena 2012, 99, 26–33. [Google Scholar] [CrossRef]
  15. Liu, Z.P.; Shao, M.A.; Wang, Y.Q. Large-scale spatial interpolation of soil pH across the Loess Plateau, China. Environ. Earth Sci. 2012, 69, 2731–2741. [Google Scholar] [CrossRef]
  16. Kravchenko, A.N. Influence of spatial structure on accuracy of interpolation methods. Soil Sci. Soc. Am. J. 2003, 67, 1564–1571. [Google Scholar] [CrossRef]
  17. Martín, J.A.R.; Álvaro-Fuentes, J.; Gonzalo, J.; Gil, C.; Ramos-Miras, J.J.; Corbí, J.M.G.; Boluda, R. Assessment of the soil organic carbon stock in Spain. Geoderma 2016, 264, 117–125. [Google Scholar] [CrossRef]
  18. Zhou, G.M.; Xu, J.M.; Jiang, P.K. Effect of management practices on seasonal dynamics of organic carbon in soils under bamboo plantations. Pedosphere 2006, 16, 525–531. [Google Scholar] [CrossRef]
  19. Du, M.; Liu, G.; Fan, S.; Feng, H.; Tang, X.; Mao, C. Effects of fertilization on the distribution patterns of biomass and carbon storage in Moso bamboo forest, western Fujian province, China. Chin. J. Trop. Crops 2015, 36, 1–7, (In Chinese with English Abstract). [Google Scholar]
  20. Liu, J.; Jiang, P.K.; Wang, H.L.; Zhou, G.M.; Wu, J.S.; Yang, F.; Qian, X.B. Seasonal soil CO2 efflux dynamics after land use change from a natural forest to Moso bamboo plantations in subtropical China. For. Ecol. Manag. 2011, 262, 1131–1137. [Google Scholar] [CrossRef]
  21. Xu, Q.F.; Jiang, P.K.; Xu, Z.H. Soil microbial functional diversity under intensively managed bamboo plantations in southern China. J. Soils Sed. 2008, 8, 177–183. [Google Scholar] [CrossRef]
  22. Li, Y.F.; Zhang, J.J.; Chang, S.X.; Jiang, P.K.; Zhou, G.M.; Fu, S.L.; Yan, E.R.; Wu, J.S.; Lin, L. Long-term intensive management effects on soil organic carbon pools and chemical composition in Moso bamboo (Phyllostachys pubescens) forests in subtropical China. For. Ecol. Manag. 2013, 303, 121–130. [Google Scholar] [CrossRef]
  23. Wang, Y.Q.; Zhang, X.C.; Huang, C.Q. Spatial variability of soil total nitrogen and soil total phosphorus under different land uses in a small watershed on the Loess Plateau, China. Geoderma 2009, 150, 141–149. [Google Scholar] [CrossRef]
  24. Morales, L.A.; Vázquez, E.V.; Paz-Ferreiro, J. Spatial distribution and temporal variability of ammonium-nitrogen, phosphorus, and potassium in a rice field in Corrientes, Argentina. Sci. World J. 2014, 2014. [Google Scholar] [CrossRef]
  25. Liu, G.L.; Fan, S.H.; Qi, L.H.; Xiao, F.M.; Huang, Y.N. Nutrient distribution and biological cycle characteristics in different types of Phyllostachys pubescens forest in Northwest Fujian. Chin. J. Eco. 2010, 29, 2155–2161, (In Chinese with English Abstract). [Google Scholar]
  26. He, P.; Liu, J.; Yu, K.Y.; Yang, S.P.; Yao, X.; Yu, X.Y.; Deng, Y.B.; Chen, Z.H. Research on spatial heterogeneity of soil organic carbon in the southern bamboo forest. Chin. J. Soil Sci. 2016, 47, 36–44, (In Chinese with English Abstract). [Google Scholar]
  27. Yong’an Forest Bureau, Forest Management Inventory; Yong’an, Sanming, Fujian, China. Unpublished work. 2014.
  28. Tang, X.L.; Fan, S.H.; Qi, L.H.; Liu, G.L.; Guan, F.Y.; Du, M.Y.; Shen, C.X. Effect of different managements on carbon storage and carbon allocation in Moso bamboo forest (Phyllostachys pubescen). Acta Agric. Univ. Jiangxi 2012, 34, 736–742, (In Chinese with English abstract). [Google Scholar]
  29. State Forestry Adiministration. Forestry Standard of People’s Republic of China—Methods of Forest Soil Analysis; Chinese Standard Press: Beijing, China, 1999. [Google Scholar]
  30. Zhang, L.H.; Xie, Z.K.; Zhao, R.F.; Wang, Y.J. The impact of land use change on soil organic carbon and labile organic carbon stocks in the Longzhong region of Loess Plateau. J. Arid Land 2012, 4, 241–250. [Google Scholar] [CrossRef]
  31. Xie, Z.B.; Zhu, J.G.; Liu, G.; Cadisch, G.; Hasegawa, T.; Chen, C.M.; Sun, H.F.; Tang, H.Y.; Zeng, Q. Soil organic carbon stocks in China and changes from 1980s to 2000s. Glob. Chang. Biol. 2007, 13, 1989–2007. [Google Scholar] [CrossRef]
  32. Guan, F.Y.; Tang, X.L.; Fan, S.H.; Zhao, J.C.; Peng, C. Changes in soil carbon and nitrogen stocks followed the conversion from secondary forest to Chinese fir and Moso bamboo plantations. Catena 2015, 133, 455–460. [Google Scholar] [CrossRef]
  33. R Development Core Team. R: A Language and Environment for Statistical Computing; R Foundation for Statistical Computing: Vienna, Austria, 2011; Available online: http://www.R-project.Org/ (accessed on 6 March 2015).
  34. Gammadesign. Available online: www.gammadesign.com (accessed on 10 January 2015).
  35. Esri. Available online: www.esri.com (accessed on 14 June 2013).
  36. Krige, D.G. A statistical approach to some basic mine valuation problems on the witwatersrand. J. Chem. Metall. Min. Soc. S. Afr. 1951, 52, 119–139. [Google Scholar]
  37. Goovaerts, P. Geostatistics in soil science: State-of-the-art and perspectives. Geoderma 1999, 89, 1–45. [Google Scholar] [CrossRef]
  38. Schöning, I.; Totsche, K.U.; Kögel-Knabner, I. Small scale spatial variability of organic carbon stocks in litter and solum of a forested Luvisol. Geoderma 2006, 136, 631–642. [Google Scholar] [CrossRef]
  39. Lv, J.S.; Liu, Y.; Zhang, Z.L.; Dai, J.R.; Dai, B.; Zhu, Y.C. Identifying the origins and spatial distributions of heavy metals in soils of Ju country (Eastern China) using multivariate and geostatistical approach. J. Soil Sed. 2015, 15, 163–178. [Google Scholar] [CrossRef]
  40. Reza, S.K.; Sarkar, D.; Baruah, U.; Das, T.H. Evaluation and comparison of ordinary kriging and inverse distance weighting methods for prediction of spatial variability of some chemical parameters of Dhalai district, Tripura. Agropedology 2010, 20, 38–48. [Google Scholar]
  41. Yang, Y.H.; Ma, W.H.; Mohammat, A.; Fang, J.Y. Storage, patterns and controls of soil nitrogen in China. Pedosphere 2007, 17, 776–785. [Google Scholar] [CrossRef]
  42. Liu, J.; Yang, Q.P.; Yu, D.K.; Song, Q.N.; Zhao, G.D.; Wang, B. Contribution of fine root to soil nutrient heterogeneity at two sides of the bamboo and broadleaved forest interface. Chin. J. Plant Ecol. 2013, 37, 739–749, (In Chinese with English Abstract). [Google Scholar] [CrossRef]
  43. Wang, T.; Yang, Y.H.; Ma, W.H. Storage, patterns and environmental controls of soil phosphorus in China. Acta Sci. Nat. Univ. Pekin. 2008, 44, 945–951. [Google Scholar]
  44. Chen, J.; Yang, N. Effects of five plantations on soil properties in subtropical red soil hilly region. J. Northwest A & F Univ. (Nat. Sci. Ed.) 2013, 41, 167–173,178, (In Chinese with English Abstract). [Google Scholar]
  45. Fang, X.; Xue, Z.J.; Li, B.C.; An, S.S. Soil organic carbon distribution in relation to land use and its storage in a small watershed of the Loess Plateau, China. Catena 2012, 88, 6–13. [Google Scholar] [CrossRef]
  46. Cambardella, C.A.; Moorman, T.B.; Novak, J.M.; Parkin, T.B.; Karlen, D.L.; Turco, R.F.; Konopka, A.E. Field-scale variability of soil properties in central Iowa soils. Soil Sci. Soc. Am. J. 1994, 58, 1501–1511. [Google Scholar] [CrossRef]
  47. Fu, W.J.; Jiang, P.K.; Zhao, K.L.; Zhou, G.M.; Li, Y.F.; Wu, J.S.; Du, H.Q. The carbon storage in Moso bamboo plantation and its spatial variation in Anji County of southeastern China. J. Soils Sed. 2014, 14, 320–329. [Google Scholar] [CrossRef]
  48. Veronesi, F.; Corstanje, R.; Mayr, T. Landscape scale estimation of soil carbon stock using 3D modelling. Sci. Total Environ. 2014, 487, 578–586. [Google Scholar] [CrossRef]
Figure 1. A map of the study area showing the distribution of bamboo forests (polygons) and sampling locations (solid circle).
Forests 07 00267 g001
Figure 2. Experimental semivariograms of soil N (a), P (b), and K (c) stocks.
Forests 07 00267 g002
Figure 3. Cross-validation of OK interpolation for soil N, P, and K stocks.
Forests 07 00267 g003
Figure 4. Spatial distribution of soil N (a), P (b), and K (c) stocks.
Forests 07 00267 g004
Table 1. Summary of statistics of soil N, P, and K stocks within 0–60 cm (Mg ha−1).
NutrientMeanMinimumMaximumMedianSDCV (%)1st Qu3rd QuSkewnessKurtosisp of S-W
N Stock11.575.3020.2010.983.2327.928.8113.660.42−0.330.053
P Stock0.380.180.680.360.1129.100.300.450.60−0.140.010
K Stock10.805.7318.7210.813.1529.178.1113.030.32−0.720.014
SD = standard deviation; CV = coefficient of variance; 1st Qu = 25% quartile; 3rd = 75% quartile; S-W test = Shapiro-Wilk test.
Table 2. Models and their parameters fitted for the semivariograms of soil N, P, and K stocks within 0–60 cm.
NutrientModelsNugget (C0)Sill (C0 + C)Nugget/SillRange (A0, m)Determination CoefficientResiduals
N stockExponential0.01110.091212.1761000.6420.00458
P stockExponential0.05700.134042.5430,5700.7410.00110
K stockSpherical0.03430.098634.7925,7000.6430.00469
Table 3. Cross-validation indices for ordinary kriging (OK).
NutrientAMEMERMSE
N stock2.1506−0.21152.5557
P stock0.0626−0.00220.0797
K stock2.0250−0.16342.3942
AME = absolute mean error; ME = mean error; RMSE = root mean square error.

