Article

Understanding the Fate of Applied Nitrogen in Pine Plantations of the Southeastern United States Using 15N Enriched Fertilizers

Department of Forest Resources and Environmental Conservation, Virginia Polytechnic Institution and State University, Blacksburg, VA 24061, USA
*
Author to whom correspondence should be addressed.
Forests 2016, 7(11), 270; https://doi.org/10.3390/f7110270
Submission received: 29 August 2016 / Revised: 2 November 2016 / Accepted: 5 November 2016 / Published: 11 November 2016
(This article belongs to the Special Issue Nutrient Cycling and Plant Nutrition in Forest Ecosystems)

Abstract

:
This study was conducted to determine the efficacy of using enhanced efficiency fertilizer (EEFs) products compared to urea to improve fertilizer nitrogen use efficiency (FNUE) in forest plantations. All fertilizer treatments were labeled with 15N (0.5 atom percent) and applied to 100 m2 circular plots at 12 loblolly pine stands (Pinus taeda L.) across the southeastern United States. Total fertilizer N recovery for fertilizer treatments was determined by sampling all primary ecosystem components and using a mass balance calculation. Significantly more fertilizer N was recovered for all EEFs compared to urea, but there were generally no differences among EEFs. The total fertilizer N ecosystem recovery ranged from 81.9% to 84.2% for EEFs compared to 65.2% for urea. The largest amount of fertilizer N recovered for all treatments was in the loblolly pine trees (EEFs: 38.5%–49.9%, urea: 34.8%) and soil (EEFs: 30.6%–38.8%, urea: 28.4%). This research indicates that a greater ecosystem fertilizer N recovery for EEFs compared to urea in southeastern pine plantations can potentially lead to increased FNUE in these systems.

1. Introduction

Loblolly pine (Pinus taeda L.) is the most widely planted and commercially valuable tree species in the United States [1,2], with large areas in the southeastern United States managed intensively in plantations. Although loblolly pine stemwood can exceed 10 m3·ha−1·year−1 in intensively managed plantations [3], growth of many stands is less due to low levels of plant available nitrogen (N) and phosphorous (P) in the soil [4,5]. Nitrogen deficiencies that occur when plant available N in the soil is inadequate to meet tree N demand [6,7,8] translate to low leaf areas, decreased photosynthetic capacity, and hence reduced growth [9,10]. Temporal patterns in N availability often lead to N deficiencies developing during later parts of the rotation [3,11,12]. Following disturbance, such as harvesting, plant N availability in the soil is high due to N mineralization of organic matter [13,14]. Yet, as the stand develops, plant N availability decreases because of increasing N immobilization in the ecosystem [15], and N fertilization is often required to maintain forest productivity in mid-rotation stands [6]. The average growth response in mid-rotation southeastern pine plantations averages 3 m3·ha−1·year−1 over the 8 years following fertilization [3].
However, less than 30% of N applied in fertilizer is taken up by trees [16,17,18,19,20]. The low fertilizer N uptake by trees is likely due to several factors including: (1) N loss from the system; (2) N immobilization; and (3) N application that is asynchronous to seasonal plant N demand [21,22,23,24,25,26]. Forest soils supporting pine plantations in the southeastern United States contain large natural quantities of N, typically ranging from 2 to 7 Mg·ha−1 [27,28,29]. Because of the large amount of N in forest soils, it is difficult to follow the fate, cycling and uptake of fertilizer N which typically adds only 150–250 kg·ha−1 of N to the system [28,29,30].
Fertilizers labeled with 15N can be used to trace the fate of fertilizer N through the ecosystem over time [31,32,33,34]. Studies using 15N have improved the understanding of applied N cycling in ecosystems since the 1950s in both agriculture [35] and forested [36] systems. Recent research in forested ecosystems using 15N tracer techniques have focused on understanding N cycling in natural systems [37,38,39] or the effects of chronic N deposition from industrialization [40,41]. Fertilizers labeled with 15N have also been used to determine fertilizer N uptake and nitrogen use efficiency (FNUE) [21,22,36,42,43,44].
Urea (46-0-0) is the most commonly used N fertilizer in southern forestry due to its high N content and low cost per unit of applied N [4,5]. However, large N losses following urea fertilization can occur due to ammonia (NH3) volatilization depending on the interactions of weather and edaphic factors [45,46,47,48,49,50]. Volatilization, combined with leaching and denitrification, reduce the amount of fertilizer N remaining in the system, and may decrease fertilizer N availability for plant uptake and hence FNUE [51,52,53,54].
Enhanced efficiency N fertilizers (EEFs) were developed to reduce N loss and increase N availability [55,56,57,58,59,60,61,62,63,64,65]. The EEFs can be divided into slow release (SRN), controlled release (CRN) and stabilized (SNF) N fertilizers [55,56,57,58,59,60,61,62,63]. The SRN products slowly release fertilizer N due to microbial decomposition [56]. The CRN products have coatings around the fertilizer N to alter rate, pattern and duration of fertilizer N release [56,57]. The SNF products have compounds to inhibit rapid fertilizer N transformations to less stable forms [61]. The different attributes of the various N containing EEF products increases the flexibility of N fertilization under diverse conditions to optimize plant N uptake and increase FNUE when compared to urea.
Our overall objective was to determine ecosystem uptake of fertilizer N and determine if N uptake was greater for EEFs compared to urea. In this study, we compared fertilizer N uptake in southeastern pine ecosystems following fertilization with urea and three enhanced efficiency fertilizers after a spring application to determine if there were differences among treatments for: (1) total ecosystem fertilizer N recovery; and (2) ecosystem partitioning of fertilizer N.

2. Materials and Methods

2.1. Experimental Design

This study was established as a complete-block design with five fertilizer treatments. Twelve sites were chosen from a network of existing fertilizer and thinning trials, and each site served as a block. At each site, five 100 m2 circular plots were installed prior to fertilization, and each site was fertilized with a single fertilizer treatment on the same day between 26 March and 8 April 2012.

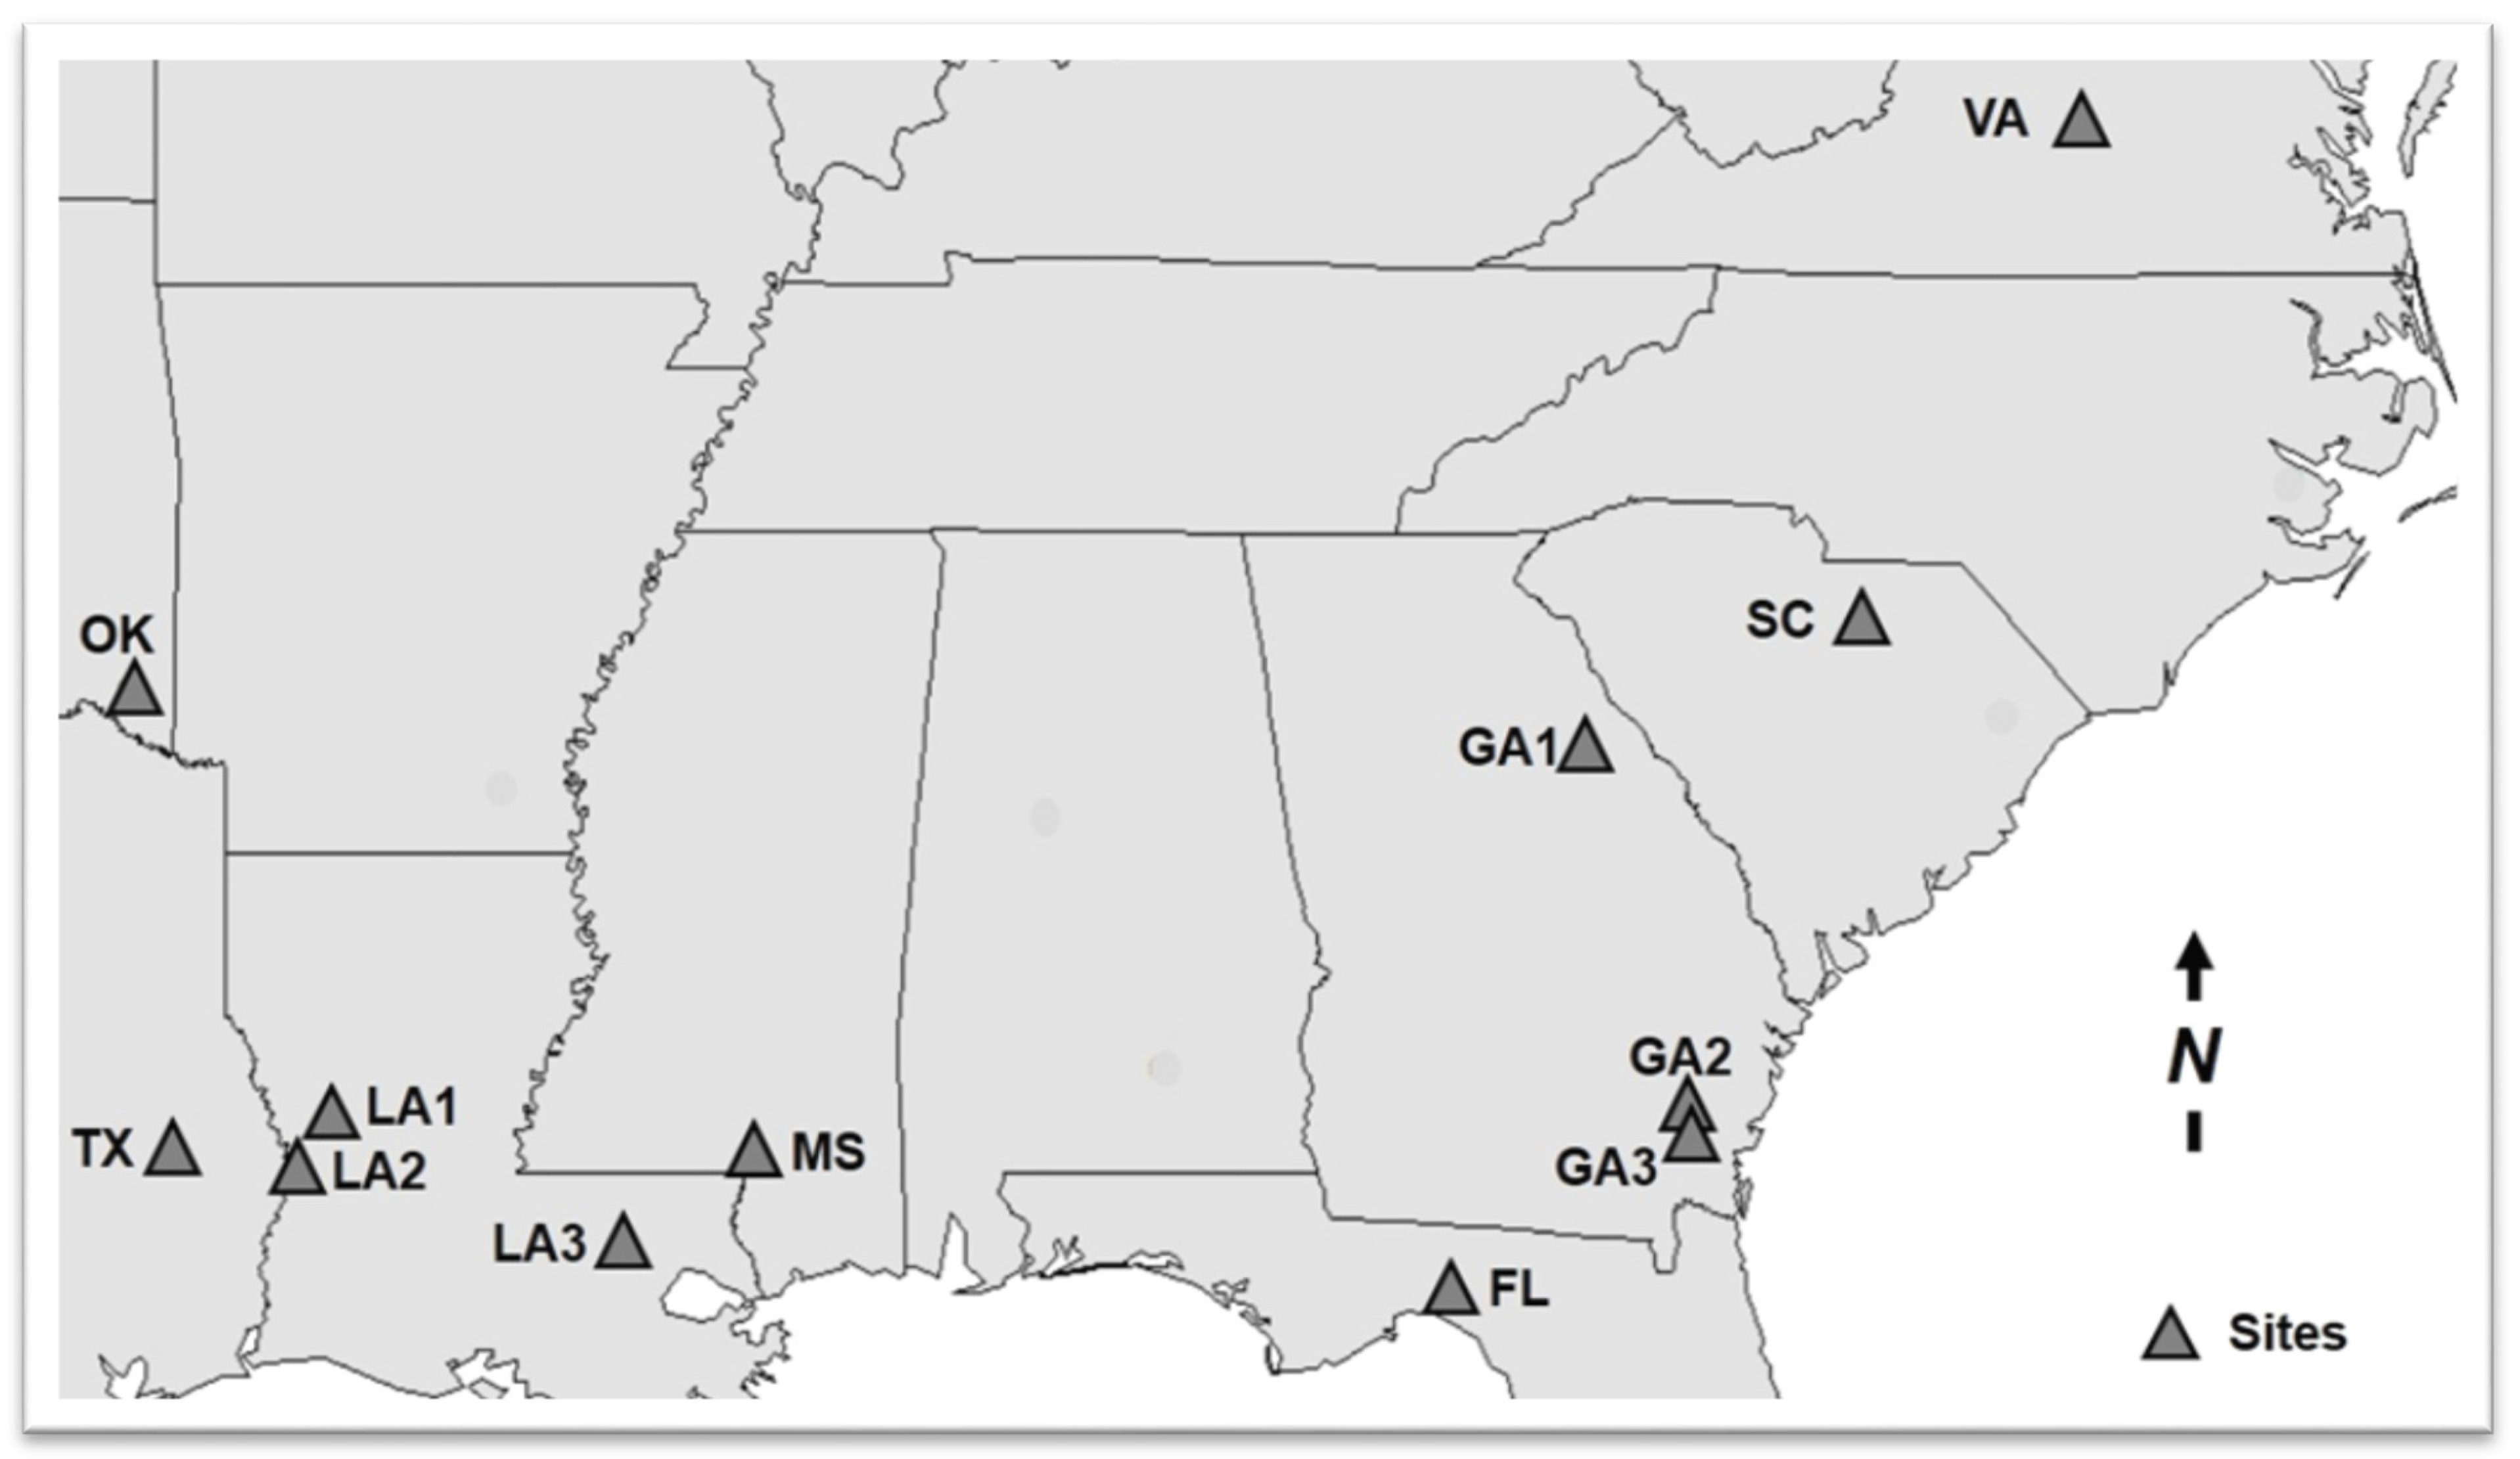
2.2. Site Description

All sites were considered mid-rotation, with stand ages ranging from 8 to 15 years (Figure 1). The understory of the sites ranged from no understory to encompassing 25% of the plot. Selected climate, physical and stand characteristics are detailed in Table 1.

2.3. Fertilizer Treatments

The five fertilizer treatments used in this study were: (1) urea; (2) urea impregnated with N-(n-Butyl) thiophosphoric triamide (NBPT); (3) urea impregnated with NBPT and coated with monoammonium phosphate (CUF); (4) polymer coated urea (PCU); and (5) a control treatment with no fertilizer added. Urea (46-0-0) was used because it is the most common N fertilizer applied in the southeastern United States. The enhanced efficiency fertilizers (EEFs) tested in this study were developed to reduce NH3 volatilization and release fertilizer N slowly to the environment. The NBPT treatment (46-0-0) added N-(n-butyl) thiophosphoric triamide at a rate of 26.7% by weight to urea granules to inhibit urease activity. The CUF treatment (39-9-0) also added NBPT to urea granules, which was then coated with an aqueous binder solution of boron and copper sulfate to slow N release. A final coating of monoammonium phosphate was added to provide P. The PCU (44-0-0) treatment encapsulated urea granules with a polymer coating containing pores designed to slowly release N (~80%) over 120 days. All N treatments were applied at an equivalent rate of 224 kg·N·ha−1. Because the CUF treatment had P in a coating, P was applied in the other fertilizer treatments at the equivalent rate of 28 kg·P·ha−1 as triple superphosphate (TSP). The urea in all treatments was enriched with the stable isotope 15N (0.5 atom percent). Each fertilizer treatment was broadcast applied by hand in individual 100 m2 circular plots at each site. Due to high rates of volatilization and the impact this process has on isotopic fractionation, a fractionation factor of 1.029 was used for each fertilizer treatment as detailed in Högberg [66].

2.4. Field Sampling

The center of each of the 100 m2 circular plots was located between two co-dominant loblolly pine trees in areas with similar stand, soil and landscape characteristics. Immediately prior to each treatment application, the height and diameter breast height (DBH) of all trees greater than 2.54 cm DBH were measured. The sapling, shrub, vine and herbaceous strata were estimated and individual species in each respective strata was composite sampled. The forest floor (O horizon = Oi + Oe + Oa) was collected with a circular sampler from 4 random locations in the plot and composited. Two mineral soil depth increments (0–15 cm, 15–30 cm) were randomly sampled from 8 locations in the plot with a push tube sampler and composited. Roots were sampled to a depth of 20 cm at 4 random locations in the plot with a bulk density corer and composited. Soil bulk density cores were taken from the 0–15 cm and 15–30 cm depth increments from the center of each plot. After this sampling was completed, two 1 m2 circular mesh litterfall traps were placed randomly in the plot to sample litterfall from the year after N fertilization.
Fertilizer treatments were randomly applied to the 100 m2 circular plots (March 26 to April 8). All primary ecosystem components in each plot were resampled at the end of the growing season following fertilization between November 1st and March 31st using similar sampling procedures previously detailed. Litterfall was collected once from the two litterfall traps at the end of the growing season and composited for each individual plot. One of the two central crop trees was selected and felled for sampling. All components of the crop tree sampled were weighed in the field on the same day the tree was felled to obtain field green weights, and subsamples were brought to the laboratory to obtain dry weights. In the field, a 2.54 cm cookie was taken from the tree stem at DBH, height to live crown (HLC), and height to mid crown (HMC). The tree stem was cut into 1.2 m lengths for weighing. The canopy (foliage, fine branches, coarse branches) was randomly placed in 3 piles in the field and each pile was weighed. The foliage, fine branches (branches with foliage attached) and coarse branches (branches with no foliage attached) were separated and also weighed in the field. One of the three canopy piles was randomly selected and returned to the laboratory for analysis. The sapling stratum, if present, was sampled by 2.54 cm diameter classes for individual species categories. Shrubs, vines and herbaceous species were sampled from a randomly selected 3.13 m2 area of the plot. Individual shrub species were sampled in their entirety, with vines and herbaceous species composite sampled in their respective strata.

2.5. Laboratory Procedures

All samples were dried in a forced air oven at 60 °C. In the laboratory, subsamples of bark, wood from the current year of growth (CGR), and the wood of growth rings prior to fertilizer treatment (PGR) were taken from the stem cookies collected at DBH. Litterfall was separated into pine needles, deciduous leaves, fine branches, coarse branches, bark and unidentifiable litterfall. The forest floor was sieved through a 6 mm sieve and the mineral soil was sieved through a 2 mm sieve. Root samples were elutriated and divided into fine (<2 mm) and coarse (>2 mm) size fractions, dried and weighed.
After drying, all organic material samples were coarse ground in a Wiley Mill to pass a 2 mm sieve. The organic samples were then homogenized to a fine powder with a ball mill (Retsch® Mixer Mill MM 200, Haan, Germany) for 1 min at 25 revolutions per second (rps), whereas all mineral soil samples were ball milled for 2 min at 25 rps. After ball milling, individual homogenized samples were put in separate tin capsules and weighed on a Mettler-Toledo© MX5 microbalance (Mettler-Toledo, Inc., Columbus, OH, USA). These individually weighed samples were analyzed to determine the 15N/14N isotope ratio and total N on a coupled elemental analysis-isotope ratio mass spectrometer (IsoPrime 100 EA-IRMS, Isoprime© Ltd., Manchester, UK) at the Forest Soils and Plant Nutrition Laboratory at Virginia Polytechnic Institute and State University (Virginia Tech). All grinding, ball milling and weighing equipment were cleaned after each sample with ethanol to reduce contamination.

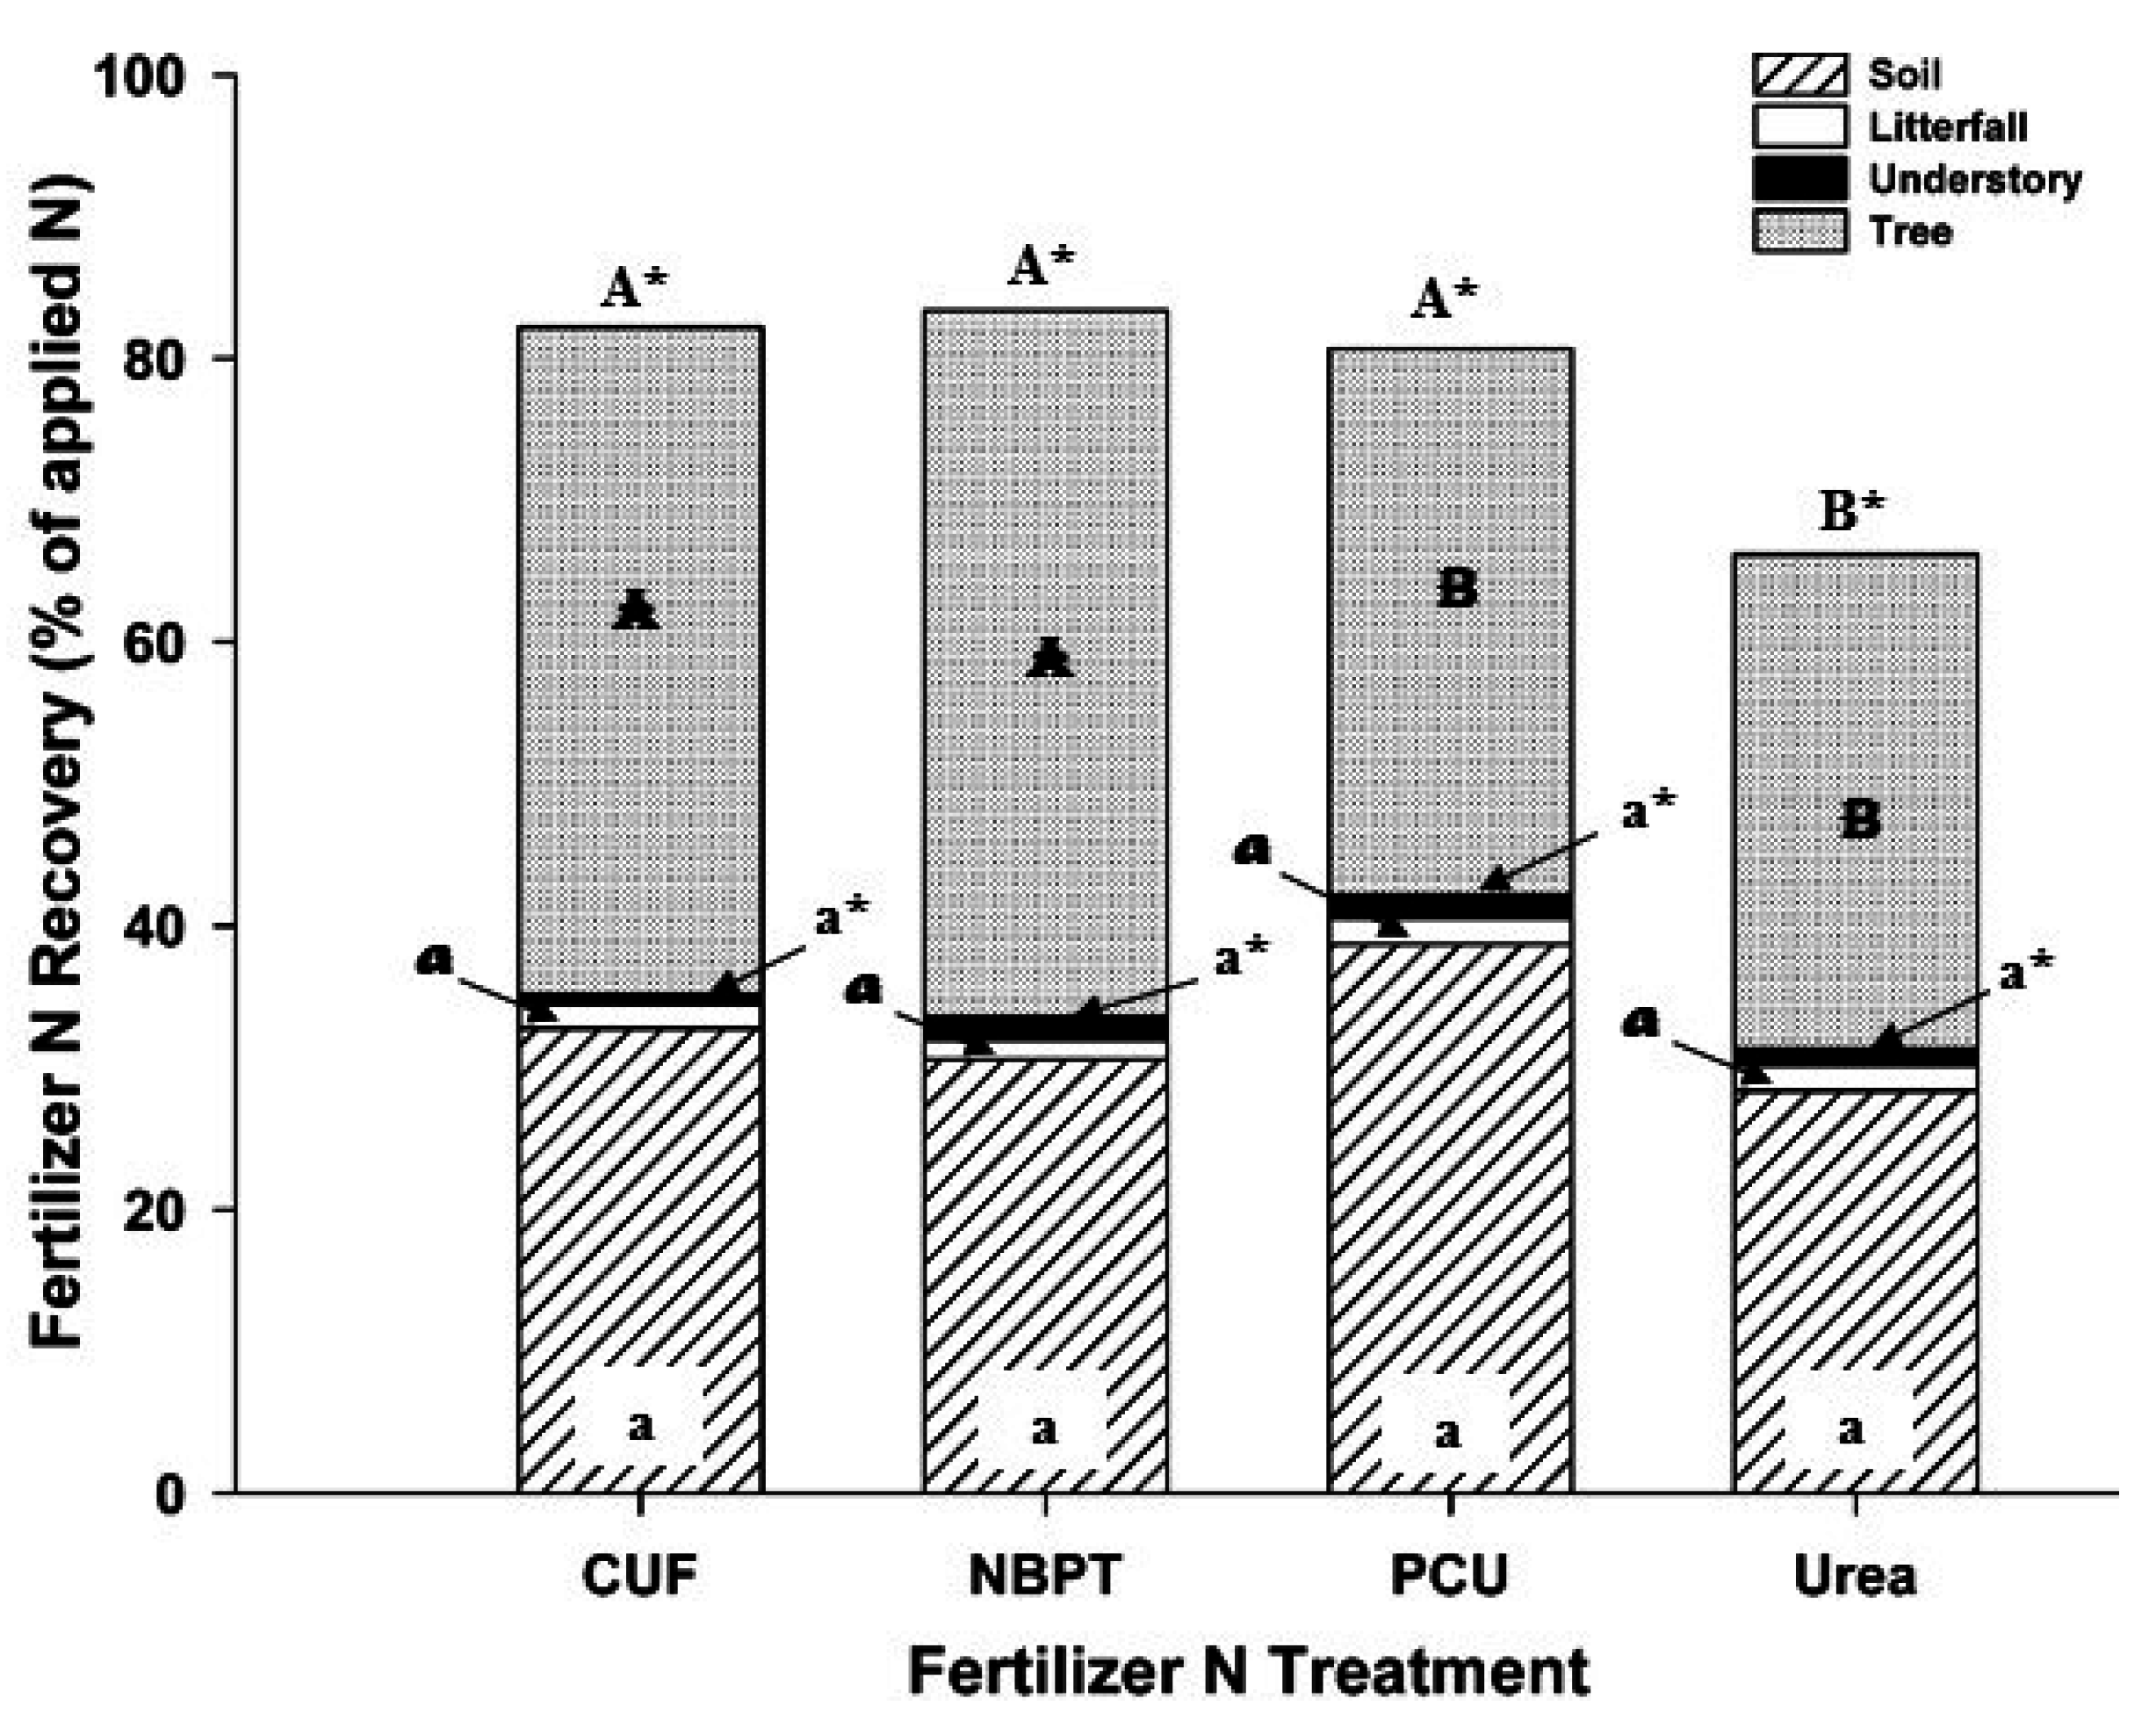
2.6. Calculation of Fertilizer N Recovery

The amount of total fertilizer N recovered in each ecosystem component from the labeled 15N fertilizer was calculated using a mass balance tracer technique that compared individual ecosystem component 15N prior to and 1 year after N fertilization [32,67,68]. Once the fertilizer N recovery for each individual ecosystem component was determined, the fertilizer N recovery for each individual component was summed on a per plot basis to calculate total fertilizer N recovery for the entire plot. The fertilizer N recovery value for the individual loblolly pine sampled in each plot was multiplied by the number of loblolly pine trees in each individual plot to obtain the total fertilizer N recovery for loblolly pine trees on an individual plot basis. The difference between the amount of fertilizer N applied to the plot and the amount of fertilizer N recovered after a single growing season was considered lost from the system.

2.7. Statistical Analysis

Total fertilizer N recovery, expressed as a percentage of fertilizer N applied, was analyzed using a general linear model (GLM) analysis of variance with SAS® 9.4 (SAS Institute Inc., Cary, NC, USA). Percent data was arcsin transformed prior to analysis. Percent fertilizer N recovery (%) was the response variable for the model, fertilizer treatment (CUF, NBPT, PCU, urea, control) was the fixed effects, and site was a random effect. Total fertilizer N recovery, expressed as a percentage of fertilizer N applied, for individual ecosystem components were also analyzed using a GLM analysis of variance, except for analysis of individual mineral soil depth increments (0–15 cm, 15–30 cm) which were analyzed as a repeated measures analysis of variance. Significance levels were set at α = 0.05 and the p > |t| values for the treatment means were tested. All post-hoc analysis was conducted with Tukey’s HSD.

3. Results

Fertilization increased nitrogen concentrations (g·kg−1) in several of the ecosystem components. Foliar N mean (± SEM) concentrations increased from 12.5 ± 0.4 g·kg−1 in the control to between 13.2 ± 0.5 g·kg−1 and 14.2 ± 0.5 g·kg−1 for fertilizer treatments, with a significant difference between the control and urea (14.2 ± 0.5 g·kg−1) (Table 2). The fine branch N concentrations increased from the control (5.1 ± 0.3 g·kg−1) to CUF (7.3 ± 0.6 g·kg−1) and NBPT (6.7 ± 0.3 g·kg−1), while the coarse branch N concentration increased between the control (2.8 ± 0.2 g·kg−1) to urea (3.9 ± 0.4 g·kg−1). For the stem, the N concentration of the bark increased between the control (2.1 ± 0.2 g·kg−1) and NBPT (2.9 ± 0.1 g·kg−1), while the N concentration for the growth ring for the year after fertilization (CGR) increased from 1.8 ± 0.1 g·kg−1 for the control to between 2.3 ± 0.1 g·kg−1 and 2.7 ± 0.1 g·kg−1 for all fertilizer treatments. There were also minor effects of N fertilization on N concentration for fine or coarse roots, litterfall and the mineral soil. The forest floor N concentration was greater for both CUF (8.1 ± 0.6 g·kg−1) and PCU (8.7 ± 0.6 g·kg−1) compared to the control (6.6 ± 0.6 g·kg−1).
The mean (±SEM) δ15N (‰) values at the end of the first growing season after treatment application for all tree and soil ecosystem components were greater for fertilizer treatments compared to the control (Table 2). The mean δ15N values of loblolly pine trees for fertilizer treatments was greatest in the foliage (101.6‰ ± 9.8‰ to 126.1‰ ± 8.5‰), fine branches (98.7‰ ± 10.5‰ to 111.8‰ ± 7.4‰), and CGR (71.9 ± 7.6‰ to 88.1 ± 5.8‰). The δ15N values in litterfall (48.5‰ ± 1.4‰ to 55.8‰ ± 2.1‰) for the year immediately following fertilization of all fertilized treatments was lower than the foliage mean δ15N values. The lowest δ15N values for the loblolly pine components for fertilized treatments were in the coarse roots (13.9‰ ± 3.1‰ to 19.0‰ ± 3.2‰), bark (20.5‰ ± 2.4‰ to 22.5‰ ± 2.1‰), fine roots (31.2‰ ± 5.1‰ to 36.1‰ ± 3.1‰) and stemwood produced in the years prior to fertilization (PGR) (34.8‰ ± 5.0‰ to 40.3 ± 1.3‰). The δ15N value of the soil for the fertilized treatments was greatest in the forest floor (55.2‰ ± 6.3‰ to 91.1‰ ± 9.9‰), with PCU significantly greater than other fertilizer treatments. The surface 0–15 cm mineral soil ranged from 15.9‰ ± 2.1‰ to 22.3‰ ± 3.5‰ for fertilizer treatments, while the 15–30 cm mineral soil depth increment ranged from 11.7‰ ± 1.0‰ to 16.3‰ ± 3.0‰.
There were several significant differences in the mean (±SEM) fertilizer N recovery for individual ecosystem components (Figure 2, Table 2). The fertilizer N recovered in the loblolly pine trees was greatest in the foliage ranging from 8.1% ± 1.1% to 14.8% ± 1.8% of the N applied. More fertilizer N was recovered in the foliage for NBPT (14.8% ± 1.8%) compared to PCU (8.1% ± 1.1%). More fertilizer N was also recovered for NBPT (4.1% ± 0.5%) than the other fertilizer treatments (2.6% ± 0.5% to 3.2% ± 0.4%) for fine branches, and coarse branches for NBPT (3.0% ± 0.6%) compared to PCU (2.6% ± 0.5%). Fertilizer N recovery was greater for NBPT (3.1% ± 0.6%) for CGR than PCU (1.7% ± 0.3%) and urea (1.9 ± 0.3%), and the PGR for NBPT (5.1% ± 0.7%) compared to urea (2.9% ± 0.5%). For belowground loblolly pine biomass, more fertilizer N was recovered for EEFs (16.2% ± 1.5% to 19.2% ± 1.8%) compared to urea (10.8% ± 1.4%) in fine roots. In the soil, there was greater fertilizer N recovery for PCU (3.8% ± 0.9%) compared to the other fertilizer treatments (1.2% ± 0.4% to 3.0% ± 1.4%) in the forest floor, and for both PCU (10.7% ± 3.4%) and urea (11.3% ± 3.1%) compared to CUF (6.7% ± 1.1%) and NBPT (5.4% ± 0.9%) in the 15–30 cm mineral soil.
Differences between fertilizer treatments also occurred when individual ecosystem components were combined into primary components (tree, soil) (Figure 2). For the loblolly pine canopy (foliage, fine branches, coarse branches), fertilizer N recovery for NBPT (22.0%) was greater than PCU (13.3%). For the stem (bark, CGR, PGR), NBPT (9.1%) was greater than both PCU (5.9%) and urea (5.2%). When all aboveground biomass components are combined (canopy, stem), NBPT (31.0%) was greater than both PCU (19.2%) and urea (22.3%). For belowground biomass (total roots), all EEFs (CUF = 23.0%, NBPT = 18.9%, PCU = 19.3%) were greater than urea (12.5%). When all pine components were combined (canopy, stem, roots), both CUF (46.9%) and NBPT (49.9%) had a greater fertilizer N recovery compared to PCU (38.5%) and urea (34.8%). For the entire soil (forest floor, 0–30 cm mineral soil), the percentage of recovery was similar for EEFs (30.6% to 38.8%) and urea (28.4%). When all ecosystem components were combined to determine the total ecosystem recovery of fertilizer N, all the EEFs (CUF = 81.9%, NBPT = 84.2%, PCU = 79.8%) had a greater recovery total fertilizer N recovery compared to urea (65.2%).

4. Discussion

This study evaluated differences in the ecosystem retention and crop tree uptake of applied fertilizer N between urea and three enhanced efficiency fertilizers in mid-rotation pine plantations of the southeastern United States. The sites in this study covered the entire southeastern United States region where loblolly pine is planted to improve the understanding of the ultimate fate of fertilizer N in these systems to augment the results of numerous site specific studies. The primary hypotheses tested in this study were: (1) whether there were differences in the total fertilizer N recovery among conventional and enhanced efficiency fertilizers; and (2) if there were differences in the ecosystem partitioning of fertilizer N among conventional and enhanced efficiency N fertilizers. The overall primary objective was to improve fertilizer N use efficiency in southeastern pine plantations to increase the productivity and efficiency of these systems in a sustainable, environmentally responsible approach.
There were significant differences in the total ecosystem fertilizer N recovery among individual fertilizer treatments (CUF, NBPT, PCU, urea). The total ecosystem fertilizer N recovery was greater for all enhanced efficiency fertilizers (CUF, NBPT, PCU) compared to urea, with no differences between individual EEFs. The primary reason for lower fertilizer N recovery for urea compared to EEFs was likely due to initially large ammonia (NH3) volatilization losses from the urea treatment compared to the EEFs immediately following fertilization. Raymond et al. [49] compared NH3 volatilization losses of the same fertilizer treatments used in this study and found higher losses with urea (26%–49%) compared to all EEFs (4%–26%). Other studies in pine plantations in the southeastern United States have also shown fertilizer N losses through the NH3 volatilization pathway after urea fertilization exceeding 25%, with lower losses using various EEF products [47,48,64,65,66,69,70]. Interestingly, when the results for NH3 volatilization reported by Raymond et al. [49] 15 days following fertilization for the same fertilizer treatments used in this study are included in the treatments in respect to mass balance accounting of ecosystem fertilizer N recovery on a per plot basis, total ecosystem recovery of fertilizer N for each treatment exceeds 90%. This evidence indicates that greater fertilizer N loss via NH3 volatilization immediately following fertilization, combined with other minor initial fertilizer N loss pathways (denitrification, leaching) for urea compared to EEFs, translates to less fertilizer N remaining in the ecosystem for urea. Although the results from this study are similar to those of other tracer studies in a variety of ecosystems [39,40,71,72], results from this study indicated a generally higher fertilizer N uptake by trees for the EEFs.
Results from numerous studies specific to loblolly pine plantations and fertilizer N show generally lower fertilizer N uptake (<30%) by loblolly pine trees [21,22,23,24,25]. Several potential explanations for this low fertilizer N uptake by loblolly pine plantations exist. First, many studies in loblolly plantations have used urea as the fertilizer N source. Because high fertilizer N losses can occur immediately following fertilization with urea [46,47,48,49], less fertilizer N remains in the ecosystem and hence less fertilizer N is available for plant uptake. As previously stated, this explanation partially explains the results for the fertilizer N recovery in the loblolly pine trees in this study (35%) which is near the upper end reported in the literature. The fertilizer N recovery for the EEF treatments used in this study had higher fertilizer N recovery for the entire tree compared to urea, ranging from 39% to 50%. Clearly, the lower amount of fertilizer N remaining in the system when urea is used as a fertilizer source affects the quantity, and hence intensity, of fertilizer N in the soil over the growing season that becomes available for uptake by the desired crop trees. Second, the application of fertilizer N for this study in the spring (March-April) may have been more synchronous to the seasonal growth patterns of desired crop trees and could explain higher recovery rates of fertilizer N for all treatments found in this study. For example, results from Blazier et al. [25] had higher fertilizer N recovery after a spring and summer fertilization compared to a winter application, when operational N fertilization is traditionally conducted in southeastern pine plantations in an effort to minimize high NH3 volatilization losses. Although losses were high for urea compared to the EEFs, recovery for the entire tree for fertilizer N was greater compared to most fertilizer studies. This result may indicate that although losses can be high in the spring, conditions for N demand and uptake by the crop tree for a readily available N source may still be high. Low fertilizer N uptake by trees after fertilization during the dormant season (winter) in the south may cause other loss pathways, such as denitrification [51] and leaching [53] to become more important than NH3 volatilization and also contribute to lower fertilizer N recovery in studies. Third, many studies only account for N uptake in the foliage. Although foliage in loblolly pine trees has a high amount of N in the tree, other portions of the tree also contain N. If only N in the foliage is measured, N uptake may be underestimated.
There were also significant differences in ecosystem partitioning of fertilizer N among treatments. Analysis of the percent of fertilizer N recovered in individual ecosystem components (foliage, fine branches, soil, etc.) showed numerous differences among fertilizer treatments. Despite differences among fertilizer treatments in the percentage of fertilizer N recovered in different ecosystem components, most fertilizer N for all treatments was recovered in either the loblolly pine trees or soil. There was a difference for the fertilizer N recovered in the entire tree between NBPT and CUF and urea and PCU, yet no significant differences occurred in the soil. Although there were no significant differences in the percentage of fertilizer N in the soil, there was 10% more fertilizer N recovered (NS) for PCU compared to urea. This difference may have important implications for the long term fate and cycling of fertilizer N for PCU, which provides a more gradual constant release compared to the other fertilizers. Additionally, significantly higher amounts of fertilizer N were found in the fine roots of all EEFs compared to urea. This additional amount of fertilizer N was likely the result of a higher amount of fertilizer N in the soil and potentially greater root uptake for EEFs compared to urea.
Although results from this research showed a greater ecosystem recovery for each EEF compared to urea, several primary questions remain concerning the long-term fate of each of these fertilizer treatments. For example, significantly more fertilizer N was recovered in the forest floor for PCU than other treatments. Additionally, although not significant, there was a high proportion of fertilizer N recovered for all EEFs in the 0–15 cm mineral soil compared to urea. A shift in the ecosystem recovery of fertilizer N compared to urea in the ecosystem raises the question of whether additional gains in fertilizer nitrogen use efficiency for the system for EEFs will increase if it becomes bioavailable in the future of the stand or becomes immobilized in the system for the stand rotation.
Results from agroecosystems have shown that the majority of fertilizer N that is not incorporated into plant biomass during the initial growing season after fertilization becomes immobilized in the soil [73]. Similar results specific to fertilizer N immobilization in the soil have also been shown in forested systems [74,75,76,77,78]. Despite these results, laboratory experiments using a bioassay approach with soil collected from long term 15N tracer experiments show a measureable uptake of 15N labeled fertilizers by seedlings from both forest floor and mineral soil sources a decade after fertilization [79]. The mechanisms governing this disconnect between field and laboratory studies will require additional examination. Yet, if it is found that the additional fertilizer N becomes bioavailable to seedlings after the harvesting of the remaining stand, this finding could translate to additional gains in fertilizer nitrogen use efficiency in these managed pine ecosystems. At certain managed pine ecosystem sites, especially those which have been thinned, fertilizer management may include an initial fertilizer N application at stand establishment or shortly after. Yet, if the increase in existing fertilizer N remaining in the soil is found to be bioavailable, a management system may be altered to forgo the initial N fertilization while still maintaining high levels of productivity.
Extending research for this study to monitor the long term fate of the 15N enriched fertilizer treatments will be needed to answer the questions specific to the bioavailability of the fertilizer N remaining in the soil. Answering whether the increase in fertilizer N in the soil with EEFs will translate to a higher N availability for trees in these intensively managed pine ecosystems in the future or become immobilized and/or leached from the system is an important question to continue improving the economic viability and environmental stewardship of fertilization in these systems. If future research for the 15N plots used in this study find a majority of the fertilizer N immobilized in the soil for EEFs, as has been found with other studies using traditional N fertilizers in forest ecosystems, the primary question becomes whether fertilizer N application rates can be reduced by a percentage when compared to the traditional rates used in forestry while maintaining productivity. Results indicating either a higher fertilizer N availability for extended periods from the soil using EEFs and/or a reduction in fertilizer N application rates while maintaining productivity would assist in improving the FNUE efficiency of these pine plantation systems.
This research has continued to refine our understanding of the differences in the ecosystem fate and cycling of fertilizer N between enhanced efficiency and urea fertilizers through the use of stable isotopes in southeastern pine plantations. Results from this study are from a broad geographic region, and indicate similar cycling patterns and differences between enhanced efficiency N containing fertilizers compared to urea after a spring application. The results from this study provide forest managers a level of confidence that the enhanced efficiency products used in this research after a spring fertilization will have a generally higher fertilizer N ecosystem retention when compared with urea across the southeastern United States where pine plantations are intensively managed. The results from this study will continue to assist forest managers in improving fertilizer nitrogen use efficiency in pine plantations across the southeastern United States.

5. Conclusions

The principal results of this study were: (1) there was a greater amount of fertilizer N recovered from the ecosystem for all EEFs compared to urea; and (2) there were differences in the ecosystem partitioning of fertilizer N among treatments. The reduced ecosystem loss of fertilizer N for all EEFs compared to urea may translate to an increased quantity of fertilizer N remaining in the system that could be available for crop tree N uptake and increase the FNUE for the EEFs used in this study compared to urea. The increased fertilizer N retention in the soil for all EEFs, although not significant, may also contribute to increasing FNUE over the course of the stand rotation if the increased quantity of soil N translates to an increase in intensity of N supply. Additional research will be required to determine the long term fate of EEFs in forest plantations, and whether this added quantity of soil N from fertilization using EEFs translates to increased productivity. The results from this study will continue to improve site specific management and increase the efficiency of southeastern pine plantations. The use of enhanced efficiency fertilizers, if found to be economically viable, could provide managers the flexibility to apply fertilizer N under a variety of conditions to improve the synchronicity of fertilizer application and plant N demand.

Acknowledgments

This research was primarily supported by the Forest Productivity Cooperative (FPC), the National Science Foundation Center for Advanced Forest Systems (CAFS) and the United States Department of Agriculture National Institute of Food and Agriculture McIntire-Stennis Capacity Grant. We thank David Mitchem for assistance in the laboratory, Andy Laviner and Eric Carbaugh for field assistance and the numerous work study and seasonal student employees for both field and laboratory assistance.

Author Contributions

“Thomas Fox, Jay Raymond and Brian Strahm conceived and designed the experiments. Jay Raymond performed the experiments. Jay Raymond analyzed the data; Thomas Fox and Brian Strahm contributed reagents/materials/analysis tools; Jay Raymond wrote the paper.

Conflicts of Interest

The authors declare no conflict of interest.

References

  1. Schultz, R.P. The Ecology and Culture of Loblolly Pine (Pinus taeda L.); Agriculture Handbook #713; USDA Forest Service: Washington DC, USA, 1997; p. 493.
  2. US Department of Agriculture (USDA), Forest Service. Future of America’s Forest and Rangelands: Forest Service 2010 Resources Planning Act Assessment; US Department of Agriculture (USDA), Forest Service: Washington DC, USA, 2012; p. 198. Available online: http://www.fs.fed.us/research/publications/gtr/gtr_wo87.pdf (accessed on 5 February 2016).
  3. Fox, T.R.; Jokela, E.J.; Allen, H.L. The development of pine plantation silviculture in the southern United States. J. For. 2007, 105, 337–347. [Google Scholar]
  4. Allen, H.L. Forest fertilizers: Nutrient amendment, and productivity, and environmental impact. J. For. 1987, 85, 37–46. [Google Scholar]
  5. Fox, T.R.; Allen, H.L.; Albaugh, T.J.; Rubilar, R.; Carlson, C.A. Tree nutrition and forest fertilization of pine plantations in the southern United States. South. J. Appl. For. 2007, 31, 5–11. [Google Scholar]
  6. Miller, H.G. Forest fertilization: Some guiding concepts. Forestry 1981, 54, 157–167. [Google Scholar] [CrossRef]
  7. Chapin, F.S.; Vitousek, P.M.; Van Cleve, K. The nature of nutrient limitation in plant-communities. Am. Nat. 1986, 127, 48–58. [Google Scholar] [CrossRef]
  8. Vitousek, P.M.; Howarth, R.W. Nitrogen limitation on land and in the sea—How can it occur? Biogeochemistry 1991, 13, 87–115. [Google Scholar] [CrossRef]
  9. Linder, S. Responses to water and nutrients in coniferous ecosystems. In Potentials and Limitations of Ecosystems Analysis; Schulze, E.D., Wolfer, H.Z., Eds.; Springer-Verlag: New York, NY, USA, 1987; pp. 180–202. [Google Scholar]
  10. LeBauer, D.S.; Treseder, K.K. Nitrogen limitation of net primary productivity in terrestrial ecosystems is globally distributed. Ecology 2008, 89, 371–379. [Google Scholar] [CrossRef] [PubMed]
  11. Switzer, C.L.; Nelson, L.E. Nutrient accumulation and cycling in loblolly pine (Pinus taeda L.) plantation ecosystems: The first 20 years. Soil Sci. Soc. Am. Proc. 1972, 36, 143–147. [Google Scholar] [CrossRef]
  12. Wells, C.G.; Jorgensen, J.R. Effect of intensive harvesting on nutrient supply and sustained productivity. In Proceedings of the Impacts of Intensive Harvesting on Forest Nutrient Cycling, Syracuse, NY, USA, 1979; pp. 212–230.
  13. Vitousek, P.M.; Matson, P.A. Intensive harvesting and site preparation decrease soil nitrogen availability in young plantations. South. J. Appl. For. 1985, 9, 120–125. [Google Scholar]
  14. Fox, T.R.; Burger, J.A.; Kreh, R.E. Effects of site preparation on nitrogen dynamics in the southern Piedmont. For. Ecol. Manag. 1986, 15, 241–256. [Google Scholar] [CrossRef]
  15. Birk, E.M.; Vitousek, P.M. Nitrogen availability and nitrogen use efficiency in loblolly pine stands. Ecology 1986, 67, 69–79. [Google Scholar] [CrossRef]
  16. Pritchett, W.L.; Smith, W.H. Fertilizer response in young slash pine stands. Soil Sci. Soc. Am. J. 1972, 36, 660–663. [Google Scholar] [CrossRef]
  17. Martin, S.W.; Bailey, R.L.; Jokela, E.J. Growth and yield predictions for lower Coastal Plain slash pine plantations fertilized at mid-rotation. South. J. Appl. For. 1999, 23, 39–45. [Google Scholar]
  18. Amateis, R.L.; Liu, J.; Ducey, M.J.; Allen, H.L. Modeling response to midrotation nitrogen and phosphorus fertilization in loblolly pine plantations. South. J. Appl. For. 2000, 24, 207–212. [Google Scholar]
  19. Carlson, C.A.; Fox, T.R.; Allen, H.L.; Albaugh, T.J.; Rubilar, R.A.; Stape, J.L. Growth responses of loblolly pine in the southeast united states to midrotation applications of nitrogen, phosphorus, potassium, and micronutrients. For. Sci. 2014, 60, 157–169. [Google Scholar] [CrossRef]
  20. Rojas, J.C. Factors influencing responses of loblolly pine stands to fertilization. Ph.D. Dissertation, North Carolina State University, Raleigh, NC, USA, 2005. [Google Scholar]
  21. Mead, D.J.; Pritchett, W.L. Fertilizer movement in a slash pine ecosystem. Plant Soil 1975, 43, 451–465. [Google Scholar] [CrossRef]
  22. Melin, J.; Nommik, H.; Lohm, U.; Flower-Ellis, J. Fertilizer nitrogen budget in a Scots pine ecosystem attained by using root-isolated plots and 15N technique. Plant Soil 1983, 74, 249–263. [Google Scholar] [CrossRef]
  23. Johnson, D.W.; Todd, D.E. Nitrogen fertilization of young yellow poplar and loblolly pine plantations at differing frequencies. Soil Sci. Soc. Am. J. 1988, 52, 1468–1477. [Google Scholar] [CrossRef]
  24. Albaugh, T.J.; Allen, H.L.; Dougherty, P.M.; Johnsen, K.H. Long term growth responses of loblolly pine to optimal nutrient and water resource availability. For. Ecol. Manag. 2004, 192, 3–19. [Google Scholar] [CrossRef]
  25. Blazier, M.A.; Hennessey, T.C.; Dougherty, P.; Campbell, R. Nitrogen accumulation and use by a young loblolly pine plantation in southeast Oklahoma: Effects of fertilizer formulation and date of application. South. J. Appl. For. 2006, 30, 66–78. [Google Scholar]
  26. Raison, R.J.; Khanna, P.K.; Connell, M.J.; Falkiner, R.A. Effects of water availability and fertilization on nitrogen cycling in a stand of Pinus radiate. For. Ecol. Manag. 1990, 30, 31–43. [Google Scholar] [CrossRef]
  27. Kiser, L.C.; Fox, T.R. Soil accumulation of nitrogen and phosphorus following annual fertilization of loblolly pine and sweetgum on sandy sites. Soil Sci. Soc. Am. J. 2012, 76, 2278–2288. [Google Scholar] [CrossRef]
  28. Villanueva, A.T. Impacts of Fertilization on Soil Properties in Loblolly Pine Plantations in the Southeastern United States. Master’s Thesis, Virginia Polytechnic Institute and State University, Blacksburg, VA, USA, 2015. [Google Scholar]
  29. Fisher, R.F.; Binkley, D. Ecology and Management of Forest Soils; John Wiley & Sons: New York, NY, USA, 2000. [Google Scholar]
  30. Flint, C.M. Leaching of Nitrogen from the Rooting Zone of Douglas-Fir Forests Following Urea Fertilization and Potential Impacts on the Water Quality of Hood Canal. Master’s Thesis, University of Washington, Seattle, WA, USA, 2007. [Google Scholar]
  31. Knowles, R.; Blackburn, T.H. Nitrogen Isotope Techniques; Academic Press, Inc.: New York, NY, USA, 1993. [Google Scholar]
  32. Nadelhoffer, K.J.; Fry, B. Nitrogen isotope studies in forest ecosystems. In Stable Isotopes in Ecology and Environmental Science; Lajtha, K., Michener, R.H., Eds.; Blackwell Scientific Publications: New York, NY, USA, 1994; pp. 22–44. [Google Scholar]
  33. Robinson, D. δ15N as an integrator of the nitrogen cycle. Trends Ecol. Evol. 2001, 16, 153–162. [Google Scholar] [CrossRef]
  34. Dawson, T.E.; Mambelli, S.; Plamboeck, A.H.; Templer, P.H.; TuSource, K.P. Stable isotopes in plant ecology. Annu. Rev. Ecol. Syst. 2002, 33, 507–559. [Google Scholar] [CrossRef]
  35. Hauck, R.D.; Bystrom, M. 15N-A Selected Bibliography for Agricultural Scientists; The Iowa State University Press: Ames, IA, USA, 1971; p. 206. [Google Scholar]
  36. Hauck, R.D. Nitrogen source requirements in different soil-plant systems. In Forest Fertilization: Theory and Practice; TVA National Fertilizer Development Center: Muscle Shoals, AL, USA, 1968; pp. 47–57. [Google Scholar]
  37. Currie, W.S.; Nadelhoffer, K.J. Dynamic redistribution of isotopically labeled cohorts of nitrogen inputs in two temperate forests. Ecosystems 1999, 2, 4–18. [Google Scholar] [CrossRef]
  38. Dinkelmeyer, H.; Lehmann, J.; Renck, A.; Trujillo, L.; Pereira da Silva, J., Jr.; Gebauer, G.; Kaiser, K. Nitrogen uptake from 15N-enriched fertilizer by four tree crops in an Amazonian agroforest. Agrofor. Syst. 2003, 57, 213–224. [Google Scholar] [CrossRef]
  39. Nadelhoffer, K.J.; Colman, B.P.; Currie, W.S.; Magill, A.; Aber, J.D. Decadal-scale fates of 15 N tracers added to oak and pine stands under ambient and elevated N inputs at the Harvard Forest (USA). For. Ecol. Manag. 2004, 196, 89–107. [Google Scholar] [CrossRef]
  40. Tietema, A.; Emmett, B.A.; Gundersen, P.; Kjonaas, O.J.; Koopmans, C.J. The fate of 15N-labelled nitrogen deposition in coniferous forest ecosystems. For. Ecol. Manag. 1998, 101, 19–27. [Google Scholar] [CrossRef]
  41. Templer, P.H.; Mack, M.C.; Chapin, F.S., III; Christenson, L.M.; Compton, J.E.; Crook, H.D.; Currie, W.S.; Curtis, C.J.; Dail, D.B.; D’Antonio, C.M.; et al. Sinks for nitrogen inputs in terrestrial ecosystems: A meta-analysis of 15N tracer field studies. Ecology 2012, 93, 1816–1829. [Google Scholar] [CrossRef] [PubMed] [Green Version]
  42. Chang, S.X.; Preston, C.M.; McCullough, K.; Weetman, G.; Barker, J. Effect of understory competition on distribution and recovery of 15N applied to a western red cedar—Western hemlock clear-cut site. Can. J. For. Res. 1996, 26, 313–321. [Google Scholar] [CrossRef]
  43. Bubb, K.A.; Xu, Z.H.; Simpson, J.A.; Saffigna, P.G. Growth response to fertilization and recovery of l5N-labelled fertilizer by young hoop pine plantations of subtropical Australia. Nutr. Cycling Agroecosystems 1999, 54, 81–92. [Google Scholar] [CrossRef]
  44. Werner, A.T. Nitrogen Release, Tree Uptake, and Ecosystem Retention in a Mid-Rotation Loblolly Pine Plantation Following Fertilization with 15N-Enriched Enhanced Efficiency Fertilizers. Master’s Thesis, Virginia Tech, Blacksburg, VA, USA, 2013. [Google Scholar]
  45. Zhang, X.; Mauzerall, D.L.; Davidson, E.A.; Kanter, D.R.; Cai, R. The economic and environmental consequences of implementing nitrogen-efficient technologies and management practices in agriculture. J. Environ. Qual. 2015, 44, 312–324. [Google Scholar] [CrossRef] [PubMed]
  46. Cabrera, M.L.; Kissel, D.E.; Vaio, N.; Craig, J.R.; Rema, J.A.; Morris, L.A. Loblolly pine needles retain urea fertilizer that can be lost as ammonia. Soil Sci. Soc. Am. J. 2005, 69, 1525–1531. [Google Scholar] [CrossRef]
  47. Zerpa, J.L.; Fox, T.R. Controls on volatile NH3 losses from loblolly pine plantations fertilized with urea in the southeast USA. Soil Sci. Soc. Am. J. 2011, 75, 257–266. [Google Scholar] [CrossRef]
  48. Elliot, J.R.; Fox, T.R. Ammonia volatilization following fertilization with urea or ureaform in a thinned loblolly pine plantation. Soil Sci. Soc. Am. J. 2014, 78, 1469–1473. [Google Scholar] [CrossRef]
  49. Raymond, J.E.; Fox, T.R.; Strahm, B.; Zerpa, J. Ammonia Volatilization following Nitrogen Fertilization with Enhanced Efficiency Fertilizers and Urea in Loblolly Pine Plantations of the Southern United States. For. Ecol. Manag. 2016, 376, 247–255. [Google Scholar] [CrossRef]
  50. Engel, R.; Jones, C.; Wallander, R. Ammonia volatilization from urea and mitigation by by NBPT following surface application to cold soils. Soil Sci. Soc. Am. J. 2011, 75, 2348–2357. [Google Scholar] [CrossRef]
  51. Shrestha, R.; Strahm, B.D.; Sucre, E.B. Nitrous oxide fluxes in fertilized Pinus taeda plantations across a gradient of soil drainage classes. J. Environ. Qual. 2014, 43, 1823–1832. [Google Scholar] [CrossRef] [PubMed]
  52. Binkley, D.; Carter, R.; Allen, H.L. Nitrogen fertilization practices in forestry. In Nitrogen Fertilization and the Environment; Bacon, P., Ed.; Marcel Dekker: New York, NY, USA, 1995; pp. 421–441. [Google Scholar]
  53. Aust, W.M.; Blinn, C.R. Forestry best management practices for timber harvesting and site preparation in the eastern United States: An overview of water quality and productivity research during past 20 years. Water Air Soil Poll. Focus 2004, 4, 5–36. [Google Scholar] [CrossRef]
  54. Galloway, J.N.; Aber, J.D.; Erisman, J.W.; Seitzinger, S.P.; Howarth, R.W.; Cowling, E.B.; Cosby, B.J. The Nitrogen Cascade. Bioscience 2003, 53, 341–356. [Google Scholar] [CrossRef]
  55. Chien, S.H.; Prochnow, L.I.; Cantarella, H. Recent developments of Fertilizer Production and Use to Improve Nutrient Efficiency and Minimize Environmental Impacts. In Advances in Agronomy 102; Elsevier Inc.: Newark, NJ, USA, 2009; pp. 267–322. [Google Scholar]
  56. Trenkel, M.E. Slow-and Controlled-Release and Stabilized Fertilizers: An option for Enhancing Nutrient Use Efficiency in Agriculture; IFA, International Fertilizer Industry Association: Paris, France, 2010. [Google Scholar]
  57. Azeem, B.; KuShaari, K.; Man, Z.B.; Basit, A.; Thanh, T.H. Review on materials & methods to produce controlled release coated urea fertilizer. J. Control. Release 2014, 181, 11–21. [Google Scholar] [PubMed]
  58. Fertilizer Institute. Available online: https://www.tfi.org/introduction-fertilizer/nutrient-science/enhanced-efficiency-fertilizers (accessed on 11 October 2015).
  59. AAPFCO. Association of American Plant Food Control Officials. 2011. Available online: http://www.aapfco.org/index.html (accessed on 1 October 2015).
  60. Shaviv, A. Controlled Release Fertilizers. IFA International Workshop on Enhanced-Efficiency Fertilizers, Frankfurt; International Fertilizer Industry Association: Paris, France, 2005. [Google Scholar]
  61. Hauck, R.D. Slow release and bio-inhibitor-amended nitrogen fertilizers. In Fertilizer Technology and Use, 3rd ed.; Engelstad, O.P., Ed.; SSSA: Madison, WI, USA, 1985; pp. 293–322. [Google Scholar]
  62. Goertz, H.M. Controlled Release Technology. In Kirk-Othmer Encyclopedia of Chemical Technology; Controlled Release Technology (Agricultural): New York, NY, USA, 1993; pp. 251–274. [Google Scholar]
  63. Gowariker, V.; Krishnamurthy, V.N.; Gowariker, S.; Dhanorkar, M.; Paranjape, K. The Fertilizer Encyclopedia; John Wiley & Sons, Inc.: Hoboken, NJ, USA, 2009. [Google Scholar]
  64. Bremner, J.M.; Douglas, L.A. Inhibition of urease activity in soils. Soil Biol. Biochem. 1971, 3, 297–307. [Google Scholar] [CrossRef]
  65. Bremner, J.M.; Chai, H.S. Evaluation of N-butyl phosphorothioic triamide for retardation of urea hydrolysis in soil. Commun. Soil Sci. Plant Anal. 1986, 17, 337–351. [Google Scholar] [CrossRef]
  66. Högberg, P. 15N natural abundance in soil-plant systems. New Phytol. 1997, 137, 179–203. [Google Scholar] [CrossRef]
  67. Powlson, D.S.; Barraclough, D. Mineralization and assimilation in soil-plant systems. In Nitrogen Isotope Techniques; Academic Press, Inc.: New York, NY, USA, 1993; pp. 209–242. [Google Scholar]
  68. Nadelhoffer, K.J.; Downs, M.R.; Fry, B.; Aber, J.D.; Magill, A.H.; Melillo, J.M. The Fate of 15N-Labelled Nitrate Additions to a Northern Hardwood Forest in Eastern Maine, USA. Oecologia 1995, 103, 292–301. [Google Scholar] [CrossRef]
  69. Kissel, D.; Cabrera, M.; Vaio, N.; Craig, J.; Rema, J.; Morris, L. Rainfall timing and ammonia loss from urea in a loblolly pine plantation. Soil Sci. Soc. Am. J. 2004, 68, 1744–1750. [Google Scholar] [CrossRef]
  70. Kissel, D.; Cabrera, M.L.; Vaio, N.; Craig, J.R.; Rema, J.A.; Morris, L.A. Forest floor composition and ammonia loss from urea in a loblolly pine plantation. Soil Sci. Soc. Am. J. 2009, 73, 630–637. [Google Scholar] [CrossRef]
  71. Burke, I.C.; Lauenroth, W.K. Ecosystem ecology at regional scales. Ecology 2002, 83, 305–306. [Google Scholar] [CrossRef]
  72. Blanes, M.C.; Emmett, B.A.; Viñegla, B.; Carreira, J.A. Alleviation of P limitation makes tree roots competitive for N against microbes in a N-saturated conifer forest: A test through P fertilization and 15N labelling. Soil Biol. Biochem. 2012, 48, 51–59. [Google Scholar] [CrossRef]
  73. Preston, C.M. The availability of residual fertilizer nitrogen immobilized as clay-fixed ammonium and organic N. Can. J. Soil Sci. 1982, 62, 479–486. [Google Scholar] [CrossRef]
  74. Foster, N.W.; Beauchamp, E.G.; Corke, C.T. Reactions of 15N-labelled urea with Jack pine forest floor materials. Soil Biol. Biochem. 1985, 17, 699–703. [Google Scholar] [CrossRef]
  75. Foster, N.W.; Beauchamp, E.G.; Corke, C.T. Immobilization of 15N-labelled urea in a Jack pine forest floor. Soil Sci. Soc. Am. J. 1985, 49, 448–452. [Google Scholar] [CrossRef]
  76. Hulm, S.C.; Killham, K. Response over two growing seasons of a Sitka spruce stand to l5N-urea fertilizer. Plant Soil. 1990, 124, 65–72. [Google Scholar] [CrossRef]
  77. NÔmmik, H.; Larsson, K. Effects of nitrogen source and placement on fertilizer 15N enrichment in Pinus sylvestris foliage. Scand. J. For. Res. 1992, 7, 155–163. [Google Scholar] [CrossRef]
  78. Preston, C.M.; Mead, D.J. Growth response and recovery of 15N-fertilizer one and eight growing season after application to lodgepole pine in British Columbia. For. Ecol. Manag. 1994, 65, 219–229. [Google Scholar] [CrossRef]
  79. Swanston, C.W.; Preston, C.M. Availability of residual fertilizer 15N from forest floor and mineral soil to Douglas-fir seedlings ten years after fertilization. Plant Soil 2014, 381, 381–394. [Google Scholar] [CrossRef]
Figure 1. Location map of 12 mid-rotation pine stands across the southeastern United States selected to evaluate ecosystem partitioning of fertilizer N following the application of urea or enhanced efficiency N fertilizers enriched with 15N.
Forests 07 00270 g001
Figure 2. The total fertilizer N recovery (% of fertilizer N applied) of the major ecosystem components (Tree—loblolly pine aboveground + belowground biomass, understory, litterfall, and soil (O horizon + mineral soil- 0 to 30 cm) for pine stands in the southeastern United States selected to evaluate ecosystem partitioning of fertilizer N of urea or enhanced efficiency N fertilizers enriched with 15N. Data represents fertilizer application dates for spring (March–April 2012). Different letters represent significant differences at α = 0.05. Different letter fonts represent comparisons among treatments between same ecosystem components (soil, litterfall, understory, tree). n = 12.
Forests 07 00270 g002
Table 1. Selected climate, physical and stand characteristics of pine stands in the southeastern United States selected to evaluate ecosystem partitioning of fertilizer N following application of urea or enhanced efficiency N fertilizers enriched with 15N. MAP = Mean annual precipitation. MAT = Mean annual temperature.
StateLatitudeLongitudeAlt (m)MAP (cm)MAT (°C)Physiographic RegionSoil Taxonomic ClassDrainage ClassTrees plot−1Trees ha−1Ht (m)DBH (cm)
VA37.44533178.6629176010913Piedmontfine, mixed, subactive, mesic Typic HapludultsWell88809.115.1
SC34.45000080.5053832910716Sandhillsthermic coated Typic QuartzipsammentsExcessively15156012.516.1
GA133.62531782.8011833511816Piedmontfine kaolinitic thermic Rhodic KandiudultsWell1918007.28.6
GA231.33997881.857283111418Atlantic Coastal Plainsandy siliceous thermic Aeric AlaquodsPoorly15146014.716.5
GA331.29933381.847217111418Atlantic Coastal Plainloamy, siliceous, subactive, thermic Arenic PaleaquultsSomewhat Poorly13134013.615.1
FL30.20526783.8668170.614220Eastern Gulf Coastal Plainloamy siliceous superactive thermic Aquic Arenic HapludalfsSomewhat Poorly16158010.213.4
MS31.06671789.6024672615219Western Gulf Coastal Plaincoarse loamy siliceous subactive thermic Typic PaleudultsWell21216012.513.8
LA131.33701793.1827832814719Western Gulf Coastal Plainfine smectitic thermic Albaquic HapludalfsModerately Well772014.919.3
LA231.01333393.4226002814719Western Gulf Coastal Plainfine loamy siliceous subactive thermic Plinthic PaleudultsWell678014.817.5
LA330.56053390.7276500.916019Western Gulf Coastal Plainfine silty mixed active thermic Typic GlossaqualfsPoorly23238012.013.3
OK34.02933394.8250174213616Western Gulf Coastal Plainfine silty mixed active thermic Aquic PaleudalfsModerately well1515803.04.0
TX31.1325594.4625333212720Western Gulf Coastal Plainfine loamy siliceous semiacitve thermic Oxyaquic GlossudalfsModerately well13136013.911.2
Table 2. The mean fertilizer N recovery (% of applied fertilizer N), δ15N (‰), and N concentration (g·kg−1) for individual ecosystem components of pine stands in the southeastern United States selected to evaluate ecosystem partitioning of fertilizer N for urea or enhanced efficiency N containing fertilizers enriched with 15N.
Ecosystem ComponentTreatmentFertilizer N Recovery (% of Applied N)δ15N values (‰)N Concentration (g·kg−1)
FoliageControl0.0 a−2.4 (0.5) a12.5 (0.4) a
CUF10.7 (1.1) bc118.3 (11.2) b14.1 (0.8) ab
NBPT14.8 (1.8) c126.1 (8.5) b13.9 (0.6) ab
PCU8.1 (1.1) b101.6 (9.8) b13.2 (0.5) ab
Urea11.0 (1.7) bc124.5 (11.2) b14.2 (0.5) b
Fine BranchesControl0.0 a−2.0 (0.6) a5.1 (0.3) a
CUF3.2 (0.4) b110.2 (10.2) b7.3 (0.6) b
NBPT4.1 (0.5) c111.8 (7.4) b6.7 (0.3) b
PCU2.6 (0.5) b98.7 (10.5) b6.1 (0.5) ab
Urea2.9 (0.5) b108.4 (9.67) b6.2 (0.4) ab
Coarse BranchesControl0.0 a−1.8 (0.4) a2.8 (0.2) a
CUF2.9 (0.4) bc72.6 (9.3) b3.7 (0.3) ab
NBPT3.0 (0.6) c78.9 (8.2) b3.6 (0.4) ab
PCU2.6 (0.4) b73.7 (8.6) b3.3 (0.3) ab
Urea3.2 (1.0) bc69.3 (6.1) b3.9 (0.4) b
BarkControl0.0 a−2.1 (0.4) a2.1 (0.2) a
CUF0.6 (0.2) b22.1 (2.1) b2.5 (0.2) ab
NBPT0.8 (0.2) b22.5 (2.1) b2.9 (0.1) b
PCU0.5 (0.1) b20.5 (2.4) b2.4 (0.1) a
Urea0.4 (0.1) ab20.8 (2.1) b2.5 (0.2) ab
Current year Growth Ring (CGR)- year of fertilizationControl0.0 a−1.9 (0.4) a1.8 (0.1) a
CUF2.2 (0.4) bc80.0 (8.0) b2.4 (0.5) bc
NBPT3.1 (0.6) c88.1 (5.8) b2.7 (0.1) c
PCU1.7 (0.3) b71.9 (7.6) b2.3 (0.1) b
Urea1.9 (0.3) b78.9 (7.5) b2.3 (0.1) b
Previous year growth rings (PGR)—growth prior to fertilizationControl0.0 a−1.9 (0.4) a1.4 (0.1) a
CUF4.4 (0.8) bc40.2 (3.9) b1.6 (0.1) a
NBPT5.1 (0.7) c40.3 (1.3) b1.6 (0.1) a
PCU3.7 (0.4) bc37.1 (3.9) b1.6 (0.1) a
Urea2.9 (0.5) b34.8 (5.0) b1.4 (0.1) a
Fine roots (<2 mm)Control0.0 a−0.3 (0.9) a9.4 (0.9) a
CUF19.2 (1.8) c36.1 (3.1) b10.5 (0.6) a
NBPT16.2 (1.5) c33.2 (3.8) b10.4 (0.4) a
PCU16.4 (1.8) c36.0 (3.5) b10.3 (0.5) a
Urea10.8 (1.4) b31.2 (5.1) b9.7 (0.5) a
Coarse roots (>2 mm)Control0.0 a−0.1 (0.37) a6.0 (0.6) a
CUF3.8 (1.4) b18.3 (1.6) b6.2 (0.5) a
NBPT2.7 (0.6) ab19.0 (3.2) b6.3 (0.5) a
PCU2.9 (0.9) b15.4 (2.2) b6.0 (0.5) a
Urea1.7 (0.5) ab13.9 (3.1) b6.0 (0.5) a
LitterfallControl0.0 a−3.0 (1.2) a7.4 (0.3) a
CUF1.6 (0.3) b48.5 (1.4) b8.0 (0.3) a
NBPT1.4 (0.2) b55.8 (2.1) b8.3 (0.4) a
PCU1.8 (0.3) b55.6 (1.6) b8.1 (0.3) a
Urea1.7 (0.2) b55.1 (1.4) b8.2 (0.2) a
Forest Floor (Organic horizon: Oi + Oe + Oa)Control0.0 a−1.9 (0.4) a6.6 (0.6) a
CUF3.0 (1.4) a62.9 (6.8) b8.1 (0.6) b
NBPT2.8 (1.3) a59.3 (5.8) b8.0 (0.6) ab
PCU3.8 (0.9) b91.1 (9.9) c8.7 (0.6) b
Urea1.2 (0.4) a55.2 (6.3) b8.0 (0.7) ab
0–15 cm Mineral SoilControl0.0 a3.3 (0.7) a0.8 (0.1) a
CUF23.1 (3.6) b21.8 (3.6) b0.6 (0.1) b
NBPT22.4 (2.7) b22.3 (3.5) b0.6 (0.1) ab
PCU24.2 (5.1) b21.0 (4.1) b0.7 (0.1) ab
Urea15.9 (2.6) b15.9 (2.1) b0.6 (0.1) ab
15–30 cm Mineral SoilControl0.0 a5.4 (0.4) a0.4 (0.1) a
CUF6.7 (1.1) a13.2 (1.5) b0.4 (0.0) a
NBPT5.4 (0.9) a11.7 (1.0) b0.4 (0.1) a
PCU10.7 (3.4) b16.3 (3.0) b0.4 (0.0) a
Urea11.3 (3.1) b15.2 (2.4) b0.4 (0.1) a
Different letters represent significant differences at α = 0.05. Numbers in parentheses represent the standard error of the mean (n = 12).

