
Spatial Pattern of the Mitochondrial and Chloroplast Genetic Variation in Poland as a Result of the Migration of Abies alba Mill. from Different Glacial Refugia

Abstract
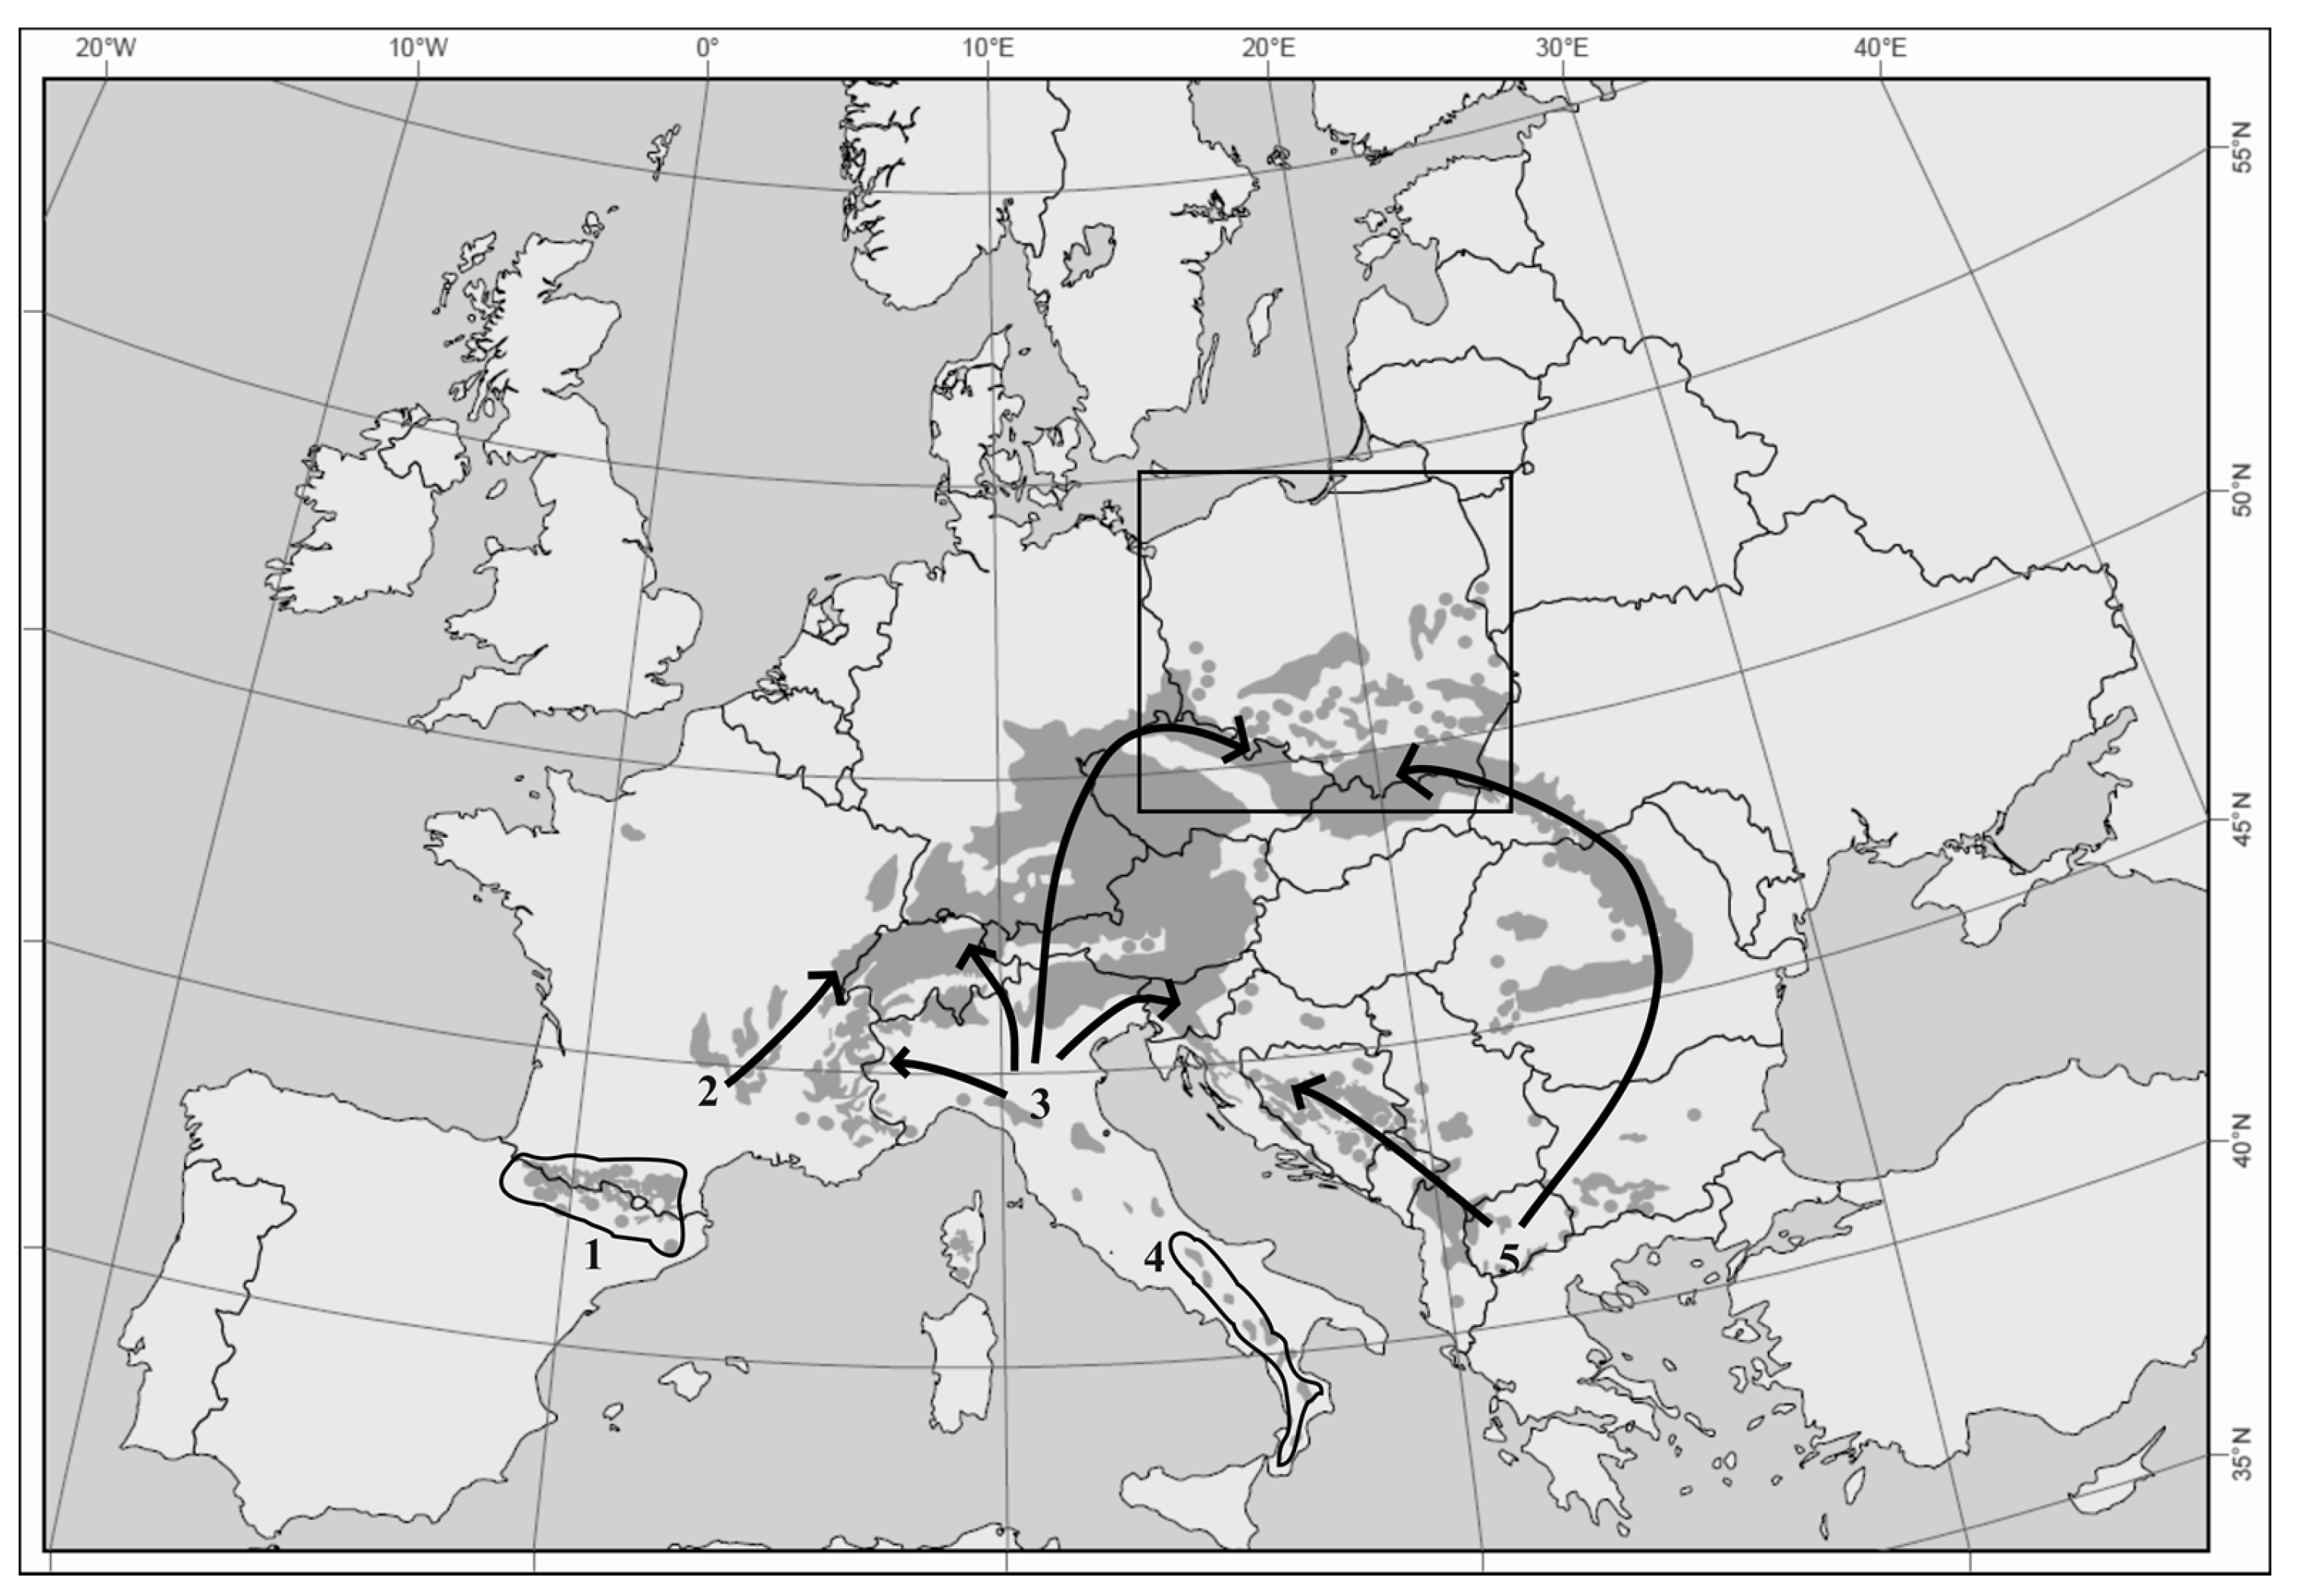
:1. Introduction
2. Materials and Methods
2.1. Plant Material and Genetic Analyses
2.2. Data Analyses
3. Results
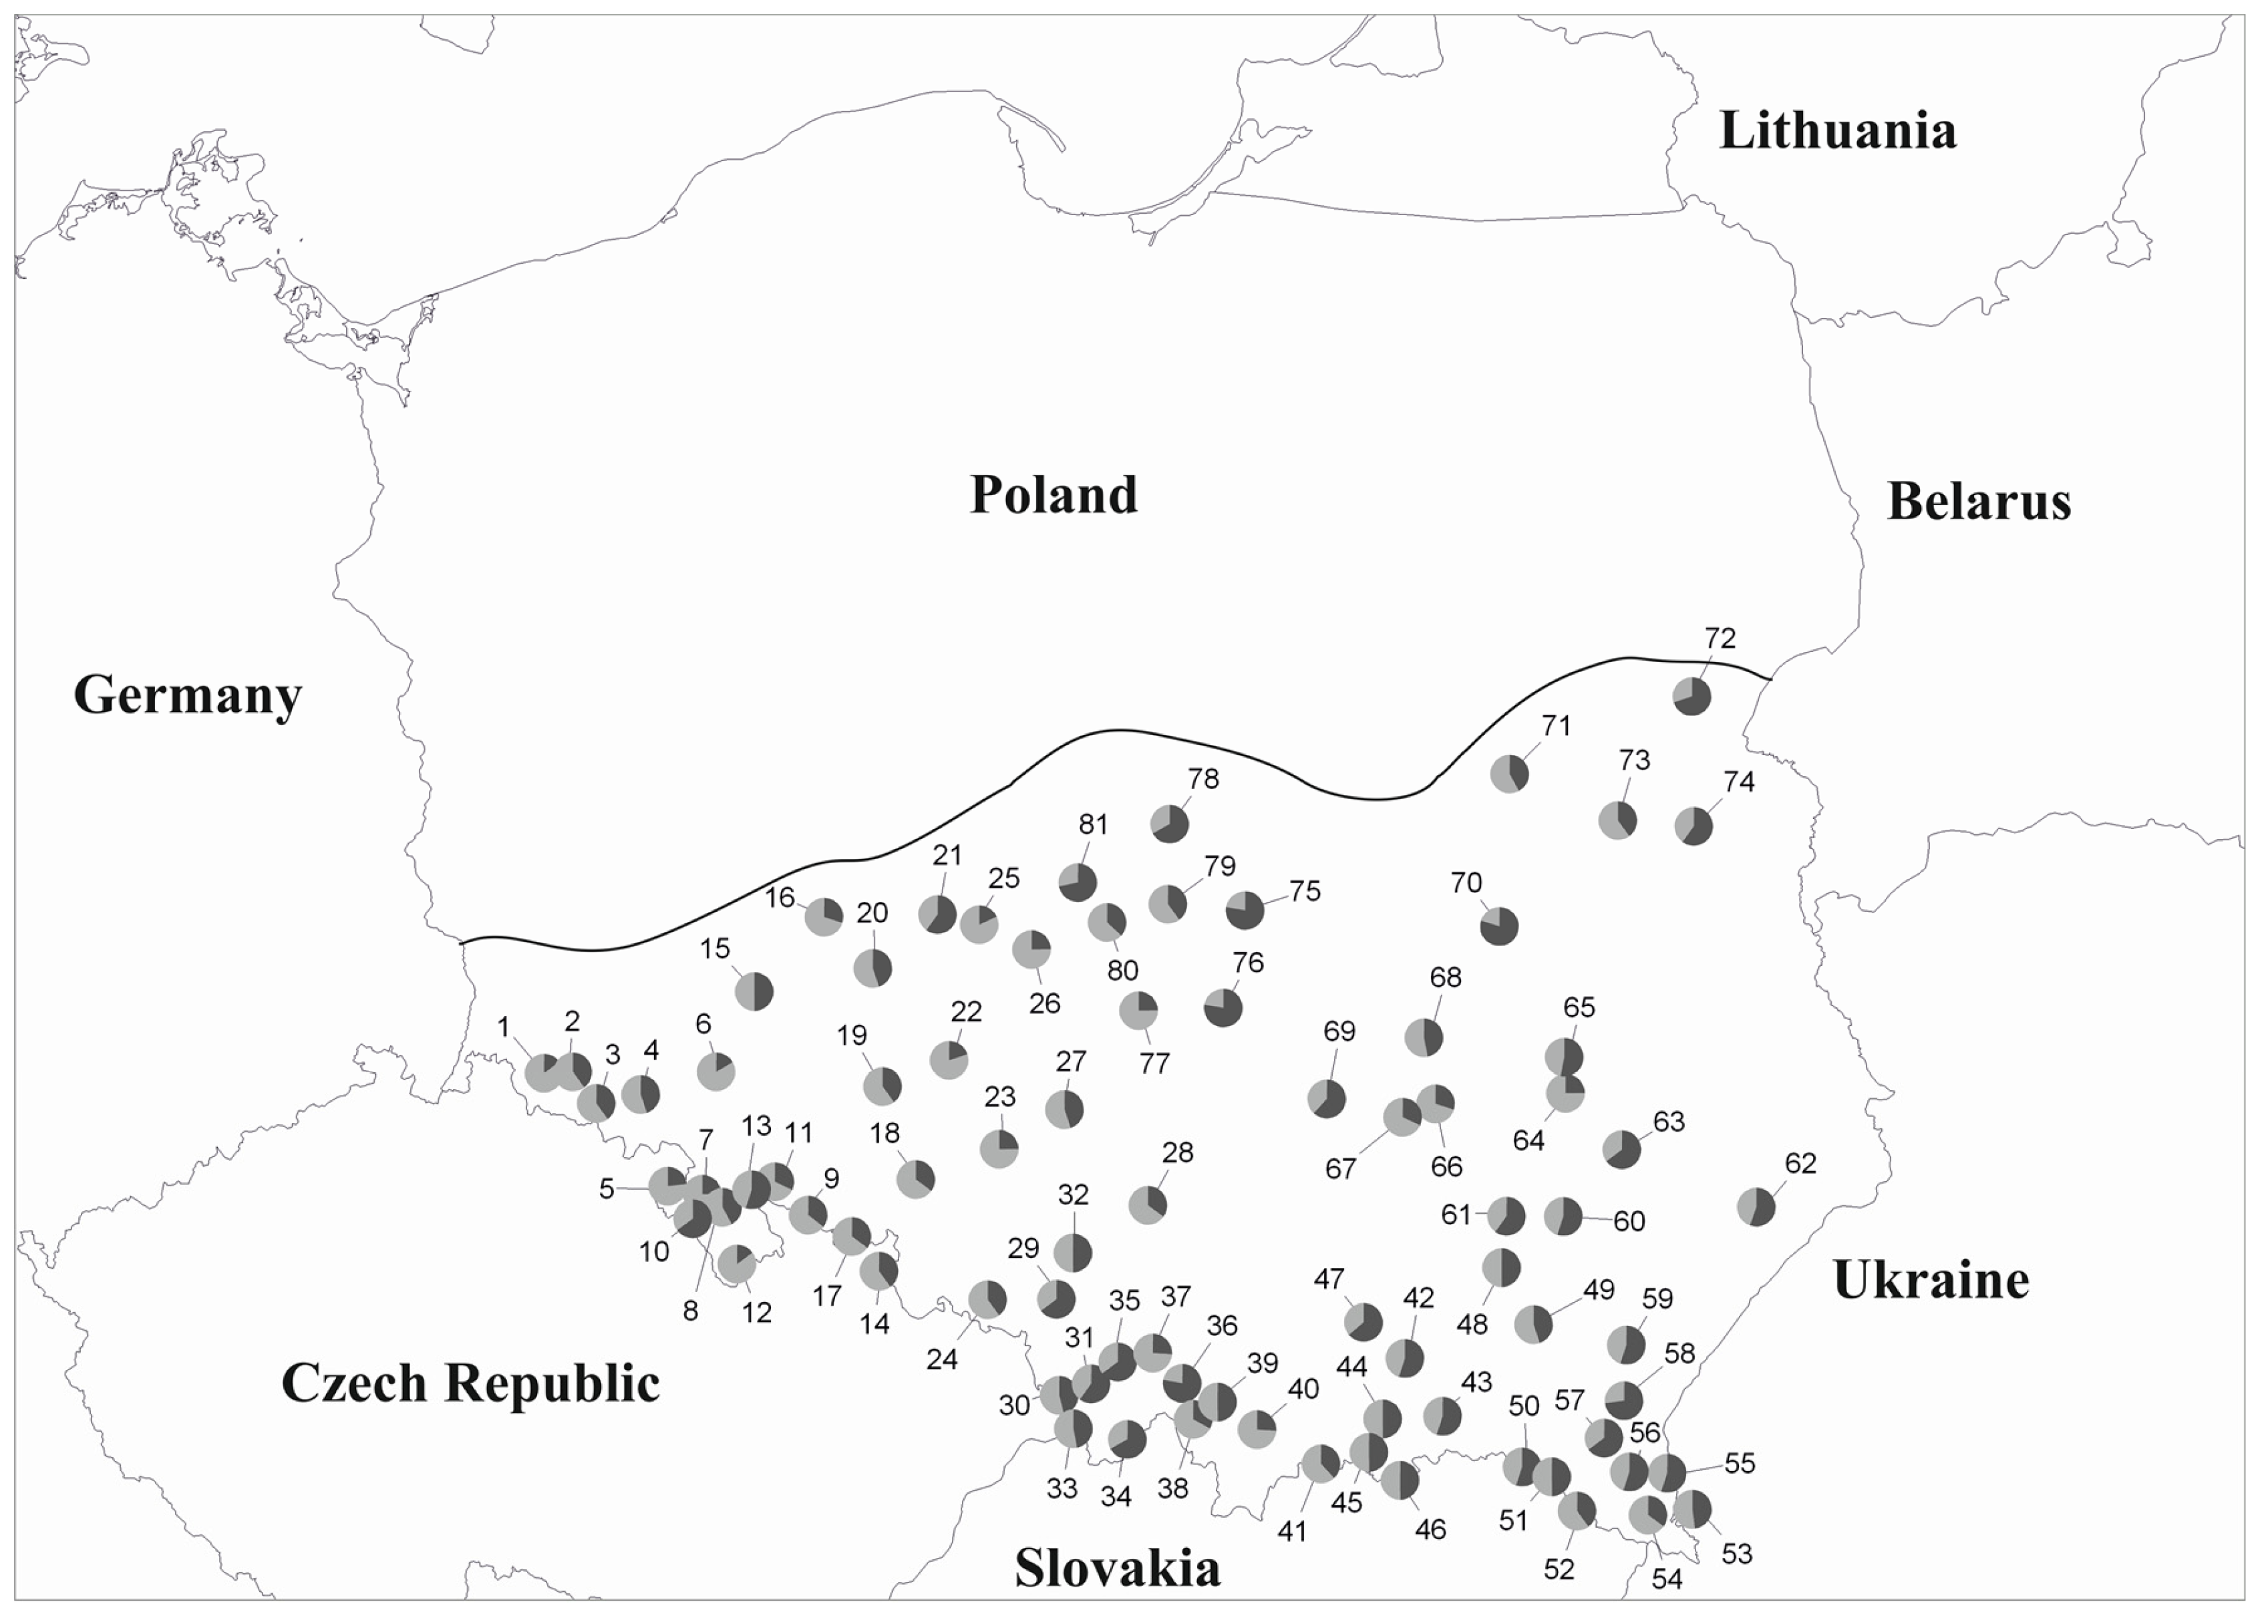
3.1. mtDNA
3.2. cpDNA
3.3. Genetic Structure
4. Discussion
5. Conclusions
Acknowledgments
Author Contributions
Conflicts of Interest
References
- Hewitt, G.M. Some genetic consequences of ice ages, and their role in divergence and speciation. Biol. J. Linn. Soc. 1996, 58, 247–276. [Google Scholar] [CrossRef]
- Hu, F.S.; Hampe, A.; Petit, R.J. Paleoecology meets genetics: Deciphering past vegetational dynamics. Front. Ecol. Environ. 2009, 7, 371–379. [Google Scholar] [CrossRef]
- Magri, D.; Vendramin, G.G.; Comps, B.; Dupanloup, I.; Geburek, T.; Gömöry, D.; Latałowa, M.; Litt, T.; Paule, L.; Roure, J.M.; et al. A new scenario for the quaternary history of European beech populations: Palaeobotanical evidence and genetic consequences. New Phytol. 2006, 171, 199–221. [Google Scholar] [CrossRef] [PubMed]
- Huntley, B.; Birks, H.J. An Atlas of Past and Present Pollen Maps Europe: 0–13000 Years Ago; Cambridge University Press: Cambridge, UK, 1983. [Google Scholar]
- Bennett, K.D.; Tzedakis, P.C.; Willis, K.J. Quaternary refugia of north European trees. J. Biogeogr. 1991, 18, 103–115. [Google Scholar] [CrossRef]
- Willis, K.J.; Niklas, K.J. The role of Quaternary environmental change in plant macroevolution: The expectation or the rule? Philos. Trans. R. Soc. B 2004, 359, 159–172. [Google Scholar] [CrossRef] [PubMed]
- Hewitt, G.M. Genetic consequences of climatic oscillations in the Quaternary. Philos. Trans. R. Soc. Lond. B Biol. Sci. 2004, 359, 183–195. [Google Scholar] [CrossRef] [PubMed]
- Avise, J.C. Phylogeography: Retrospect and prospect. J. Biogeogr. 2009, 36, 3–15. [Google Scholar] [CrossRef]
- Hewitt, G.M. The genetic legacy of the quaternary ice ages. Nature 2000, 405, 907–913. [Google Scholar] [CrossRef] [PubMed]
- Wagner, D.B. Nuclear, chloroplast, and mitochondrial DNA polymorphisms as biochemical markers in population genetic analyses of forest trees. New For. 1992, 6, 373–390. [Google Scholar] [CrossRef]
- Palmer, J.D. Mitochondrial DNA in plant systematics: Applications and limitations. In Molecular Systematics of Plants; Springer: New York, NY, USA, 1992; pp. 36–49. [Google Scholar]
- Hamrick, J.L.; Godt, M.J.W.; Sherman-Broyles, S.L. Factors influencing levels of genetic diversity in woody plant species. New For. 1992, 6, 95–124. [Google Scholar] [CrossRef]
- Jaramillo-Correa, J.P.; Beaulieu, J.; Bousquet, J. Contrasting evolutionary forces driving population structure at expressed sequence tag polymorphisms, allozymes and quantitative traits in white spruce. Mol. Ecol. 2001, 10, 2729–2740. [Google Scholar] [CrossRef] [PubMed]
- Petit, R.J.; Duminil, J.; Fineshi, S.; Hampe, A.; Salvini, D.; Vendramin, G.G. Comparative organization of chloroplast, mitochondrial and nuclear diversity in plant populations. Mol. Ecol. 2005, 14, 689–701. [Google Scholar] [CrossRef] [PubMed]
- Litkowiec, M.; Dering, M.; Lewandowski, A. Utility of two mitochondrial markers for identification of Picea abies refugial origin. Dendrobiolgy 2009, 61, 65–71. [Google Scholar]
- Terhürne-Berson, R.; Litt, T.; Cheddadi, R. The spread of Abies throughout Europe since the last glacial period: Combined macrofossil and pollen data. Veg. Hist. Archaeobot. 2004, 13, 257–268. [Google Scholar] [CrossRef]
- Liepelt, S.; Bialozyt, R.; Ziegenhagen, B. Wind-dispersed pollen mediates gene flow among refugia. Proc. Natl. Acad. Sci. USA 2002, 99, 14590–14594. [Google Scholar] [CrossRef] [PubMed]
- Litkowiec, M.; Lewandowski, A. Postglacial history of silver fir (Abies alba Mill.) in Poland as a result of migration from different refugia—The current state of knowledge. Sylwan 2015, 159, 109–116. [Google Scholar]
- Konnert, M.; Bergmann, F. The geographical distribution of genetic variation of silver fir (Abies alba, Pinaceae) in relation to its migration history. Plant Syst. Evol. 1995, 196, 19–30. [Google Scholar] [CrossRef]
- Zając, A.; Zając, M. Atlas of Distribution of Vascular Plants in Poland; W. Szafer Institute of Botany PAN: Kraków, Poland, 2001. [Google Scholar]
- Obidowicz, A.; Szczepanek, K.; Madeyska, E.; Nalepka, D. Abies alba Mill.—Fir. In Late Glacial and Holocene History of Vegetation in Poland Based on Isopollen Maps; Ralska-Jasiewiczowa, M., Latałowa, M., Wasylikowa, K., Tobolski, K., Madeyska, E., Wright, H.E., Jr., Turner, C., Eds.; W. Szafer Instiute of Botany PAN: Kraków, Poland, 2004; pp. 31–38. [Google Scholar]
- Lewandowski, A.; Filipiak, M.; Burczyk, J. Genetic Variation of Abies alba in polish part of Sudety Mts. Acta Soc. Bot. Pol. 2001, 70, 215–219. [Google Scholar] [CrossRef]
- Mejnartowicz, L. Genetic Analysis of Silver fir Populations in the North Carpathian and Sudeten Mountains. Acta Soc. Bot. Pol. 2004, 73, 285–292. [Google Scholar] [CrossRef]
- Pawlaczyk, E.M.; Kroplewska, I.; Bobowicz, M.A. Postglacial migration of silver fir (Abies alba Mill.) to Poland—Analysis on the basis of mitochondrial DNA polymorphism. Sylwan 2013, 157, 458–463. [Google Scholar]
- Larsen, J.B. Das Tannensterben: Eine neue hypothese zur Klärung des Hintergrundes dieser rätselhaften Komplexkrankheit der Weißtanne (Abies alba Mill.). Forstwiss. Cent. 1986, 105, 381–396. [Google Scholar] [CrossRef]
- Bergmann, F.; Gregorius, H.R.; Larsen, J.B. Levels of genetic variation in European silver fir (Abies alba). Are they related to the species’ decline? Genetica 1990, 82, 1–10. [Google Scholar] [CrossRef]
- Bosela, M.; Popa, I.; Gömöry, D.; Longauer, R.; Tobin, B.; Kyncl, J.; Kyncl, T.; Nechita, C.; Petras, R.; Sidor, C.G.; et al. Effects of post-glacial phylogeny and genetic diversity on growth variability and climate sensitivity of European silver fir. J. Ecol. 2016, 104, 716–724. [Google Scholar] [CrossRef]
- Dumolin, S.; Demesure, B.; Petit, R.J. Inheritance of chloroplast and mitochondrial genomes in pedunculate oak investigated with an efficient PCR method. Theor. Appl. Genet. 1995, 91, 1253–1256. [Google Scholar] [CrossRef] [PubMed]
- Demesure, B.; Sodzi, N.; Petit, R.J. A set of universal primers for amplification of polymorphic non-coding regions of mitochondrial and chloroplast DNA in plants. Mol. Ecol. 1995, 4, 129–131. [Google Scholar] [CrossRef] [PubMed]
- Wakasugi, T.; Tsudzuki, J.; Ito, S.; Nakashima, K.; Tsudzuki, T.; Sugiura, M. Loss of all ndh genes as determined by sequencing the entire chloroplast genome of black pine Pinus thunbergii. Proc. Natl. Acad. Sci. USA 1994, 91, 9794–9798. [Google Scholar] [CrossRef] [PubMed]
- Dupanloup, I.; Schneider, S.; Excoffier, L. A simulated annealing approach to define the genetic structure of populations. Mol. Ecol. 2002, 11, 2571–2581. [Google Scholar] [CrossRef] [PubMed]
- Peakall, R.; Smouse, P.E. GENALEX 6: Genetic analysis in Excel. Population genetic software for teaching and research. Mol. Ecol. Resour. 2006, 6, 288–295. [Google Scholar] [CrossRef]
- Excoffier, L.; Laval, G.; Schneider, S. Arlequin ver. 3.0: An integrated software package for population genetics data analysis. Evol. Bioinform. Online 2005, 1, 47–50. [Google Scholar]
- Mantel, N. The detection of disease clustering and a generalized regression approach. Cancer Res. 1967, 27, 209–220. [Google Scholar] [PubMed]
- Liepelt, S.; Cheddadi, R.; de Beaulieu, J.L.; Fady, B.; Gömöry, D.; Hussendörfer, E.; Konnert, M.; Litt, T.; Longauer, R.; Terhürne-Berson, R.; et al. Postglacial range expansion and its genetic imprints in Abies alba (Mill.) a synthesis from palaeobotanic and genetic data. Rev. Palaeobot. Palynol. 2009, 153, 139–149. [Google Scholar] [CrossRef]
- Srodoń, A. Nasze Drzewa Leśne. Jodła Pospolita Abies alba Mill.; Państwowe Wydawnictwo Naukowe: Poznań, Poland, 1983. [Google Scholar]
- Ralska-Jasiewiczowa, M. Late Glacial and Holocene History of Vegetation in Poland Based on Isopollen Maps; W. Szafer Institute of Botany, Polish Academy of Science: Kraków, Poland, 2004. [Google Scholar]
- Pidek, I.A.; Svitavská-Svobodová, H.; van der Knaap, W.O.; Magyari, E. Pollen percentage thresholds of Abies alba based on 13-year annual records of pollen deposition in modified Tauber traps: Perspective of applications to fossil situations. Rev. Palaeobot. Palynol. 2013, 195, 26–36. [Google Scholar] [CrossRef]
- Ziegenhagen, B.; Fady, B.; Kuhlenkamp, V.; Liepelt, S. Differentiating groups of Abies species with a simple molecular markers. Silvae Genet. 2005, 54, 123–126. [Google Scholar]
- Gömöry, D.; Longauer, R.; Liepelt, S.; Ballian, D.; Brus, R.; Kraigher, H.; Parpan, V.I.; Parpan, T.V.; Paule, L.; Stupar, V.; et al. Variation patterns of mitochondrial DNA Abies alba Mill. In suture zone of postglacial migration in Europe. Acta Soc. Bot. Pol. 2004, 73, 203–206. [Google Scholar] [CrossRef]
- Gömöry, D.; Paule, L.; Krajmerová, D.; Romšáková, I.; Longauer, R. Admixture of genetic lineages of different glacial origin: A case study of Abies alba Mill. in the Carpathians. Plant Syst. Evol. 2012, 298, 703–712. [Google Scholar] [CrossRef]
- Longauer, R. Genetic Diversity of European Silver Fir (Abies alba Mill.). Ph.D. Thesis, Technická Univerzita vo Zvolene, Zvolen, Slovakia, 1996. [Google Scholar]
- Vendriamin, G.G.; Degen, B.; Petit, R.J.; Anzidei, M.; Madaghiele, A.; Ziegenhagen, B. High level of variation at Abies alba chloroplast microsatellite loci in Europe. Mol. Ecol. 1999, 8, 1117–1126. [Google Scholar] [CrossRef]
- Rius, M.; Darling, J.A. How important is intraspecific genetic admixture to the success of colonising populations? Trends Ecol. Evol. 2014, 29, 233–242. [Google Scholar] [CrossRef] [PubMed]
- Heuertz, M.; Hausman, J.F.; Hardy, O.J.; Vendramin, G.G.; Frascaria-Lacoste, N.; Velkemans, X. Nuclear microsatellites reveal contrasting patterns of genetic structure between western and southeastern European populations of the common ash (Fraxinus excelsior L.). Evolution 2004, 58, 976–988. [Google Scholar] [CrossRef] [PubMed]
- Bell, M.A.; Travis, M.P. Hybridization, transgressive segregation, genetic covariation, and adaptive radiation. Trends Ecol. Evol. 2007, 20, 358–361. [Google Scholar] [CrossRef] [PubMed]
- Żukowska, W.B.; Wachowiak, W. Utility of closely related taxa for genetic studies of adaptive variation and speciation: Current state and perspectives in plants with focus on forest tree species. J. Syst. Evol. 2016, 54, 17–28. [Google Scholar] [CrossRef]
- Wachowiak, W.; Żukowska, W.B.; Wójkiewicz, B.; Cavers, S.; Litkowiec, M. Hybridization in contact zone between temperate European pine species. Tree Genet. Genomes 2016, 12, 48. [Google Scholar] [CrossRef]
- Gunia, S. Próba oceny wartości genetycznej i hodowlanej jodły pospolitej (Abies alba Mill.) z Sudetów i Karpat polskich. Sylwan 1986, 130, 83–92. [Google Scholar]
- Skrzyszewska, K. Zmienność wewnątrzgatunkowa jodły pospolitej w doświadczeniach proweniencyjnych. In Elementy Genetyki i Hodowli Selekcyjnej Drzew Leśnych; Sabor, J., Ed.; Centrum Informacyjne Lasów Państwowych: Warszawa, Poland, 2006. [Google Scholar]
- Barzdajn, W. Adaptacja różnych pochodzeń jodły pospolitej (Abies alba Mill.) do warunków Sudetów. Leśn. Pr. Badaw. 2009, 70, 49–58. [Google Scholar]


| CODE | NAME | Longitude° E/Latitude° N | N | mtDNA | cpDNA | ||
|---|---|---|---|---|---|---|---|
| POLAND | 180 bp (%) | 250 bp (%) | A (%) | B (%) | |||
| 1 | Świeradów | 15.46/50.96 | 19 | 100.0 | 40.0 | 60.0 | |
| 2 | Lwówek | 15.64/50.95 | 20 | 100.0 | 15.0 | 85.0 | |
| 3 | Śnieżka | 15.82/50.81 | 20 | 100.0 | 40.0 | 60.0 | |
| 4 | Jawor | 16.11/50.88 | 20 | 100.0 | 45.0 | 55.0 | |
| 5 | Szczeliniec | 16.34/50.48 | 31 | 100.0 | 23.0 | 77.0 | |
| 6 | Świdnica | 16.60/50.96 | 20 | 100.0 | 15.0 | 75.0. | |
| 7 | Wolary | 16,52/50,44 | 20 | 100.0 | 25.0 | 75.0 | |
| 8 | Bystrzyca | 16.61/50.42 | 20 | 100.0 | 42.0 | 58.0 | |
| 9 | Lądek | 17.13/50.38 | 20 | 100.0 | 39.0 | 71.0 | |
| 10 | Zdroje | 16.51/50.40 | 14 | 100.0 | 65.0 | 35.0 | |
| 11 | Wójtówka | 16.99/50.50 | 19 | 100.0 | 32.0 | 68.0 | |
| 12 | Międzylesie | 16.72/50.22 | 20 | 100.0 | 15.0 | 85.0 | |
| 13 | Bardo | 16.78/50.49 | 20 | 100.0 | 55.0 | 45.0 | |
| 14 | Prudnik | 17.64/50.15 | 20 | 100.0 | 40.0 | 60.0 | |
| 15 | Reserve Jodłowice | 16.81/51.29 | 20 | 100.0 | 50.0 | 50.0 | |
| 16 | Milicz | 17.24/51.58 | 20 | 100.0 | 30.0 | 70.0 | |
| 17 | Prudnik | 17.47/50.29 | 20 | 100.0 | 35.0 | 65.0 | |
| 18 | Pruszków | 17.87/50.54 | 20 | 100.0 | 35.0 | 65.0 | |
| 19 | Brzeg | 17.65/50.89 | 20 | 100.0 | 40.0 | 60.0 | |
| 20 | Syców | 17.61/51.36 | 20 | 100.0 | 45.0 | 55.0 | |
| 21 | Reserve Majówka | 18.02/51.59 | 20 | 100.0 | 60.0 | 40.0 | |
| 22 | Siemianice | 18.11/51.02 | 20 | 100.0 | 20.0 | 80.0 | |
| 23 | Zawadzkie | 18.43/50.68 | 20 | 100.0 | 25.0 | 75.0 | |
| 24 | Rybnik | 18.34/50.05 | 20 | 100.0 | 40.0 | 60.0 | |
| 25 | Reserve Olbina | 18.27/51.56 | 18 | 100.0 | 18.0 | 82.0 | |
| 26 | Reserve Nowa Wieś | 18.61/51.45 | 8 | 100.0 | 25.0 | 75.0 | |
| 27 | Herby | 18.82/50.82 | 20 | 100.0 | 45.0 | 55.0 | |
| 28 | Siewierz | 19.35/50.41 | 20 | 100.0 | 35.0 | 65.0 | |
| 29 | Pszczyna | 18.78/50.07 | 20 | 100.0 | 65.0 | 35.0 | |
| 30 | Czarne | 18.82/49.70 | 26 | 100.0 | 46.0 | 54.0 | |
| 31 | Wisła | 18.98/49.72 | 20 | 100.0 | 60.0 | 40.0 | |
| 32 | Dobka | 18.89/50.22 | 14 | 100.0 | 50.0 | 50.0 | |
| 33 | Bukowiec | 18.88/49.55 | 21 | 100.0 | 47.0 | 53.0 | |
| 34 | Ujsoły | 19.21/49.48 | 15 | 100.0 | 67.0 | 33.0 | |
| 35 | Bielsko | 19.14/49.82 | 20 | 100.0 | 65.0 | 35.0 | |
| 36 | Sucha Beskidzka | 19.57/49.71 | 9 | 100.0 | 78.0 | 22.0 | |
| 37 | Andrychów | 19.39/49.85 | 19 | 100.0 | 26.0 | 74.0 | |
| 38 | Babiogórski Park Narodowy | 19.68/49.60 | 21 | 100.0 | 33.0 | 67.0 | |
| 39 | Nowy Targ | 19.80/49.65 | 20 | 100.0 | 50.0 | 50.0 | |
| 40 | Stańcowa | 20.06/49.54 | 19 | 100.0 | 26.0 | 74.0 | |
| 41 | Pieniński Park Narodowy | 20.46/49.40 | 13 | 100.0 | 38.0 | 62.0 | |
| 42 | Gromnik | 21.04/49.84 | 36 | 100.0 | 55.0 | 45.0 | |
| 43 | Gorlice | 21.26/49.61 | 20 | 100.0 | 55.0 | 45.0 | |
| 44 | Nawojowa | 20.87/49.58 | 20 | 100.0 | 50.0 | 50.0 | |
| 45 | Piwniczna | 20.77/49.46 | 14 | 100.0 | 50.0 | 50.0 | |
| 46 | Majdan | 20.98/49.33 | 16 | 100.0 | 50.0 | 50.0 | |
| 47 | Dąbrowa Tarnowska | 20.73/49.98 | 11 | 100.0 | 64.0 | 36.0 | |
| 48 | Tuszyma | 21.63/50.17 | 16 | 100.0 | 50.0 | 50.0 | |
| 49 | Strzyżów | 21.86/49.96 | 20 | 100.0 | 45.0 | 55.0 | |
| 50 | Rymanów | 21.79/49.39 | 20 | 100.0 | 55.0 | 45.0 | |
| 51 | Moszczaniec | 21.97/49.36 | 20 | 100.0 | 50.0 | 50.0 | |
| 52 | Komańcza | 22.13/49.21 | 20 | 100.0 | 40.0 | 60.0 | |
| 53 | Bieszczadzki Park Narodowy | 22.88/49.23 | 21 | 100.0 | 48.0 | 52.0 | |
| 54 | Lutowiska | 22.57/49.21 | 20 | 100.0 | 35.0 | 65.0 | |
| 55 | Brzegi Dolne | 22.71/49.36 | 15 | 100.0 | 55.0 | 45.0 | |
| 56 | Baligród | 22.48/49.36 | 20 | 100.0 | 65.0 | 35.0 | |
| 57 | Lesko | 22.30/49.49 | 20 | 100.0 | 65.0 | 35.0 | |
| 58 | Reserve Krępak | 22.45/49.68 | 15 | 100.0 | 73.0 | 27.0 | |
| 59 | Kańczuga | 22.46/49.87 | 20 | 100.0 | 55.0 | 45.0 | |
| 60 | Rudnik | 22.04/50.38 | 20 | 100.0 | 55.0 | 45.0 | |
| 61 | Buda Stalowa | 21.67/50.39 | 20 | 100.0 | 60.0 | 40.0 | |
| 62 | Wólka Husińska | 23.30/50.40 | 18 | 100.0 | 61.0 | 49.0 | |
| 63 | Janów Lubelski | 22.42/50.64 | 17 | 100.0 | 65.0 | 35.0 | |
| 64 | Gościeradów | 22.05/50.86 | 20 | 100.0 | 25.0 | 75.0 | |
| 65 | Reserve Natalin | 22.06/51.00 | 14 | 100.0 | 53.0 | 47.0 | |
| 66 | Łagów | 21.20/50.84 | 20 | 100.0 | 30.0 | 70.0 | |
| 67 | Łagów | 21.00/50.76 | 19 | 100.0 | 32.0 | 68.0 | |
| 68 | Marcule | 21.17/51.08 | 17 | 100.0 | 47.0 | 53.0 | |
| 69 | Kielce | 20.51/50.85 | 13 | 100.0 | 62.0 | 38.0 | |
| 70 | Zwoleń | 21.62/51.53 | 20 | 100.0 | 80.0 | 20.0 | |
| 71 | Reserve Jedlina | 21.69/52.14 | 24 | 100.0 | 42.0 | 58.0 | |
| 72 | Radzyń Podlaski | 22.85/52.45 | 10 | 100.0 | 70.0 | 30.0 | |
| 73 | Reserve Jata | 22.38/51.95 | 25 | 100.0 | 40.0 | 60.0 | |
| 74 | Reserve Jata | 22.87/51.92 | 22 | 100.0 | 60.0 | 40.0 | |
| 75 | Kruszewiec | 19.99/51.59 | 14 | 100.0 | 78.0 | 22.0 | |
| 76 | Reserve Jata | 19.85/51.21 | 18 | 100.0 | 78.0 | 22.0 | |
| 77 | Reserve Łuszczanowiec | 19.31/51.19 | 12 | 100.0 | 25.0 | 75.0 | |
| 78 | Reserve Zabrzeżna | 19.50/51.93 | 18 | 100.0 | 67.0 | 33.0 | |
| 79 | Reserve Molenda | 19.49/51.61 | 20 | 100.0 | 40.0 | 60.0 | |
| 80 | Reserve Jodły Łaskie | 19.11/51.54 | 16 | 100.0 | 37.0 | 63.0 | |
| 81 | Reserve Jamno | 18.90/51.70 | 19 | 100.0 | 72.0 | 28.0 | |
| OTHER | |||||||
| 82 | Ukraine1 | 24.56/48.43 | 8 | 100.0 | 75.0 | 25.0 | |
| 83 | Ukraine2 | 25.81/47.66 | 11 | 100.0 | 55.0 | 45.0 | |
| 84 | Romania | 25.82/47.64 | 13 | 100.0 | 46.0 | 54.0 | |
| Average | 2.4 | 97.6 | 53.0 | 47.0 | |||
© 2016 by the authors; licensee MDPI, Basel, Switzerland. This article is an open access article distributed under the terms and conditions of the Creative Commons Attribution (CC-BY) license (http://creativecommons.org/licenses/by/4.0/).
Share and Cite
Litkowiec, M.; Lewandowski, A.; Rączka, G. Spatial Pattern of the Mitochondrial and Chloroplast Genetic Variation in Poland as a Result of the Migration of Abies alba Mill. from Different Glacial Refugia. Forests 2016, 7, 284. https://doi.org/10.3390/f7110284
Litkowiec M, Lewandowski A, Rączka G. Spatial Pattern of the Mitochondrial and Chloroplast Genetic Variation in Poland as a Result of the Migration of Abies alba Mill. from Different Glacial Refugia. Forests. 2016; 7(11):284. https://doi.org/10.3390/f7110284
Chicago/Turabian StyleLitkowiec, Monika, Andrzej Lewandowski, and Grzegorz Rączka. 2016. "Spatial Pattern of the Mitochondrial and Chloroplast Genetic Variation in Poland as a Result of the Migration of Abies alba Mill. from Different Glacial Refugia" Forests 7, no. 11: 284. https://doi.org/10.3390/f7110284