Article

Heterotrophic Soil Respiration Affected by Compound Fertilizer Types in Red Pine (Pinus densiflora S. et Z.) Stands of Korea

1
Centre for Environmental Risk Assessment and Remediation, CRC-CARE, University of South Australia, Adelaide 5095, SA, Australia
2
Forest Practice Research Center, National Institute of Forest Science, Pocheon 11186, Korea
3
Global Centre for Environmental Remediation, University of Newcastle, Callaghan 2308, NSW, Australia
4
Department of Forest Resources, Gyeongnam National University of Science and Technology, Jinju 52725, Korea
*
Author to whom correspondence should be addressed.
Forests 2016, 7(12), 309; https://doi.org/10.3390/f7120309
Submission received: 1 October 2016 / Revised: 30 November 2016 / Accepted: 2 December 2016 / Published: 7 December 2016
(This article belongs to the Special Issue Forest Soil Respiration under Climate Changing)

Abstract

:
This study was conducted to evaluate the effects of fertilizer application on heterotrophic soil respiration (Rh) in soil respiration (Rs) components in red pine stands. Two types of fertilizer (N3P4K1 = 113:150:37 kg·ha−1·year−1; P4K1 = 150:37 kg·ha−1·year−1) were applied manually on the forest floor for two years. Rs and Rh rates were monitored from April 2011 to March 2013. Mean Rs and Rh rates were not significantly affected by fertilizer applications. However, Rh in the second year following fertilizer application fell to 27% for N3P4K1 and 17% in P4K1 treatments, while there was an increase of 5% in the control treatments compared with the first fertilization year. The exponential relationships between Rs or Rh rates and the corresponding soil temperature were significant (Rh: R2 = 0.86–0.90; p < 0.05; Rs: R2 = 0.86–0.91; p < 0.05) in the fertilizer and control treatments. Q10 values (Rs increase per 10 °C increase in temperature) in Rs rates were lowest for the N3P4K1 treatment (3.47), followed by 3.62 for the P4K1 treatment and 3.60 in the control treatments, while Rh rates were similar among the treatments (3.59–3.64). The results demonstrate the importance of separating Rh rates from Rs rates following a compound fertilizer application.

1. Introduction

The quantitative evaluation of soil respiration (Rs) rates following a fertilizer application is a key process for understanding soil carbon (C) dynamics in forest ecosystem management [1,2,3]. However, contrasting effects of fertilizer application on Rs rates have been reported. Rs rates increased when nitrogen (N) was added to forest soils in Scot pine (Pinus sylvestris L.) in Sweden [4], while Rs rates were significantly lower for fertilized than for unfertilized plots due to reduced fine root production [5,6] and microbial respiration rates [7] in red pine plantations and boreal forest. Since Rs rates result from two main sources, autotrophic respiration (Ra: root respiration rates) and heterotrophic soil respiration (Rh: the microbial decomposition of soil organic matter), these conflicting reports could be due to fertilizer-induced differences in C fixation and allocation patterns among tree species, soil-specific differences in the microbial decomposition of soil organic matter [8,9,10], and mycorrhizal colonization of host tree species [4,7]. For example, N fertilization had a significant negative effect on Rs rates in a young Cunninghamia lanceolata forest [3], but no effect was observed in a coniferous plantation [2,8,11]. Rs and Rh responded differently to environmental resource variables such as nutrient availability.
Fertilizer applications result in a decrease or increase in Rh rates. For example, Rh rates were reduced after N applications in pine forests [12], while Ra rates would be expected to increase along with an increase in forest production following fertilizer application in N-limited forest stands [3,10,12]. However, reductions in Rh following N fertilizer application could be offset by increases in fine root production [8]. In contrast to this result, N fertilization increased Rh rates and microbial biomass C and microbial activity in a loblolly pine (Pinus taeda L.) plantation [11].
Fertilizer application effects on Rs or Rh rates in forest stands have mainly focused on the role of N addition [4,8,10]. However, there are a myriad of nutritional problems, such as multi-nutrient deficiency, in the forest stands [3,13,14]. The responses of Rs or Rh rates could be associated with the difference in nutrient availability induced by compound fertilizer types, which can influence favorable environmental conditions for microbial growth activity, soil organic matter decomposition, and root growth activity [2,11]. Although the influence of nutrient availability on Rs and Rh rates may depend on the variety of mechanisms, including changes in microbial biomass, microbial diversity, and root biomass, experimental data about compound types of fertilizer are limited in forest stands.
Red pine (Pinus densiflora S. et Z.) forests are the most important type of coniferous tree species and occupy more than 23.5% (1.5 million ha) of the Korean forest. Forest management practices, such as nutrient additions, are required to supply sufficient nutrients to optimize the growth of tree species because many studies have demonstrated the values of compound fertilizer applied to forest ecosystems for improving soil quality and tree growth in Korean forests [2,14]. Furthermore, despite the progress made in quantifying the C balance of many coniferous forests in Korea [15,16,17], there is a paucity of information about the underlying relationships of Rs and Rh rates, which may change in response to compound fertilizer types. More information that proves useful in evaluating the effects of compound types of fertilizer on Rs or Rh rates is needed. The overall objectives of this study were to 1) evaluate the effects of compound fertilizer application on Rs and Rh rates and 2) to determine the relationship between Rs and Rh rates and soil temperature using compound fertilizer types in red pine stands.

2. Materials and Methods

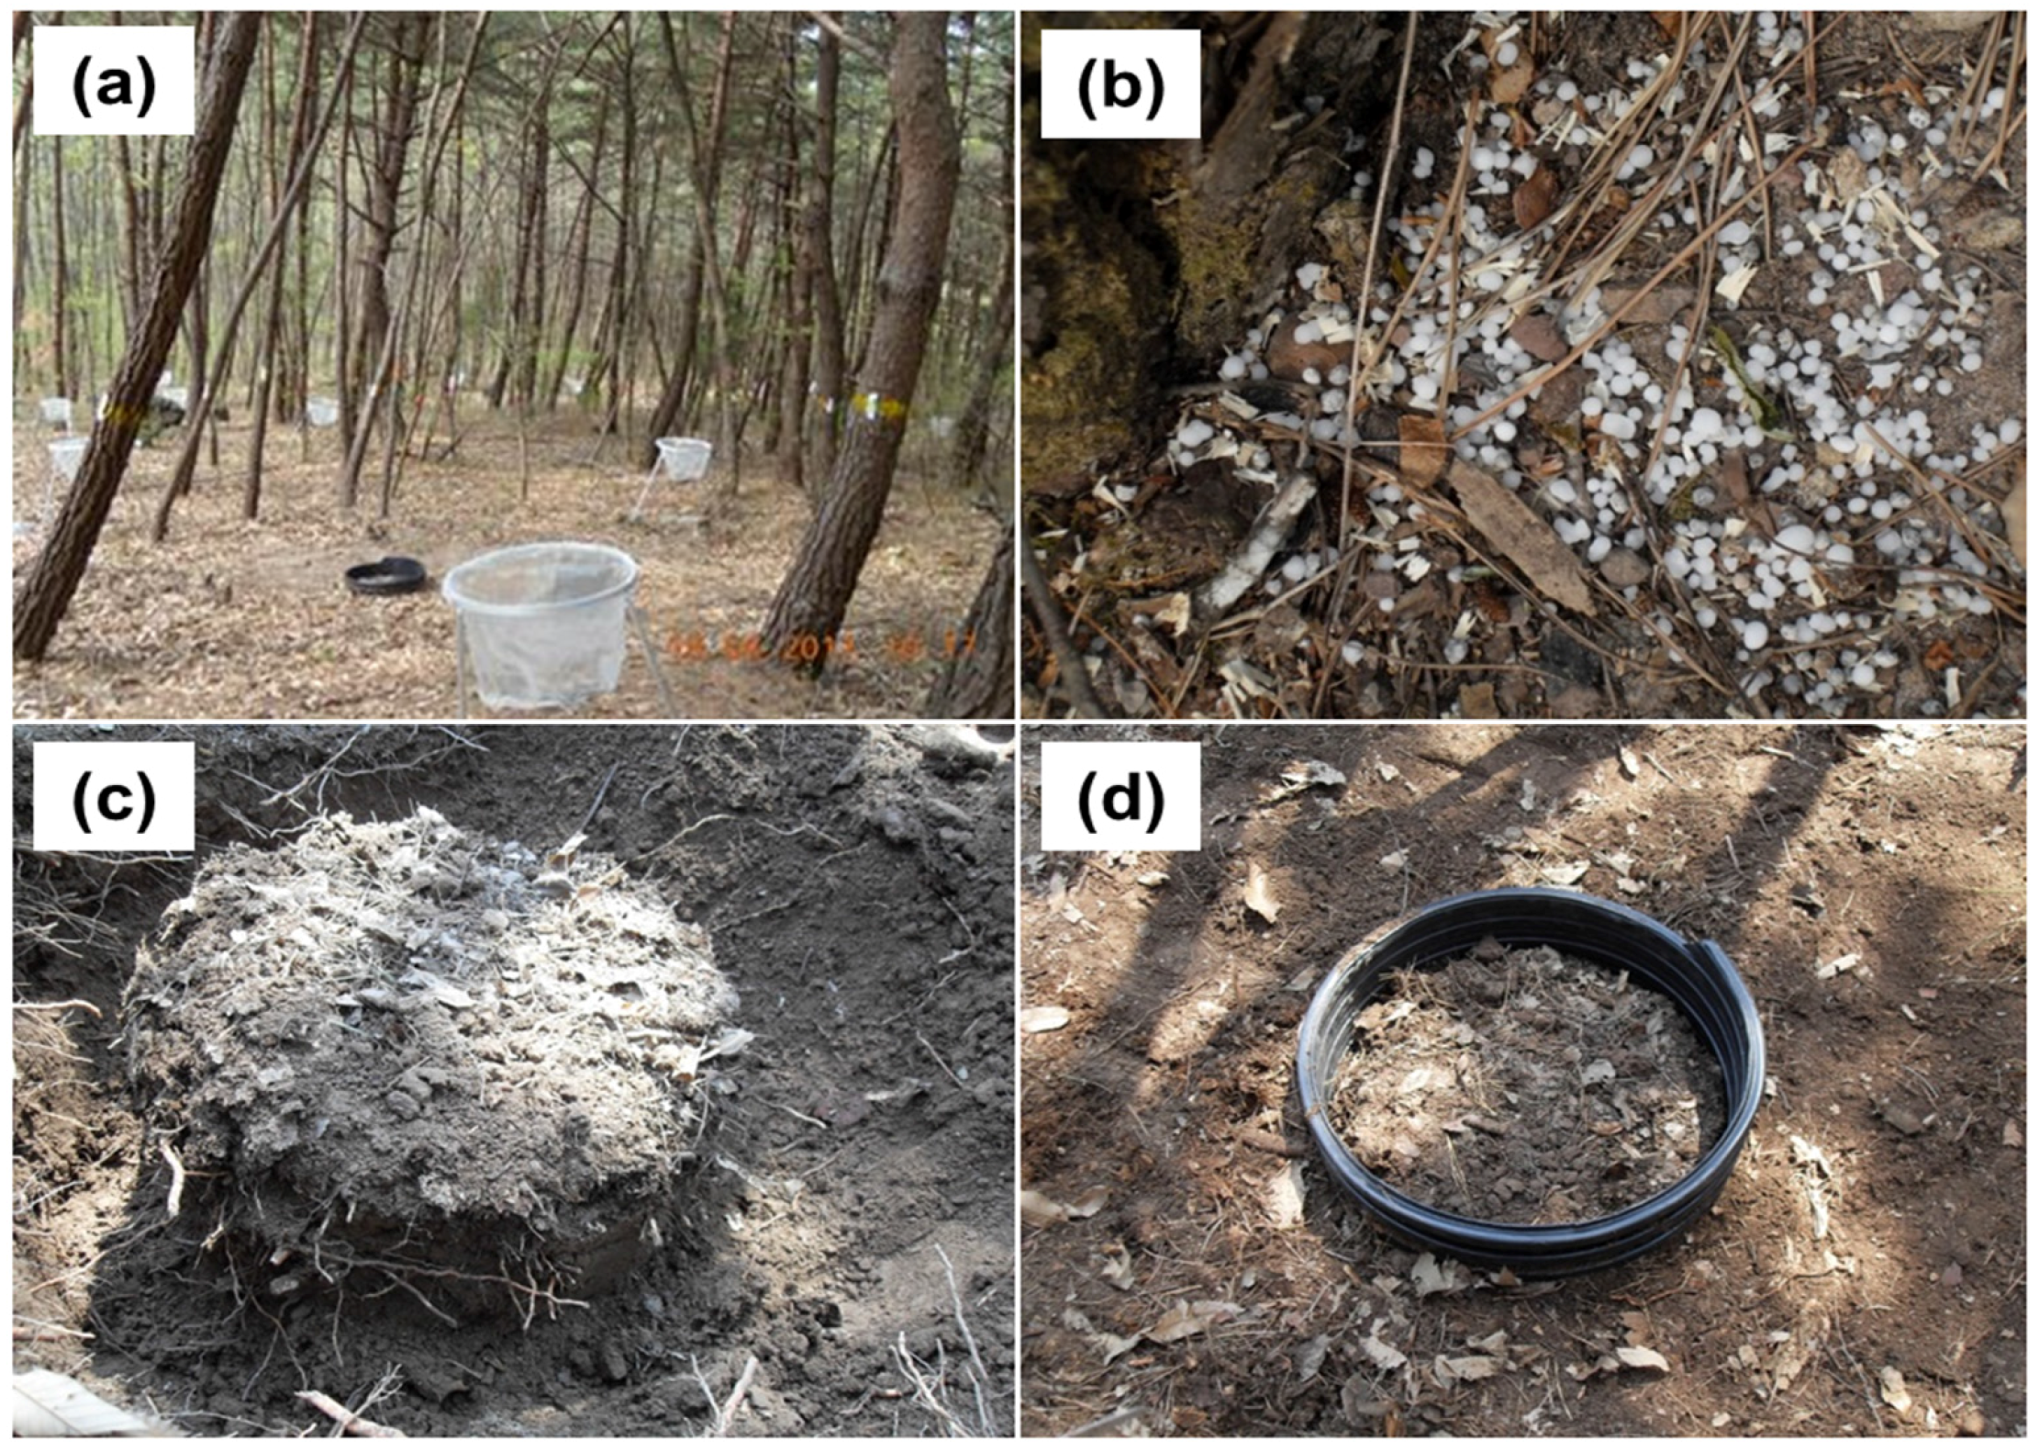
2.1. Experimental Design

This study was conducted in approximately 40-year-old natural red pine stands in the Wola National Experimental Forest, which is administered by the Southern Forest Resource Research Center, the National Institute of Forest Science, in Korea. The annual average precipitation and temperature in this area are 1490 mm·year−1 and 13.1 °C, respectively. The soil is a slightly dry, dark-brown forest soil (mostly Inceptisols, United States Soil Classification System) originating from sandstone or shale with a silt loam texture. The site index based on the height of dominant pine trees indicates low forest productivity (site index, 8–10 at 20-year-old base age), thus suggesting poor soil fertility (Figure 1). The experimental design consisted of a complete randomized block design with two blocks (35°12′32″ N, 128°10′23″ E; 180 m; 35°12′26″ N, 128°10′25″ E, 195 m) in the red pine stands, which were based on the homogeneity between the sites. The experiment involved 18 plots (3 treatments (N3P4K1, P4K1, Control) × 3 replications × 2 blocks, plot size (a 10 m × 10 m square)). The treatment plots were established on the same facing slopes and aspects under similar environmental conditions to minimize spatial variation in site environmental properties.
Fertilizer applications were based on the guidelines (N3P4K1 = 113:150:37 kg·ha−1·year−1) of fertilization in Korean forests [18] and without N fertilizer (P4K1 = 150:37 kg·ha−1·year−1). The compound types of fertilizer (N3P4K1) are generally recommended for the improvement of growth in mature forests in the country. In addition, the compound types of fertilizer (P4K1) were selected based upon considering a myriad of nutritional problems such as phosphorus (P) deficiency in forest stands [13,14]. Urea, fused superphosphate, and potassium chloride fertilizers (Figure 1) were employed as sources of N, P, and K, respectively, and they were applied manually on the forest floor for two years, between 21 April 2011 and 9 April 2012 (total fertilizer amount: N3P4K1 = 226:300:74 kg·ha−1; P4K1 = 300:74 kg·ha−1), respectively. The understory tree species in the study sites were lespedeza (Lespedeza spp.), cork oak (Quercus variabilis Bl.), konara oak (Q. serrate Thunb.), wild smilax (Smilax china L.), and grey blue spicebush (Lindera glauca (Siebold & Zucc.) Blume), etc.

2.2. Stand and Soil Characteristics

All trees with >6 cm diameter at breast height (DBH) in each plot were measured to determine stand density, basal area, and DBH among the treatments. Soil samples for the physical and chemical analysis before fertilizer treatment were collected through the top 20 cm at five randomly selected points in each treatment plot using an Oakfield soil sampler. These samples were air dried, passed through a 2 mm sieve, and used for particle size and soil chemical analyses. The distribution of particle size was determined by the hydrometer method. Soil pH (1:5 soil:water suspension) was measured with a glass electrode (Model-735, ISTEC, Seoul, Korea). The C and N content in the soil were determined using an elemental analyzer (Thermo Scientific, Flash 2000, Milan, Italy). Soil phosphorus (P) concentration extracted by NH4F and HCl solutions was determined by a UV spectrophotometer (Jenway 6505, Staffordshire, UK). Exchangeable potassium (K+), calcium (Ca2+), and magnesium (Mg2+) concentrations were determined through ICP-OES (Perkin Elmer Optima 5300DV, Shelton, CT, USA). To measure the change of inorganic soil N concentrations following fertilizer applications, a 5-gram subsample of fresh mineral soil was extracted with 50 mL of 2 M KCl solution immediately after sampling. The soil extract solutions were stored at 4 °C in a cooler. Ammonium (NH4+) and nitrate (NO3) concentrations in the soil extract samples were determined using an Ion Chromatography (AQ2 Discrete Analyzer, Southampton, UK).

2.3. Soil Respiration Rates

A root exclusion collar used for trenching was used to separate Rh rates [16,19,20] from Rs rates (Figure 1). Trenching in the central part of each plot was completed by excavating the outside edges of a columnar soil that was 50 cm diameter and 30 cm deep about one month (24 March 2011) before fertilizer was applied. The soil depth to 30 cm involved the bottom of the B horizon and top of the C horizon in a shallow soil at the study site. In addition, the trenching depth was found to cut down most live roots. Polyvinyl chloride (PVC) collars (50 cm inner diameter and 30 cm height with 4 mm thickness) were inserted into the columnar soil (N3P4K1: six plots; P4K1: six plots; control: six plots) and backfilled with the excavated soil. Seedlings and herbaceous vegetation inside the collars were manually removed, while litter fall was retained within the collars during the study period.
In this study, Rs rates were regarded as soil CO2 efflux emitted from the outside of the trenched location, while Rh, in the absence of root respiration, was regarded as soil CO2 efflux emitted inside of the PVC collars in each plot [16,20]. Four measurements with two repetitions (two inside the PVC collars and two outside the trenched locations) of each plot were taken monthly between 10:00 and 12:30 h during the study period (April 2011–March 2013) with an infrared gas analyzer system (Model EGM-4 environmental gas monitor systems, PP systems, Hitchin, UK). It was equipped with a flow-through closed soil respiration chamber (Model SRC-2, same manufacturer). Although the two-year study period may not be long enough to detect fertilization effects on Rs and Rh, other studies found the Rs and Rh changes in response to fertilization treatments over the duration of two years of study in forest stands [6,8,11]. Soil temperature was measured at 8 cm depth adjacent to the soil respiration chamber using a digital soil temperature probe (K-type, Summit SDT 200, Seoul, Korea).

2.4. Data Analysis

Data after testing for normality and homogeneity of variances were examined via two-way analysis of variance (ANOVA) to determine the significance of the main effects (year (Y), compound types of fertilizer (F)) and their interactions (Y × F). The model describing the data analysis is as follows (Equation (1)):
Yij = u + Yi + Fj +(Y × F)ij + eij
where u is the overall mean effect, Y is year (i = 1, 2), and F is fertilizer treatment (j = 1, 2, 3). All ANOVA were executed using the General Linear Models procedure in SAS [21]. Treatment means were compared using Tukey’s test. Rs and Rh data collected for the two-year period served to test exponential functions [22] between soil CO2 efflux rates and soil temperature (Equation (2)):
Soil CO2 efflux rates = B0eB1ST
where B0 and B1 are coefficients estimated through regression analysis and ST is the soil temperature. The Q10 values (Equation (3)) were calculated using the B1 coefficient which is used in the multiplier for soil CO2 efflux rates given an increase of 10 °C in soil temperature:
Q10 = e10 × B1

3. Results

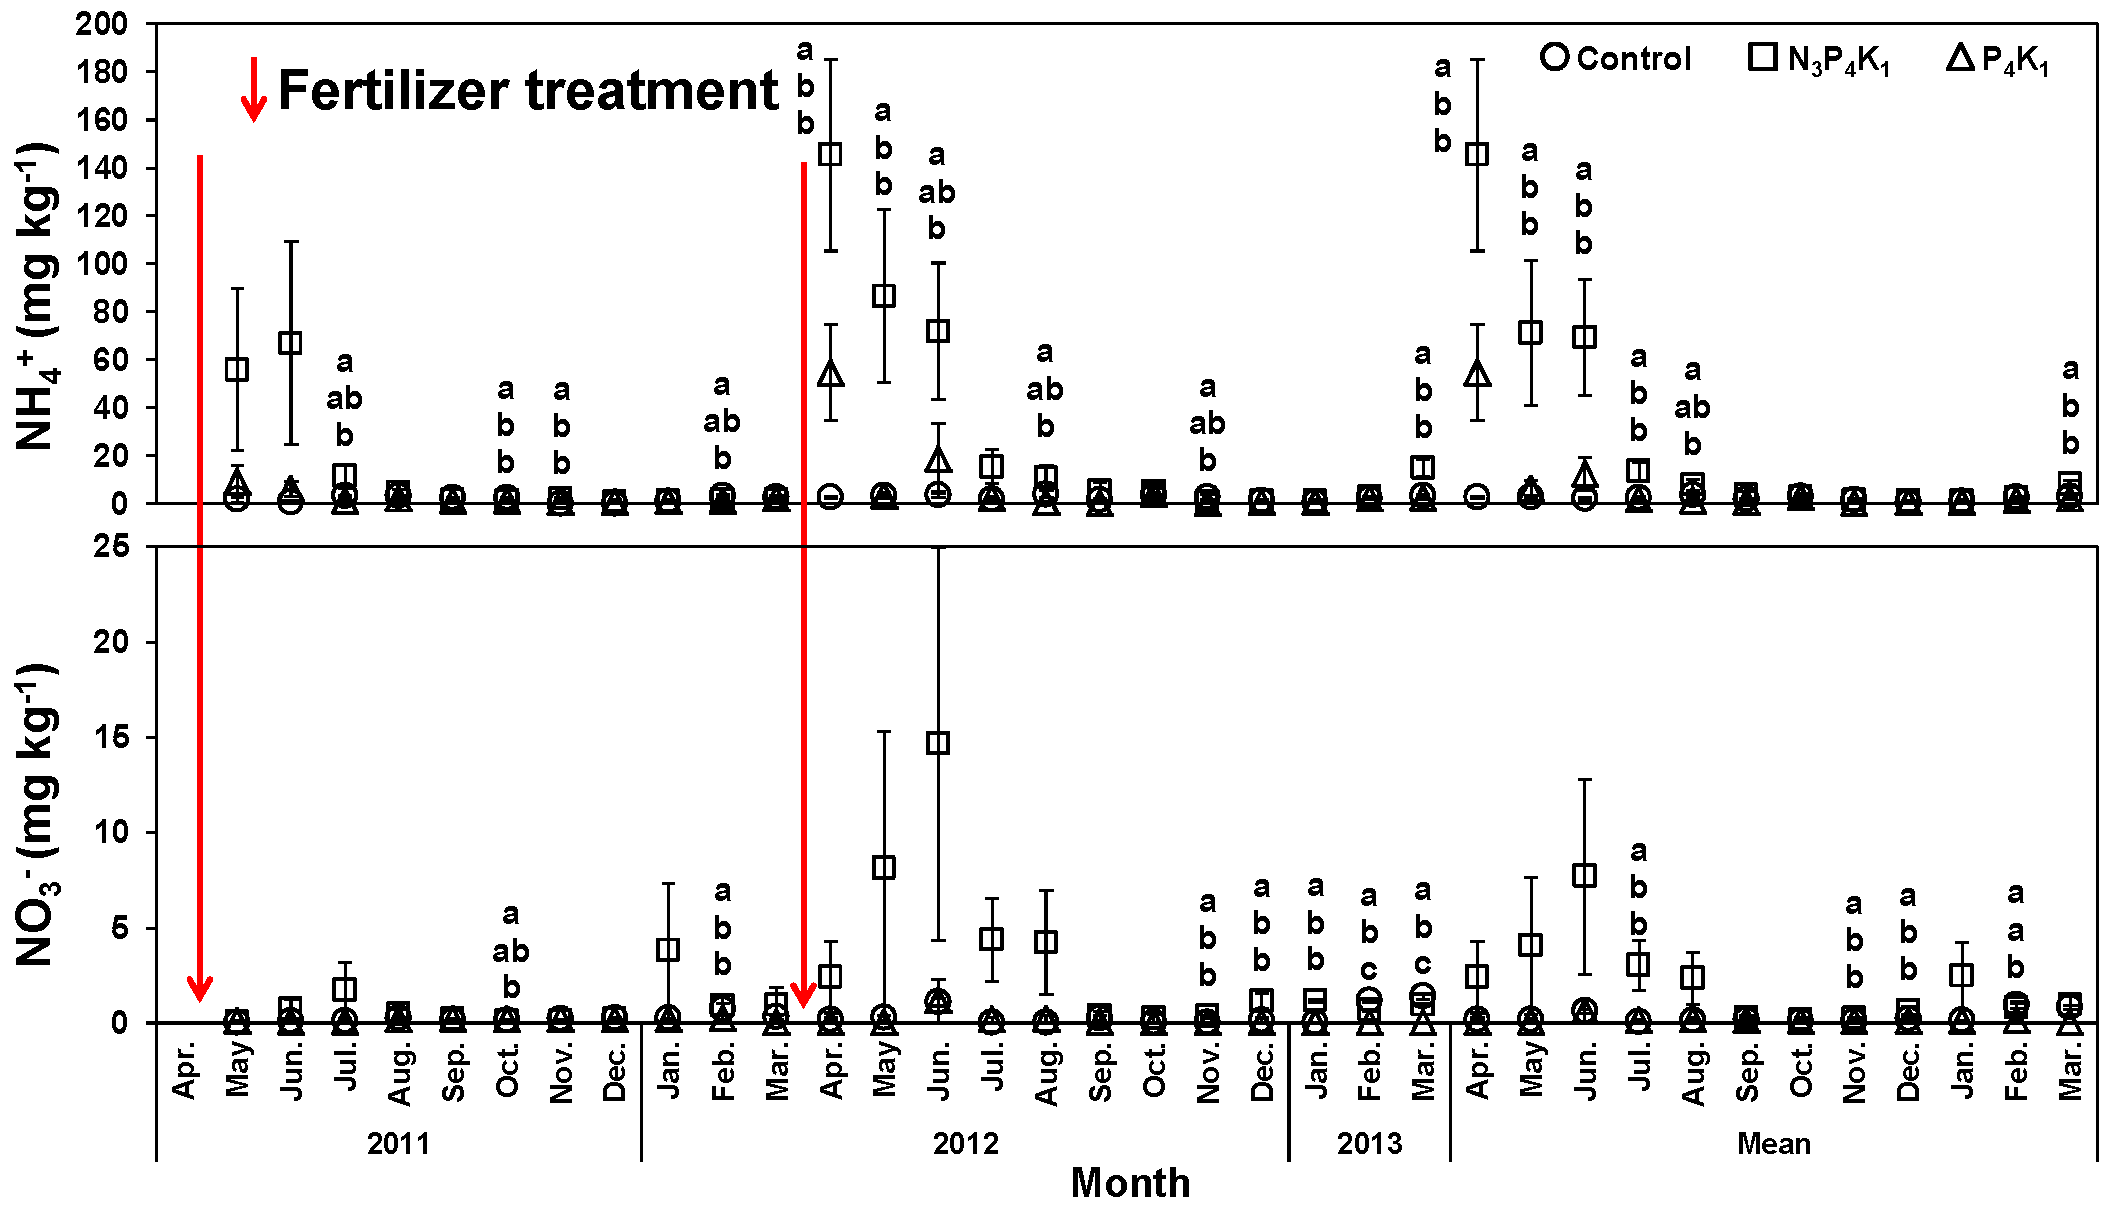
3.1. Stand and Soil Characteristics

Mean stand densities, DBH, and basal area were not significantly different between the control and fertilizer treatments (Table 1). The distribution of soil particles, such as sand, silt, and clay, was not significantly different among the treatments. While soil nutrient concentrations, such as C, N, P, and K+ were not significantly different between the fertilizer and control treatments, exchangeable Ca2+ and Mg2+ were significantly higher in the P4K1 than in the control treatments (Table 1).

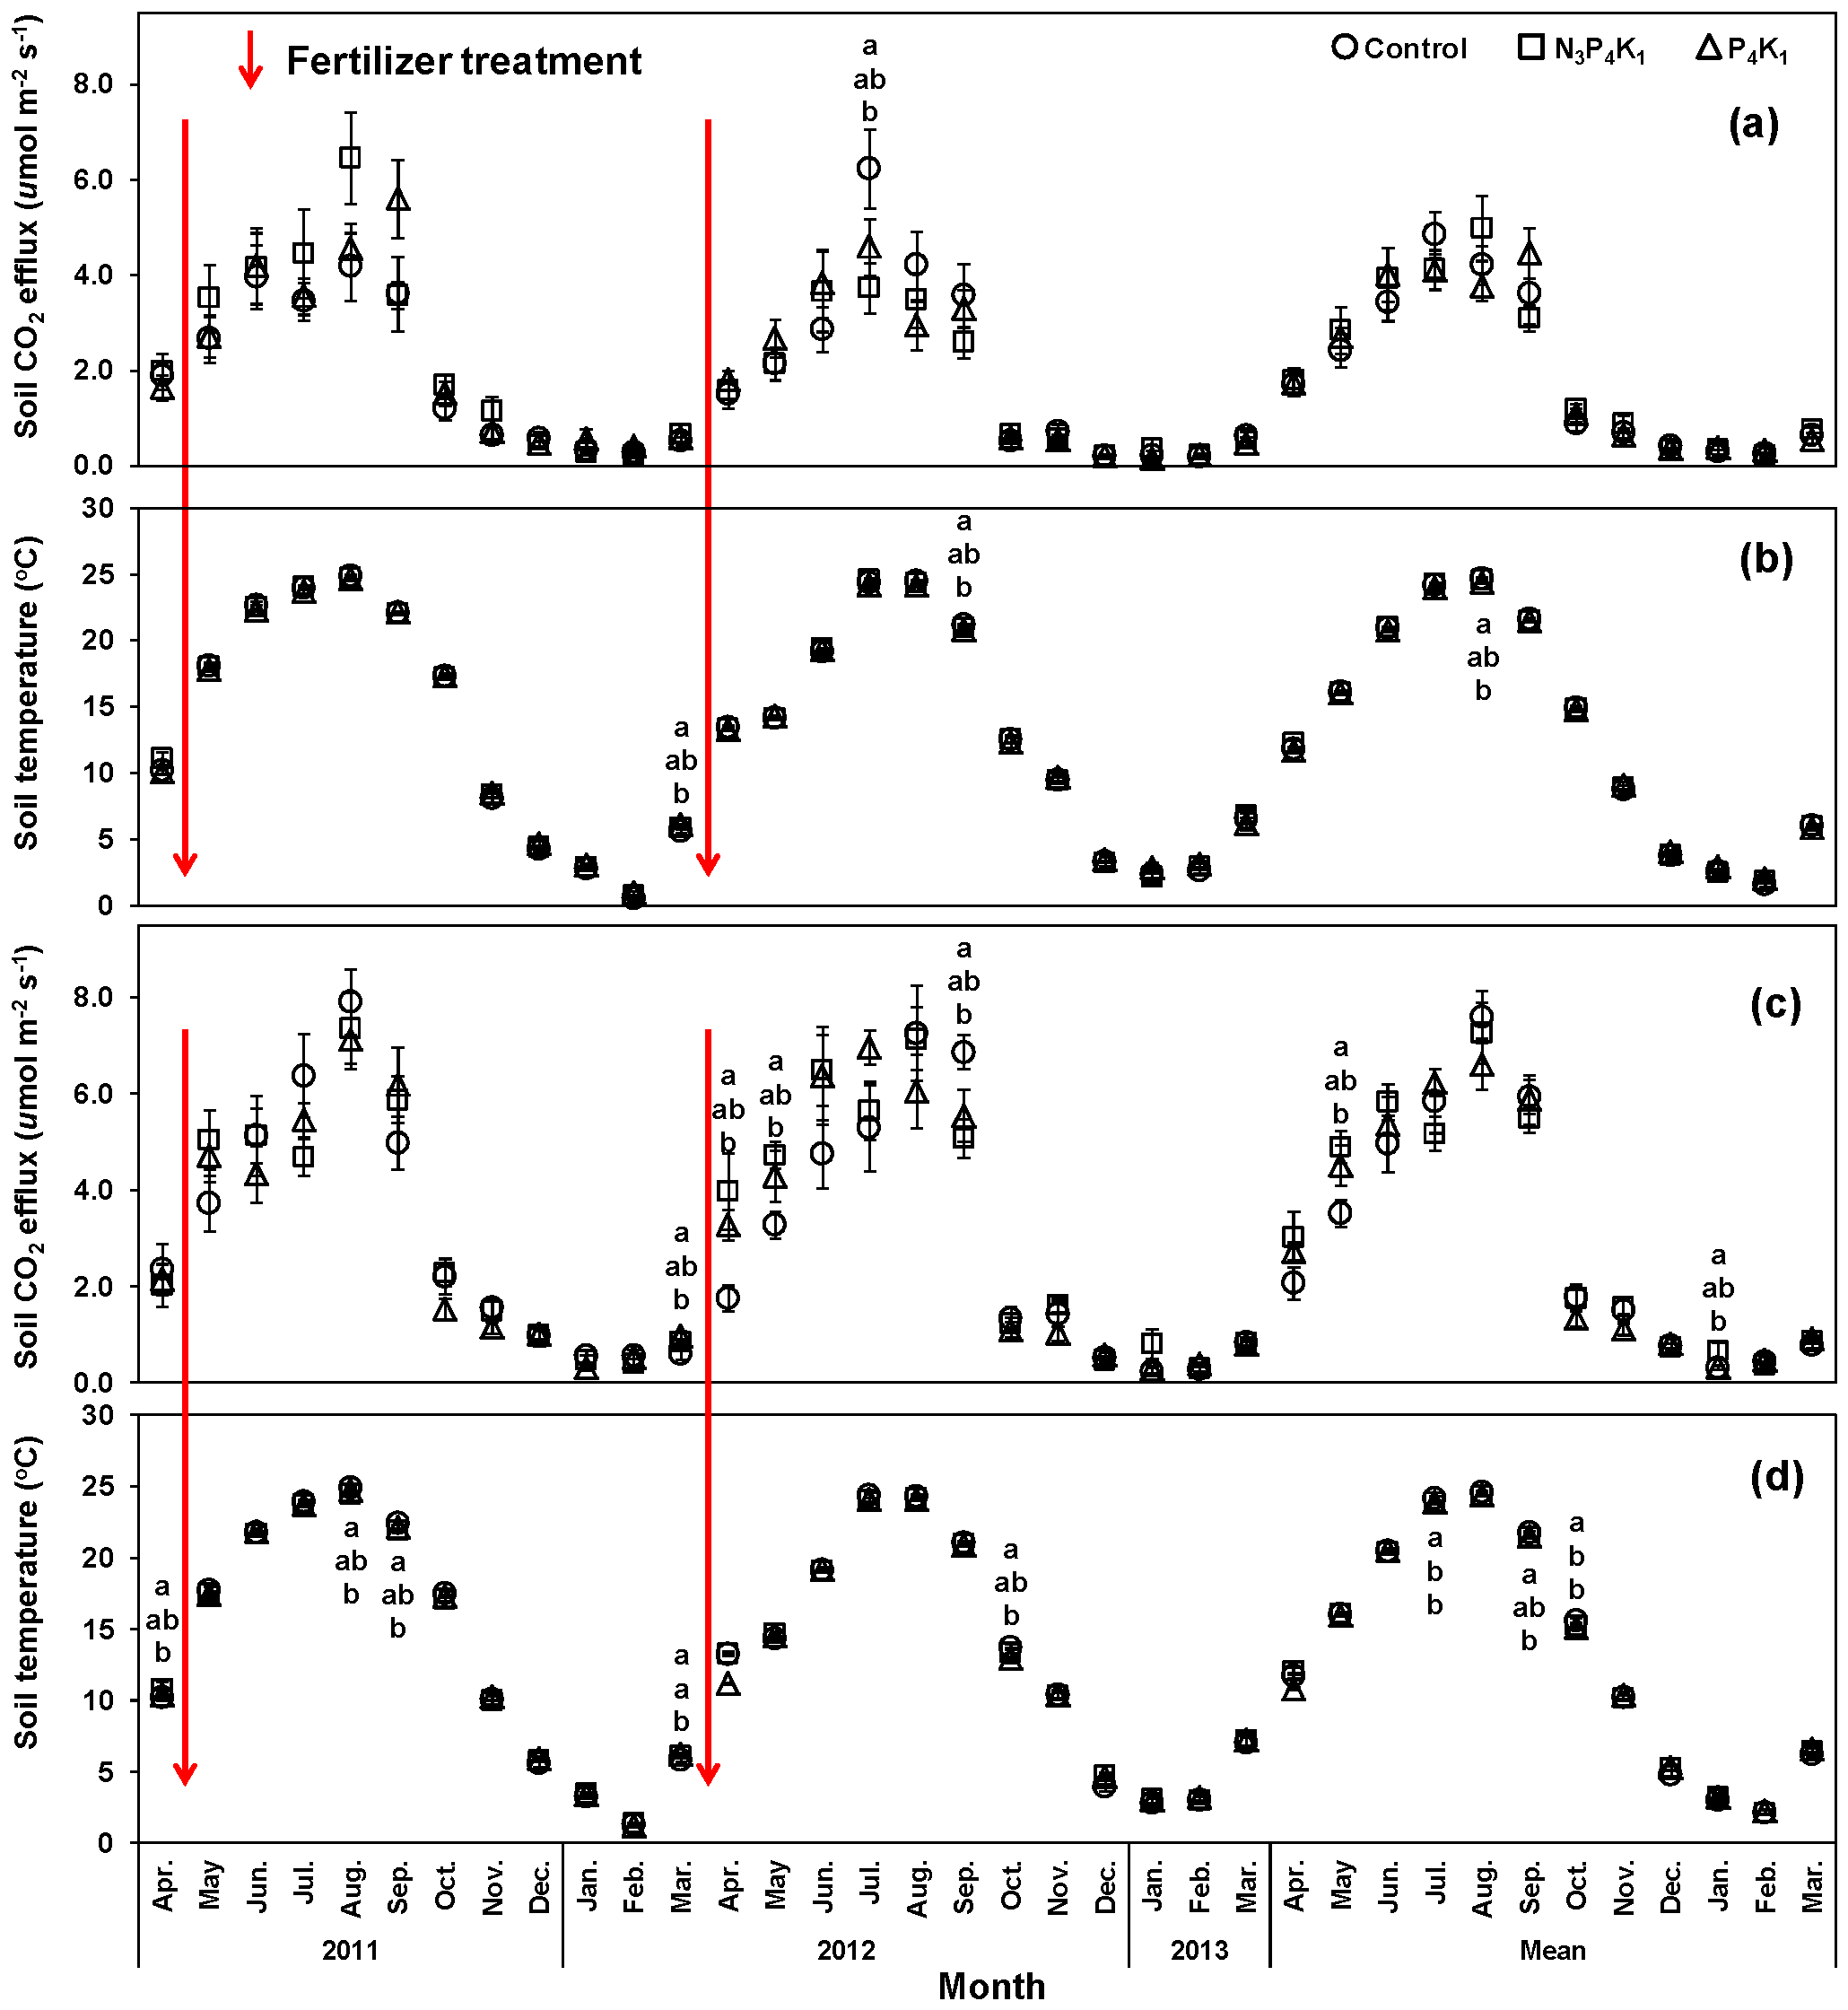
3.2. Monthly Variation of Rh and Rs Rates

Monthly variations in Rh rates were not significantly affected (p > 0.05) by the compound fertilizer types over the two-year study period except for July 2012 (Figure 2). However, Rs rates during early growing season (March–May 2012) were significantly lower in the control treatment than in the N3P4K1 treatment (Figure 2). Rh and Rs rates in all treatments showed clear seasonal variation in which the rates increased during spring and summer, and reached their maximum values in July and September (Figure 2). In addition, temporal variation in Rs and Rh rates had a similar seasonal pattern to soil temperature, whereas the variations were not related to extractable soil NH4+ and NO3 concentrations regardless of the compound of fertilizer types (Figure 3).

3.3. Annual Rh and Rs Rates

Annual Rh rates had a significant main effect on year with no significant fertilizer treatment and interaction effects, but annual Rs rates and fertilizer treatment did not generate any significant main and interaction effects (Table 2). There was a significant effect on mean annual soil temperature during the study period, but soil temperature was not affected by fertilizer application. Annual Rs rates were not significantly affected by the compound fertilizer types for two years, although the rates were slightly higher in the N3P4K1 than in the P4K1 or the control treatments (Table 2). Additionally, mean annual Rh rates were not significantly different among the compound fertilizer types and the control. Mean annual Rs rates (µmol·m2·s1) were same between 2011 (3.02) and 2012 (3.02), but Rh rates were significantly lower in 2012 (1.77) than in 2011 (2.17).
Rh rates of the fertilizer treatments in 2011 represented 78% for the N3P4K1 treatment, 75% for the P4K1 treatments, and 63% of Rs rates in the control treatment. In comparison, the Rh rates of the fertilizer treatments in 2012 were 51% for the N3P4K1, 58% for the P4K1, and 68% of Rs rates in the control treatment (Table 3). Rh rates after the second year following fertilizer application fell to 27% for the N3P4K1 and 17% in P4K1 treatments, respectively, while an increase of 5% in the control treatment was comparable to the first year’s fertilizer application. Ra rates (Rs–Rh) in 2011 were 22%–25% in the fertilizer treatments and 37% of Rs rates in the control treatment, respectively, while the rates in 2012 were 42%–49% in the fertilizer treatments and 32% of Rs rates in the control treatment, respectively (Table 3).

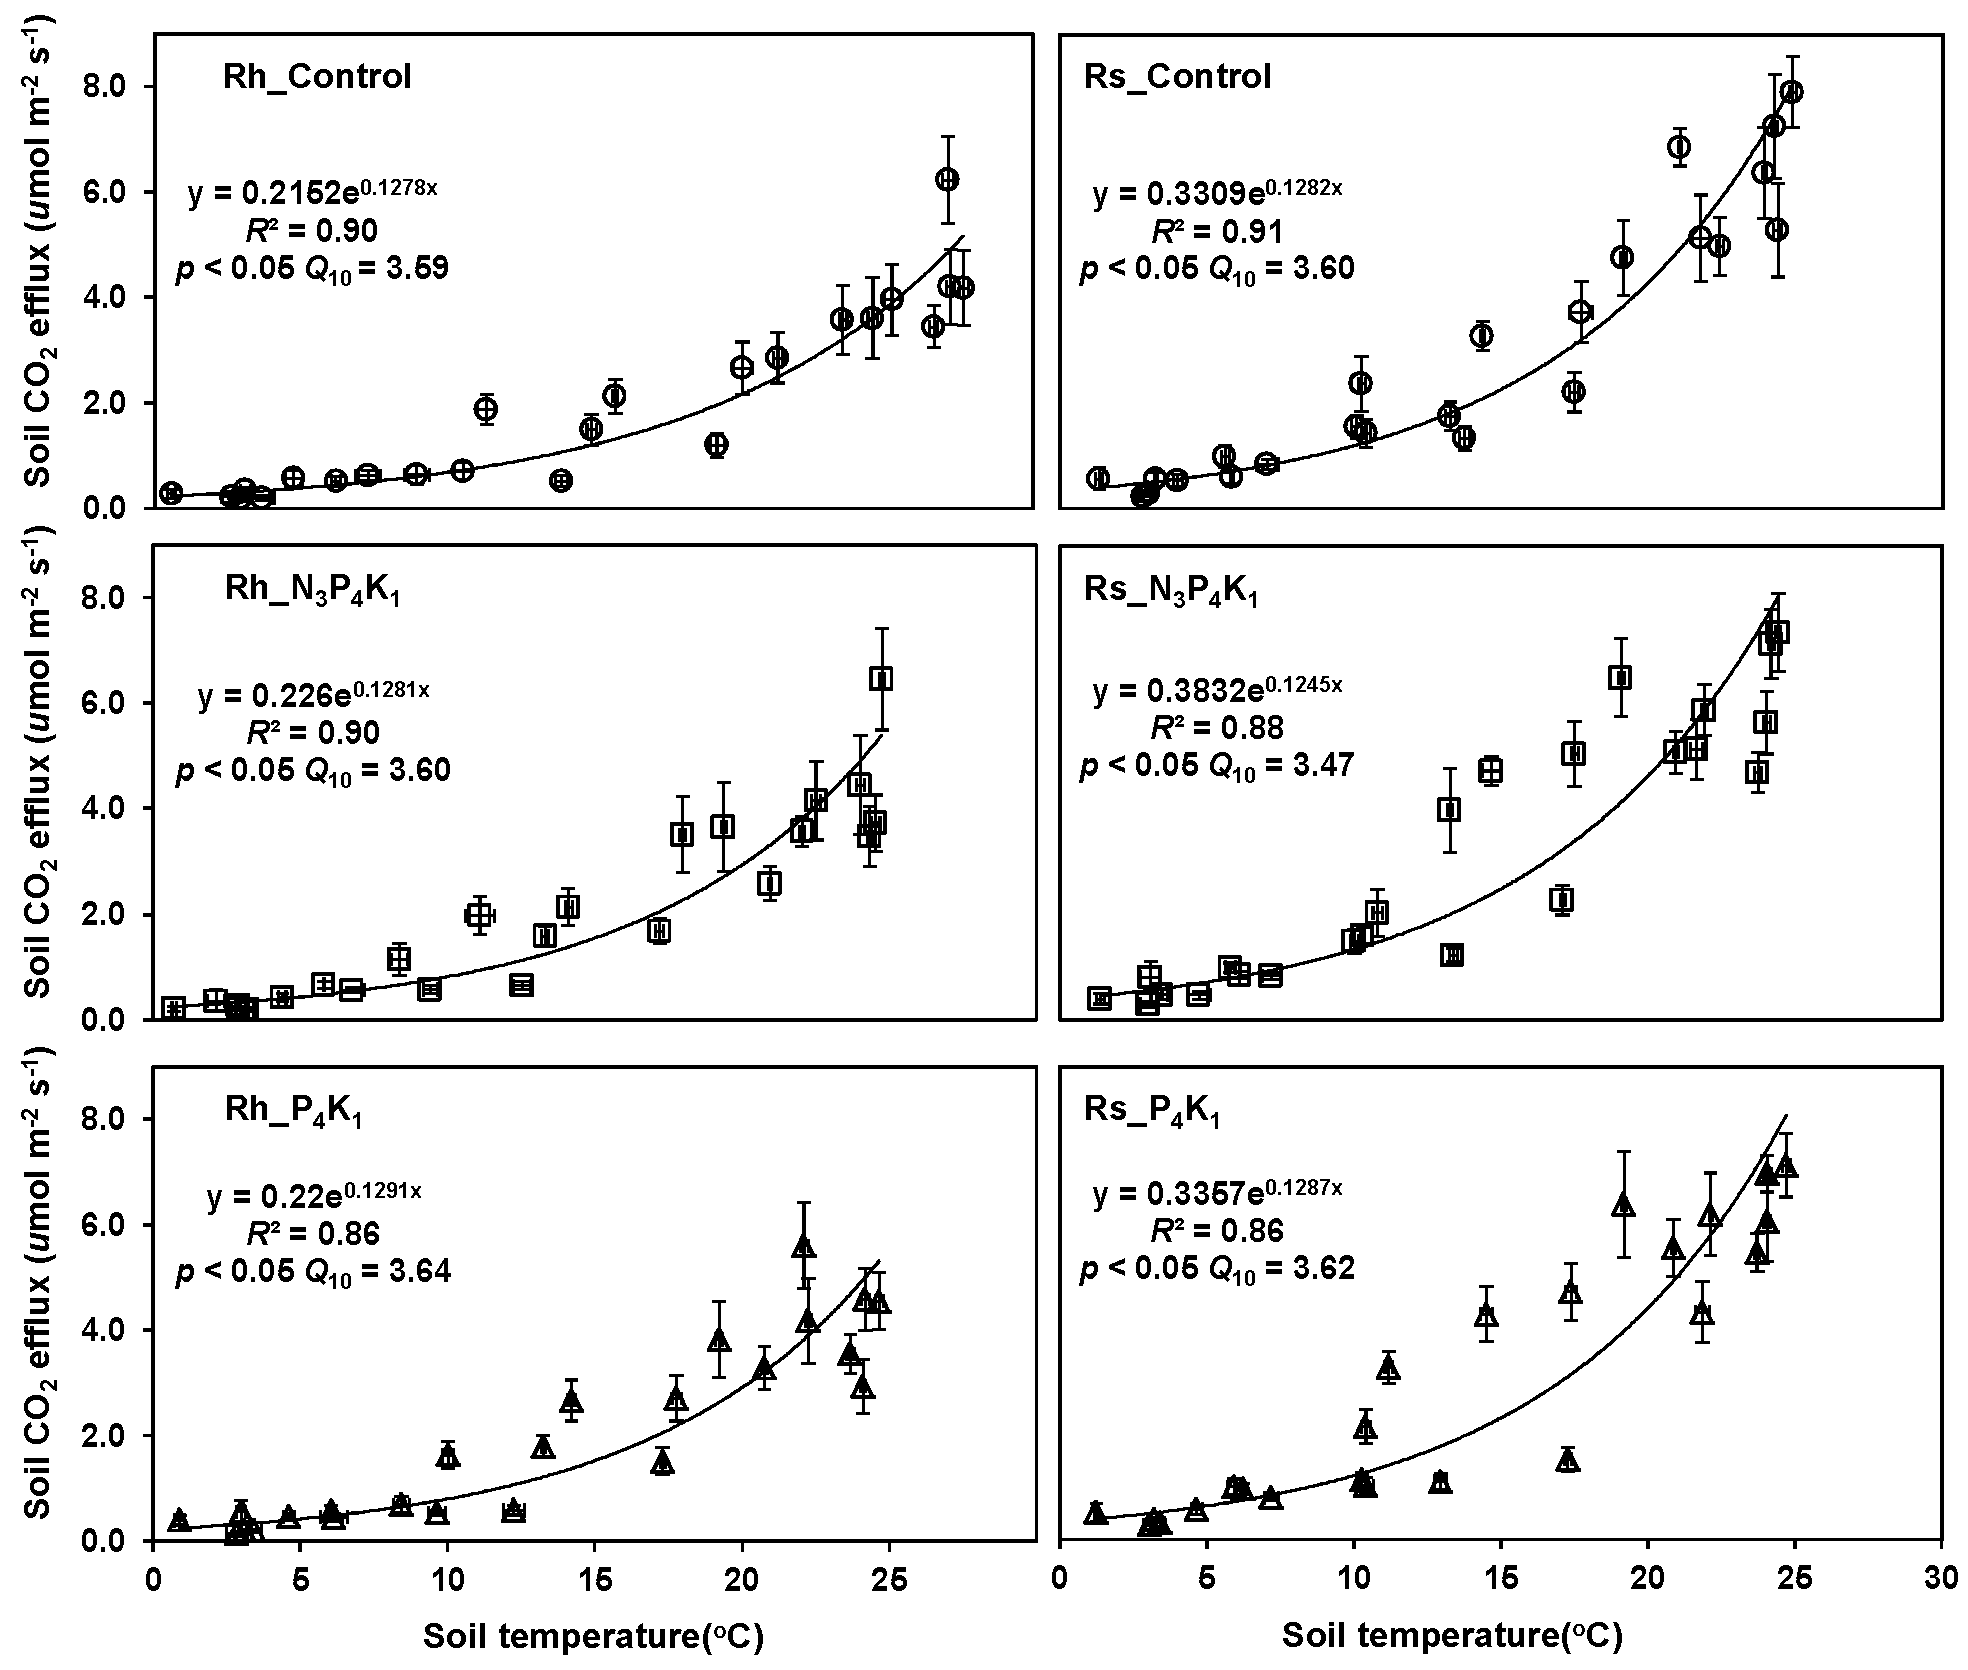
3.4. Temperature Dependency of Rh and Rs

The exponential relationships between Rs and Rh rates and the corresponding soil temperature (Figure 4) were significant (Rh: R2 = 0.86–0.90, p < 0.05; Rs: R2 = 0.86–0.91, p < 0.05) in the fertilizer and control treatments. Soil temperature explained 86% to 91% of the variation in Rs and Rh rates in the fertilizer and control treatments. Q10 values in Rs rates were 3.47 for the N3P4K1 treatment, 3.62 for the P4K1 treatment, and 3.60 in the control treatments, while Q10 values in Rh rates were 3.60 for the N3P4K1 treatment, 3.64 for the P4K1 treatment, and 3.59 in the control treatment.

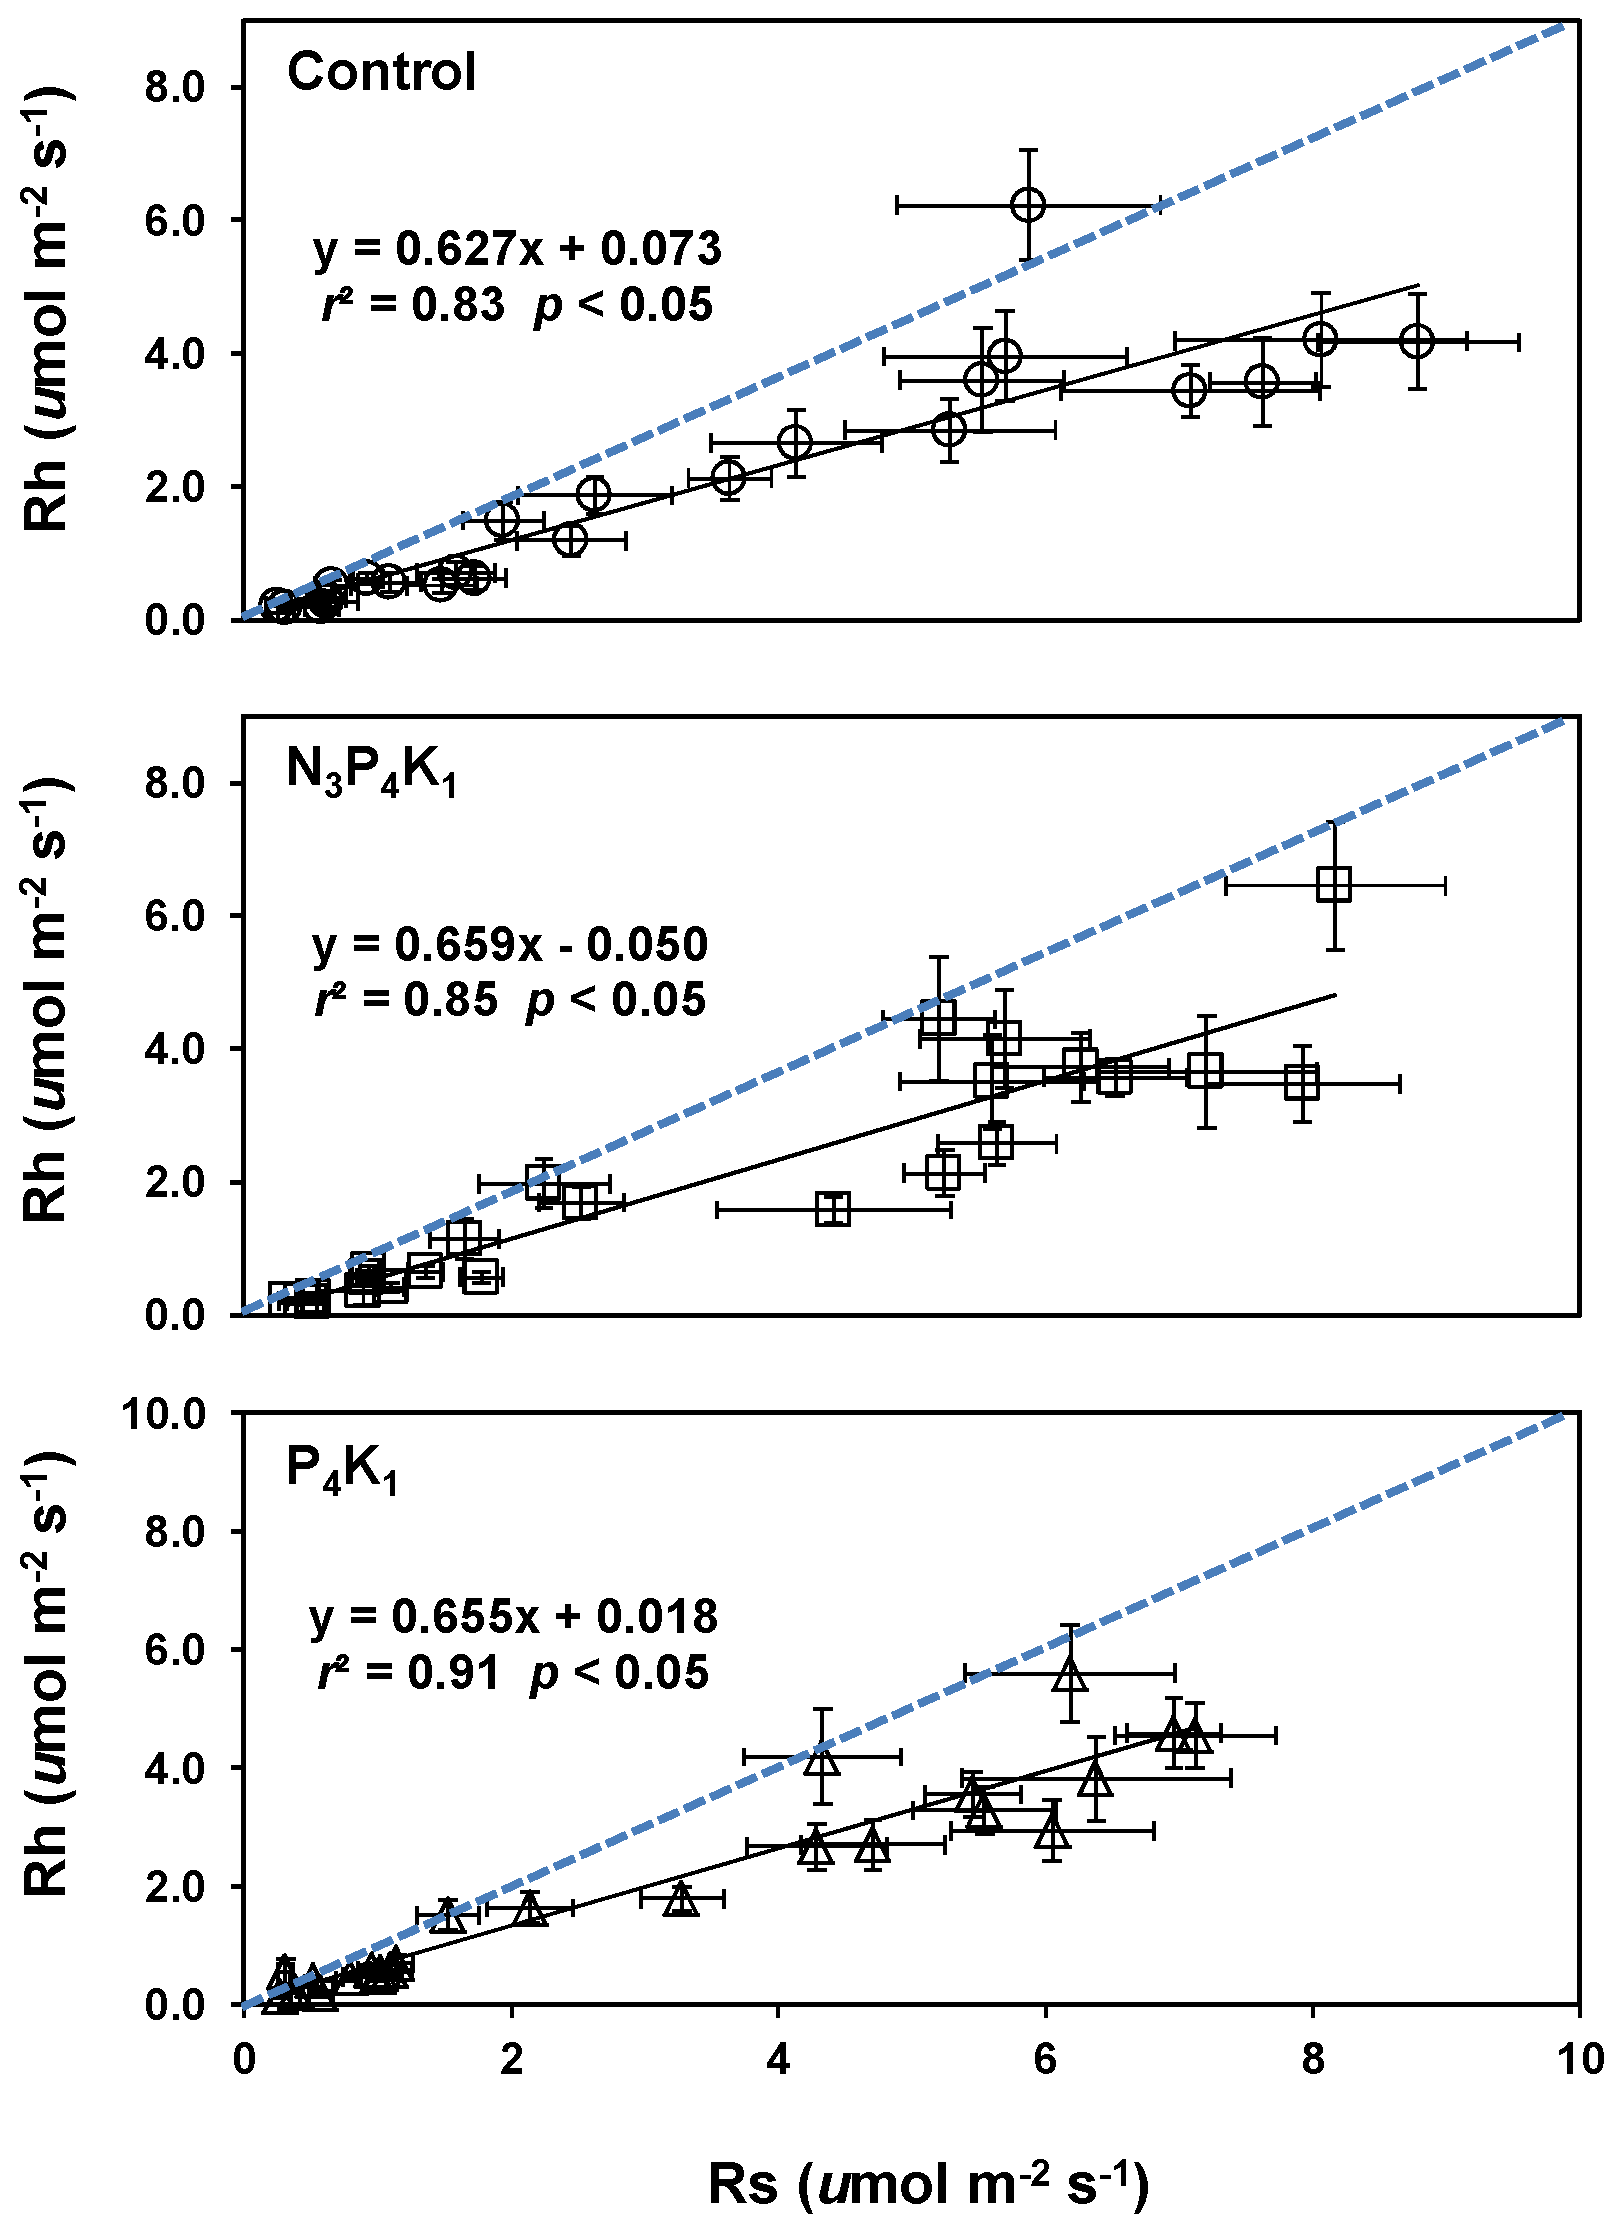
3.5. Relationships between Rs and Rh Rates

Rh rates were positively correlated (r = 0.91–0.95, p < 0.05) to Rs for all treatments (Figure 5). The correlation coefficient between Rs and Rh rates in the P4K1 treatment (r = 0.95, p < 0.05) was slightly higher than the other treatments (r = 0.91–0.92, p < 0.05). In addition, the regressions in the fertilizer and control treatments represented a linear relationship with similar slopes among the treatments.

4. Discussion

Fertilizer application revealed a significant effect on the monthly Rs rates, but the monthly Rh rates were generally less influenced by the compound fertilizer types. The monthly Rs rates in the early growing season were significantly higher in the N3P4K1 fertilizer application compared with the control treatment. This finding may be related to Ra rates induced by root growth activities in spring [13] following the N3P4K1 treatment. However, less monthly variations in Rh rates indicate that microbial activity in fertilizer treatments could be limited by other environmental factors, rather than by the changes in N availability after fertilizer application because extractable soil NH4+ concentration was consistently greater from the N3P4K1 treatments than from the P4K1 or control treatments (Figure 3). For example, soil temperature explained the majority of temporal variations in Rs and Rh rates in the fertilizer and control treatments because microbial decay and root growth activities were temperature-dependent [22,23,24]. Studies in Korean forest stands have reported that seasonal Rs and Rh rates correlated strongly to seasonal fluctuations in soil temperature [2,15] because of no monthly fluctuation in soil water content [2,25]. In addition, the variation in Rs and Rh rates at the seasonal scale was affected by limiting soil water content, such as decreasing soil matric potential or high soil water content [2,23,24,26].
Fertilizer application induced a decrease in the proportion of Rh, while annual rates of Rs were not affected by the compound fertilizer types. Rh rates of fertilizer treatments in 2012 had rapidly declined by 17%–27% compared to 2011. The rapid decline in the proportion of Rh rates following the fertilizer treatments could be associated with the decreased decomposition of dead roots because of a similar soil temperature between the control and fertilizer treatments. It has also attributed to reduced diffusion for Rh rates by decreased air-filled pore space because many studies have reported increases in soil water content following trenching due to the elimination of root uptake of soil water [16,20]. However, changes in soil water content due to trenching may have no significant effects because of little change was observed in Rh rates in the control treatment during the two-year study period (Table 2). In addition, the results need to be interpreted cautiously because the effect of soil water content and root decomposition on the Rs and Rh rates was not measured in this study. This reduction in the proportion of Rh rates after fertilizer application concurs with many previous studies describing the negative effects of high soil N concentrations on soil organic decomposition rates [3,6,12]. For example, the decrease in Rh rates with fertilizer application may be due to the rapid change in quality and quantity of substrates, which could have attributed to changes in nutrient availability for microbial decay by decreased soil microbial biomass following fertilizer application [10]. In contrast to this result, Samuelson et al. [11] observed that applying fertilizer increased Rh rates, microbial biomass, and microbial activity, with reduced fine root biomass in a loblolly pine plantation in the USA. The proportion of Rh rates (63%–68%) in the control treatment of this study was comparable to approximately 66% of Rs rates observed in temperate coniferous forests in Korea [16]. In contrast to Rh rates, Ra rates in the fertilizer treatments in 2011 were 22%–25% of Rs in 2011 and 42%–49% of Rs in 2012, respectively. The increase in the proportion of Ra rates in fertilizer treatments in 2012 could be due to the changing of C allocation to the roots in response to increased nutrient availability [5,7]. Additionally, soil environmental changes in response to fertilizer application are closely linked to root growth activities and nutrient availability [11]. The Ra values of the control treatment in this stand were comparable to those of 33% and 62% for pine forests [9].
An exponential regression has been widely used to describe the relationship between Rs rates and temperature following fertilizer application in forest stands [2,27]. In this study, significant exponential relationships were obtained between Rs or Rh rates and the corresponding soil temperature in the fertilizer (R2 = 0.86–0.90, p < 0.05) and control (R2 = 0.90–0.91, p < 0.05) treatments. The effect of soil temperature on Rs rates was commonly expressed by the coefficient Q10 which could indicate sensitivity to soil temperature [19]. Q10 values in Rs rates were lower in the N3P4K1 treatment (3.47) than in the P4K1 (3.62) and the control (3.60) treatments. A decreased temperature sensitivity of Rs rates under N3P4K1 treatment may be attributed to increased Ra rates resulting from the change in nutrient availability by the N supply compared with the P4K1 or control treatments. For example, mean annual extractable soil NH4+ and NO3 concentrations during the study period were significantly higher for the N3P4K1 (7.65 mg·kg−1) than for the control (0.27 mg·kg−1) treatments (Figure 3). Q10 values of Rs rates in this study were comparable to those of other red pine forests (3.45–3.77 at 12 cm soil depth) in Korea [15]. In contrast to Rs rates, the effects of soil temperature on Rh rates were not influenced by compound fertilizer types. This result indicates that Rh rates in red pine stands might be independent of compound fertilizer types because soil temperature is more likely to control Rh activity [28] compared with nutrient availability at a given site. However, the high Q10 value of the Rh rates (3.60) compared with that of Rs rates (3.47) of the N3P4K1 treatment may have resulted from the high availability of N for microbial decay due to the increased dead root biomass following trenching.

5. Conclusions

Mean annual Rs rates were minimally affected by the change in nutrient availability with compound fertilizer types in red pine stands. It is also evident that Rh rates were independent of compound fertilizer types because soil temperature is likely to control Rh activity. The proportion of Rh rates fell to 27% for N3P4K1 and 17% in P4K1 treatments in the second year compared with the first fertilization year. The results demonstrate the importance of separating Rh rates from Rs rates following the application of compound fertilizer.

Acknowledgments

This study was partially supported by the Centre for Environmental Risk Assessment and Remediation (CERAR), the University of South Australia, by Basic Science Research Program through the National Research Foundation of Korea (NRF) funded by the Ministry of Education (2010-0022193; No. 2014R1A1A2054994) and by Forest Science and Technology Project (S211212L030320) provided by Korea Forest Service.

Author Contributions

Jaeyeob Jeong performed the experiment and wrote the paper; Nanthi Bolan provided constructive suggestions on the study; Choonsig Kim conceived and designed the experiments.

Conflicts of Interest

The authors declare no conflict of interest.

References

  1. Jandl, R.; Lindner, M.; Vesterdal, L.; Bauwens, B.; Baritz, R.; Hagedorn, F.; Johnson, D.W.; Minkkinen, K.; Byrne, K.A. How strongly can forest management influence soil carbon sequestration? Geoderma 2007, 137, 253–268. [Google Scholar] [CrossRef]
  2. Kim, C. Soil carbon storage, litterfall and CO2 efflux in fertilized and unfertilized larch (Larix leptolepis) plantations. Ecol. Res. 2008, 23, 757–763. [Google Scholar] [CrossRef]
  3. Wang, Q.; Zhang, W.; Sun, T.; Chen, L.; Pang, X.; Wang, Y.; Xiao, F. N and P fertilization reduced soil autotrophic and heterotrophic respiration in young Cunninghamia lanceolate forest. Agric. For. Meteorol. 2017, 232, 66–73. [Google Scholar] [CrossRef]
  4. Hasselquist, N.J.; Metcalfe, D.B.; Högberg, P. Contrasting effects of low and high nitrogen additions on soil CO2 flux components and ectomycorrhizal fungal sporocarp production in a boreal forest. Glob. Chang. Biol. 2012, 18, 3596–3605. [Google Scholar] [CrossRef]
  5. Haynes, B.E.; Gower, S.T. Belowground carbon allocation in unfertilized and fertilized red pine plantations in northern Wisconsin. Tree Physiol. 1995, 15, 317–325. [Google Scholar] [CrossRef] [PubMed]
  6. Olsson, P.; Linder, S.; Giesler, R.; Högberg, P. Fertilization of boreal forest reduces both autotrophic and heterotrophic soil respiration. Glob. Chang. Biol. 2005, 11, 1745–1753. [Google Scholar] [CrossRef]
  7. Phillips, R.P.; Fahey, T.J. Fertilization effects on fineroot biomass, rhizosphere microbes and respiratory fluxes in hardwood forest soils. New Phytol. 2007, 176, 655–664. [Google Scholar] [CrossRef] [PubMed]
  8. Lee, K.H.; Jose, S. Soil respiration, fine root production, and microbial biomass in cottonwood and loblolly pine plantations along a nitrogen fertilization gradient. For. Ecol. Manag. 2003, 185, 263–273. [Google Scholar] [CrossRef]
  9. Raich, J.W.; Tufekciogul, A. Vegetation and soil respiration: Correlations and controls. Biogeochemistry 2000, 48, 71–90. [Google Scholar] [CrossRef]
  10. He, T.; Wang, Q.; Wang, S.; Zhang, F. Nitrogen addition altered the effect of belowground C allocation on soil respiration in a subtropical forest. PLoS ONE 2016, 11, e0155881. [Google Scholar] [CrossRef] [PubMed]
  11. Samuelson, L.; Mathew, R.; Stokes, T.; Feng, Y.; Aubrey, D.; Coleman, M. Soil and microbial respiration in a loblolly pine plantation in response to seven years of irrigation and fertilization. For. Ecol. Manag. 2009, 258, 2431–2438. [Google Scholar] [CrossRef]
  12. Franklin, O.; Högberg, P.; Ekblad, A.; Ågren, G.I. Pine forest floor carbon accumulation in response to N and PK additions: Bomb 14C modelling and respiration studies. Ecosystems 2003, 6, 644–658. [Google Scholar] [CrossRef]
  13. Hwang, J.; Son, Y.; Kim, C.; Yi, M.J.; Kim, Z.S.; Lee, W.K.; Hong, S.K. Fine root dynamics in thinned and limed pitch pine and Japanese larch plantations. J. Plant Nutr. 2007, 30, 1821–1839. [Google Scholar] [CrossRef]
  14. Kim, C.; Jeong, J.; Park, J.H.; Ma, H.S. Growth and nutrient status of foliage as affected by tree species and fertilization in a fire-disturbed urban forest. Forests 2015, 6, 2199–2213. [Google Scholar] [CrossRef]
  15. Noh, N.J.; Son, Y.; Lee, S.K.; Yoon, T.K.; Seo, K.W.; Kim, C.; Lee, W.K.; Bae, S.W.; Hwang, J. Influence of stand density on soil CO2 efflux for a Pinus densiflora forest in Korea. J. Plant Res. 2010, 123, 411–419. [Google Scholar] [CrossRef] [PubMed]
  16. Lee, N.; Koo, J.W.; Noh, N.J.; Kim, J.; Son, Y. Autotrophic and heterotrophic respiration in needle fir and Quercus-dominated stands in a cool-temperate forest, central Korea. J. Plant Res. 2010, 123, 485–495. [Google Scholar] [CrossRef] [PubMed]
  17. Kim, C.; Jeong, J.; Bolan, N.S.; Naidu, R. Short-term effects of fertilizer application on soil respiration in red pine stands. J. Ecol. Field Biol. 2012, 35, 307–311. [Google Scholar] [CrossRef]
  18. Joo, J.H.; Lee, W.K.; Kim, T.H.; Lee, C.Y.; Jin, I.S.; Park, S.K.; Oh, M.Y. Studies on fertilization in pruning and thinning stands. The Res. Rep. For. Res. Insti., Korea 1983, 30, 155–189. [Google Scholar]
  19. Bond-Lamberty, B.; Bronson, D.; Bladyka, E.; Gower, S.T. A comparison of trenched plot techniques for partitioning soil respiration. Soil Biol. Biochem. 2011, 43, 2108–2114. [Google Scholar] [CrossRef]
  20. ArchMiller, A.A.; Samuelson, L.J. Partitioning longleaf pine soil respiration into its heterotrophic and autotrophic components through root exclusion. Forests 2016, 7, 39. [Google Scholar] [CrossRef]
  21. Statistical Analysis System (SAS) Institute Inc. SAS/STAT Statistical Software, version 9.1; SAS Publishing: Cary, NC, USA, 2003.
  22. Davidson, E.A.; Janssens, I.A. Temperature sensitivity of soil carbon decomposition and feedbacks to climate change. Nature 2006, 440, 165–173. [Google Scholar] [CrossRef] [PubMed]
  23. Suseela, V.; Conant, R.T.; Wallenstein, M.D.; Dukes, J.S. Effects of soil moisture on the temperature sensitivity of heterotrophic respiration vary seasonally in an old-field climate change experiment. Glob. Chang. Biol. 2012, 18, 336–348. [Google Scholar] [CrossRef]
  24. Yuste, J.C.; Baldocchi, D.D.; Gershenson, A.; Goldstein, A.; Misson, L.; Wong, S. Microbial soil respiration and its dependency on carbon inputs, soil temperature and moisture. Glob. Chang. Biol. 2007, 13, 2018–2035. [Google Scholar]
  25. Kim, C.; Jeong, J. Comparison of soil CO2 efflux rates in Larix leptolepis, Pinus densiflora and P. rigitaeda plantations in Southern Korea. Dendrobiology 2016, 76, 51–60. [Google Scholar] [CrossRef]
  26. Davidson, E.A.; Belk, E.; Boone, R.D. Soil water content and temperature as independent or confounded factors controlling soil respiration in a temperate mixed hardwood forest. Glob. Chang. Biol. 1998, 4, 217–227. [Google Scholar] [CrossRef]
  27. Bowden, R.D.; Davidson, E.; Savage, K.; Arabia, C.; Steudler, P. Chronic nitrogen additions reduce total soil respiration and microbial respiration in temperate forest soils at the Harvard Forest. For. Ecol. Manag. 2004, 196, 43–56. [Google Scholar] [CrossRef]
  28. Wei, W.; Weile, C.; Shaopeng, W. Forest soil respiration and its heterophic and autotrophic components: Global patterns and responses to temperate and precipitation. Soil Biol. Biochem. 2010, 42, 1236–1244. [Google Scholar] [CrossRef]
Figure 1. Study site (a), fertilizer application ((b): white grains are urea) and trenching treatments (c) with polyvinyl chloride collars (d) to separate Rh rates from Rs rates.
Forests 07 00309 g001
Figure 2. Monthly variation of Rh rates (a) and soil temperature (b) or Rs rates (c) and soil temperature (d) for fertilizer and control treatments in red pine stands. Vertical bars represent standard errors (n = 12). Different letters at each month indicate a significant difference among treatments at p < 0.05.
Forests 07 00309 g002
Figure 3. Monthly variation of extractable soil NH4+ and NO3 concentrations for fertilizer and control treatments in red pine stands. Vertical bars represent standard errors (n = 6). Different letters at each month indicate a significant difference among treatments at p < 0.05.
Forests 07 00309 g003
Figure 4. Exponential regressions showing the relationship between soil temperatures and Rh or Rs rates for fertilizer (N3P4K1: squares; P4K1: triangles) and control (circles) treatments in red pine stands. Vertical bars represent standard error (n = 12).
Forests 07 00309 g004
Figure 5. Relationships between Rs and Rh rates for fertilizer (N3P4K1: squares; P4K1: triangles) and control (circles) treatments in red pine stands. Vertical bars represent standard error (n = 12). Dashed line represents a 1:1 relationship (Intercept = 0; slope = 1) between Rs and Rh rates in red pine stands.
Forests 07 00309 g005
Table 1. General stand and soil characteristics of the study site before fertilizer application.
TreatmentStand DensityDBHBasal AreaSandSiltClayCNPK+Ca2+Mg2+
(trees·ha−1)(cm)(m2·ha−1)(%)(%)(%)(%)(%)(mg·kg−1)(cmolc·kg−1)
Control1217 (133) a15.74 (0.84) a22.37 (1.95) a45 (3.5) a43 (3.0) a12 (1.0) a2.40 (0.28) a0.07 (0.01) a3.9 (0.40) a0.09 (0.01) a1.35 (0.19) b0.43 (0.05) b
N3P4K11150 (193) a15.89 (1.10) a20.56 (2.42) a42 (2.9) a44 (1.8) a14 (1.0) a2.82 (0.21) a0.09 (0.01) a6.5 (0.73) a0.09 (0.01) a1.77 (0.17) ab0.54 (0.04) ab
P4K11150 (152) a16.46 (1.46) a22.62 (2.00) a42 (2.0) a45 (1.9) a13 (1.8) a2.66 (0.27) a0.08 (0.01) a5.8 (1.61) a0.09 (0.01) a2.10 (0.26) a0.65 (0.05) a
Values in parenthesis represent standard errors (n = 6). DBH: diameter at breast height at 1.2 m. The same letters among the treatments are not significantly different at p < 0.05.
Table 2. Mean annual Rh or Rs rates and soil temperature for fertilizer and control treatments in red pine stands (2011: April 2011–March 2012; 2012: April 2012–March 2013) with p-value by a two-way analysis of variance (ANOVA) on soil respiration rates and soil temperature.
YearTreatmentdfSoil Respiration Rates (µmol·m2·s1)Soil Temperature (°C)
RhRsRhRs
2011Control-1.93 (0.20)3.08 (0.21)13.4 (0.10)13.7 (0.06)
N3P4K1-2.37 (0.26)3.05 (0.11)13.5 (0.04)13.7 (0.05)
P4K1-2.20 (0.13)2.95 (0.12)13.4 (0.05)13.7 (0.03)
Mean-2.17 (0.12)3.02 (0.88)13.4 (0.04)13.7 (0.03)
2012Control-1.91 (0.19)2.82 (0.20)12.8 (0.10)13.1(0.07)
N3P4K1-1.64 (3.19)3.19 (0.23)12.8 (0.10)13.2 (0.08)
P4K1-1.77 (0.12)3.50 (0.16)12.8 (0.14)12.9 (0.15)
Mean-1.77 (0.09)3.02 (0.11)12.8 (0.06)13.1 (0.06)
MeanControl-1.92 (0.14)2.95 (0.14)13.1 (0.07)13.4 (0.04)
N3P4K1-2.01 (0.16)3.12 (0.12)13.1 (0.03)13.4 (0.04)
P4K1-1.98 (0.10)3.00 (0.10)13.1 (0.07)13.3 (0.07)
p-valueYear (Y)10.0090.973<0.001<0.001
Treatment (F)20.8820.5980.7330.504
Y × F20.1520.4470.8060.253
Values in parenthesis represent standard errors (n = 12).
Table 3. Proportion of Rh rates from Rs rates (2011: April 2011–March 2012; 2012: April 2012–March 2013).
YearTreatmentRhRaRs
(%)
2011Control6337100
N3P4K17822100
P4K17525100
Mean7228100
2012Control6832100
N3P4K15149100
P4K15842100
Mean5941100

