Article

Spatial Variations of Soil Moisture under Caragana korshinskii Kom. from Different Precipitation Zones: Field Based Analysis in the Loess Plateau, China

1
State Key Laboratory of Earth Surface Processes and Resource Ecology, College of Resources Science & Technology, Beijing Normal University, Beijing 100875, China
2
Department of Earth Sciences, Indiana University-Purdue University Indianapolis, Indianapolis 46202, USA
*
Author to whom correspondence should be addressed.
Forests 2016, 7(2), 31; https://doi.org/10.3390/f7020031
Submission received: 29 September 2015 / Revised: 10 January 2016 / Accepted: 14 January 2016 / Published: 29 January 2016
(This article belongs to the Special Issue Forest Management and Water Resources in the Anthropocene)

Abstract

:
Soil moisture scarcity has become the major limiting factor of vegetation restoration in the Loess Plateau of China. The aim of this study is: (i) to compare the spatial distribution of deep (up to 5 m) soil moisture content (SMC) beneath the introduced shrub Caragana korshinskii Kom. under different precipitation zones in the Loess Plateau and (ii) to investigate the impacts of environmental factors on soil moisture variability. Soil samples were taken under C. korshinskii from three precipitation zones (Semiarid-350, Semiarid-410, Semiarid-470). We found that the highest soil moisture value was in the 0–0.1 m layer with a large coefficient of variation. The soil water storage under different precipitation zones increased following the increase of precipitation (i.e., Semiarid-350 < Semiarid-410 < Semiarid-470), although the degree of SMC variation was different for different precipitation zones. The SMC in the Semiarid-350 zone initially increased with soil depth, and then decreased until it reached the depth of 2.8-m. The SMC in the Semiarid-410 zone showed a decreasing trend from the top soil to 4.2-m depth. The SMC in the Semiarid-470 zone firstly decreased with soil depth, increased, and then decreased until it reached 4.6-m depth. All SMC values then became relatively constant after reaching the 2.8-m, 4.2-m, and 4.6-m depths for Semiarid-350, Semiarid-410, and Semiarid-470, respectively. The low but similar SMC values at the stable layers across the precipitation gradient indicate widespread soil desiccation in this region. Our results suggested that water deficit occurred in all of the three precipitation zones with precipitation, latitude, field capacity, and bulk density as the main environmental variables affecting soil moisture. Considering the correlations between precipitation, SMC and vegetation, appropriate planting density and species selection should be taken into account for introduced vegetation management.

1. Introduction

The Loess Plateau of China covers an area of more than 6.2 × 10⁵ km2, with diverse rainfall, soil, and vegetation patterns. Vegetation restoration is the primary task of ecological rehabilitation here under the “Grain to Green Program” in the Loess Plateau of China [1], aiming to reverse the existing farmlands to their original grassland or woodland condition. Currently, the ecological restoration of the Loess Plateau has led to significant achievements such as increases in vegetation coverage, decreases in soil erosion, and enhancement of ecosystem services [2,3]. Soil moisture shortages, however, commonly occur as a result of limited rainfall and strong evaporation in this semiarid region of China [4]. The continued expansion of the “Grain to Green Program” might instead lead to dry soil layers, negatively affecting the vegetation sustainability in the Loess Plateau [5] as precipitation is the only source of soil moisture in the region [6]. Since soil moisture is critical in regulating plant growth in these semiarid regions [7], it is crucial to identify the spatial variation and factors affecting soil moisture in different areas of the Loess Plateau of China [8].
Extensive studies on soil moisture have been carried out at the plot, watershed, and regional scale in the Loess Plateau, providing important information for vegetation restoration in the region. Due to the large spatial coverage of the Loess Plateau, however, the relationships between soil moisture and environmental factors may be different from one area to another. Various factors, such as land use [9,10,11,12,13], topography [14,15], soil properties [16] and atmosphere dynamics [17], have been recorded to affect soil moisture variability. Most studies on soil moisture have been done during the rainy season (July to September) [8,18,19], and, therefore, the results might be affected by the amount of individual rainfall. Although there were some studies which did not consider the soil moisture in the upper layer (i.e., 0–1 m depth) to avoid the confounding effects of rainfall variation [19], the results might be incomplete for a whole soil profile study. Our study, which examined a complete soil moisture profile (i.e., from 0–5 m deep) across different precipitation gradients was, therefore, conducted before the rainy season to improve our understanding of soil moisture spatial distributions and the contributing factors.
In the Loess Plateau, forest land occupies 16% of the total area [2]. Shrub, an important part of forest land, is mainly distributed north of the 550 mm rainfall isoline. In many parts of semiarid regions, shrubs have exacerbated the desertification process due to their ability to modify soil water characteristics by increasing water infiltration around them [20]. They also have minimal nutrient requirements, wide adaptation ability, and strong stress resistance [21], making them superior in resource-poor environments [22]. Caragana korshinskii is an introduced leguminous shrub in the semiarid Loess Plateau that has good economic benefits and high ecological values [21]. The ability of C. korshinskii to conserve water and soil has been reported [23], and it quickly became the dominant species with a well-developed root systems (i.e., more than 5 m) in the process of ecological rehabilitation. However, several researchers have reported that C. korshinskii would aggravate water scarcity and lead to soil desiccation in the deeper horizons [24]. For example, Wang et al. (2010) found that drier soil layers were observed under C. korshinskii after a three-year growing period when compared to alfalfa (Medicago sativa L.) [18]. Since C. korshinskii had a well-developed root system [23,24], over the years, it might generate layers of dried soil at a regional scale [18]. It is therefore necessary to identify the spatial variations of the soil moisture under C. korshinskii along different rainfall gradients in the Loess Plateau of China.
Based on the above-mentioned research background, this study aimed to: (1) compare the soil moisture spatial variation beneath C. korshinskii grown under different precipitation zones of the Loess Plateau; (2) investigate the impacts of other environmental factors (e.g., mean annual temperature, bulk density, slope gradient) on soil moisture variability and identify the controlling factors in semiarid regions; and (3) provide suggestions for the regional ecological rehabilitation in the Loess Plateau of China.

2. Materials and Methods
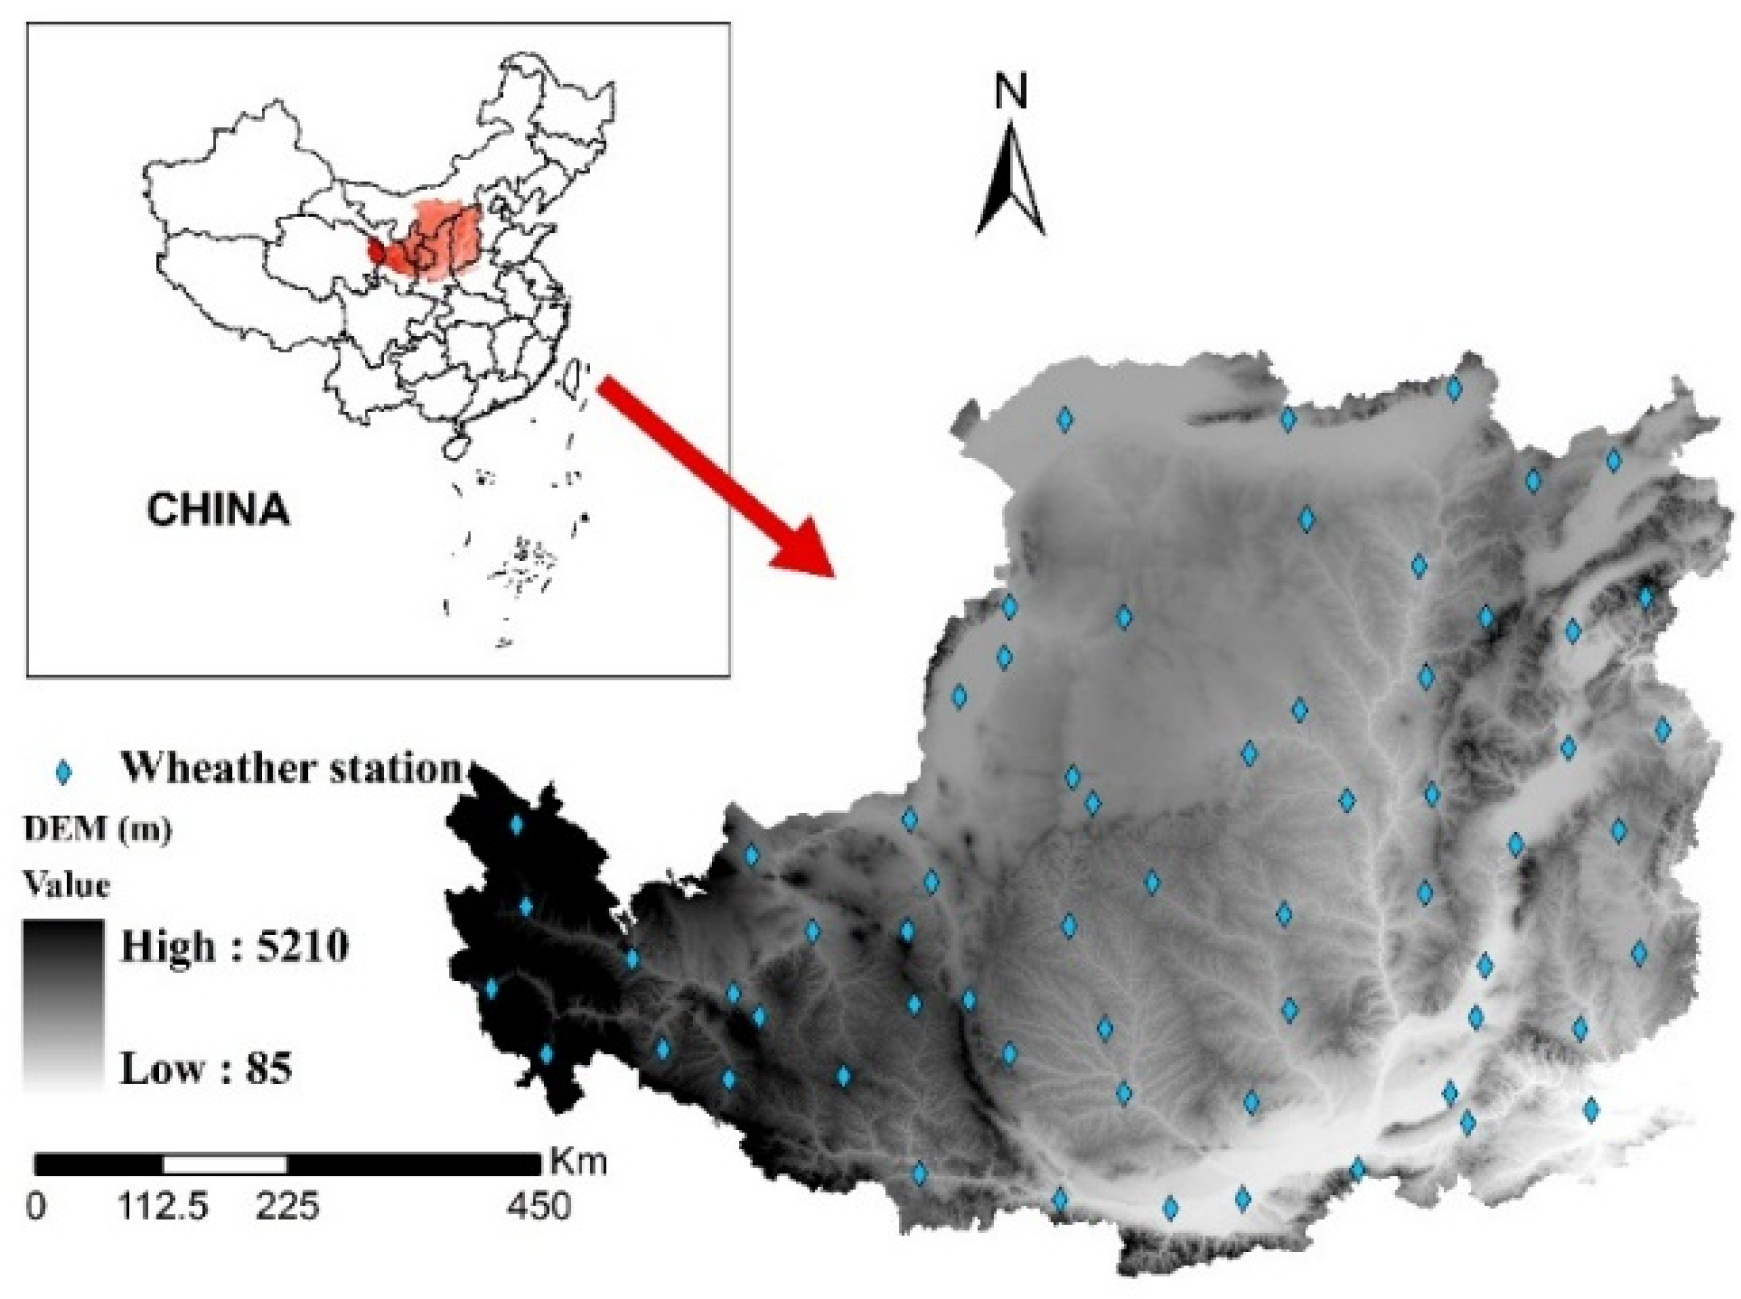
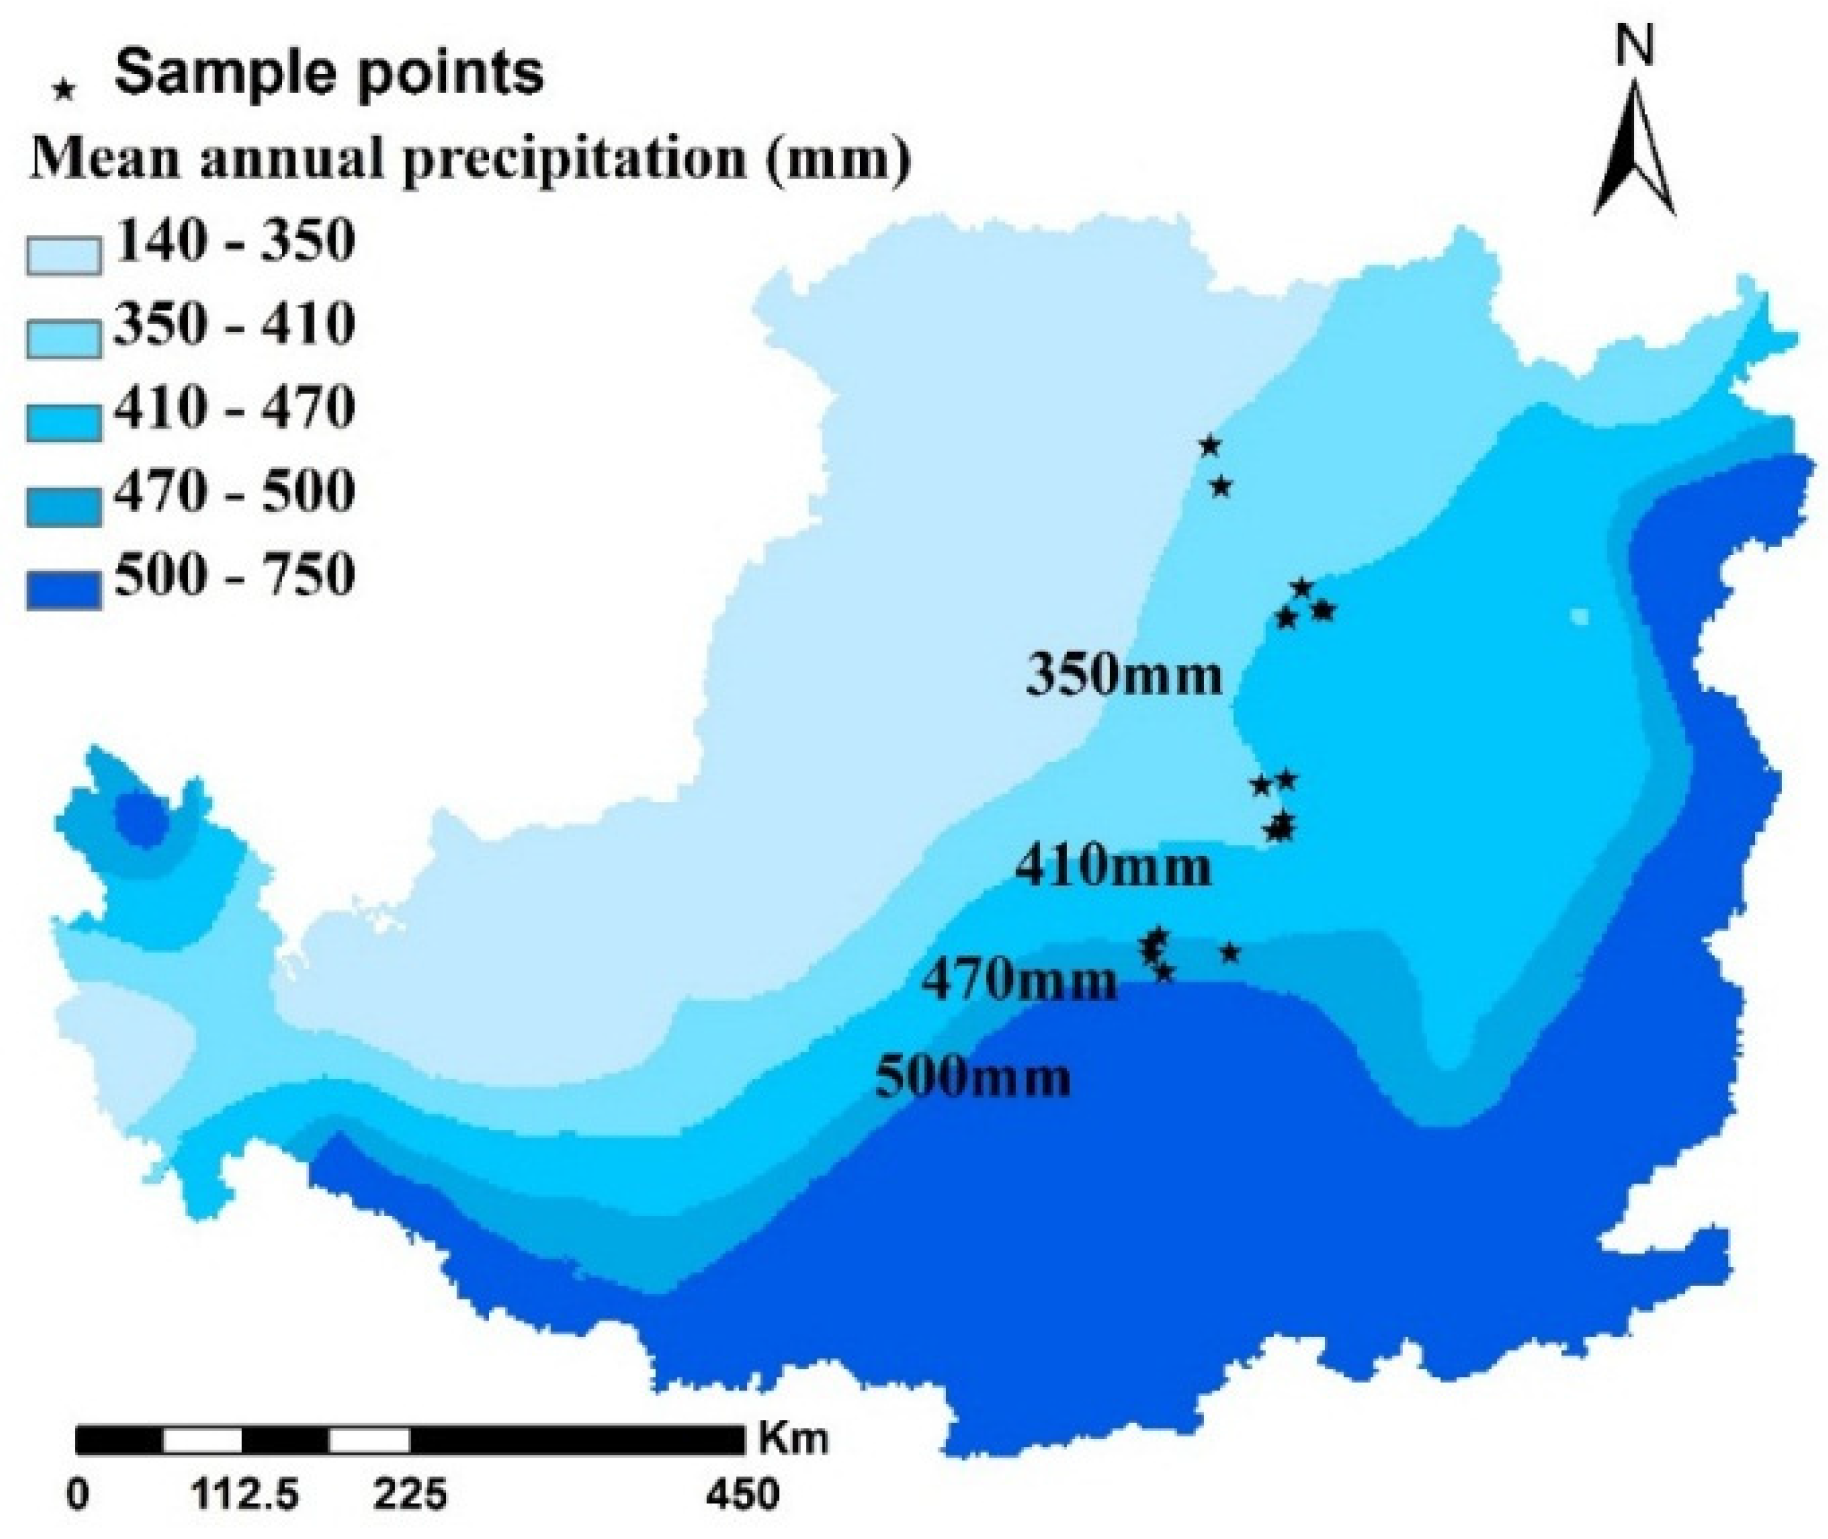
2.1. Study Area

The Loess Plateau in China is located in the middle reaches of the Yellow River, extending from a longitude of 100°54' to 114°33' E and a latitude of 33°43' to 41°16' N [25]. The Loess Plateau comprises 6.67% of the territory in China and supports 8.5% of the Chinese population [2]. This study was conducted in a portion of the semiarid climatic region in the Loess Plateau, located in Shaanxi province and Inner Mongolia. The topography of the study area is hilly and gully [26], with an elevation of sampling points ranging from 927 to 1505 m above sea level. The study area is located in a continental monsoon region where the average annual precipitation ranges from 350 mm in the northwest to 500 mm in the southeast, 70% of which falls from June to September [27]. The main soil type in this area is loess and it is vulnerable to erosion [28]. The dominant shrub species are C. korshinskii, Hippophae rhamnoides L., Sophora viciifolia Franch., Vitex negundo var. Heterophylla, Rosa xanthine Lindl., and Syringa oblate Lindl..

2.2. Sampling Design

Precipitation data were collected from 63 weather stations in the Loess Plateau from 1998 to 2012. The locations of weather stations can be found in Figure 1. The Kriging interpolation method in ArcGIS Desktop (version 9.3) was used to obtain average annual precipitation isolines. Previous studies divided the Loess Plateau into three climatic regions: arid, semiarid, and semi-humid [29]. In this study, part of the semiarid regions was selected, and divided into three precipitation zones based on average annual precipitation (P): Semiarid-350 zone (350 mm < P < 410 mm), Semiarid-410 zone (410 mm ≤ P < 470 mm), and Semiarid-470 zone (470 mm ≤ P < 500 mm) (Figure 2).
Figure 1. Location of the weather stations in the Loess Plateau of China.
Forests 07 00031 g001
Figure 2. The sampling points and precipitation zones of the study area.
Forests 07 00031 g002
In 2014, 17 5 m × 5 m C. korshinskii plots were established. The estimated age of the shrubs according to interviews with local farmers were between 30 and 40 years old. Seven, six, and four typical sampling points were taken from the Semiarid-350, Semiarid-410, and Semiarid-470 precipitation zone, respectively. A preliminary field survey considering the geographic distribution and logistics were conducted during the process of determining those sampling points. The description of each sampling point is shown in Table 1. For comparative analysis, 10 abandoned lands were randomly chosen from the surrounding areas as a control group and the average soil moisture content was calculated for both C. korshinskii and control plots. All of the control plots had been abandoned for more than 20 years. Basic topographic information (longitude, latitude, elevation above sea-level, slope gradient, slope aspect, slope position) was collected using the Garmin GPS (version eTrex 30) and the geological compass (DQL-8).

2.3. Data Collection

Soil samples were collected from 27 April to 20 May 2014. Soil moisture measurements were conducted at the beginning of the growing season for two different soil profiles: (i) the 0–1 m profile in 0.1 m increments and (ii) the 2–5 m profile in 0.2 m increments. Soil samples were taken by a drill and stored in sealed aluminum cases, and soil moisture content was calculated using a gravimetric approach (i.e., oven-dry method at 105 °C for 24 h) [30]. Each time three sampling profiles were randomly chosen to calculate the average soil moisture for each site. At each sampling site, six undisturbed soil cores from the surface soil were also collected in metal cylinders (diameter 5 cm, length 5 cm) to measure bulk density and saturated hydraulic conductivity [31]. A total of 1632 soil samples were collected. Similarly, soil compaction was measured for each sampling site with a pocket penetrometer (Eijkelkamp, 0603). Sampling dates were chosen after a period of seven rainless days to minimize the effects of rainfall variability.
In this study, the depth-averaged SMC (SMCd) of each sampling point was calculated by Equation (1):
S M C d = 1 k i = 1 k S M C i
where k is the number of measurement layers and SMCi is the mean soil moisture content in layer i calculated by three random sampling profiles. The total number of measurement layers is 30.
Table 1. General information of the sampling points.
PrecipitationSampleAbbreviation in RDA
LngLatPTEleSGSASPSC (kg·cm−2)BDFCSHC
Zonespoints(°)(°)(mm)(°C)(m)(°)(g·cm−3)(%)(mm·min−1)
Semiarid-350KP1109.839.9351.87.9150511SouthMiddle2.01.610.52.0
KP2109.939.6367.18.0125410SouthDownhill2.01.88.50.9
KP3110.237.5401.810.19275SouthHilltop1.61.322.51.1
KP4110.137.8407.29.89705SouthMiddle0.61.316.90.8
KP5110.337.6408.210.194132SouthUpper1.81.221.91.6
KP6110.337.5409.310.193528SouthUpper1.31.323.01.5
KP7110.539.0409.98.610685SouthHilltop1.21.423.81.1
Semiarid-410KP8110.438.8413.68.812595SouthHilltop1.91.524.20.6
KP9110.438.8416.08.812338NorthUpper1.01.425.31.4
KP10110.337.8417.69.8105330WestUpper1.51.320.61.0
KP11110.638.8420.38.711975SouthHilltop1.11.423.21.0
KP12110.738.8421.78.712335SouthHilltop1.61.519.41.2
KP13109.336.9465.810.2129322SouthUpper0.91.340.43.6
Semiarid-470KP14109.336.8472.810.113835SouthHilltop1.01.225.52.0
KP15109.936.8478.710.6107926SouthUpper1.11.327.20.9
KP16109.336.8479.110.212415SouthHilltop0.71.230.91.7
KP17109.436.7490.110.3129038SouthUpper0.51.024.42.6
RDA represents redundancy analysis; Lng represents longitude; Lat represents latitude; P represents annual mean precipitation; T represents annual mean temperature; Ele represents elevation above sea-level; SG represents slope gradient; SA represents slope aspect; SP represents slope position; SC represents soil compaction; BD represents bulk density; FC represents field capacity; SHC represents saturated hydraulic conductivity.
The spatially averaged SMC (SMCs) of each precipitation zone was calculated by Equation (2):
S M C s = 1 m i = 1 m S M C i
where m is the number of sampling points under each precipitation zone.
The soil water storage (SWS) of each precipitation zone was calculated by Equation (3):
SWS = 5000 × SMC × BD
where SMC is average soil moisture content and BD is bulk density.

2.4. Statistical Methods

The basic statistical parameters (mean, standard deviation, minimum, maximum, kurtosis, skewness, coefficient of variation) were calculated and reported for each layer (Table 3). One-way ANOVA and least significant difference (LSD) were used to assess the effect of precipitation regime on soil moisture. SPSS (version 18.0) was used for all of the statistical analysis.
Ordination techniques are based on either a linear response model or a unimodal response model. In this study, we employed detrended correspondence analysis (DCA) to determine whether the linear or unimodal model should be used. DCA is a multivariate statistical technique widely used by ecologists to find the main factors or gradients in large, species-rich but usually sparse data matrices [32]. If the largest value of the DCA gradient lengths is shorter than 3.0, soil moisture is best described by the linear method [33]. Table 2 shows all gradient lengths that were shorter than 3.0, and redundancy analysis (RDA) was then applied for identifying the environmental factors that best explained the C. korshinskii soil moisture variations [33]. RDA is an alternative to canonical correlation analysis, allowing the relationship between two tables of variables Y and X to be examined. In RDA, the components of X variables are extracted in such a way that they are as much as possible correlated with the variables of Y. Similarly, the components of Y are extracted so that they are as much as possible correlated with the components extracted from X. The SMC was divided into five depths (0–1 m, 1–2 m, 2–3 m, 3–4 m and 4–5 m), and then, the SMCd at each sampling point was calculated. Monte Carlo permutation test was first applied to reduce the number of unrelated environmental variables. Specifically, each environmental factor was used to reject those with relatively large p-values and small eigenvalues. Finally, eight environmental variables (longitude (Lng), latitude (Lat), average annual precipitation (P), average annual temperature (T), soil compaction (SC), bulk density (BD), field capacity (FC), and saturated hydraulic conductivity (SHC)), were selected for further RDA analysis. Lng and Lat can reveal the distribution characters of sampling points, while P and T represent meteorological factors. Four kinds of factors (SC, BD, FC, SHC) reflect soil properties. DCA and RDA were performed using the program CANOCO (version 4.5). The graphs were drawn using SigmaPlot for Windows (version 10.0) and Canodraw for windows (version 4.0).
Table 2. Length of gradient from the detrended correspondence analysis (DCA) and eigenvalues from the redundancy analysis (RDA).
Gradient Analysis Methods Axis 1Axis 2Axis 3Axis 4
DCALengths of gradient1.6 0.9 0.7 0.4
RDAEigenvalues0.8 0.0 0.0 0.0

3. Results

3.1. Summary Statistics

The summary statistics of soil moisture at various depths were provided in Table 3. The highest mean value (9.1%) and standard deviation (5.1%) were both observed at the 0.0–0.1 m depth. In general, the mean value of soil moisture showed a decreasing trend with depth. Specifically, soil moisture content decreased slightly at 0.0–2.0 m depth, and then it experienced a dramatic decrease at 2.0–4.4 m depth. The coefficient of variation, however, showed a different pattern where it initially increased with depth (i.e., 0.3–2.6 m) but then decreased below 2.6 m depth. Standard deviation was 5.1% at the surface soil, which indicated that soil moisture experienced a relatively high variability. Soil moisture for different soil depths was positively skewed, except at the depth of 4.8–5.0 m and the highest skewness value was observed at 4.0–4.2 m depth. Negative values of kurtosis occurred at most depths, and the lowest value occurred at the 0.0–0.1 m depth.
Table 3. Summary statistics of the soil moisture at various depths.
Depth (m)nMean (%)Std. Deviation (%)Minimum (%)Maximum (%)KurtosisSkewnessCoefficient of Variation
0.0–0.1179.15.13.417.5−1.40.60.6
0.1–0.2178.53.93.516.1−0.60.90.5
0.2–0.3178.93.83.616.1−0.60.70.4
0.3–0.4178.43.63.715.1−0.90.60.4
0.4–0.5178.64.03.715.9−0.70.70.5
0.5–0.6178.44.13.915.4−0.80.70.5
0.6–0.7178.54.14.016.2−0.70.80.5
0.7–0.8178.64.13.916.0−0.60.80.5
0.8–0.9178.44.03.815.9−0.60.80.5
0.9–1.0168.44.03.615.8−0.60.70.5
1.0–1.2168.64.23.816.9−0.60.70.5
1.2–1.4168.44.13.615.9−0.80.70.5
1.4–1.6168.24.23.615.9−0.90.60.5
1.6–1.8168.14.43.015.6−1.20.50.5
1.8–2.0168.14.83.016.6−0.80.80.6
2.0–2.2157.64.72.715.0−1.00.80.6
2.2–2.4157.34.62.717.0−0.11.10.6
2.4–2.6157.04.62.816.9−0.21.10.7
2.6–2.8156.64.22.915.1−0.21.20.6
2.8–3.0156.44.02.513.8−0.41.10.6
3.0–3.2156.23.52.713.70.21.20.6
3.2–3.4156.03.42.713.30.61.30.6
3.4–3.6155.93.42.813.11.01.40.6
3.6–3.8155.73.12.513.32.01.70.6
3.8–4.0155.22.62.712.34.02.10.5
4.0–4.2154.92.22.711.66.22.30.4
4.2–4.4154.71.63.09.13.81.80.3
4.4–4.6154.51.02.66.30.00.50.2
4.6–4.8154.61.02.86.3−0.20.20.2
4.8–5.0154.61.02.66.2−0.3-0.20.2

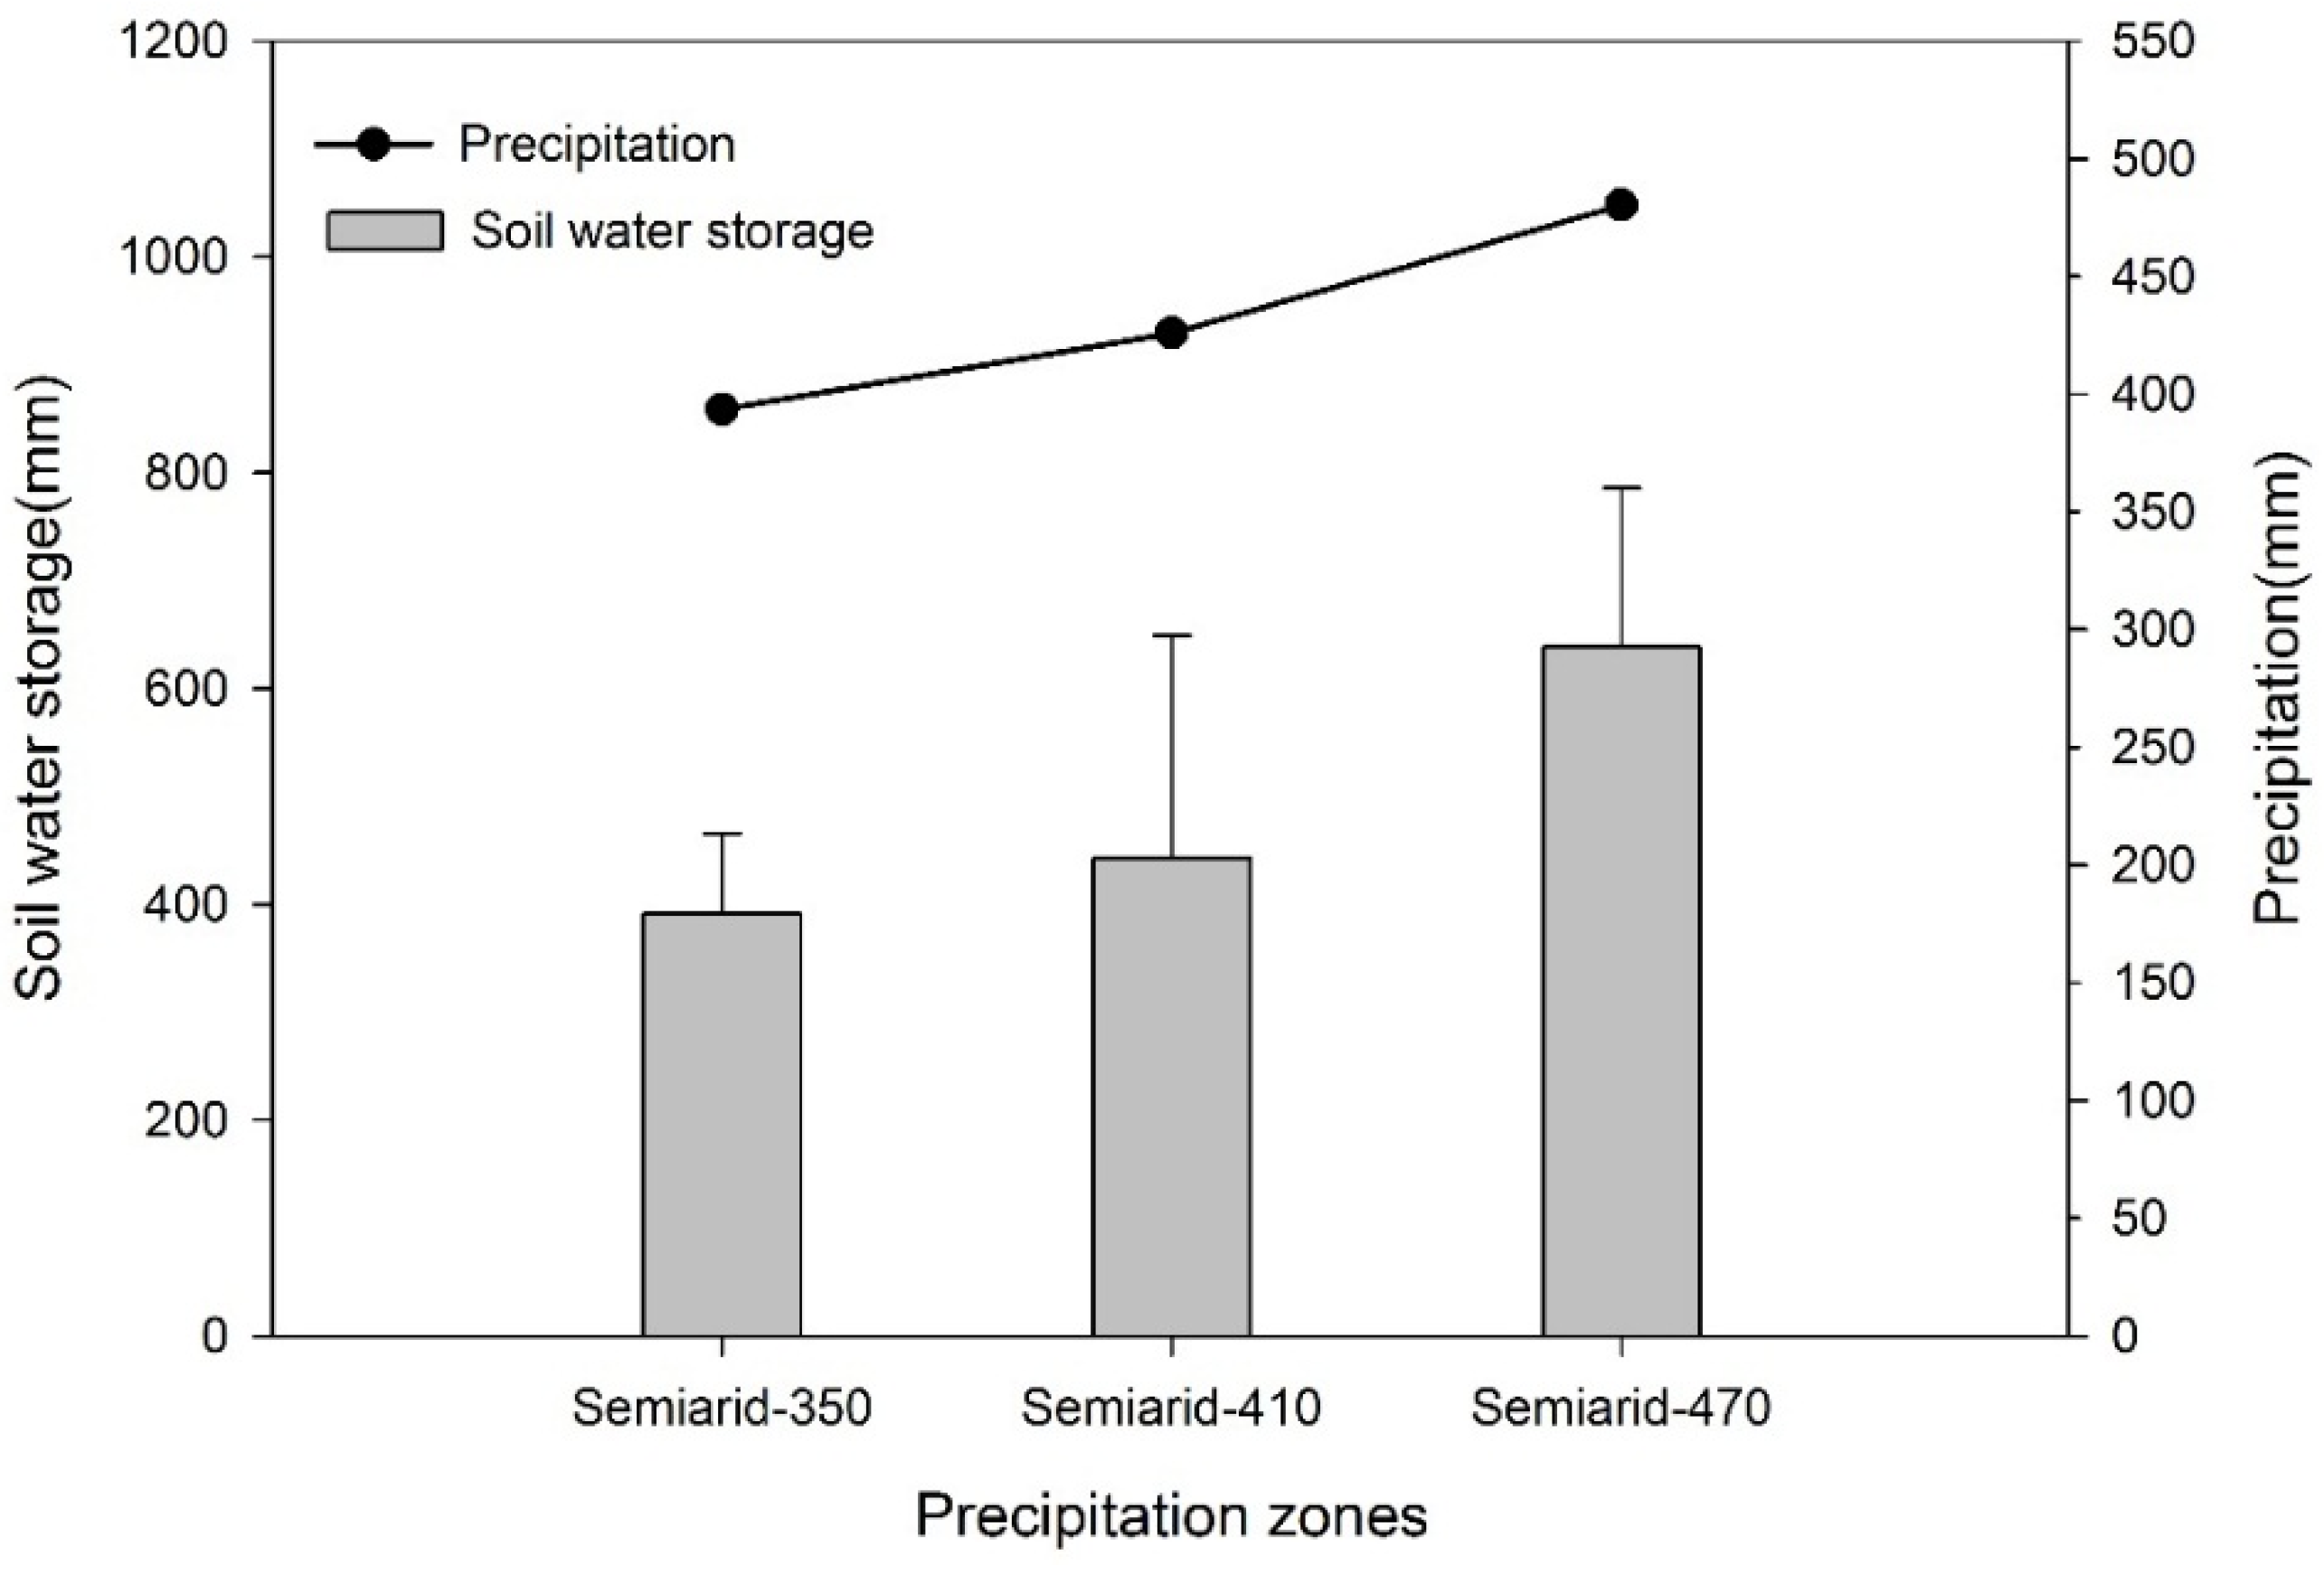
3.2. Variation of SWS under Different Precipitation Zones

Table 4 shows that SWS fits with a normal distribution according to a Kolmogorov-Smirnov test (K-S) under each precipitation zone. The degree of variation for the Semiarid-470 zone was the greatest (SD = 0.6), whereas the Semiarid-350 zone underwent relatively small changes (SD = 0.1). The SWS among precipitation zones increased following the increase in precipitation (Table 4 and Figure 3). Specifically, the SWS in the Semiarid-410 zone increased by 12% comparable with that in the Semiarid-350 zone. The SWS in the Semiarid-470 zone was 630.3, which means that the SWS gap between the Semiarid-470 zone and the Semiarid-410 zone was even greater.
Table 4. Summary statistics of soil water storage within profile under three different precipitation zones.
Precipitation ZonenMean (mm)SD (m)Minimum (mm)Maximum (mm)K-S
Semiarid-3507388.50.1296.5517.7N(0.8)
Semiarid-4106437.10.2282.5789.8N(0.8)
Semiarid-4704630.30.6427.7770.2N(1.0)
n represents the number of sampling points; SD represents standard deviation; N represents normal distribution (significance level is in parentheses).
Figure 3. Comparison of the depth averaged soil water storage (0–5 m) under different precipitation zones.
Forests 07 00031 g003

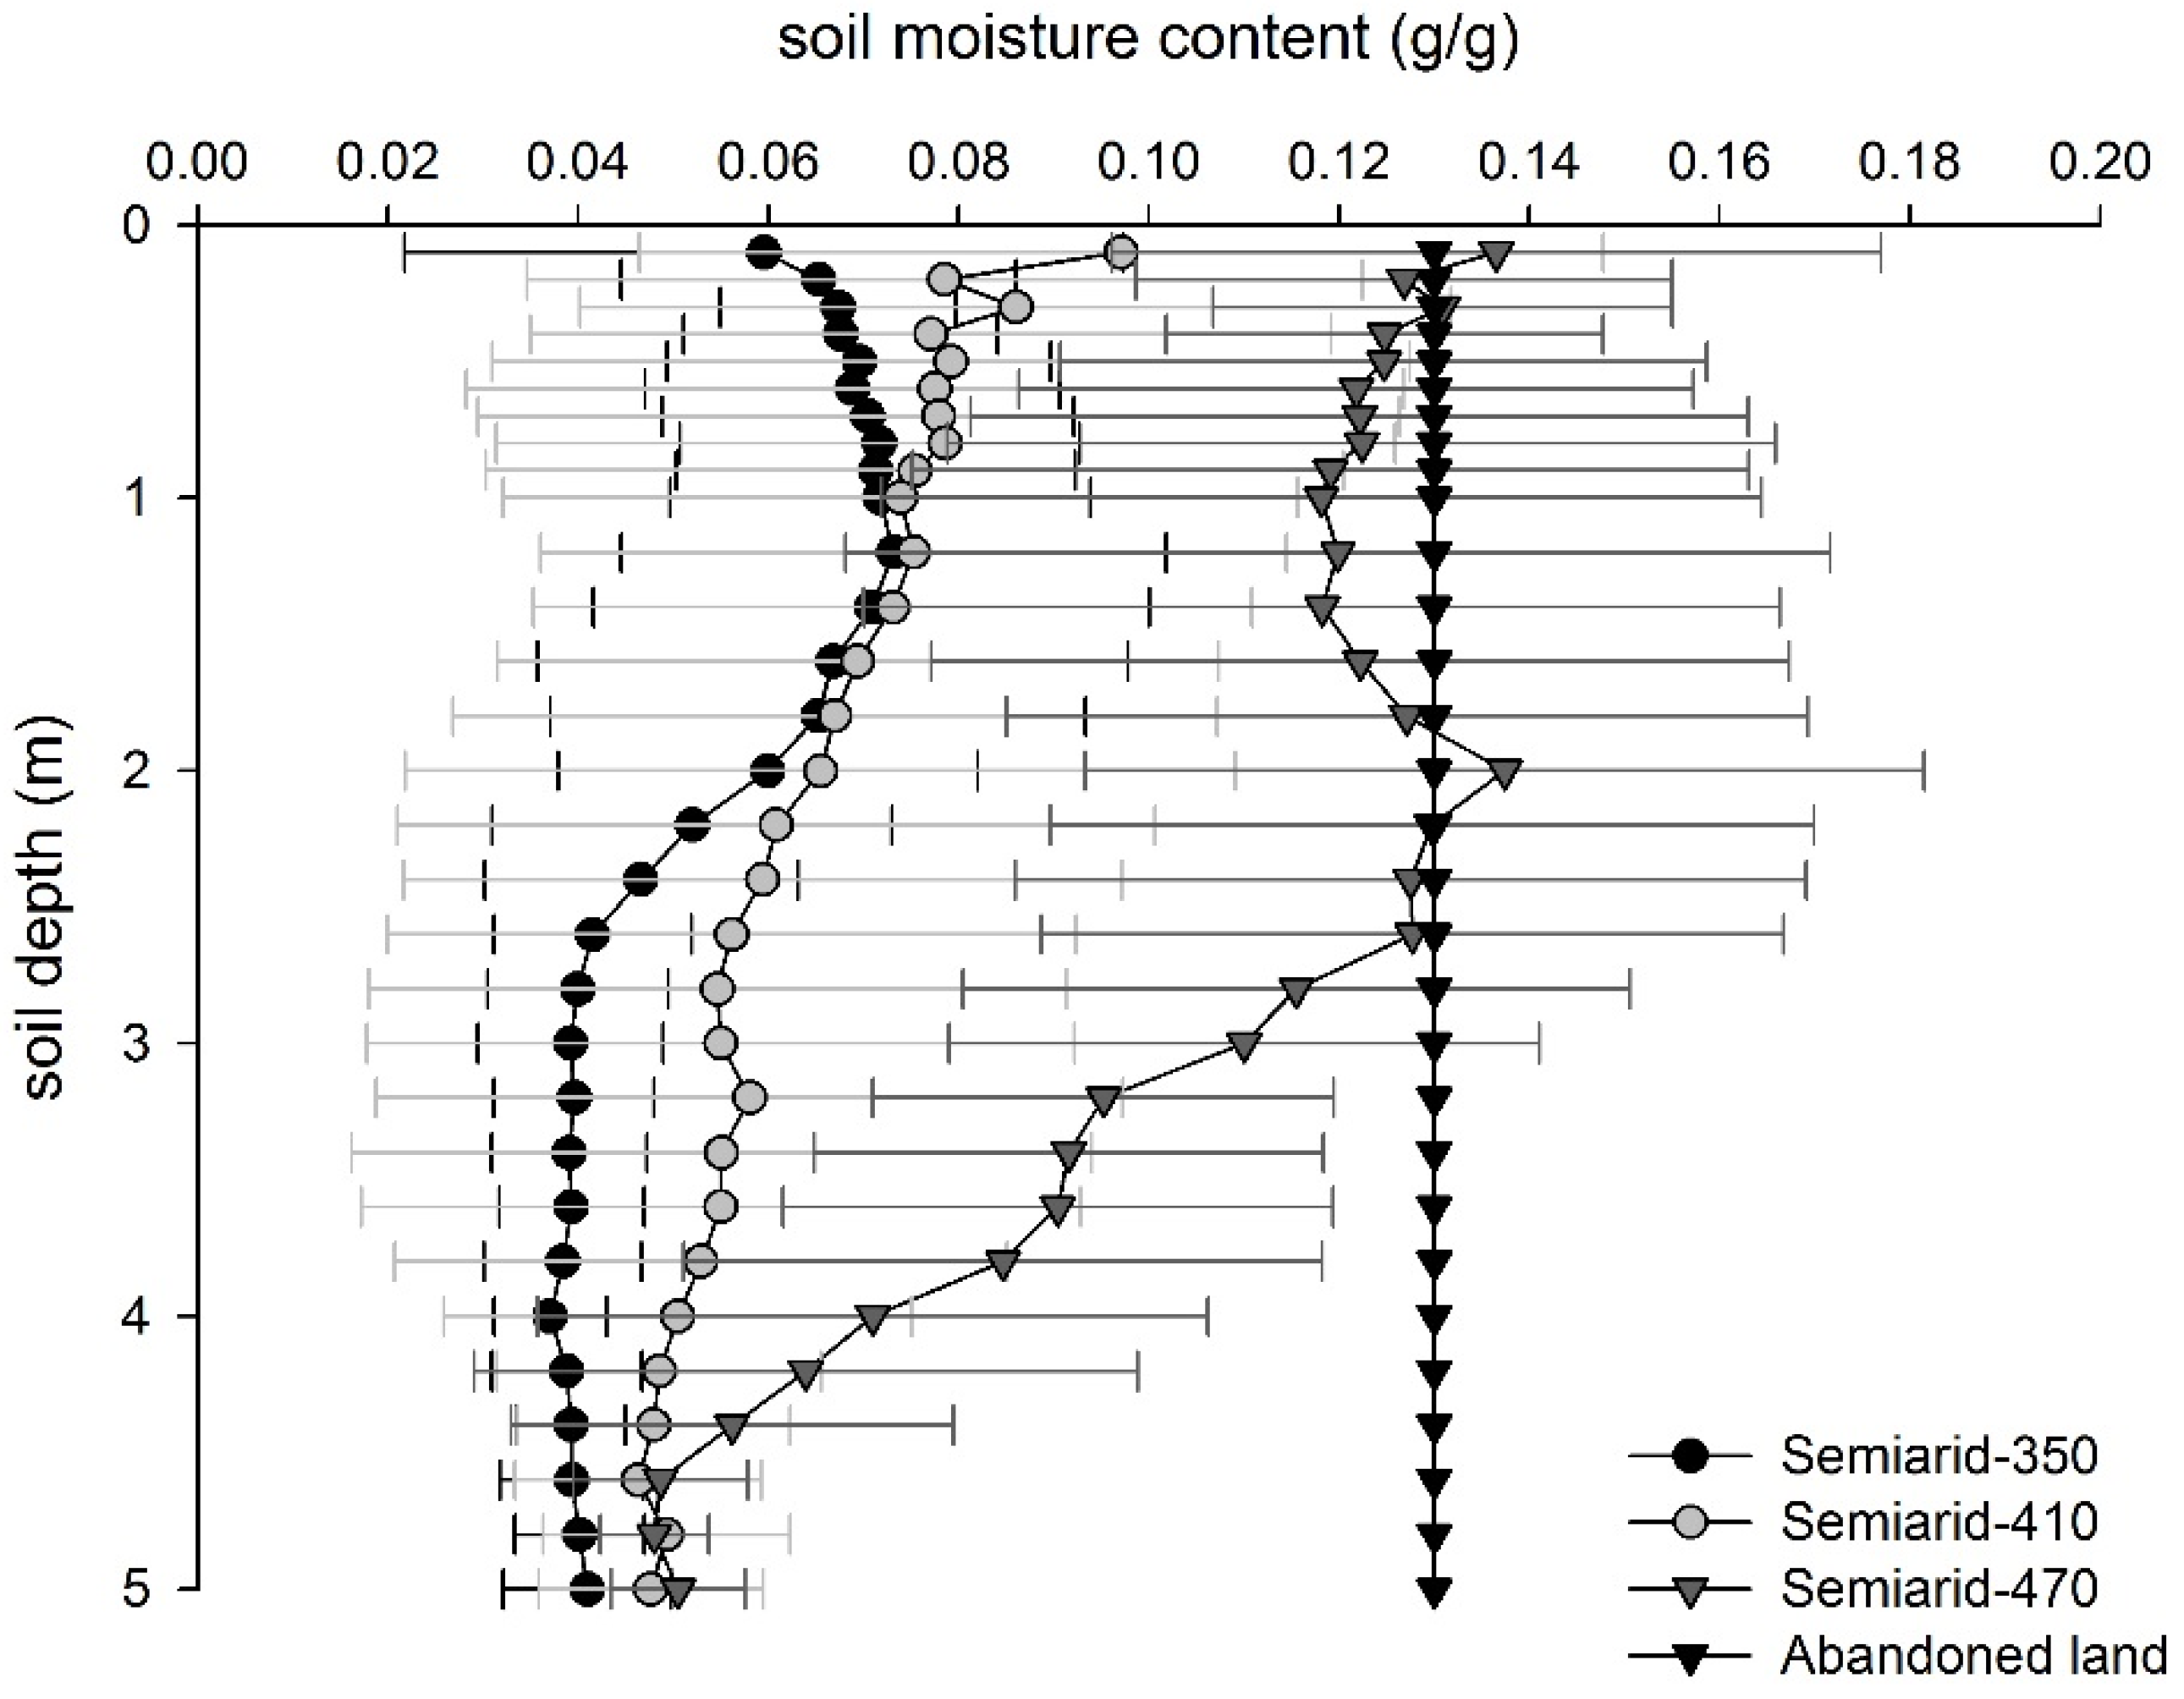
3.3. Variation of the Spatial-Averaged SMC under Different Precipitation Zones
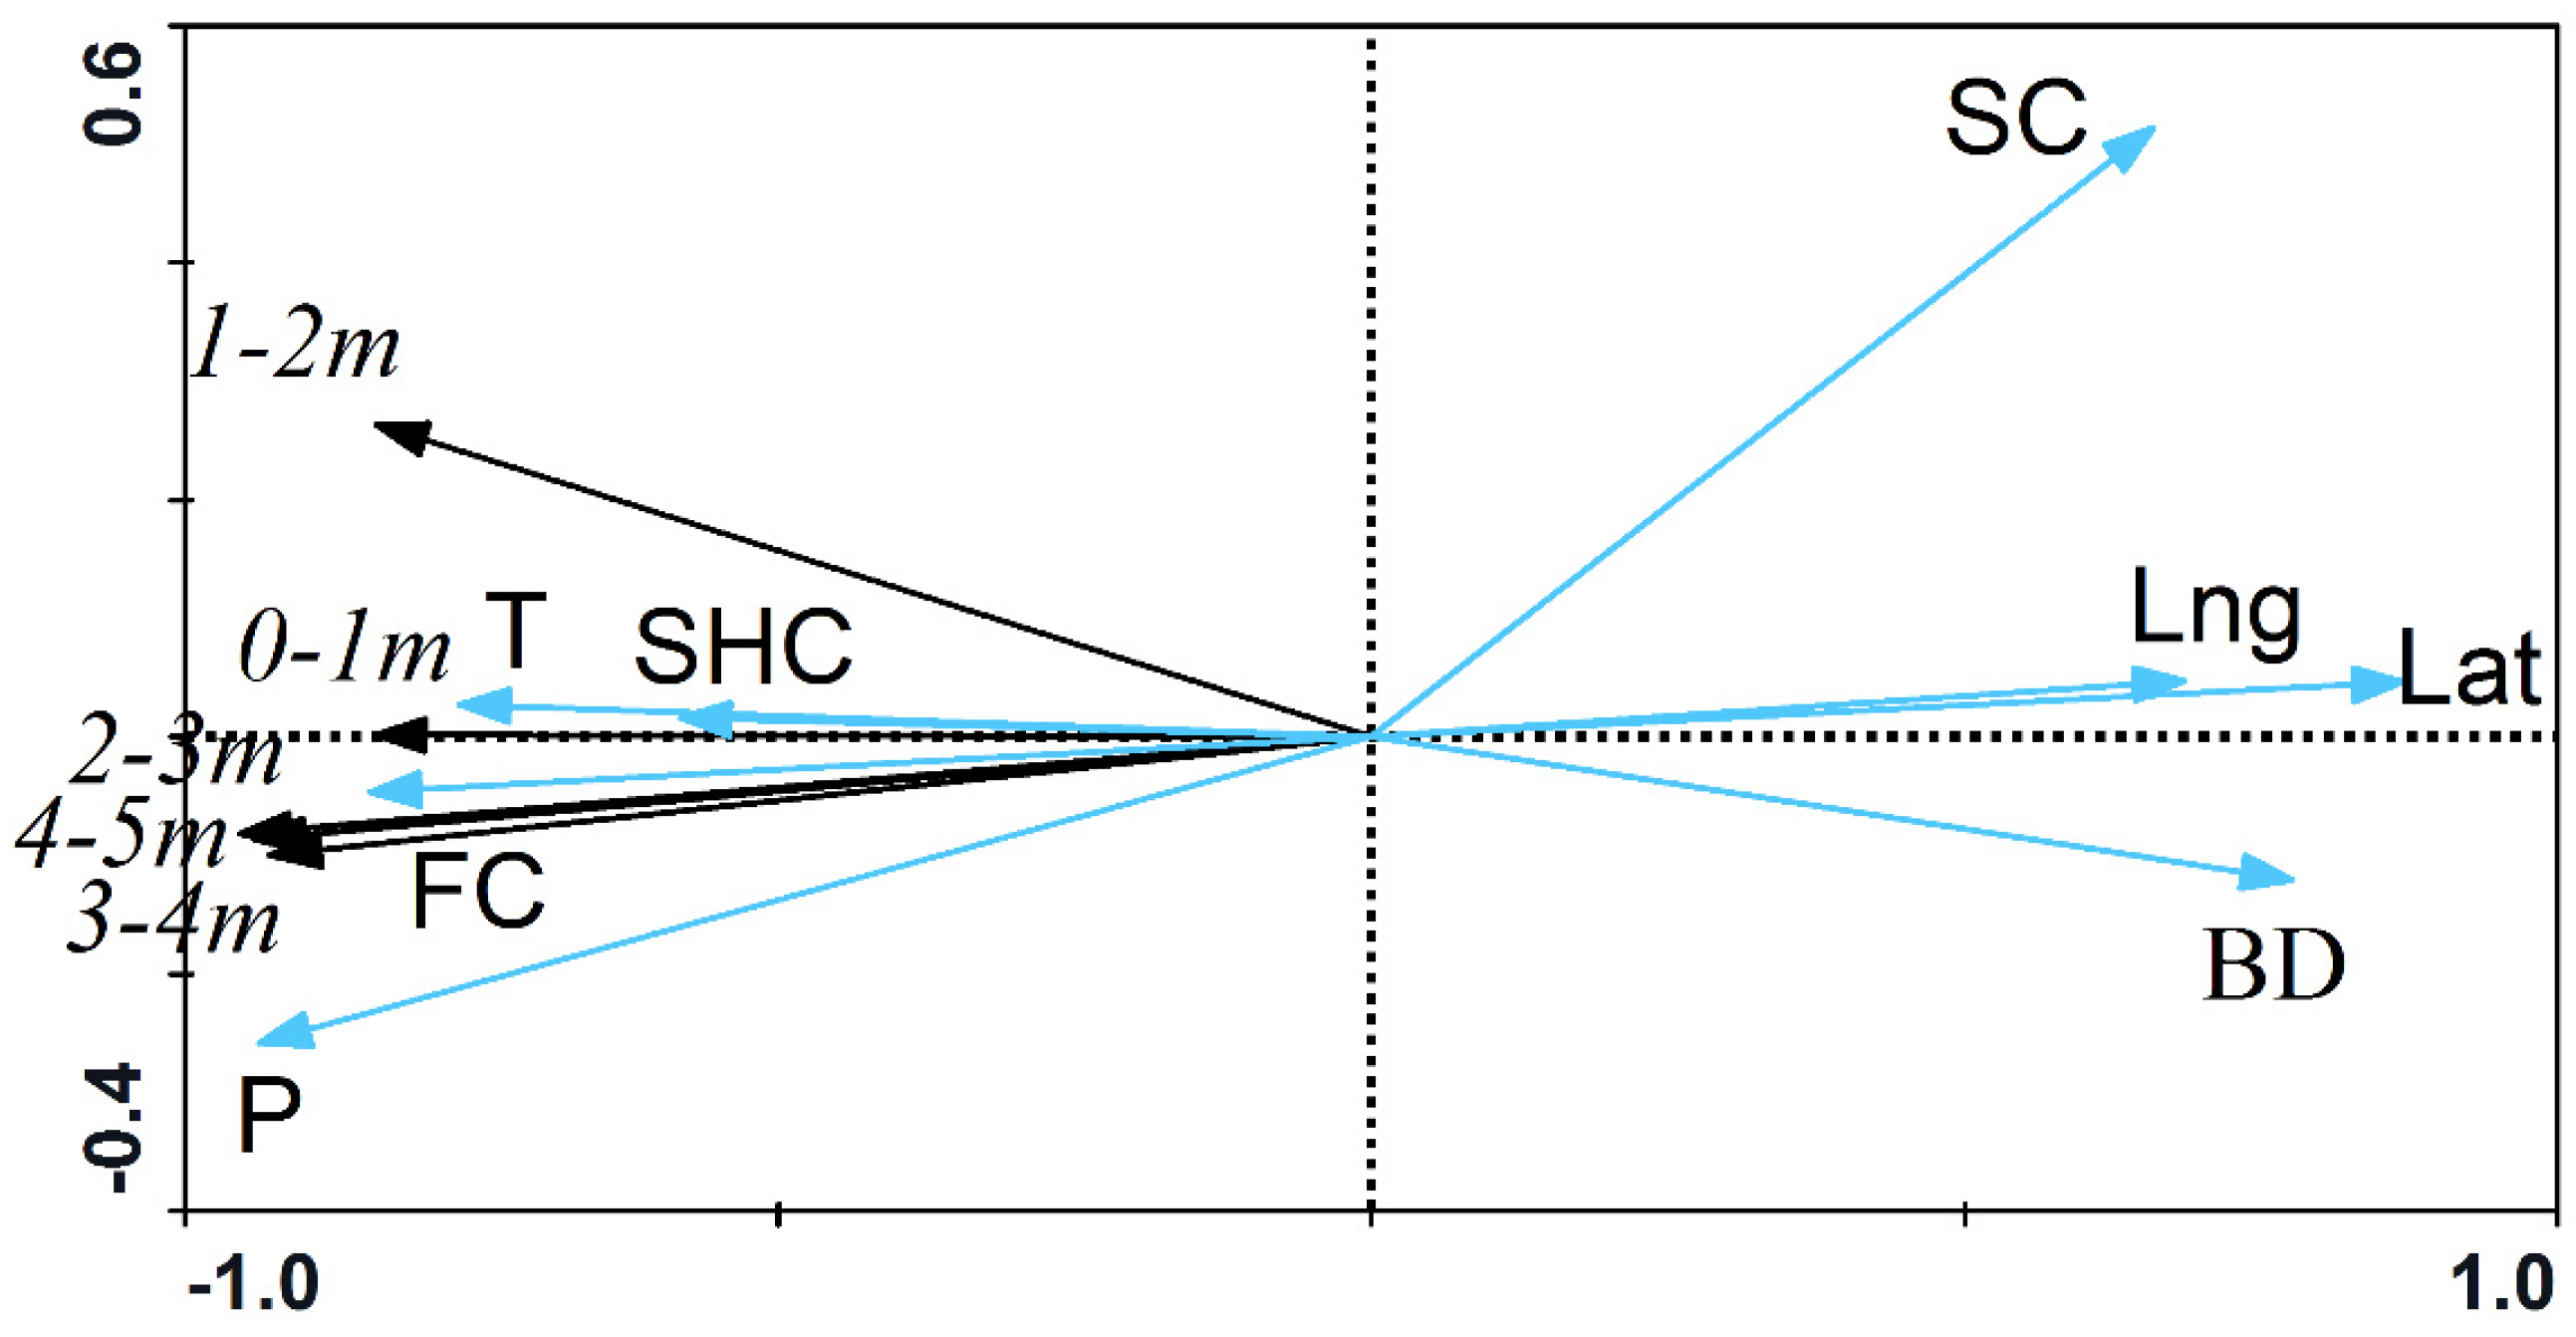
Figure 4 and one-way ANOVA showed that there were significant differences of SMCs among different precipitation zones. Vertical distribution of SMC was different among the three precipitation zones. Specifically, the SMC in the Semiarid-350 zone initially increased with soil depth, and then decreased until the 2.8-m depth where the SMC was relative stable. The SMC in the Semiarid-410 zone showed a decreasing trend from top layer to the 4.2-m layer and then reached stability. The SMC in the Semiarid-470 zone firstly decreased with soil depth, then increased and lastly decreased until 4.6-m layer, which showed a different vertical changing trend from the other two zones. Generally, the SMC under different precipitation zones within the 0–4.6 m profile was in the following order: Semiarid-470 > Semiarid-410 > Semiarid-350 (Figure 4), equating with the SWS shown in Figure 3. Figure 4 also showed the value of SMC in the three precipitation zones was smaller than that in abandoned land at most soil layers. Water deficit, calculated as the difference between control and treatment, occurred in all of the three precipitation zones. Greater surface water deficit, however, was observed in the area with lower rainfall (i.e., Semiarid-350 and Semiarid-410 zones), while deeper soil water deficit was more obvious in the Semiarid-470 zone, particularly from the 3-m layer onwards. The values of SMC at the deeper soil layer (i.e., 4.6–5 m) were almost identical between the three zones.
Figure 4. Comparison of the average SMC under different precipitation zones. Note: Semiarid-350 represents the spatially averaged soil moisture content in the 350–410 mm precipitation zone; Semiarid-410 represents the spatially averaged soil moisture content in the 410–470 mm precipitation zone; Semiarid-470 represents the spatially averaged soil moisture content in the 470–500 mm precipitation zone.
Forests 07 00031 g004

3.4. RDA Ordination

Table 2 shows that the two main axes had eigenvalues > 0.01 and accounted for 82% of the total variance. Axis 1 was the most essential, explaining 82% of the total variance with average annual precipitation, latitude, field capacity, and bulk density as the greatest contributors. Table 5 and Figure 5 show that RDA ordination well described the relationship between the soil moisture spatial pattern and the environmental factors. Axis 1 was positively correlated with Lng, Lat, SC, and BD, but negatively correlated with P, T, FC, and SHC. Axis 2 was negatively correlated with P, BD, and FC, but positively correlated with the other environmental variables. A Monte Carlo permutation test for the significance of influence indicated that P exerted the greatest effect on soil moisture variation (p = 0.002, F = 38.55). The canonical coefficients of SHC and Lng were relatively small (Table 5), indicating weak correlations with soil moisture variation. Specifically, the soil moisture content of C. korshinskii increased with precipitation, temperature, field capacity, and saturated hydraulic conductivity but decreased with soil capacity, longitude, latitude, and bulk density.
Table 5. Canonical coefficients of the environmental factors with the first two axes of redundancy analysis (RDA).
Environmental VariablesAxis 1Axis 2
Lng0.60.0
Lat0.80.0
P−0.9−0.2
T−0.70.0
SC0.60.4
BD0.7−0.1
FC−0.8−0.0
SHC−0.50.0
Figure 5. Redundancy analysis ordination biplot showing the relationship between soil moisture content and environmental factors. Note: 0–1 m represents the average soil moisture content in the 0–1 m layers; 1–2 m represents the average soil moisture content in the 1–2 m layers; 2–3 m represents the average soil moisture content in the 2–3 m layers; 3–4 m represents the average soil moisture content in the 3–4 m layers; 4–5 m represents the average soil moisture content in the 4–5 m layers.
Forests 07 00031 g005

4. Discussion

4.1. Spatial Variation of SMC and Relationships between Precipitation, SMC and Vegetation

While the highest soil moisture value of C. korshinskii was found in the surface layers, greater coefficients of variation were also observed in these layers (Table 3), similar to several other studies [34,35]. Large variations in SMC occurred on the surface as it was exposed to greater changes in the precipitation, temperature, and aeration [36]. Smaller variation range was found in deeper soils (Table 3) because of the scarcity of precipitation in the semiarid Loess Plateau, limiting rainfall infiltration replenishment only to the shallow soil horizon. The SMC in the semiarid Loess Plateau decreased from the surface soil layer to the deep layer (Table 3), which means that soil became drier with depth.
The SWS and SMC among precipitation zones increased following the increase in precipitation, but there was no linear relationship between SMC and precipitation (Table 4, Figure 3 and Figure 4). We found that there were changes in SMC in the deeper layer such as those from the 2 m layer to the 4.6 m layer in the Semiarid-470 zone (Figure 4). We suggested that other factors than precipitation such as root water uptake might generate such changes. Previous studies indicated that C. korshinskii aged over 20 years has deep rooting systems (more than 5 m) [37], enabling them to consume moisture from deep soil layers, below the rainfall infiltration depth [24]. Greater water loss was even observed during growing seasons where water consumption under C. korshinskii and some other introduced vegetation types exceeded precipitation in those months [38]. These findings were consistent with our results where SMC underneath C. korshinskii was reduced compared with the abandoned land (Figure 4). In this study, the degree of soil desiccation in the 0.0–4.6 m layer followed the order: Semiarid-350 > Semiarid-410 > Semiarid-470. However, the SMC in the 4.6–5.0 m layer remained stable, and the values of SMC were relatively small and almost identical between the three zones (Figure 4). This indicated severe soil desiccation was widespread in the semiarid Loess Plateau. This condition may lead to the formation of a dried soil layer (DSL), a condition where SMC in the soil is lower than the stable field capacity [18,19,39]. DSL usually occurred if soil moisture could not be recharged over a prolonged period of water shortage, causing a severe soil moisture deficit.
DSL is a common phenomenon found in the Loess Plateau [40,41] as a result of imbalanced plant–soil–atmosphere interactions [42]. DSL can prevent the vertical exchange of soil water between upper and lower soil layers, and further negatively affects the water cycle at both local and regional scales [29]. Studies have suggested that DSLs were worsened in areas covered by shrubs compared to areas covered by grasses because of the higher evapotranspiration rate of the former [43]. In C. korshinskii lands with heavy DSL, secondary seedling has been difficult to find and natural renewal was almost impossible [24]. Our results therefore suggested that more attention should be paid to the planning and management of introduced vegetation growth in semiarid regions. The planting densities should take into account the water resources and the effects plant growth will have on them [18,44]. In semiarid regions, the densities of shrub should be controlled to about 4950–6600 plants/hm2 [45]. When the re-introduced shrub matures, the density should be further reduced according to soil water conditions [24]. Previous studies showed that 2490 plants/hm2 was an optimum density for mature C. korshinskii in sandy land of Yanchi [46].

4.2. The Effects of Environmental Factors on the SMC

While our results suggested that vegetation had a significant effect on the SMC (Figure 4), other factors such as precipitation, latitude, and soil characteristics (field capacity and bulk density) also contributed to the variability (Figure 5). Average annual precipitation, field capacity, average annual temperature, and saturated hydraulic conductivity displayed positive correlations with soil moisture, whereas other factors (soil capacity, longitude, latitude, and bulk density) showed negative correlations. Average annual precipitation was the most significant factor affecting soil moisture, consistent with previous studies [47]. Since we used rainfall gradient across different latitudes, it is unsurprising that latitude played a significant role in determining soil moisture.
Although precipitation was the most significant factor affecting soil moisture under C. korshinskii, other environmental factors had different effects on different layers. Even on the surface soils (0–1 m), SMC was influenced by various factors other than precipitation (i.e., P, Lat, FC, BD, T) (Table 5), indicated by the overlapping soil moisture in 0–1 m layer and Axis 1 (Figure 5). These results were similar to another study in the Pernambuco semiarid region that also proved that soil properties had significant effects on soil moisture variability [48]. Bulk density most significantly affected SMC in the 1–2 m layer compared to the other soil layers, while field capacity had more effect on soil moisture of deep layers (2–5 m) than the 1–2 m layer.

4.3. Implications on Vegetation Restoration under Climate Change

The implementation of the “Grain to Green Program” is challenging since success depends on the water consumption characteristics and local soil moisture conditions. Yet, we found that vegetation restoration using C. korshinskii did not always correspond with improved soil conditions. Although it has successfully decreased soil erosion [49,50], the introduced vegetation including C. korshinskii consumed more soil moisture in the deep layers, decreasing potential water yield and changing the spatial pattern of soil moisture. Our study thus confirmed other finding which indicated that vegetation restoration might result in soil desiccation in the Loess Plateau [29]. Understanding the driving mechanism of soil moisture deficit is therefore one of the most important factors to be considered for vegetation restoration and sustainable development in the Loess Plateau [51].
Studies have indicated that drought has occurred more frequently in recent years, causing more damage to the degraded semiarid areas [24]. Although C. korshinskii has good economic benefits and high drought tolerance [23], it also consumed a large amount of water. As precipitation was found to decrease annually by an average of 0.97 mm [2], planting C. korshinskii in large quantities for restoration purposes is questionable as it might worsen the already dry conditions. While soil moisture profiles differed across different precipitation zones (Table 4 and Figure 4), they became identical at deep soil layers (4.6–5.0 m) under C. korshinskii compared to control (abandoned land). So far, there have been no guidelines on plant species’ selection and their corresponding density for restoration purposes under climate change. High planting density over years of planting, however, is not recommended as it could lead to DSL [38]. Instead of planting water-consuming shrubs, planting xerophytes and mesophytes would be more suitable in the regions with annual rainfall less than 400 mm. In the regions with annual rainfall of 400–500 mm, shrub was preferable but intermediate cuttings and density adjustment should be carried out in time during the luxuriant growing period [24]. For future research, the interaction between vegetation, SMC, and climate change should be further detailed to identify the appropriate planting density for specific areas without jeopardizing soil water resources.

5. Conclusions

In this study, we found that precipitation was the key factor dominating the spatial variations in soil moisture under C. korshinskii shrubs, particularly in the top 5 m of the soils. The highest soil moisture value was found at the surface layers (0–0.1 m), but with a large coefficient of variation. Although soil water storage increased with precipitation, the degree of SMC variation varied with different precipitation zones. The SMC became relatively stable at the 2.8 m layer, 4.2 m layer, and 4.6 m layer for Semiarid-350, Semiarid-410, and Semiarid-470, respectively. Water deficit occurred in all three precipitation zones, especially in the Semiarid-350 and Semiarid-410 due to the introduced vegetation species (i.e., C. korshinskii).
Using redundancy analysis to clarify the controlling factors of soil moisture, it was shown that the soil moisture content increased with precipitation, temperature, field capacity, and saturated hydraulic conductivity but decreased with soil capacity, longitude, latitude, and bulk density. Among those variables, precipitation is the determining factor of soil moisture conditions in semiarid regions, followed by latitude, field capacity, and bulk density. Considering the relationships between precipitation, SMC and vegetation, appropriate planting density and species selection should be taken into account for introduced vegetation management. In the semiarid Loess Plateau, planting density should be adjusted according to different growth stages.

Acknowledgments

This study was supported by the National Natural Science Foundation of China (No. 41390462) and the Program for Changjiang Scholars and Innovative Research Team in University (No. IRT_15R06).

Author Contributions

Yuanxin Liu and Wenwu Zhao designed the research; Yuanxin Liu, Xiao Zhang and Xuening Fang performed the field works; Lixin Wang supervised the research; Yuanxin Liu analyzed the data; Yuanxin Liu, Wenwu Zhao and Lixin Wang wrote the paper; Stefani Daryanto edited and contributed to the paper writing.

Conflicts of Interest

The authors declare no conflict of interest.

References

  1. Lü, Y.H.; Ma, Z.M.; Zhang, L.W.; Fu, B.J.; Gao, G.Y. Redlines for the greening of China. Environ. Sci. Policy 2013, 33, 346–353. [Google Scholar] [CrossRef]
  2. Lü, Y.H.; Fu, B.J.; Feng, X.M.; Zeng, Y.; Liu, Y.; Chang, R.Y.; Sun, G.; Wu, B.F. A policy-driven large scale ecological restoration: Quantifying ecosystem services changes in the loess plateau of China. PLoS ONE 2012, 7, e31782. [Google Scholar] [CrossRef] [PubMed]
  3. Feng, X.; Fu, B.; Lu, N.; Zeng, Y.; Wu, B. How ecological restoration alters ecosystem services: An analysis of carbon sequestration in China's loess plateau. Sci. Rep. 2013, 3, 2846. [Google Scholar] [CrossRef] [PubMed]
  4. Wang, Y.; Shao, M.A.; Zhang, C.; Han, X.; Mao, T.; Jia, X. Choosing an optimal land-use pattern for restoring eco-environments in a semiarid region of the Chinese loess plateau. Ecol. Eng. 2015, 74, 213–222. [Google Scholar] [CrossRef]
  5. Chen, Y.; Wang, K.; Lin, Y.; Shi, W.; Song, Y.; He, X. Balancing green and grain trade. Nat. Geosci. 2015, 8, 739–741. [Google Scholar] [CrossRef]
  6. Yang, L.; Chen, L.; Wei, W.; Yu, Y.; Zhang, H. Comparison of deep soil moisture in two re-vegetation watersheds in semi-arid regions. J. Hydrol. 2014, 513, 314–321. [Google Scholar] [CrossRef]
  7. Ferreira, J.N.; Bustamante, M.; Garcia-Montiel, D.C.; Caylor, K.K.; Davidson, E.A. Spatial variation in vegetation structure coupled to plant available water determined by two-dimensional soil resistivity profiling in a Brazilian savanna. Oecologia 2007, 153, 417–430. [Google Scholar] [CrossRef] [PubMed]
  8. Yao, X.L.; Fu, B.J.; Lü, Y.H.; Chang, R.Y.; Wang, S.; Wang, Y.F.; Su, C.H. The multi-scale spatial variance of soil moisture in the semi-arid loess plateau of China. J. Soils Sediments 2012, 12, 694–703. [Google Scholar] [CrossRef]
  9. Fu, B.J.; Wang, J.; Chen, L.D.; Qiu, Y. The effects of land use on soil moisture variation in the danangou catchment of the loess plateau, China. Catena 2003, 54, 197–213. [Google Scholar] [CrossRef]
  10. Montenegro, S.; Ragab, R. Impact of possible climate and land use changes in the semi arid regions: A case study from north eastern brazil. J. Hydrol. 2012, 434–435, 55–68. [Google Scholar] [CrossRef]
  11. Yang, L.; Wei, W.; Chen, L.D.; Mo, B.R. Response of deep soil moisture to land use and afforestation in the semi-arid loess plateau, China. J. Hydrol. 2012, 475, 111–122. [Google Scholar] [CrossRef]
  12. Gao, X.; Wu, P.; Zhao, X.; Wang, J.; Shi, Y.; Zhang, B.; Tian, L.; Li, H. Estimation of spatial soil moisture averages in a large gully of the loess plateau of China through statistical and modeling solutions. J. Hydrol. 2013, 486, 466–478. [Google Scholar] [CrossRef]
  13. Zhao, J.; Yan, X.; Guo, J.; Jia, G. Evaluating spatial-temporal dynamics of net primary productivity of different forest types in northeastern China based on improved forcchn. PLoS ONE 2012, 7, e48131. [Google Scholar] [CrossRef] [PubMed]
  14. Burt, T.P.; Butcher, D.P. Topographic controls of soil moisture distributions. J. Soil Sci. 1985, 36, 469–486. [Google Scholar] [CrossRef]
  15. Shi, Y.G.; Wu, P.T.; Zhao, X.N.; Li, H.C.; Wang, J.W.; Zhang, B.Q. Statistical analyses and controls of root-zone soil moisture in a large gully of the loess plateau. Environ. Earth Sci. 2013, 71, 4801–4809. [Google Scholar] [CrossRef]
  16. Hawley, M.E.; Jackson, T.J.; McCuen, R.H. Surface soil-moisture variation on small agricultural watersheds. J. Hydrol. 1983, 62, 179–200. [Google Scholar] [CrossRef]
  17. Ramos, M.C.; Mulligan, M. Spatial modelling of the impact of climate variability on the annual soil moisture regime in a mechanized mediterranean vineyard. J. Hydrol. 2005, 306, 287–301. [Google Scholar] [CrossRef]
  18. Wang, Y.Q.; Shao, M.A.; Shao, H.B. A preliminary investigation of the dynamic characteristics of dried soil layers on the loess plateau of China. J. Hydrol. 2010, 381, 9–17. [Google Scholar] [CrossRef]
  19. Wang, Y.Q.; Shao, M.A.; Liu, Z.P. Large-scale spatial variability of dried soil layers and related factors across the entire loess plateau of China. Geoderma 2010, 159, 99–108. [Google Scholar] [CrossRef]
  20. Daryanto, S.; Eldridge, D.J.; Wang, L. Spatial patterns of infiltration vary with disturbance in a shrub-encroached woodland. Geomorphology 2013, 194, 57–64. [Google Scholar] [CrossRef] [Green Version]
  21. He, X.L.; Zhao, L.L.; Yang, H.Y. Diversity and spatial distribution of arbuscular mycorrhizal fungi of caragana korshinskii in the loess plateau. Acta Ecol. Sin. 2006, 26, 3835–3840. [Google Scholar]
  22. Yang, X.M. Study on the characteristics of water environment in shrubbery of loess plateau. Arid Zone Res. 2001, 18, 8–13. [Google Scholar]
  23. Cheng, X.; Huang, M.; Shao, M.; Warrington, D.N. A comparison of fine root distribution and water consumption of mature caragana korshinkii kom grown in two soils in a semiarid region, China. Plant Soil 2008, 315, 149–161. [Google Scholar] [CrossRef]
  24. Chen, H.S.; Shao, M.A.; Li, Y.Y. Soil desiccation in the loess plateau of China. Geoderma 2008, 143, 91–100. [Google Scholar] [CrossRef]
  25. Tasumi, M.; Kimura, R. Estimation of volumetric soil water content over the liudaogou river basin of the loess plateau using the swest method with spatial and temporal variability. Agric. Water Manag. 2013, 118, 22–28. [Google Scholar] [CrossRef]
  26. Zhao, W.W.; Fu, B.J.; Qiu, Y. An upscaling method for cover-management factor and its application in the loess plateau of China. Int. J. Environ. Res. Public Health 2013, 10, 4752–4766. [Google Scholar] [CrossRef] [PubMed]
  27. Kimura, R.; Kamichika, M.; Takayama, N.; Matsuoka, N.; Zhang, X. Heat balance and soil moisture in the loess plateau, China. J. Agric. Meteorol. 2004, 60, 103–113. [Google Scholar] [CrossRef]
  28. Zhao, W.W.; Fu, B.J.; Chen, L.D. A comparison between soil loss evaluation index and the c-factor of rusle: A case study in the loess plateau of China. Hydrol. Earth Syst. Sci. 2012, 16, 2739–2748. [Google Scholar] [CrossRef]
  29. Wang, Y.Q.; Shao, M.A.; Zhu, Y.J.; Liu, Z.P. Impacts of land use and plant characteristics on dried soil layers in different climatic regions on the loess plateau of China. Agric. For. Meteorol. 2011, 151, 437–448. [Google Scholar] [CrossRef]
  30. Dobriyal, P.; Qureshi, A.; Badola, R.; Hussain, S.A. A review of the methods available for estimating soil moisture and its implications for water resource management. J. Hydrol. 2012, 458–459, 110–117. [Google Scholar] [CrossRef]
  31. Li, W.; Wang, Q.J.; Wei, S.P.; Shao, M.A.; Yi, L. Soil desiccation for loess soils on natural and regrown areas. For. Ecol. Manag. 2008, 255, 2467–2477. [Google Scholar]
  32. Hill, M.O.; Gauch, H.G. Detrended correspondence analysis: An improved ordination technique. Vegetatio 1980, 42, 47–58. [Google Scholar] [CrossRef]
  33. Zhu, H.D.; Shi, Z.H.; Fang, N.F.; Wu, G.L.; Guo, Z.L.; Zhang, Y. Soil moisture response to environmental factors following precipitation events in a small catchment. Catena 2014, 120, 73–80. [Google Scholar] [CrossRef]
  34. Penna, D.; Borga, M.; Norbiato, D.; Fontana, G.D. Hillslope scale soil moisture variability in a steep alpine terrain. J. Hydrol. 2009, 364, 311–327. [Google Scholar] [CrossRef]
  35. Hu, W.; Shao, M.A.; Han, F.P.; Reichardt, K. Spatio-temporal variability behavior of land surface soil water content in shrub- and grass-land. Geoderma 2011, 162, 260–272. [Google Scholar] [CrossRef]
  36. Gao, X.D.; Wu, P.T.; Zhao, X.N.; Shi, Y.G.; Wang, J.W.; Zhang, B.Q. Soil moisture variability along transects over a well-developed gully in the loess plateau, China. Catena 2011, 87, 357–367. [Google Scholar] [CrossRef]
  37. Wang, Z.Q.; Liu, B.Y.; Liu, G.; Zhang, Y.X. Soil water depletion depth by planted vegetation on the loess plateau. Sci. China Ser. D Earth Sci. 2009, 52, 835–842. [Google Scholar] [CrossRef]
  38. Jian, S.; Zhao, C.; Fang, S.; Yu, K. Effects of different vegetation restoration on soil water storage and water balance in the Chinese loess plateau. Agric. For. Meteorol. 2015, 206, 85–96. [Google Scholar] [CrossRef]
  39. Wang, Y.Q.; Shao, M.A.; Liu, Z.P.; Zhang, C.C. Characteristics of dried soil layers under apple orchards of different ages and their applications in soil water managements on the loess plateau of China. Pedosphere 2015, 25, 546–554. [Google Scholar] [CrossRef]
  40. Li, Y.S. The properties of water cycle in soil and their effect on water cycle for land in the loess plateau. Acta Ecol. Sinica 1983, 3, 91–101. [Google Scholar]
  41. Hou, Q.C.; Han, R.L.; Li, H.P. On problems of vegetation reconstruction in Yan'an experimental area: III significance of native trees in plantation. Res. Soil Water Conserv. 2000, 7, 119–123. [Google Scholar]
  42. Yan, W.M.; Deng, L.; Zhong, Y.Q.W.; Shangguan, Z.P. The characters of dry soil layer on the loess plateau in China and their influencing factors. PLoS ONE 2015, 10, e0134902. [Google Scholar] [CrossRef] [PubMed]
  43. Shangguan, Z.P. Soil desiccation occurrence and its impact on forest vegetation in the loess plateau of China. Int. J. Sustain. Dev. World Ecol. 2007, 14, 299–306. [Google Scholar] [CrossRef]
  44. Mendham, D.S.; White, D.A.; Battaglia, M.; McGrath, J.F.; Short, T.M.; Ogden, G.N.; Kinal, J. Soil water depletion and replenishment during first- and early second-rotation eucalyptus globulus plantations with deep soil profiles. Agric. For. Meteorol. 2011, 151, 1568–1579. [Google Scholar] [CrossRef]
  45. Yang, W.Z.; Shao, M.A. Study on Soil Water on the Loess Plateau of China; Science Press: Beijing, China, 2000. [Google Scholar]
  46. Shu, W.H.; Jiang, Q.; Wang, Z.J.; He, J.L. The temporal and spatial changes of soil moisture in different density of caragana korshinskii in sandy land of Yanchi, Ningxia. J. Arid Land Resour. Environ. 2012, 26, 172–176. [Google Scholar]
  47. He, Q.H.; He, Y.H.; Bao, W.K. Research on dynamics of soil moisture in arid and semiarid mountainous areas. J. Mt. Sci. 2003, 21, 149–156. [Google Scholar]
  48. Dos Santos, T.E.M.; Montenegro, A.A.A.; Silva, D.D. Soil moisture in pernambuco semiarid using time domain reflectometry (tdr). Revista Brasileira de Engenharia Agricola e Ambiental 2011, 15, 670–679. [Google Scholar]
  49. Chen, L.D.; Wang, J.P.; Wei, W.; Fu, B.J.; Wu, D.P. Effects of landscape restoration on soil water storage and water use in the loess plateau region, China. For. Ecol. Manag. 2010, 259, 1291–1298. [Google Scholar] [CrossRef]
  50. Lü, Y.H.; Feng, X.M.; Chen, L.D.; Fu, B.J. Scaling effects of landscape metrics: A comparison of two methods. Phys. Goegr. 2013, 34, 4–49. [Google Scholar]
  51. Lü, Y.H.; Fu, B.J.; Wei, W.; Yu, X.B.; Sun, R.H. Major ecosystems in China: Dynamics and challenges for sustainable management. Environ. Manag. 2011, 48, 13. [Google Scholar] [CrossRef] [PubMed]

