Article

Carbon Sequestration and Sedimentation in Mangrove Swamps Influenced by Hydrogeomorphic Conditions and Urbanization in Southwest Florida

Everglades Wetland Research Park and Department of Marine and Ecological Sciences, Florida Gulf Coast University, 4940 Bayshore Drive, Naples, FL 34112, USA
*
Author to whom correspondence should be addressed.
Forests 2016, 7(6), 116; https://doi.org/10.3390/f7060116
Submission received: 23 April 2016 / Revised: 10 May 2016 / Accepted: 26 May 2016 / Published: 30 May 2016
(This article belongs to the Collection Forests Carbon Fluxes and Sequestration)

Abstract

:
This study compares carbon sequestration rates along two independent tidal mangrove creeks near Naples Bay in Southwest Florida, USA. One tidal creek is hydrologically disturbed due to upstream land use changes; the other is an undisturbed reference creek. Soil cores were collected in basin, fringe, and riverine hydrogeomorphic settings along each of the two tidal creeks and analyzed for bulk density, total organic carbon profiles, and sediment accretion. Radionuclides 137Cs and 210Pb were used to estimate recent sediment accretion and carbon sequestration rates. Carbon sequestration rates (mean ± standard error) for seven sites in the two tidal creeks on the Naples Bay (98 ± 12 g-C m−2·year−1 (n = 18)) are lower than published global means for mangrove wetlands, but consistent with other estimates from the same region. Mean carbon sequestration rates in the reference riverine setting were highest (162 ± 5 g-C m−2·year−1), followed by rates in the reference fringe and disturbed riverine settings (127 ± 6 and 125 ± 5 g-C m−2·year−1, respectively). The disturbed fringe sequestered 73 ± 10 g-C m−2·year−1, while rates within the basin settings were 50 ± 4 g-C m−2·year−1 and 47 ± 4 g-C m−2·year−1 for the reference and disturbed creeks, respectively. These data support our hypothesis that mangroves along a hydrologically disturbed tidal creek sequestered less carbon than did mangroves along an adjacent undisturbed reference creek.

Graphical Abstract

1. Introduction

Increasing the potential for carbon sequestration by terrestrial and aquatic ecosystems has been proposed as a solution to mitigating increased greenhouse gas (GHG) concentrations in the atmosphere. Many studies have shown that wetlands play a dominant role in the global cycling of carbon as a result of anaerobic substrates and high primary productivity [1,2]. Approximately 20%–30% of the terrestrial total organic carbon (TOC) storage is in wetland environments [3,4]. Degradation of wetlands has the potential to reduce terrestrial carbon stores by up to 50% within the first century of disturbance [5]; for long-term storage of carbon, wetlands must be conserved on the landscape. This paper compares rates of carbon sequestration in disturbed and reference mangrove tidal creeks in southern Florida USA and whether that disturbance affects a mangrove ecosystem’s ability to mitigate human emissions of greenhouse gases to the atmosphere. We also compare sedimentation rates in these tidal creeks as important indicators of whether mangroves in this region will be able to keep up with projected sea level rise.
Coastal wetlands are some of the most biologically and geochemically active regions in the biosphere [6]. They receive allochthonous material from both the terrestrial landscape and the marine environment. Globally, mangrove wetlands occupy 138,000 to 180,000 km2 of terrestrial/coastal landscape [2,7,8,9,10], less than 2% of the oceanic surface area [11] and only 5% of wetlands worldwide. Mangrove forests trap suspended particulate material from the water column, accreting allochthonous sediments as well as senesced plant material, burying and sequestering carbon as a result of anoxic conditions that inhibit decomposition [12,13,14]. Despite their small spatial extent, mangrove ecosystems cycle and store a potentially large amount of carbon, compared to many freshwater wetlands ecosystems, as a result of their efficient trapping of suspended material by their complex rooting structures [15]. Average carbon burial rates in mangrove ecosystems are estimated to be three to ten times greater than those of northern peatlands [16]. Early estimates of organic carbon burial in mangrove ecosystems suggest they account for 15% of the total organic carbon annually sequestered in marine sediments [17,18]. Dominant throughout tropical and subtropical regions, mangroves are limited by oceanic currents, the 20 °C winter isotherms, and frequency of sustained frosts in both the northern and southern hemispheres [7,19,20]. There is some evidence that their extent is moving poleward [21,22].
Due to their larger global extent, research on carbon sequestration has focused on northern boreal peatlands and some temperate wetlands [1,23]. Data on the contribution of subtropical and tropical mangrove wetlands to the global carbon budget are limited [11,13,24,25]. Although soil carbon stocks in boreal regions are high, the rates of carbon accumulation are quite low [1]. Compared to northern peatlands, which sequester carbon at rates of 29 ± 13 g-C m−2·year−1 [1], mangrove ecosystems have been estimated to sequester, on average, 174 g-C m−2·year−1 [9].
The term “blue carbon” has been used to focus on carbon sequestration in coastal wetlands, including seagrass beds, salt marshes, and mangrove ecosystems [14,15]. Although research has largely ignored coastal wetlands in global inventories of carbon fluxes until recently [15], the past forty years have shown significant scientific advancements in the understanding and quantification of carbon dynamics within mangrove ecosystems. The practice of mangrove carbon quantification has grown significantly since Odum [26] first theorized the outwelling hypothesis to current studies that require decadal-scale meta-analysis of organic matter burial, standing carbon pools and gross sedimentation rates [11,12,17,18,27,28,29]. Research over the past 40 years has led to refined global means of mangrove carbon fluxes and has illustrated the high spatial variability in these systems. Carbon dynamics in mangrove ecosystems is still relatively poorly understood [13] compared to other ecosystems, and more research on a regional scale is needed to provide better spatial resolution of carbon fluxes in contrasting climates and hydrogeomorphic regimes. Carbon sequestration potential of mangrove ecosystems depend on rates of wood production, microbial respiration, and storage in sediments [29]. However, there are still uncertainties as to the extent of carbon burial [30] due to the high spatial variability of primary production and allochthonous sedimentation within mangrove systems. Direct conversion to human-dominated systems (e.g., urban expansion through coastline building, agriculture, aquaculture, etc.) and indirect alterations of upland watersheds (e.g., dam building, dredging of canals, installation of impervious surfaces, increased sediment, and pollutant loading) are threats to the survival and ecological functioning of mangrove ecosystems [10,14]. Deforestation rates of these systems far exceed those of upland forests in many parts of the world [31,32].

1.1. Mangrove Hydrogeomorphology

Lugo and Snedaker [33] described six mangrove functional groupings or settings: basin, fringe, hammock, overwash, riverine, and scrub. These systems are described in more detail by Thom [34] and others and currently by Mitsch and Gosselink [2]. Four of these categories are found within this study (basin, dwarf, fringe, and riverine).

1.2. Goal and Objectives

The goal of this study is to investigate soil carbon pools and sequestration rates in coastal mangrove ecosystems of Southwest Florida in different hydrogeomorphic settings and in different degrees of human disturbance. Our hypothesis is that, as a result of upland hydrologic changes, mangroves along a disturbed tidal creek are sequestering less carbon than are mangroves in a hydrologically pristine creek. The specific objectives of the study were to (1) estimate rates of sedimentation; (2) compare soil carbon profiles; and (3) compare recent (50 years) carbon sequestration of mangrove wetlands in both tidal creeks (disturbed and reference) and in the different hydrogeomorphic settings.

2. Materials and Methods
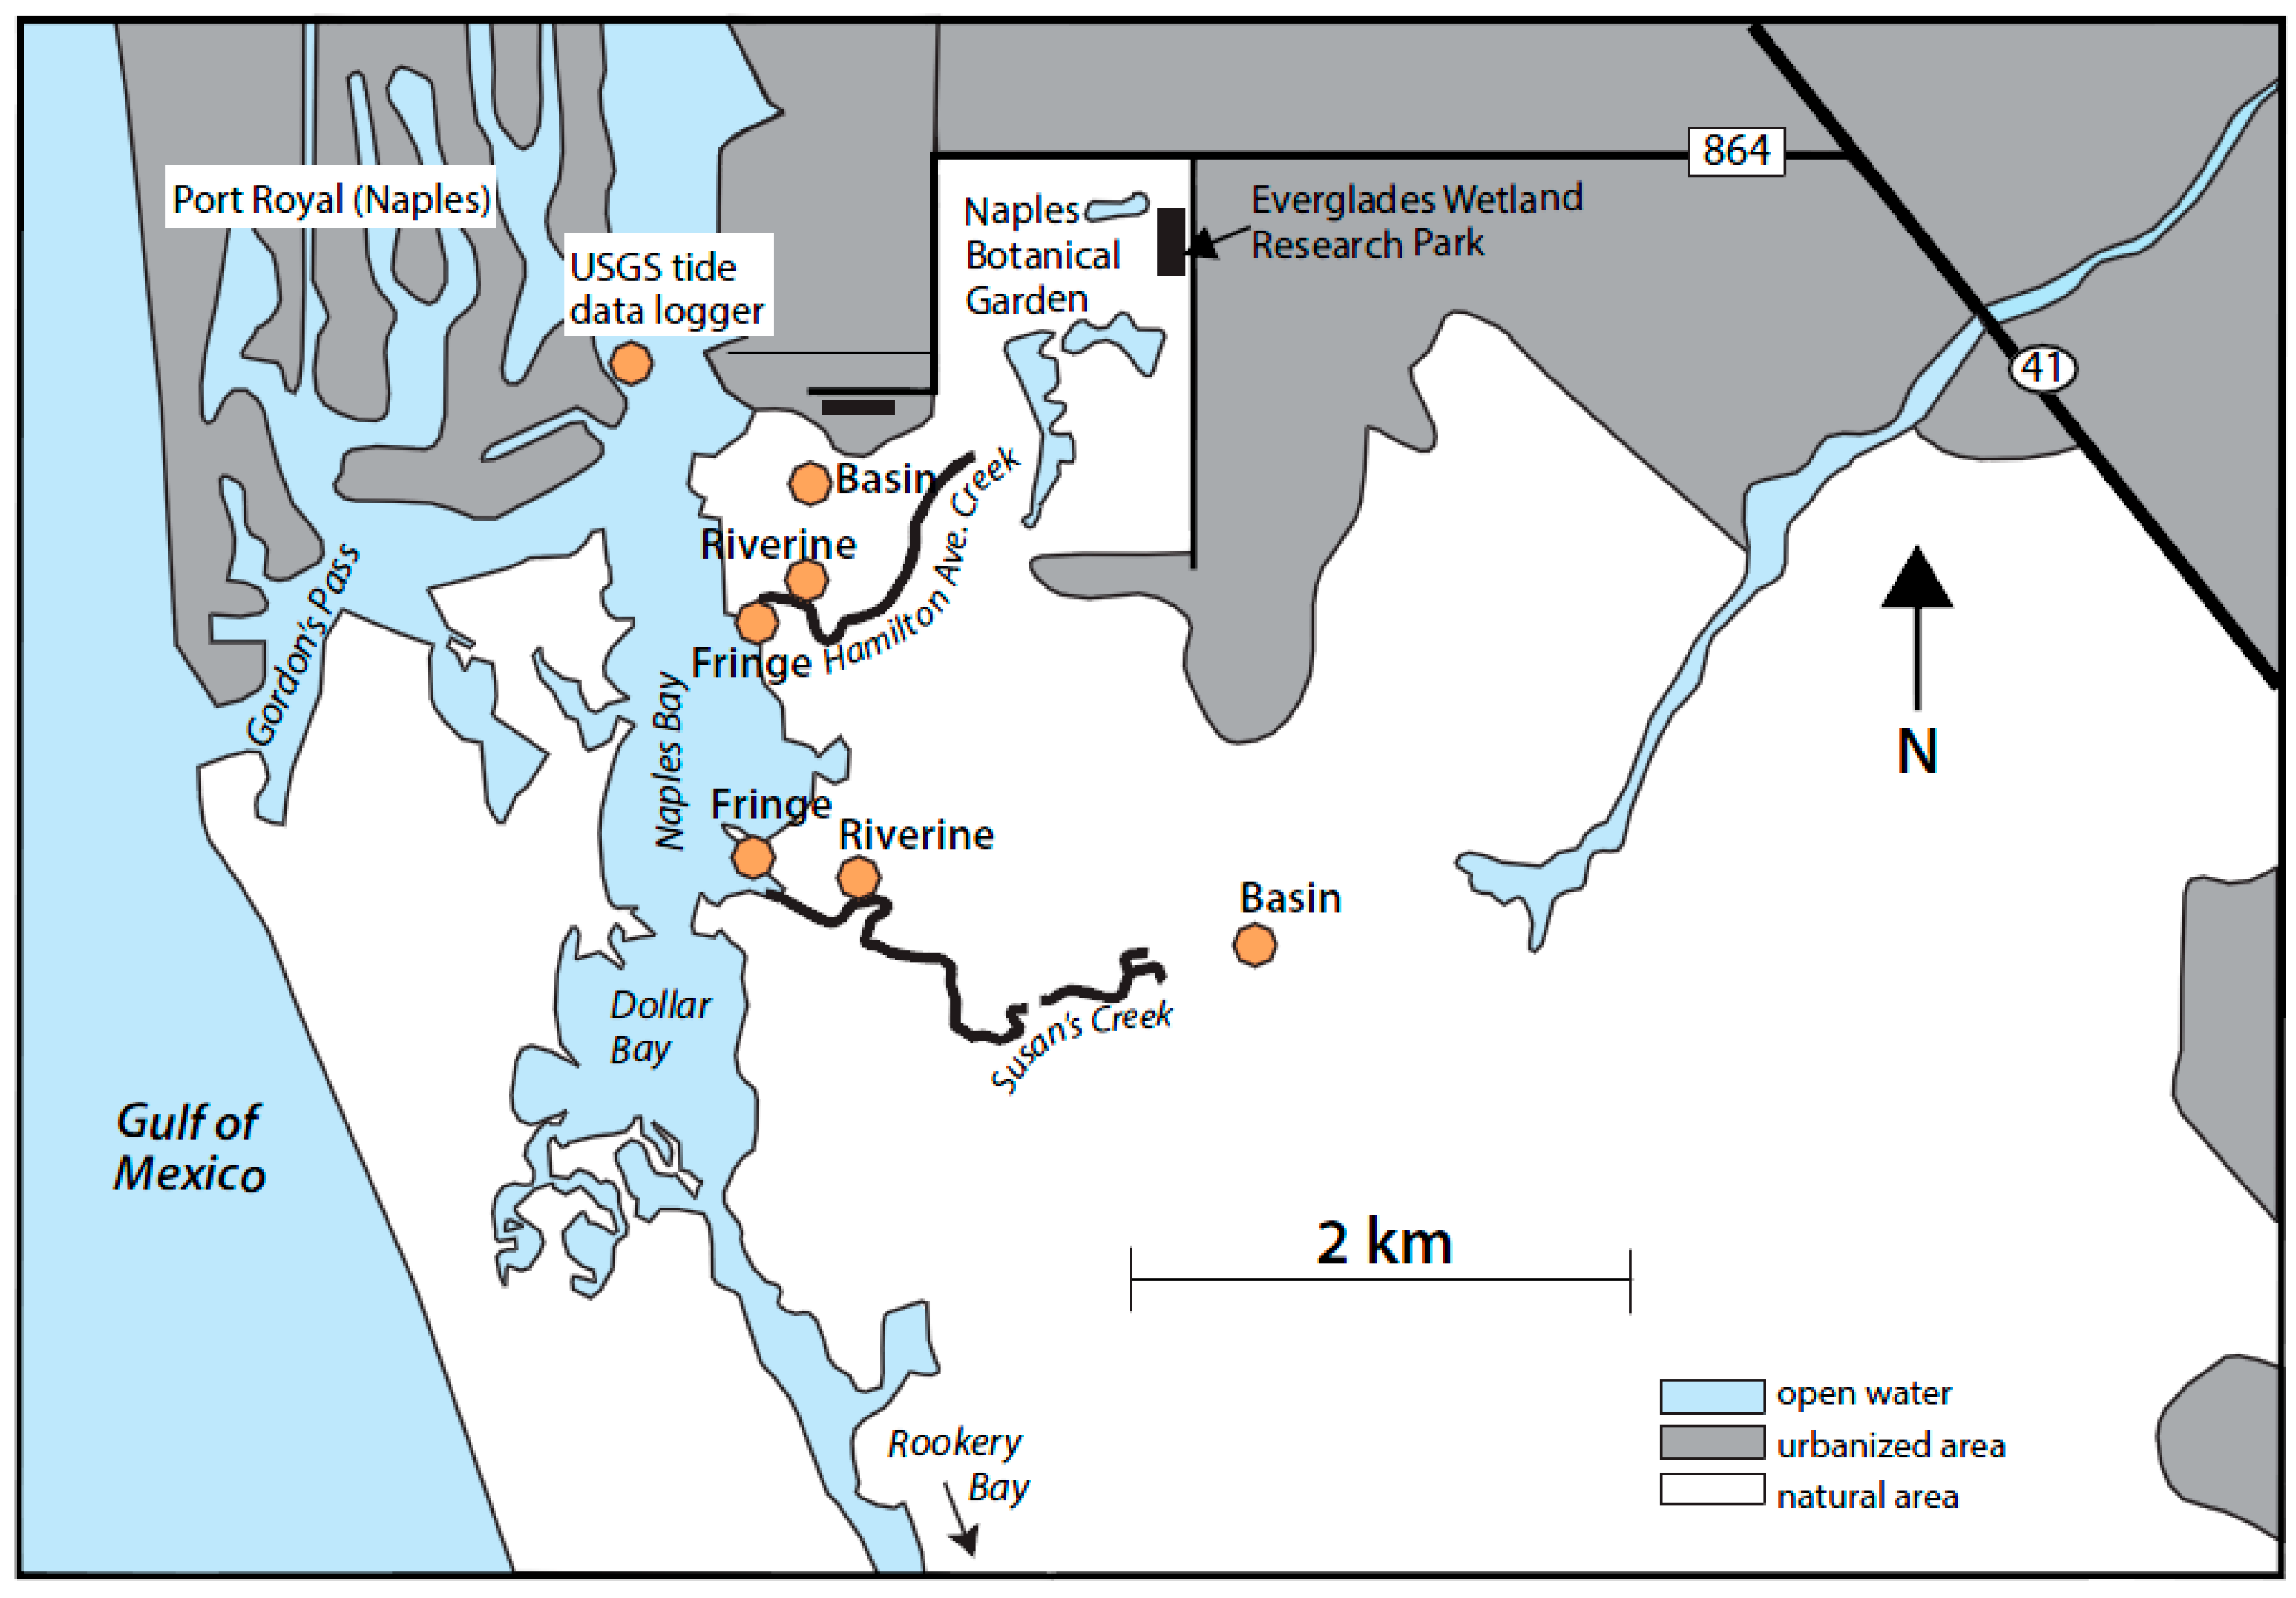
2.1. Study Site

This study was conducted in Naples Bay (26°5′ N, 81°47′ W), Naples, FL, USA. Naples Bay is a semi-diurnal, micro-tidal estuarine system [24], located in Southwest Florida (Figure 1). The mangroves around the southern part of Naples Bay are a small fraction of an estimated 2000 to 5000 km2 of mangrove forests in Florida. The climate of Southwest Florida is subtropical, with an average annual temperature of 23.6 °C. Precipitation is seasonal, with 60% to 65% of the annual 1346 mm·year−1 precipitation occurring from June through September [35].
The greater Naples Bay is primarily sand-dominated, though remnants of oyster beds supply the estuary with calcareous shell material. In comparison with other adjacent estuarine systems, Naples Bay is shallow (<7 m) [36]. Prior to urbanization, seagrass beds and oyster bars were found throughout the bay. However, as a result of dredging, channelization, and compartmentalization of water flows, and now polluted stormwater from an urban landscape, the system has lost much of its natural estuarine characteristic [36]. Around Naples Bay, 70% of the coastal fringing mangrove communities had been converted to human-dominated residential developments by 2005 [36]. The northern portion of Naples Bay is highly urbanized, while the southern portion and its connection to Dollar Bay are relatively unaltered due to protection afforded through the Rookery Bay National Estuarine Research Reserve (RBNERR). The hydrologically disturbed Hamilton Avenue Creek is located 600 m south of Naples Bay proper and 1.9 km from the Gulf of Mexico. Susan’s Creek is 1.3 km south of Naples Bay proper and 2.6 km away from the Gulf of Mexico.
This study focuses on three comparable mangrove functional landscapes (basin, fringe, and riverine) in two distinct tidal creeks adjacent to Naples and Dollar Bays in Naples, Florida (Figure 1). Susan’s Creek (SC) provided a reference mangrove hydrologic setting with no obvious hydrologic alteration. Hamilton Avenue (HA) Creek is a hydrologically disturbed mangrove creek; human development, dredge spoils, and upstream land-use changes have altered the natural flow and sediment deposition regime of this location. An additional dwarf mangrove site in Susan’s Creek was sampled to compare carbon sequestration rates and carbon pool with the other study sites.

2.2. Mangrove Community Structure

Three species of mangroves are observed in the study area and connected bays: Rhizophora mangle (red mangrove), Avicenna germinans (black mangrove), and Laguncularia racemosa (white mangrove). Forest community structure was measured using diameter at breast height (DBH) and stem density in July 2014. Single quadrats in each sampling location were constructed and all stems above 1.3 m in height were counted and measured. Plot sizes were 10 m × 10 m, unless constrained by physical conditions (i.e., open water, impenetrable vegetation) which occurred in the reference basin, disturbed fringe, and disturbed dwarf site. Tree densities for the smaller plot sizes were normalized to reflect a 100 m2 area. Trees less than 2 cm diameter were measured using digital calipers and larger trees were measured using DBH tapes. In the dwarf mangrove site, none of the trees exceeded 1.3 m height and, therefore, no data on DBH or stand density were collected there.

2.3. Soil Sampling and Preparation

Three individual soil cores were sampled from each hydrogeomorphic environment (basin, fringe, and riverine) in Susan’s Creek (SC) and Hamilton Avenue Creek (HA) between July 2013 and January 2014. Soil samples were collected using a WaterMark universal core head sediment sampler (Forestry Suppliers Inc., Jackson, MS, USA) and removable 6.7-cm diameter polycarbonate-coring barrels. The coring device utilizes a check valve to provide suction, ensuring that the entire soil profile is extracted from the substratum. Core barrels were inserted into the substrate until rejection or compaction. If compaction occurred during sampling, the core was discarded and sampling of that individual core was repeated. Soil cores were spaced within 40 cm of each other, forming a triangular pattern, to consider deposition variation within the site [37,38]. After extraction from the substrate, the soil cores were measured for length, capped, and sealed at both ends, and stored at 4 °C to suspend microbial activity and volatilization of labile carbon.
Soil cores were transported to the laboratory, ensuring that cores remain vertical to minimize mixing of the unconsolidated surface material. The soil column was then extracted from the coring barrel, subdivided into 2-cm thick segments, and dried at 60 °C (to prevent the oxidation of carbon) until a constant weight was obtained [32,39]. Each 2-cm sample was ground and homogenized with a mortar and pestle. Visible roots and calcareous shell material were excluded from analysis by sieving the sample with 2-mm mesh. After drying was complete, the 2-cm segments were weighed to determine bulk density, using Equation (1):
Bulk Density (g·cm−3) = Md/V
where Md is dry biomass and V is original soil volume.

2.4. Sedimentation Rates

A high-efficiency germanium radiometric detector (GL 2820, Canberra) was used to measure 137Cs and 210Pb activity (pCi, 10−12 Ci), allowing for estimates of recent soil accretion rates. Ten-gram composite subsamples were analyzed by γ spectrometry for 20 h, at 661.7 and 46.5 keV for 137Cs and 210Pb activity, respectively.
210Pb is a radioisotope in the uranium-238 decay series. 238U naturally occurring in Earth’s soil continually decays into radon-226. In situ decay of 226Ra forms the supported component of 210Pb within the soil. Alternatively, gaseous 226Ra is distributed globally throughout the atmosphere where it rapidly decays into several short-lived isotopes, eventually forming 210Pb. 210Pb that is deposited directly from the atmosphere, or indirectly via incoming water, account for the unsupported component of 210Pb within the soil. Unsupported 210Pb can be used to estimate the time of sediment deposition as a result of its known half-life (22.2 years). To account for variability in sedimentation throughout time, the constant rate of supply (CRS) model, developed by Appleby and Oldfield [40], was selected to calculate sediment age. The model is defined in Equation (2):
A = A(o)ekt
where A is the unsupported 210Pb below the individual segment being dated, A(o) is the total unsupported 210Pb in the soil column, k is the 210Pb decay constant (0.0311 year−1), and t is time (year).
Deposition of human-generated 137Cs occurred as a result of aboveground nuclear testing with the maximum concentration within soil profiles corresponding to 1964, one year after the Nuclear Test Ban Treaty halted this testing of nuclear weapons [41]. Worldwide deposition of 137Cs provides a useful geological marker to allow calculations for soil accretion rates since 1964. Accretion rates were calculated based on the depth of the maximum 137Cs activity. To quantify accretion rates (AR, mm·year−1), the depth of peak activity was divided by the years elapsed since peak 137Cs deposition, using Equation (3):
AR = Dpeak/t
where AR is the soil accretion rate (mm·year−1), Dpeak is the depth (mm) of maximum 137Cs activity, and t is the number of years elapsed between 1964 and the sampling year (49 for this study).

2.5. Soil Carbon Analysis

Duplicate 50 mg samples of individual depth segments (2 cm) were analyzed for total organic and inorganic carbon content using a Shimadzu Total Organic Carbon Analyzer (TOC-V series, SSM-5000A). Total carbon (TC, %) was analyzed by combustion at 900 °C. Samples for the determination of inorganic carbon (IC, %) were pre-treated with 10 mol·L−1 H3PO4, then combusted at 200 °C, using standard procedures for wetland soils [42,43,44,45]. Total organic carbon (TOC) within each depth segment was calculated as the difference between TC and IC concentrations. Percent TOC was multiplied by 10 to calculate soil carbon concentration in g-C kg−1, per 2-cm interval of soil.

2.6. Carbon Sequestration

Carbon sequestration (g-C m−2·year−1) was calculated in each hydrogeomorphic setting using Equation (4):
C-seq = Ad × BD × C-conc
where Ad is the accretion rate supplied by the CRS 210Pb method (cm·year−1), BD is the average bulk density (g-soil cm−3) throughout the dated (past 50 years) portion of the soil core profile, and C-conc (g-C g-soil−1) is the average carbon concentration in the same interval of soil. To allow for interpretation of novel stressors and recent changes to the sediment regime, the carbon pool was calculated for the past 50 years. To calculate the standing 50-year pool of carbon within each hydrogeomorphic setting, the individual site’s carbon sequestration rates (g-C m−2·year−1) were multiplied by 50 years.

2.7. Statistical Analysis

All data were analyzed using JMP (SAS Institute Inc., Cary, NC, USA). The normality of carbon sequestration from each hydrogeomorphic site was tested using the Shapiro-Wilk test when necessary. Data were natural log transformed to meet the assumptions for analysis of variance (ANOVA). A full factorial ANOVA was used to determine differences in carbon sequestration between tidal creeks and hydrogeomorphic settings. A p-value of 0.05 was used to determine statistical significance.

3. Results

3.1. Mangrove Forest Community Structure

Throughout the two tidal creeks, R. mangle was the dominant mangrove species present, accounting for 72%–98% of the stem counts (Table 1). The remainder of the trees in this study were A. germinans and L. racemosa. Within the reference tidal creek, R. mangle tree density was the greatest (1.2 stems m−2) in the basin and lowest in the fringe setting (0.39 stems m−2), whereas in the disturbed creek, R. mangle densities were greatest in the riverine (0.77 stems m−2) and lowest in the basin (0.18 stems m−2). Tree densities of L. racemosa ranged from 0.01 stems m−2 in the reference riverine to 0.21 stems m−2 in the disturbed riverine. Single specimens of A. germinans were observed in the reference basin and fringe. Throughout all sampled sites, R. mangle accounted for a greater proportion of trees observed; however A. germinans and L. racemosa exhibited larger diameters at breast height (DBH).

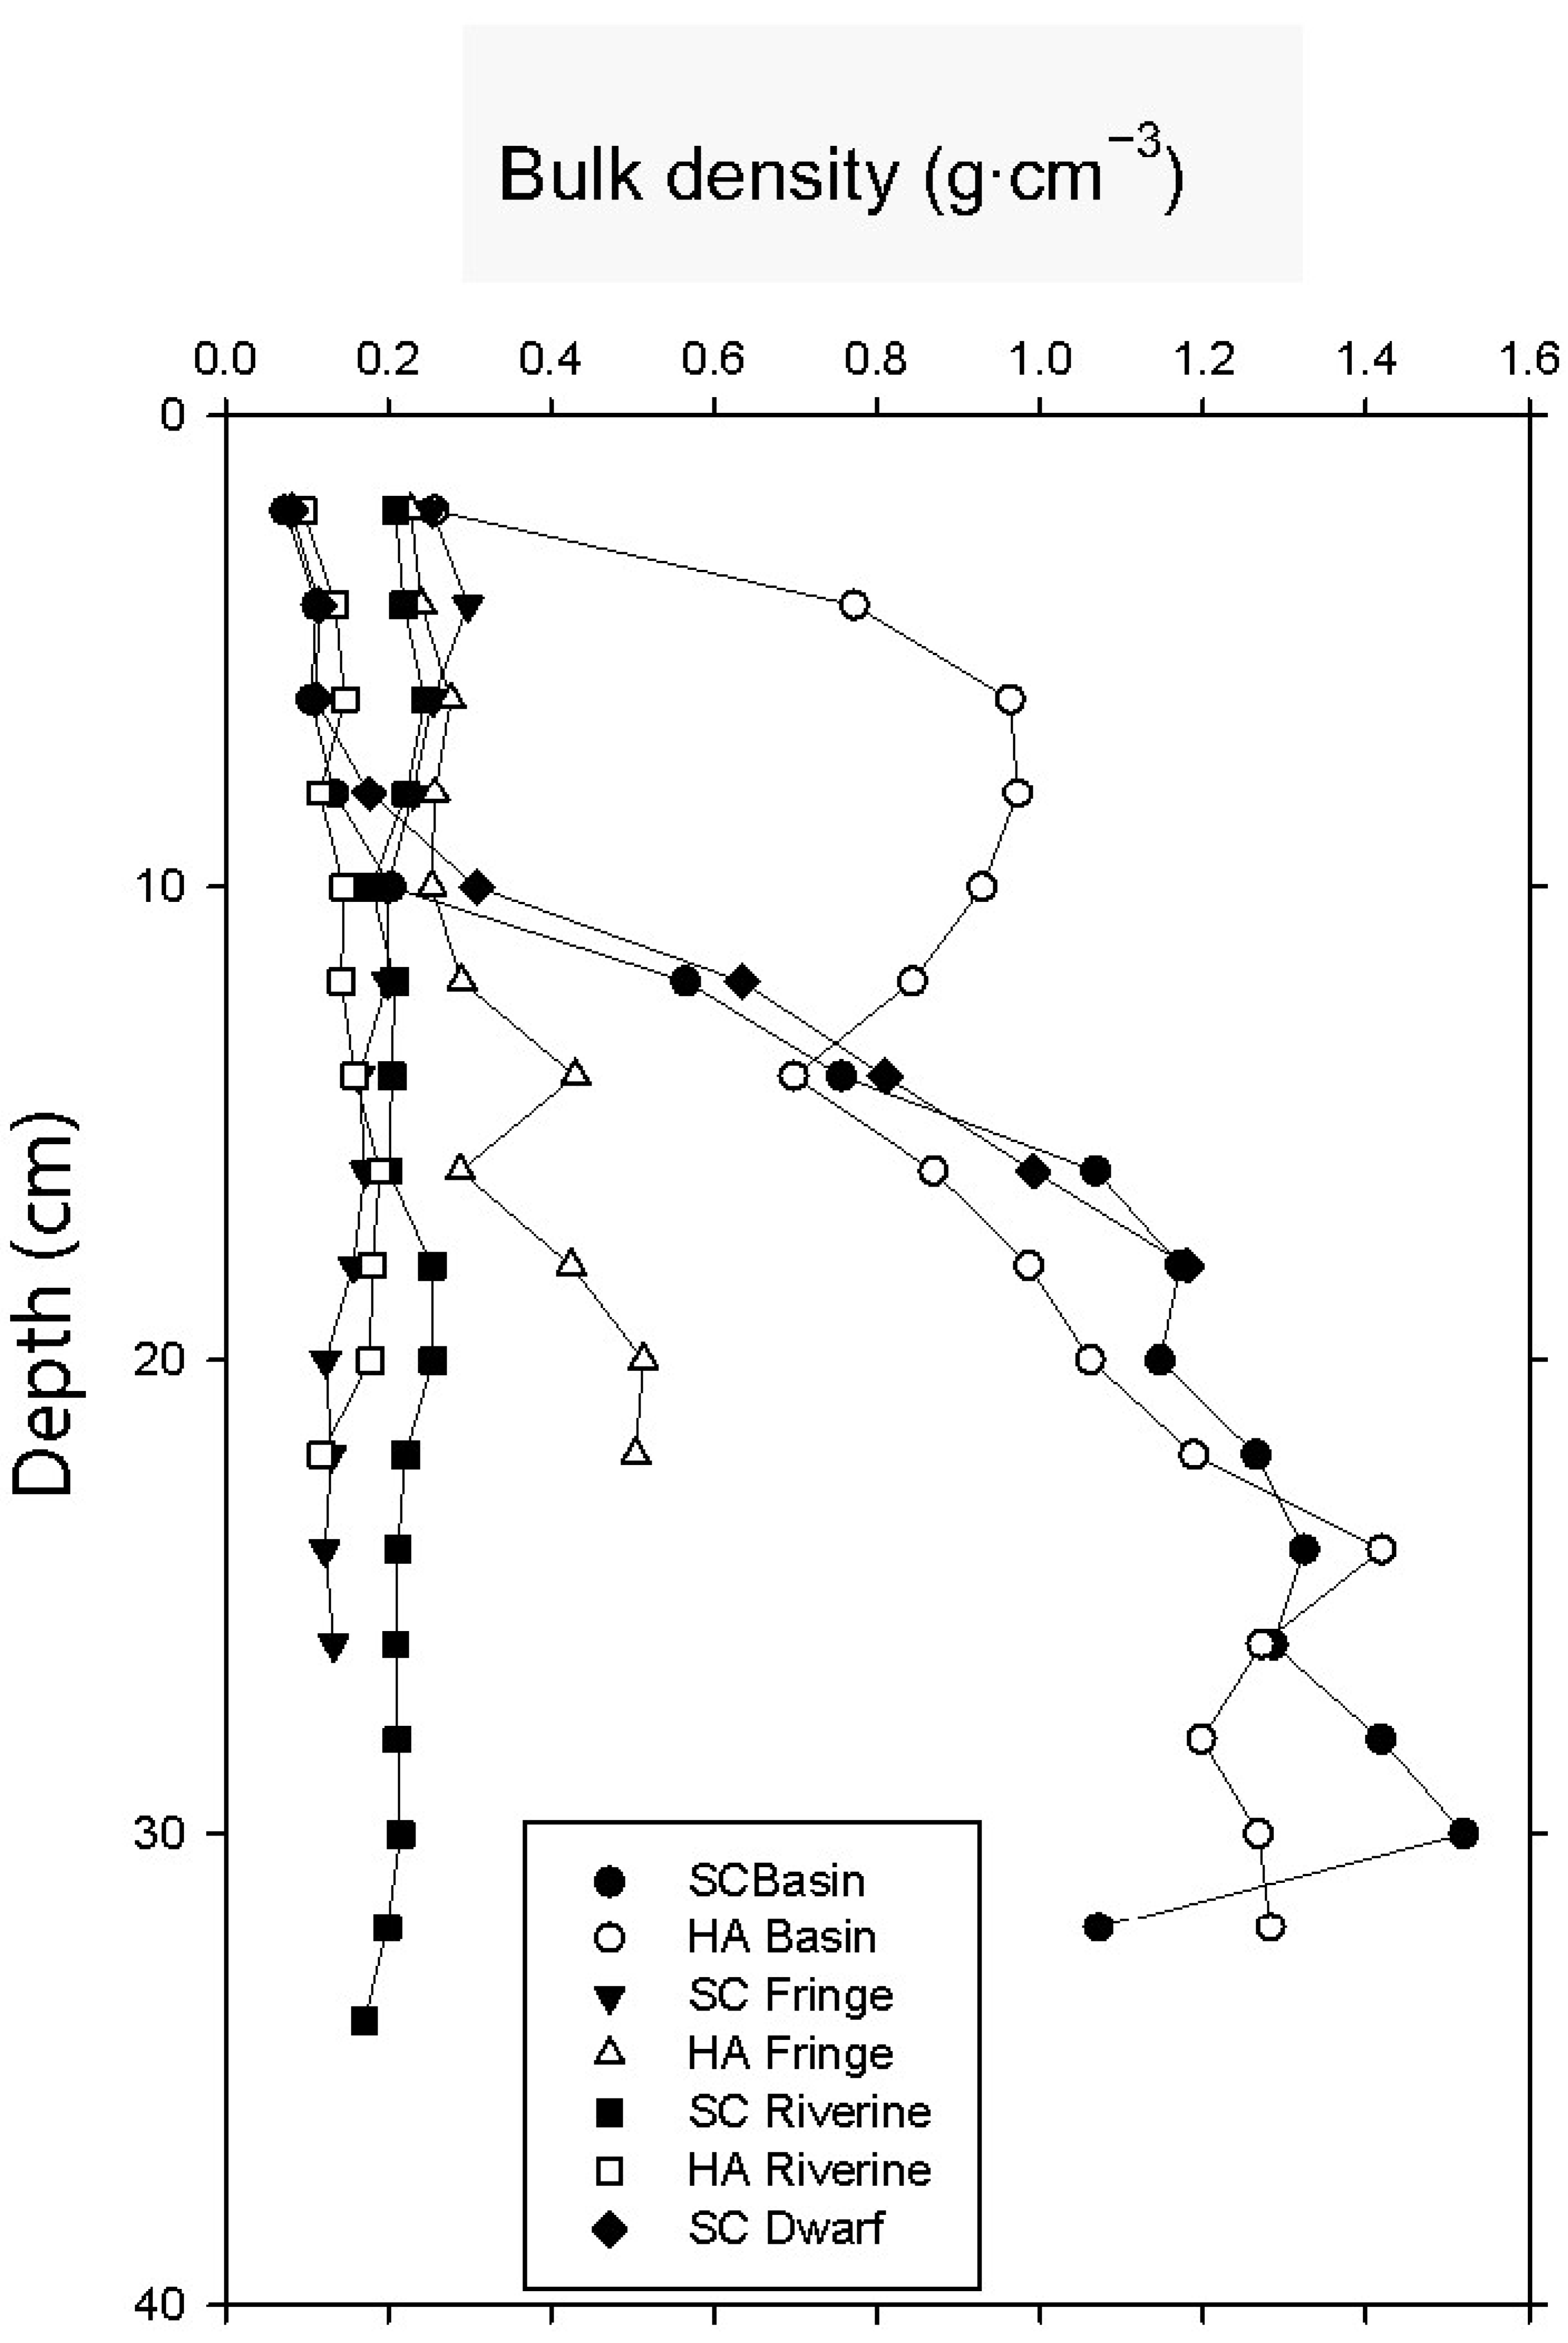
3.2. Soil Bulk Density

Bulk density (g·cm−3) ranged widely throughout the sampled sites (Figure 2). The highest bulk density was found in the basin environments of both tidal creeks; bulk density exceeded 1.0 g·cm−3 below a depth of 18 cm, where the soil core transitioned to predominately sand. The lowest value (0.070 g·cm−3) was also found in Susan’s Creek basin mangroves at the surface layer (2 cm depth), accounting for the unconsolidated surficial detritus. Bulk density values in the riverine environments did not show any appreciable trend. Values in the dwarf mangrove setting increased substantially below a depth of 10 cm. Bulk density (mean ± standard error) for the past 50 years (using 210Pb) in Susan’s and Hamilton Avenue Creeks are: 0.13 ± 0.009 and 0.78 ± 0.09 g·cm−3 in the basin mangroves, 0.25 ± 0.02 and 0.25 ± 0.004 g·cm−3 in the fringe mangroves, and 0.22 ± 0.02 and 0.13 ± 0.005 g·cm−3 in the riverine mangroves. Mean soil bulk density in the dwarf mangroves was 0.16 ± 0.04 g·cm−3.

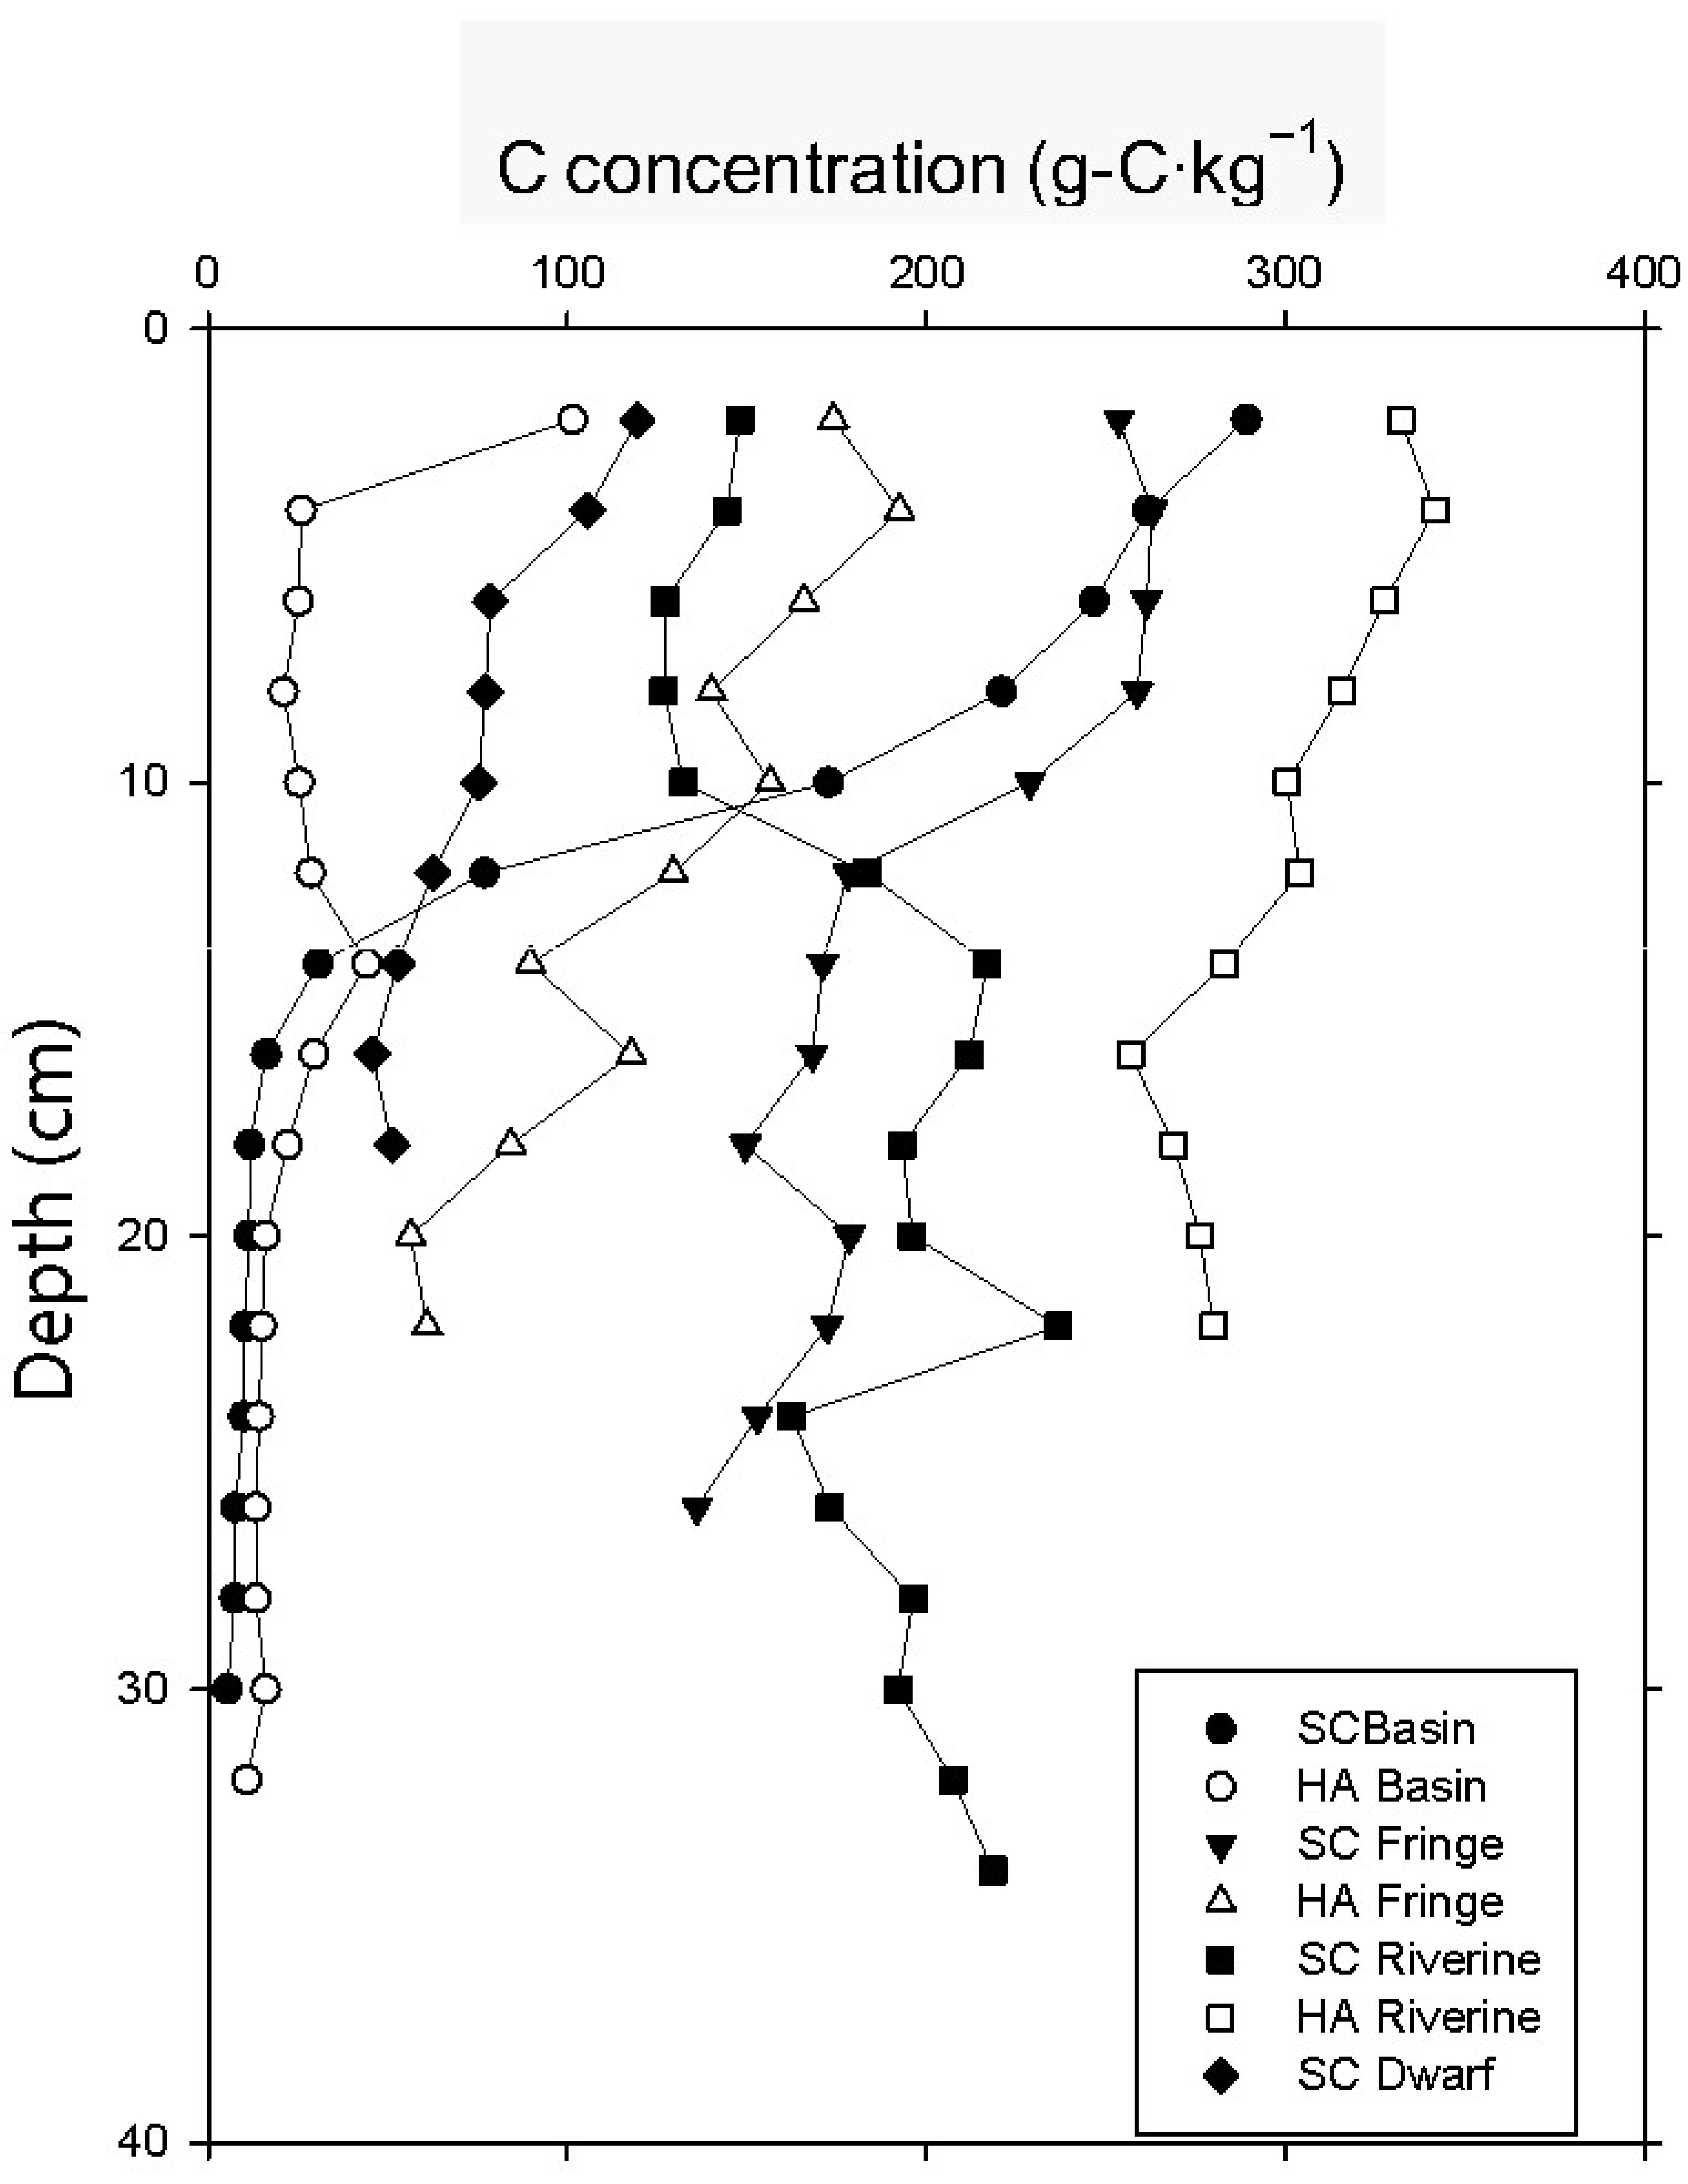
3.3. Soil Carbon Profile

Soil organic carbon (SOC) concentrations varied widely, with values ranging from 3.8 to 344 g-C kg−1 in the mangrove settings along the tidal creeks (Table 2; Figure 3). Percent soil carbon among sites ranged from 0.003% to 34%, with a mean of 14.3%. Mean SOC concentration of our reference tidal creek site (SC) was 15.3%, while the mean of the disturbed creek (HA) was 13.1%. The mean SOC in the dwarf mangrove setting at the reference creek was 6.9%. Throughout the study locations, the majority of carbon was organic carbon (range: 89%–99%). Higher values of inorganic carbon were noted in reference basin and fringe mangroves and disturbed fringe mangroves, but only at a very limited number of depths. The highest SOC was in the disturbed riverine mangrove site (342 g-C kg−1) near the surface (4-cm depth), while the lowest SOC was found in the reference basin mangrove setting (5.4 g-C kg−1) at 30 cm depth (Table 2). SOC in the disturbed riverine mangroves remained consistently high throughout the soil profile, while SOC decreased with depth in all other locations, except for the reference riverine mangroves. The decreasing trend with depth was most pronounced in the reference basin sites where the uppermost 6 cm (0–6 cm depth) of substrate held an average of 265 ± 9.8 g-C kg−1, while the lower layers (26–32 cm depth) held 6.0 ± 1.2 g-C kg−1. There was a less pronounced trend in the fringe mangroves; SOC values in the upper 6 cm of the soil profile contained 259 ± 12 and 177 ± 5.1 g-C kg−1, while the lowermost soil layers contained 153 ± 15 and 67.2 ± 6.3 g-C kg−1 for SC and HA creeks, respectively. The reference riverine setting is the only site where SOC increased with depth; average SOC in the uppermost 6 cm was 140 ± 8.1 g-C kg−1 while the SOC in the lowermost 6 cm (28–32 cm depth) was, on average, 199 ± 3.3 g-C kg−1.

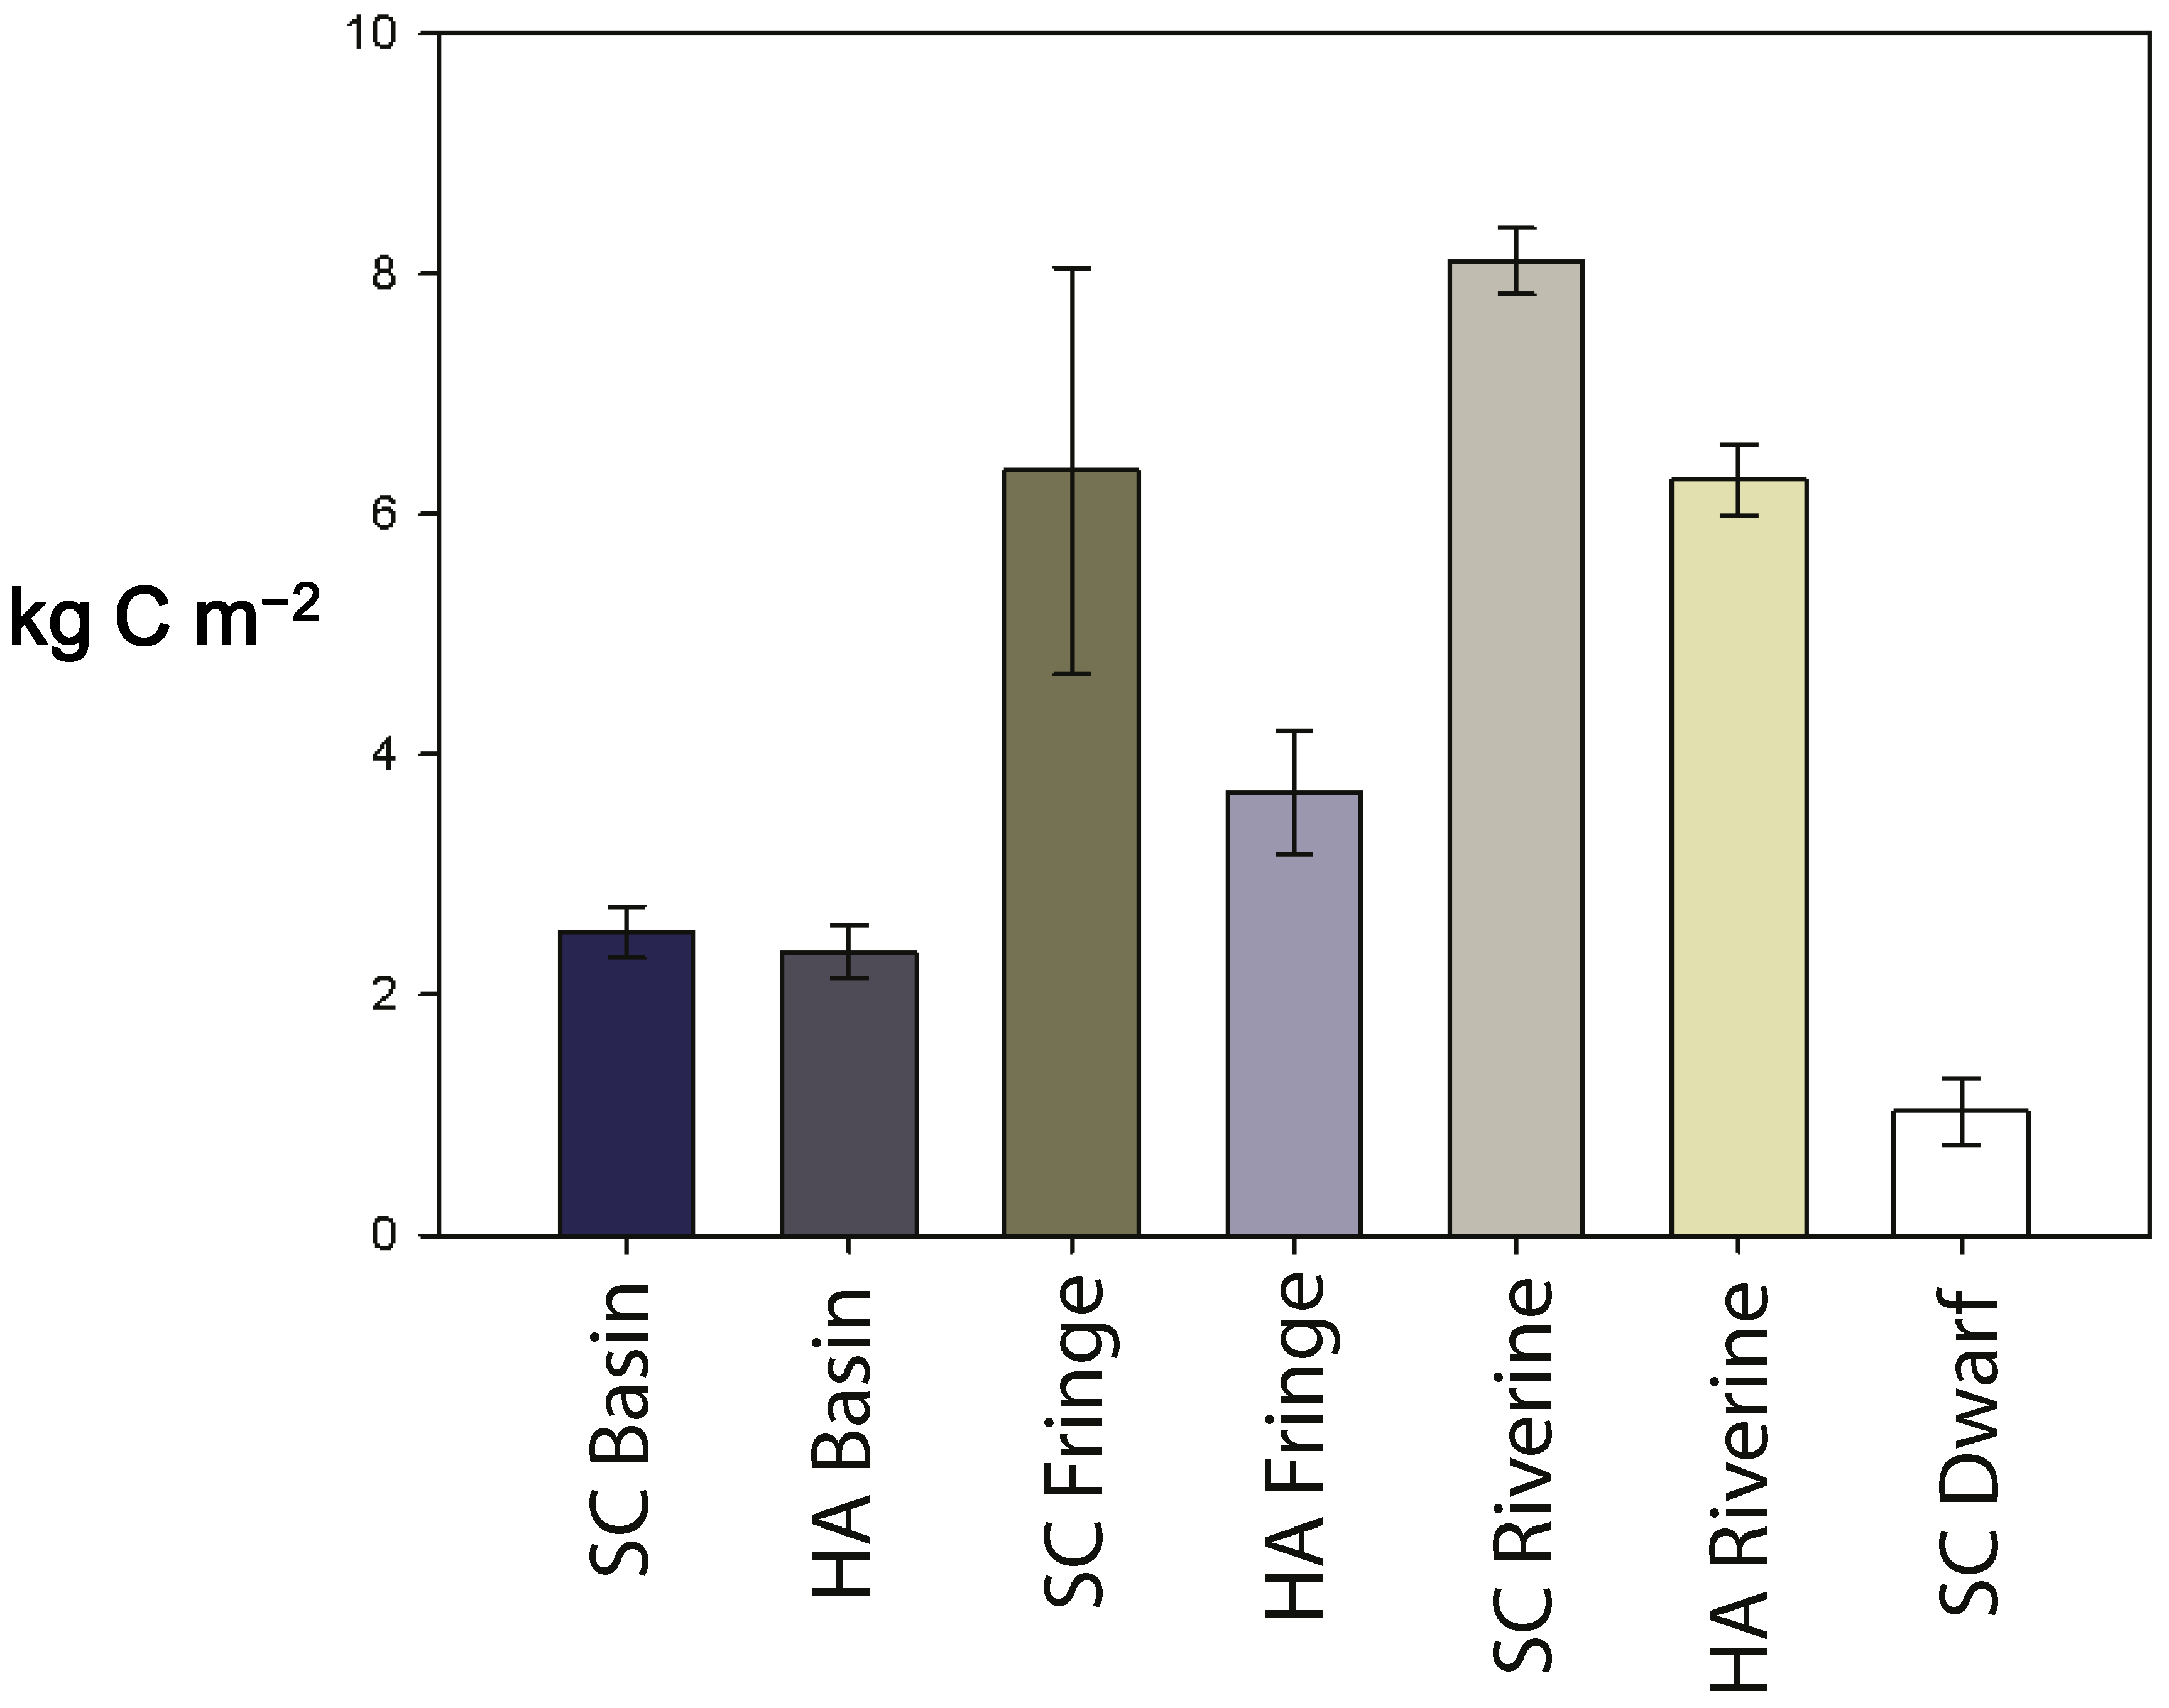
3.4. Soil Carbon Pool

Soil carbon pools (mean ± SE) varied from 1.0 ± 0.3 kg-C m−2 to 6.4 ± 0.3 kg-C m−2 in the dwarf and reference riverine site, respectively (Table 2; Figure 4). Throughout the entire study area, the reference tidal creek had higher carbon pools than those found within the disturbed creek. The greatest difference between carbon pools in the tidal creeks was in the fringe mangroves, where the disturbed tidal creek mangroves held only 57% of the carbon stored in the reference creek mangroves. The disturbed riverine mangroves contained 77% of the carbon found in the reference riverine mangrove creek, while the disturbed basin mangroves held 94% of the carbon found in the reference creek basin mangroves.

3.5. Sedimentation Rates

Cesium-137 activity was found in five of the seven locations sampled; however only the riverine environments exhibited the archetypal 137Cs peaks. Values of 137Cs found within our study location are low when compared to published values; values from this study ranged from −0.02 to 0.30 pCi g−1 in the disturbed basin and riverine, respectively. The reference basin and dwarf mangroves did not show any 137Cs activity in the soil samples. For other locations, 137Cs peaks were identified at 36 cm in the disturbed basin, 14 cm in the reference fringe, 18 cm in the disturbed fringe, and 16 cm at both riverine environments. Accordingly, sediment accretion rates calculated with 137Cs were estimated to be 7.34 mm·year−1 in the disturbed basin mangroves, 2.85 mm·year−1 in the reference fringe mangroves, 3.26 mm·year−1 in the disturbed fringe mangroves, and 3.67 mm·year−1 in both riverine mangroves (Table 2).
Sediment accretion rates utilizing the 210Pb constant rate of supply method were lower than rates calculated with 137Cs (Table 2; Figure 5 and Figure 6). Sediment dating with 210Pb was subsequently used to estimate carbon sequestration because of the lack of defined 137Cs peaks at most of the sites (Figure 5) and 137Cs mobility in marine systems. Sedimentation rates within our two tidal creeks were found to be 1.68 and 1.58 mm·year−1 in the basin mangroves, 2.28 and 2.23 mm·year−1 in the fringe mangroves, and 5.43 and 3.04 mm·year−1 in the riverine mangroves, for the reference (SC) and disturbed (HA) creeks, respectively. Sedimentation rates were 1.41 mm·year−1 in the dwarf mangroves that were found only in the reference creek.

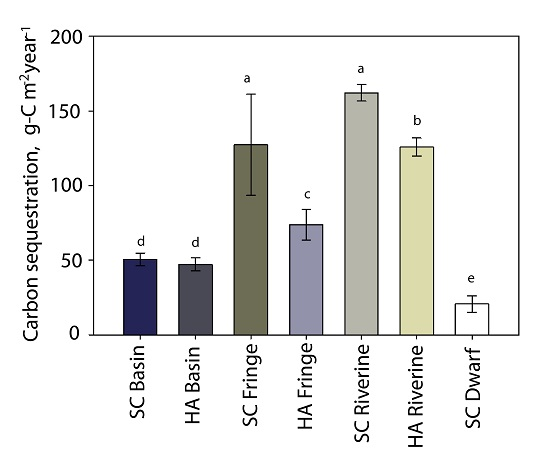
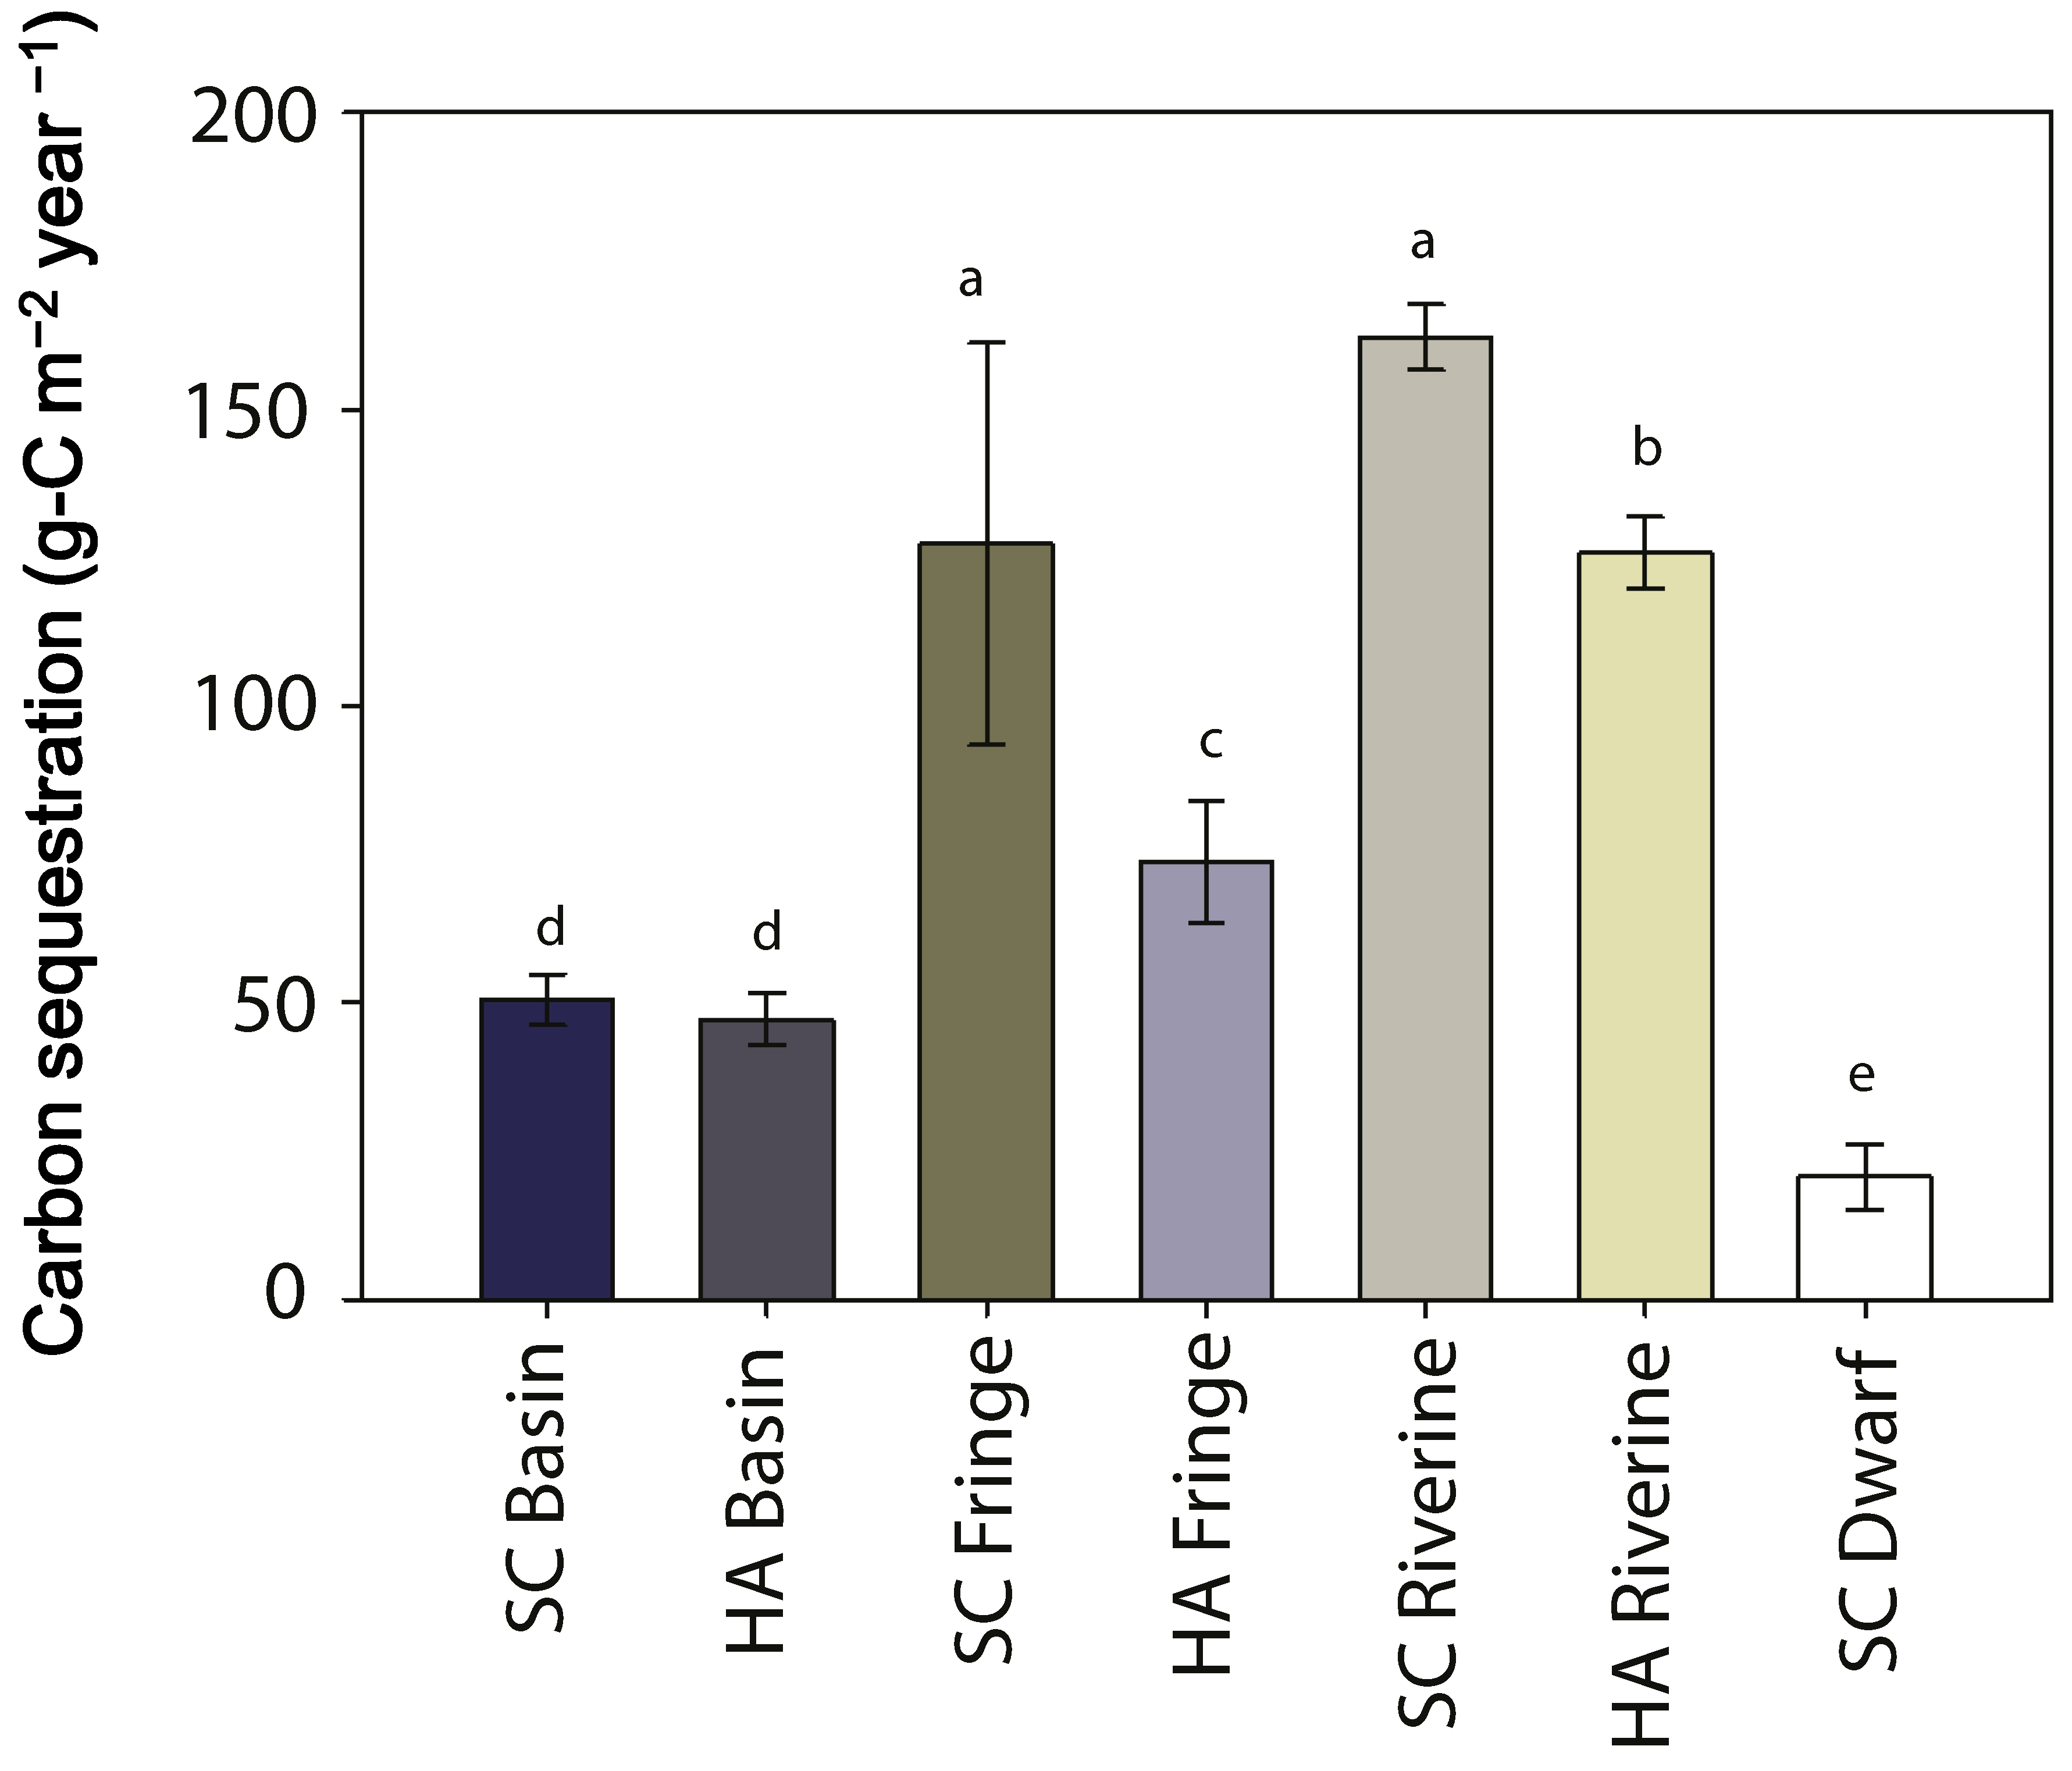
3.6. Carbon Sequestration

As a result of issues using 137Cs in marine systems, carbon sequestration rates were calculated exclusively with the 210Pb CRS method. Throughout the seven study locations, total integrated unsupported 210Pb ranged from 2.15 pCi cm−2 in the reference dwarf mangrove site to 20.4 in the reference fringe site, with an overall mean ± standard error of 10.7 ± 3.0 pCi cm−2. Our data show there was a preferential deposition of unsupported 210Pb in the reference creek (mean: 16.2 pCi cm−2) when compared to the disturbed tidal creek (mean: 8.0 pCi cm−2). Carbon sequestration rates (mean ± SE) among the different mangrove environments ranged from 21 ± 5 g-C m−2·year−1 in the dwarf mangroves to 162 ± 5 g-C m−2·year−1 in reference creek (SC) riverine mangroves (Table 2; Figure 7). A full factorial ANOVA indicated that the riverine and fringe mangroves in both tidal creeks exhibited different carbon sequestration rates, while the basin mangroves did not. The disturbed riverine mangroves (125 ± 6 g-C m−2·year−1) sequestered significantly less carbon than the reference riverine mangroves (162 ± 5 g-C m−2·year−1) (p < 0.05). Carbon sequestration at the fringe sites (127 ± 6 and 73 ± 10 g-C m−2·year−1 for the reference and disturbed sites, respectively) was significantly different (p < 0.01). The only hydrogeomorphic environment showing significantly similar carbon sequestration rates were the two basin mangroves (p > 0.05). Carbon sequestration rates in the basin mangroves were 50 ± 4 and 47 ± 4 g-C m−2·year−1 for the reference and disturbed sites, respectively.
The mangroves in the reference Susan’s Creek (SC) sequestered more carbon (113 g-C m−2·year−1) than did the disturbed Hamilton Avenue (HA) Creek mangroves (82 g-C m−2·year−1) (p < 0.05). There was also a significant hydrogeomorphic effect on carbon sequestration among the three classes (basin, fringe, and riverine) [f(2) = 22.90 p < 0.0001].

4. Discussion

4.1. Carbon Dynamics in Mangrove Wetlands

Our hypothesis, that mangroves along a hydrologically disturbed creek sequestered less carbon than mangroves along an undisturbed reference creek proved correct. There were also differences when carbon sequestration was compared across the different hydrogeomorphic settings. Rates of carbon sequestration in the reference riverine mangroves were the highest recorded, followed by mangroves in the undisturbed fringe mangroves. The disturbed riverine mangroves sequestered statistically less than did the undisturbed riverine mangroves, while the disturbed fringe mangroves sequestered a little less than half of what was sequestered in the undisturbed fringe mangroves. The basin mangroves sequestered similar amounts of carbon in the undisturbed and disturbed site.
These results may be explained several ways. The primary force dictating long-term carbon accretion in sediments is the hydrologic regime. Both freshwater inflow and coastal tidal activity have the capacity to lessen sediment and, hence, carbon accumulation. However, it is more likely that a decrease in freshwater inputs may be causing lower carbon accumulation in the disturbed tidal creek. Odum [26,46] formulated and defended the outwelling hypothesis, which described mangrove ecosystems as net exporters of organic material and crucial links to subsidizing the relatively unproductive oceanic shelf systems. Some have suggested that this idea was an over-simplification and that coastal nutrient dynamics are much more complex [9]. Fukarawa et al. [47] showed that there was a net influx of suspended sediments during high tides that were not exported at ebb tide. Further expanding upon this idea, Adame and Lovelock [48] found that rainfall and temperature are the main factors dictating the fate of carbon in coastal sediments; study sites with high annual temperature (>29 °C) and low precipitation (<200 mm·year−1) exported more carbon than did sites with low annual temperature (<15 °C) and high precipitation (>4000 mm·year−1). They suggest that the export of senesced plant material is approximately 50% of annual litterfall; in their study the export averaged 202 g-C m−2·year−1 [48].
Tidal activity in mangrove forests can either increase or decrease long-term carbon sequestration. Incoming tidal fluxes provide a subsidy to the mangrove forest, bringing in nutrient-rich allochthonous material and carrying away high-salinity waters. If there is inadequate freshwater flushing, salinity levels can increase, resulting in increased physiological stress on mangrove trees, causing them to displace more energy on osmotic regulation within the plant and diminishing energy available to growth [9]. This added stress ultimately leads to less leaf and stem production available to be incorporated into sediments. The majority of this oceanic material does not get re-exported at ebb tide and is incorporated into the sediment as a coarse mineral fraction or fine organic detritus, either helping to stabilize the coastline or increasing nutrient availability in the soil. If mangroves are not flushed adequately with freshwater from upland or precipitation, then high concentrations of salt can accumulate in the sediments and increase the respiratory energetic costs to mangroves. However, the high variability among different mangrove communities makes it difficult to generalize and expect similar outcomes when these systems are exposed to differing levels of tidal inundation, freshwater inputs, precipitation, and, subsequently, productivity.
In a nearby hydrologically restored mangrove site, McKee and Faulkner [49] observed that diminished freshwater flushing throughout the site resulted in more physicochemical stress to the resident Rhizophora mangle community, reducing both survival and growth. R. mangle, the dominant species throughout our study site, is a facultative halophyte; it thrives in areas with periodic inputs of freshwater. Sustained high salinity is detrimental to red mangroves and can cause physiological stress, resulting in slower growth [9] and denaturing of the terminal apical meristem buds [50]. Furthermore, high salinity can negatively affect propagule recruitment by increasing energetic costs to maintain osmotic homeostasis. Alteration to the hydrologic signature in mangroves can also affect propagule dispersal, litter fall, and productivity [51]. Carter et al. [52] also found that in areas with higher salinities, the white mangrove (Laguncularia racemosa) exhibited higher GPP than red and black mangroves. Our disturbed creek had higher stand densities of white mangroves than did our reference creek.
We believe that little to no freshwater flushing through the disturbed tidal creek during the wet season caused salinity levels to stay near oceanic levels year round, eventually affecting the productivity and eventual carbon sequestration (see Section 4.4 below). Within the riverine and fringe settings in the disturbed creek, the interstitial salinity did not vary more than 1 ppt around the mean of 34 ppt during the summer wet season. On the other hand, salinity was shown to change much more dramatically in the undisturbed reference creek where it decreased by more than 20% in the wet season compared to the dry season [53].

4.2. Mangrove Sedimentation Comparisons

Mangrove ecosystems can persist as long as the rate of sea-level rise does not exceed the rate of net sedimentation. Using the 210Pb-calculated rates of sedimentation, only two (disturbed and reference riverine mangroves at 5.43 and 3.04 mm·year−1, respectively) of the seven sampling sites had sedimentation rates higher than the sea-level rise projected for Naples, Florida of 2.4 mm·year−1 [54]. Global mean sea level rise has recently been predicted to be in the range of 2.6 to 3.2 mm·year−1 [55,56]. If future sea level rise is at the maximum rate of 3.2 mm·year−1, then all of our mangrove sites, save one, would not be able to keep up with sea level rise.
Sedimentation in the adjacent Rookery Bay and in an adjacent mangrove mitigation site near Naples Bay was estimated more than 25 years prior to our study by Lynch et al. [24]. Our sedimentation rates using 210Pb (range: 1.58–5.43 mm·year−1) are in range of those found by Lynch et al. [24] in Rookery Bay (range: 2.2–2.5 mm·year−1); the average sedimentation rate in our study was 2.7 mm·year−1, while the average in their study was slightly lower at 2.3 mm·year−1. Sedimentation rates utilizing 137Cs were also higher than were 210Pb measurements in their study, just as they were in our study.

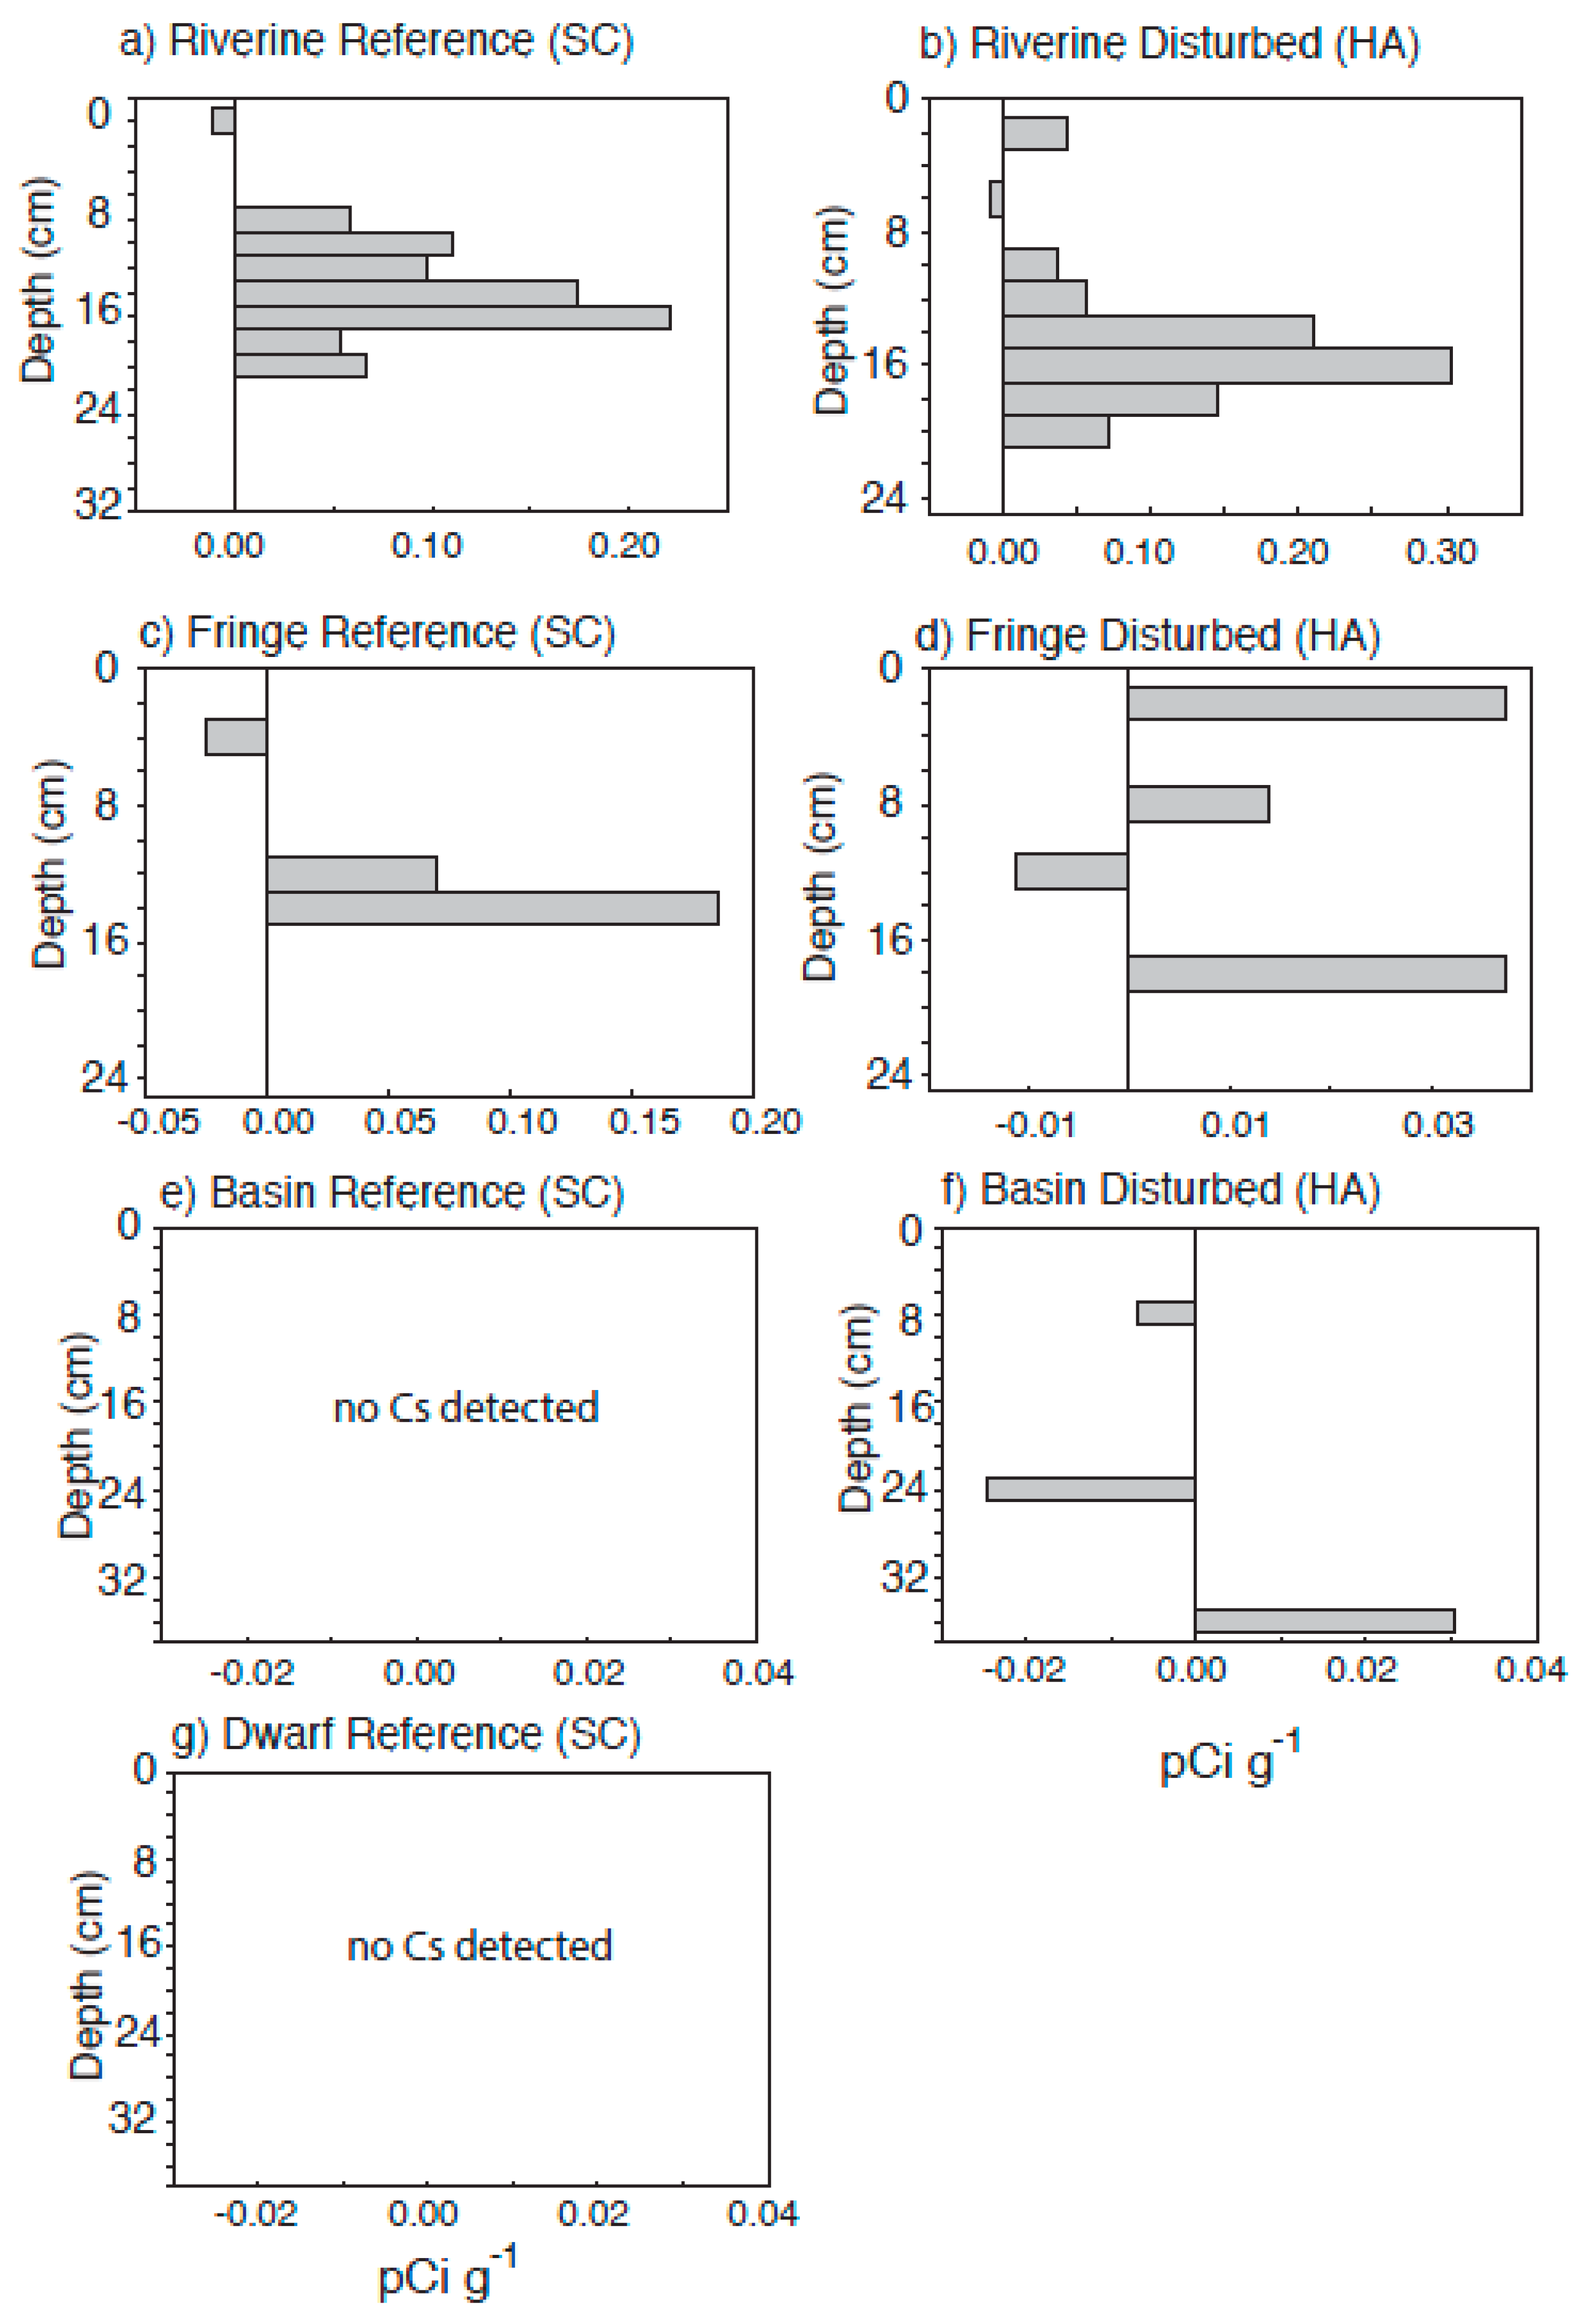
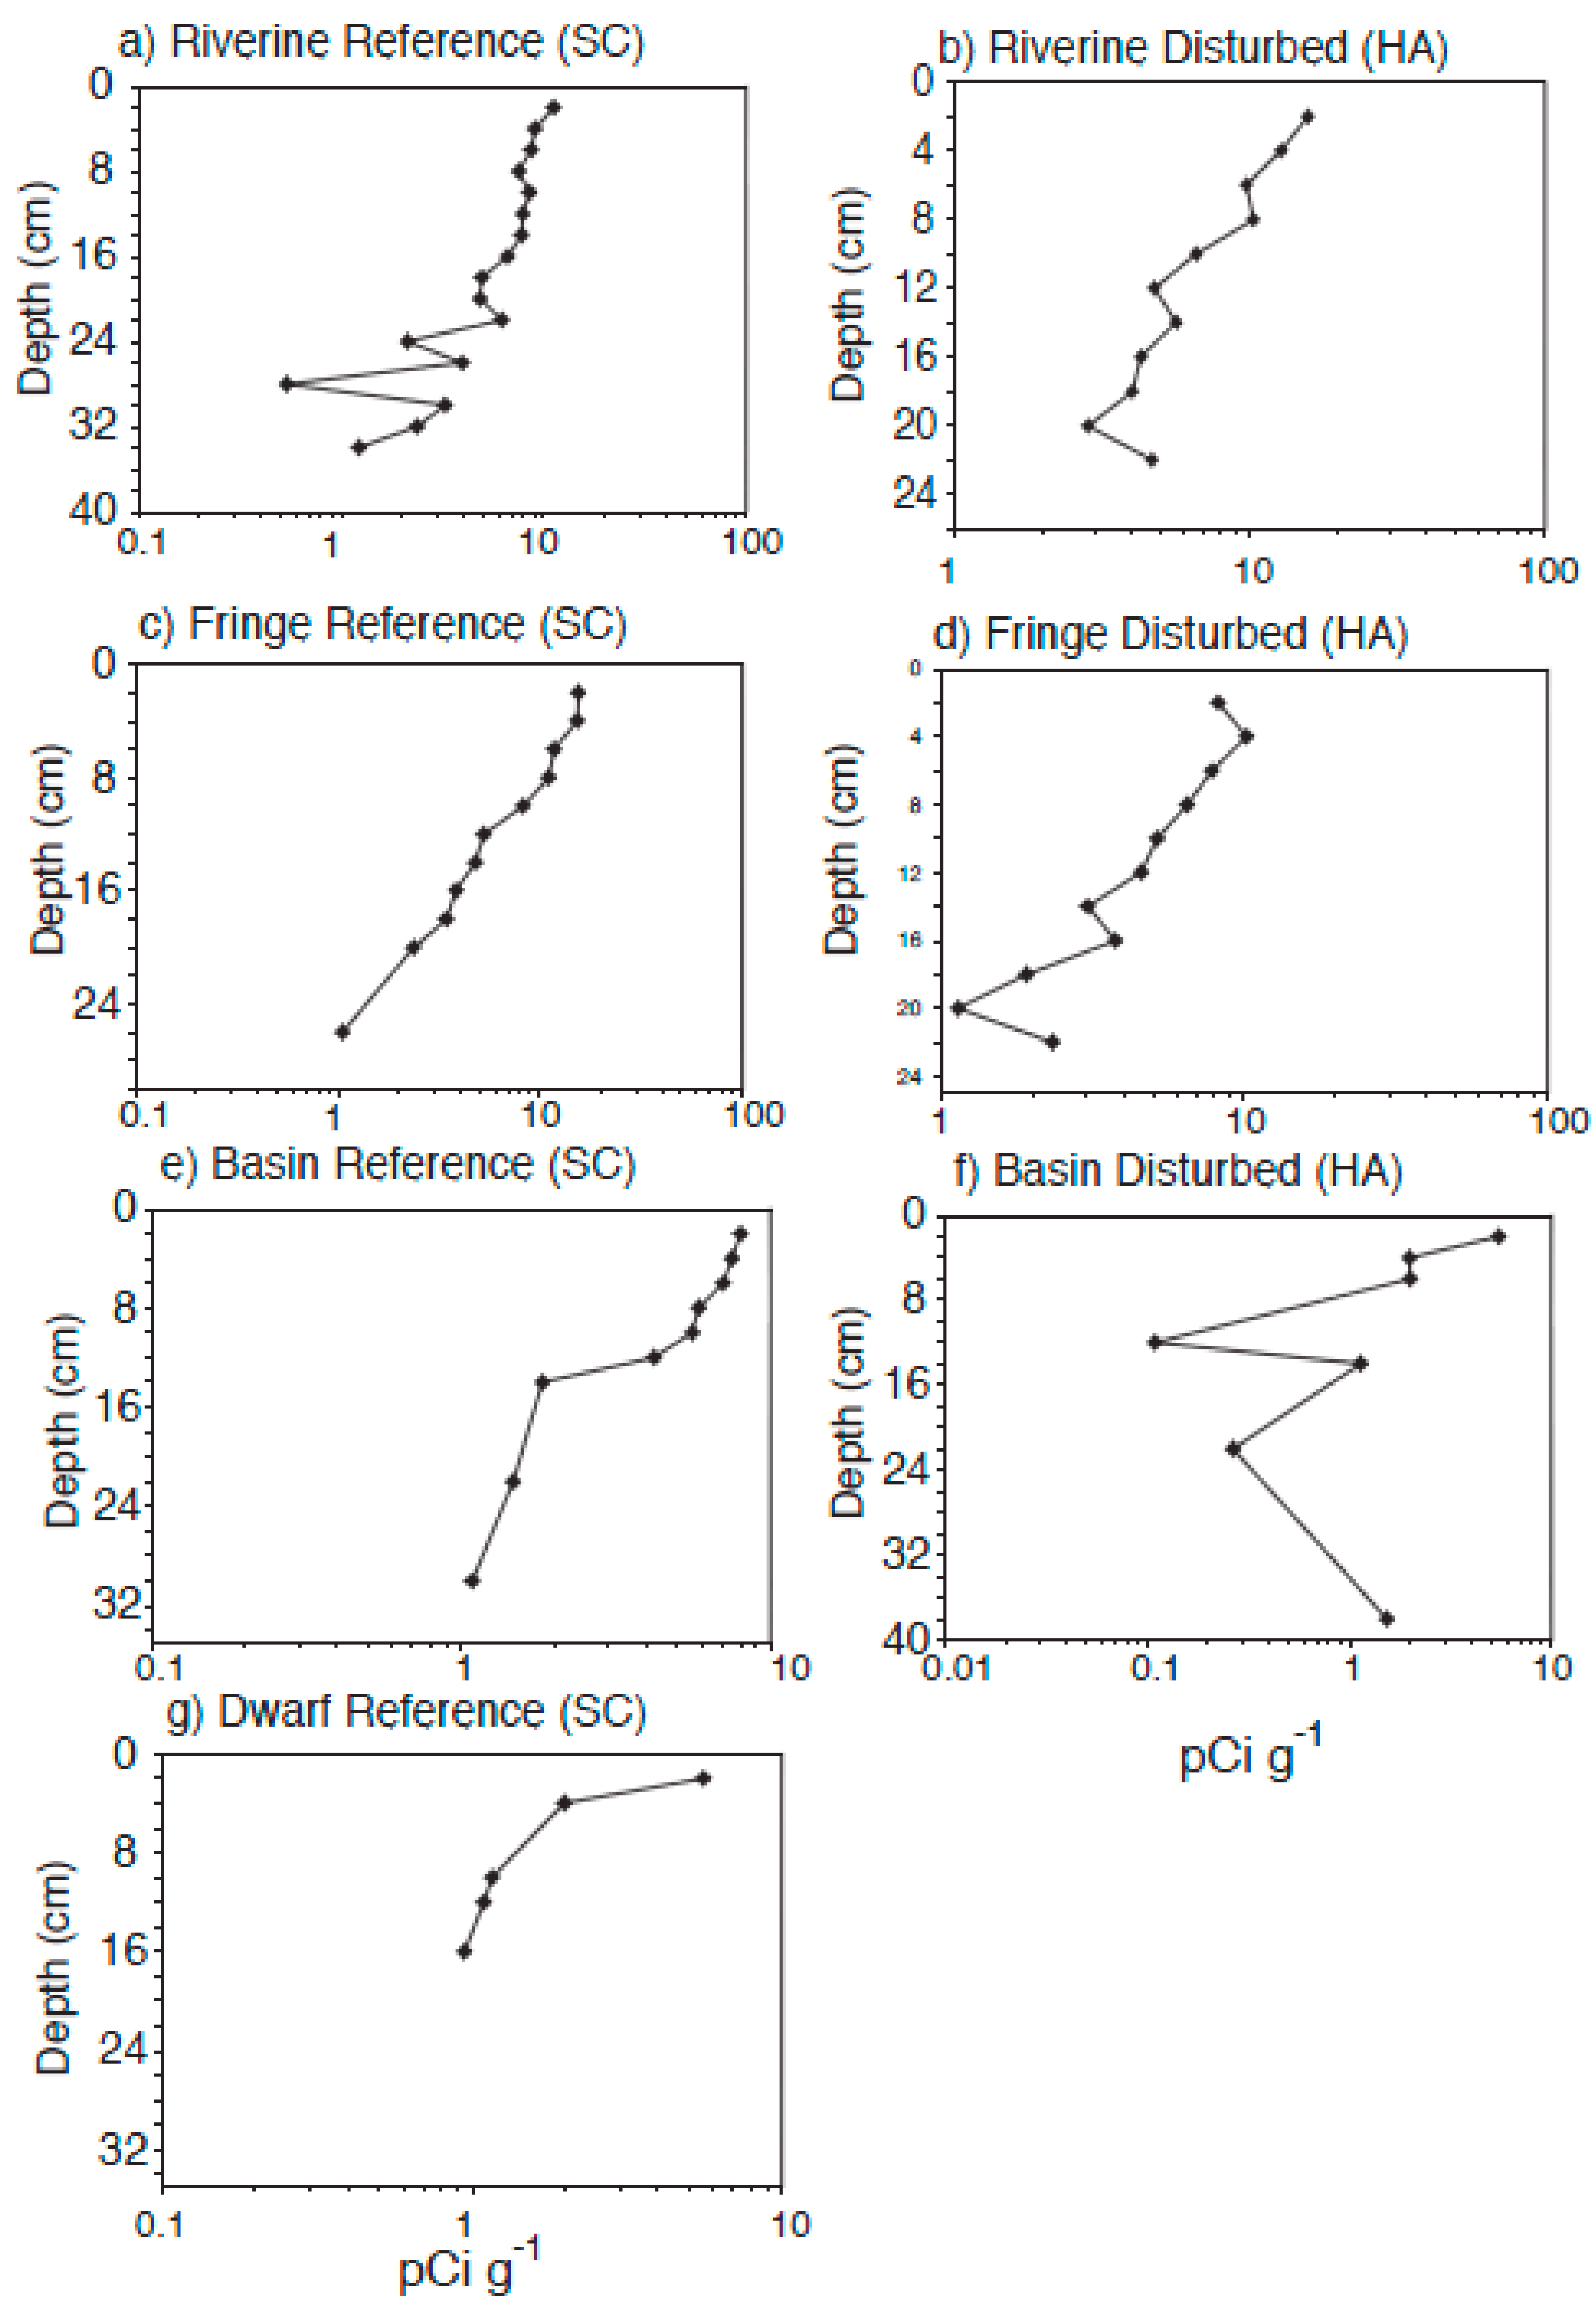
4.3. Radiometric Dating

The 210Pb method proved to be more effective than was the 137Cs method for estimating sedimentation rates. The latter method was unreliable due to an absence of peak concentrations of 137Cs in the soil stratigraphic column and mobility of 137Cs in marine systems. Furthermore, in sand-dominated systems, such as these, soils often lack clays to bind 137Cs. The sites with discernible 137Cs peaks registered accretion rates on the order of 2.85 to 7.34 mm·year−1. Accretion rates calculated from 137Cs peaks and 210Pb in our study are well within the range of vertical accretion reported for mangrove forests [11,24,57,58]. For all sites, accretion rates calculated with 210Pb were considerably lower than the rates calculated with 137Cs peak activity. Rates of sedimentation calculated with the 210Pb model ranged from 1.41 (dwarf mangroves) to 5.43 mm·year−1 (reference riverine mangroves). Alternatively, rates utilizing peak 137Cs activity ranged from 2.85 mm·year−1 (disturbed riverine mangroves) to 7.34 mm·year−1 (disturbed basin mangroves).
Cationic cesium-137 is strongly absorbed to the negatively-charged clay particles in soil. However, in H+-dominated, acidic soils, other cations are preferentially bound [59]. In oceanic settings cation exchange sites may be sufficiently impregnated with cations commonly found in saltwater (Ca2+, K+, Mg2+, Na+), thus excluding 137Cs from adhering to the clay particles, making the calculation of accretion rates utilizing 137Cs unreliable. This factor contributes to the reported mobility of 137Cs in water with high concentrations of salt. 210Pb is a polyvalent cation that binds readily to clay particles. However, dating errors using 210Pb can still occur as a result of multiple assumptions and reliance on interpretive models [60].

4.4. Carbon Sequestration Rate Comparisons

Mean carbon sequestration rates of the four mangrove hydrogeomophic settings studied here ranged from 47 ± 4 to 162 ± 5 g-C m−2·year−1. These are compared to other rates published in the literature in Table 3. Alongi [9] suggests the global average carbon sequestration rate for mangrove ecosystems is 174 g-C m−2·year−1. Our carbon sequestration rates ranged from 25% to 75% of that global average. Our rates are similar to other sequestration studies measured around the Gulf of Mexico. Lynch et al. [24] found rates on the order of 69–99 g-C m−2·year−1, in Rookery Bay (immediately south of this study location) and 137 g-C m−2·year−1 in Terminos Lagoon, Mexico (Table 3). These lower rates, when compared to the world average, are not surprising given that the climate of the Southern Florida coastline, according to the Holdridge Life Zone classification, is both subtropical and warm temperate [61]. The mangroves on some of Florida’s coastline actually experience and survive occasional frosts that are rare in subtropical regions. In the Florida Everglades, 100 km east of our study site, Breithaupt et al. [58] found similar rates of carbon sequestration (123 ±19 g-C m−2·year−1) rates comparable to our reference tidal creek, which averaged 113 ± 19 g-C m−2·year−1. Their study represented a relative homogenous landscape and similar hydrogeomorphic conditions (coring sites were spaced within 200 m) while ours represented a gradient of hydrologic energies in differing hydrogeomorphic environments. Our reference riverine and fringe mangroves near Naples Bay exhibited higher rates of carbon sequestration. Our study further provides evidence for the high variability of carbon sequestration in different geomorphologies.

5. Conclusions

This study investigated the recent sedimentation and carbon sequestration of four distinct mangrove hydrogeomorphic settings in two Southwest Florida tidal creeks. We found the following: sedimentation rates, calculated with the 210Pb constant rate of supply (CRS) method were lowest in the dwarf mangroves (1.41 mm·year−1) and basin mangroves (1.68–1.58 mm·year−1), and substantially higher in fringe mangroves (2.28–2.23 mm·year−1) and in riverine mangroves (3.04–5.43 mm·year−1). The 210Pb CRS method proved to be more effective than the 137Cs method for estimating sedimentation rates as a result of mobility of 137Cs in marine environments. Our study supports the conclusions of others that mangrove wetlands sequester a disproportionately high amount of carbon per unit area compared to other marine ecosystems and more frequently studied northern boreal peatlands. The mean carbon sequestration rate of our study sites (98 g-C m−2·year−1) is lower than published global averages (174 g-C m−2·year−1) for mangroves, but is consistent with carbon sequestration rates from other South Florida mangrove wetlands. Rates of carbon sequestration were highest in the riverine mangroves, followed by fringe mangroves, and lowest in the basin mangroves, validating the research of others that differences in hydrology and autochthonous production versus allochthonous input can have profound effects on carbon sequestration in tidal mangrove wetlands. Rates of recent carbon sequestration in mangroves were significantly higher in the reference tidal creek (113 g-C m−2·year−1) than in the hydrologically disturbed tidal creek (83 g-C m−2·year−1), suggesting that hydrologic and landscape changes in the upstream watershed can negatively affect carbon sequestration. Only one to two of the seven sampling sites that we investigated may be sustainable with current rates of sea-level rise for this region of Southwest Florida, let alone with any accelerated sea level rise that could occur in the future.

Acknowledgments

This research was supported by Florida Gulf Coast University’s Everglades Wetland Research Park, including support for the Juliet C. Sproul Chair for Southwest Florida Habitat Restoration and Management, and by National Science Foundation, Award CBET 1033451. Jorge Villa, Blanca Bernal, and Li Zhang assisted with laboratory methods and project design. Darryl Marois, Evan Waletzko, Hilary Thompson, Diana Lombana, Olga Connors, and Sarah Tseng assisted in the field and laboratory.

Author Contributions

D. Marchio designed and performed the experiment, provided most of the data analysis, and wrote the first draft of a thesis that resulted in this paper; B. Bovard and M. Savarese assisted with data analysis, field/laboratory techniques, and manuscript editing. W.J. Mitsch. conceived the study, provided laboratory support, and wrote/edited a significant portion of the manuscript.

Conflicts of Interest

The authors declare no conflict of interest.

References

  1. Mitsch, W.J.; Bernal, B.; Nahlik, A.M.; Mander, U.; Zhang, L.; Anderson, C.J.; Jørgensen, S.E.; Brix, H. Wetlands, carbon, and climate change. Landsc. Ecol. 2013, 28, 583–597. [Google Scholar] [CrossRef]
  2. Mitsch, W.J.; Gosselink, J.G. Wetlands, 5th ed.; John Wiley & Sons: Hoboken, NJ, USA, 2015; pp. 311–342. [Google Scholar]
  3. Lal, R. Forest soils and carbon sequestration. For. Ecol. Manag. 2005, 220, 242–258. [Google Scholar] [CrossRef]
  4. Lal, R. Carbon sequestration. Philos. Trans. R. Soc. Lond. B 2008, 363, 815–830. [Google Scholar] [CrossRef] [PubMed]
  5. Howe, A.J.; Rodríguez, J.F.; Saco, P.M. Surface evolution and carbon sequestration in disturbed and undisturbed wetland soils of the Hunter estuary, southeast Australia. Estuar. Coast. Shelf Sci. 2009, 84, 75–83. [Google Scholar] [CrossRef]
  6. Gastusso, J.P.; Frankignoulle, M.; Wollast, R. Carbon and carbonate metabolism in coastal aquatic ecosystems. Annu. Rev. Ecol. Sci. 1998, 29, 405–434. [Google Scholar]
  7. Mitsch, W.J.; Gosselink, J.G.; Zhang, L.; Anderson, C.J. Wetland Ecosystems; John Wiley & Sons: Hoboken, NJ, USA, 2009; pp. 19–86, 163–190. [Google Scholar]
  8. Giri, C.; Ochieng, E.; Tieszen, L.L.; Zhu, Z.; Singh, A.; Loveland, T.; Masek, J.; Duke, N. Status and distribution of mangrove forests of the world using earth observation satellite data. Glob. Ecol. Biogeogr. 2011, 23, 154–159. [Google Scholar] [CrossRef]
  9. Alongi, D.M. Carbon cycling and storage in mangrove forests. Annu. Rev. Mar. Sci. 2014, 6, 195–219. [Google Scholar] [CrossRef] [PubMed]
  10. Wong, P.P.; Losada, I.J.; Gattuso, J.P.; Hinkel, J.; Khattabi, A.; McInnes, K.L.; Saito, Y.; Sallenger, A. Coastal systems and low-lying areas. In Climate Change 2014: Impacts, Adaptation, and Vulnerability. Part A: Global and Sectoral Aspects; Cambridge University Press: Cambridge, UK, 2014; pp. 361–409. [Google Scholar]
  11. Breithaupt, J.L.; Smoak, J.M.; Smith, T.J., III; Sanders, C.J.; Hoare, A. Organic carbon burial rates in mangrove sediments: Strengthening the global budget. Glob. Biogeochem. Cycles 2012, 26. [Google Scholar] [CrossRef]
  12. Chmura, G.L.; Anisfeld, S.C.; Cahoon, D.R.; Lynch, J.C. Global carbon sequestration in tidal, saline wetlands. Glob. Biogeochem. Cycles 2003, 17. [Google Scholar] [CrossRef]
  13. Kristensen, E.; Bouillon, S.; Dittmar, T.; Marchand, C. Organic carbon dynamics in mangrove ecosystems: A review. Aquat. Bot. 2008, 89, 201–219. [Google Scholar] [CrossRef]
  14. Pendleton, L.; Donato, D.C.; Murray, B.C.; Crooks, S.; Jenkins, W.A. Estimating global “Blue Carbon” emissions from conversion and degradation of vegetated coastal ecosystems. PLoS ONE 2012, 7, e43542. [Google Scholar] [CrossRef] [PubMed] [Green Version]
  15. Mcleod, E.; Chmura, G.L.; Bouillon, S.; Salm, R.; Bjork, M.; Duarte, C.M.; Lovelock, C.E.; Schlesiner, W.H.; Silliman, B.R. A blueprint for blue carbon: Toward an improved understanding of the role of vegetated coastal habitats in sequestering CO2. Front. Ecol. Environ. 2011, 9, 552–560. [Google Scholar] [CrossRef] [Green Version]
  16. Keuskamp, J.A.; Schmitt, H.; Laanbroek, H.J.; Verhoeven, J.T.A.; Hefting, M.M. Nutrient amendment does not increase mineralisation of sequestered carbon during incubation of a nitrogen limited mangrove soil. Soil Biol. Biochem. 2013, 57, 822–829. [Google Scholar] [CrossRef]
  17. Berner, R.A. Burial of organic carbon and pyrite sulfur in the modern ocean: Its geochemical and environmental significance. Am. J. Sci. 1982, 282, 451–473. [Google Scholar] [CrossRef]
  18. Jennerjahn, T.C.; Ittekkot, V. Relevance of mangroves for the production and deposition of organic matter along tropical continental margins. Naturwiss 2002, 89, 23–30. [Google Scholar] [CrossRef] [PubMed]
  19. Alongi, D.M. Present state and future of the world’s mangrove forests. Environ. Conserv. 2002, 29, 331–349. [Google Scholar] [CrossRef]
  20. Pil, M.W.; Boeger, M.R.T.; Muschner, V.C.; Pie, M.R.; Ostrensky, A.; Boeger, W.A. Postglacial north-south expansion of populations of Rhizophora mangle (Rhizophoraceae) along the Brazilian coast revealed by microsatellite analysis. Am. J. Bot. 2011, 98, 1031–1039. [Google Scholar] [CrossRef] [PubMed]
  21. Cavanaugh, K.C.; Kellner, J.R.; Forde, A.J.; Gruner, D.S.; Parker, J.D.; Rodriguez, W.; Feller, I.C. Poleward expansion of mangroves is a threshold response to decreased frequency of extreme cold events. Proc. Natl. Acad. Sci. USA 2014, 111, 723–727. [Google Scholar] [CrossRef] [PubMed]
  22. Saintilan, N.; Wilson, N.C.; Rogers, K.L.; Rajkaran, A.; Krauss, K.W. Mangrove expansion and salt marsh decline at mangrove poleward limits. Glob. Chang. Biol. 2014, 20, 147–157. [Google Scholar] [CrossRef] [PubMed]
  23. Mitsch, W.J.; Nahlik, A.M.; Wolski, P.; Bernal, B.; Zhang, L.; Ramberg, L. Tropical wetlands: Seasonal hydrologic pulsing, carbon sequesteration, and methane emissions. Wetl. Ecol. Manag. 2010, 18, 573–586. [Google Scholar] [CrossRef]
  24. Lynch, J.C.; Meriwether, J.R.; McKee, B.A.; Vera-Herrera, F.; Twilley, R.R. Recent accretion in mangrove ecosystems based on 137Cs and 210Pb. Estuaries 1989, 12, 284–299. [Google Scholar] [CrossRef]
  25. Bloom, A.A.; Palmer, P.I.; Fraser, A.; Reay, D.S.; Frankenberg, C. Large-scale controls of methanogenesis inferred from methane and gravity spaceborne data. Science 2010, 327, 322–325. [Google Scholar] [CrossRef] [PubMed]
  26. Odum, E.P. The status of three ecosystem-level hypotheses regarding salt marsh estuaries: Tidal subsidy, outwelling, and detritus-based food chains. In Estuarine Perspectives; Kennedy, V.S., Ed.; Academic Press: New York, NY, USA, 1980; Volume 1, pp. 485–495. [Google Scholar]
  27. Bouillon, S.; Connolly, R.M.; Lee, S.Y. Organic matter exchange and cycling in mangrove ecosystems: Recent insights from stable isotope studies. J. Sea Res. 2008, 59, 44–58. [Google Scholar] [CrossRef] [Green Version]
  28. Duarte, C.M.; Middelburg, J.J.; Caraco, N. Major role of marine vegetation on the oceanic carbon cycle. Biogeosciences 2005, 2, 1–8. [Google Scholar] [CrossRef]
  29. Twilley, R.W.; Chen, R.H.; Hargis, T. Carbon sinks in mangroves and their implications to carbon budget of tropical coastal ecosystems. Water Air Soil Pollut. 1992, 64, 265–288. [Google Scholar] [CrossRef]
  30. Alongi, D.M. Carbon payments for mangrove conservation: Ecosystem constraints and uncertainties of sequestration potential. Environ. Sci. Policy 2011, 14, 462–470. [Google Scholar] [CrossRef]
  31. Lewis, R.R. Ecological engineering for successful management and restoration of mangrove forests. Ecol. Eng. 2005, 24, 403–418. [Google Scholar] [CrossRef]
  32. Kauffman, J.B.; Heider, C.; Cole, T.G.; Dwire, K.A.; Donato, D.C. Ecosystem carbon stocks of Micronesian mangrove forests. Wetlands 2011, 31, 343–352. [Google Scholar] [CrossRef]
  33. Lugo, A.E.; Snedaker, S.C. The ecology of mangroves. Annu. Rev. Ecol. Evol. Syst. 1979, 5, 39–64. [Google Scholar] [CrossRef]
  34. Thom, B.G. Mangrove ecology: A geomorphological perspective. In Mangrove Ecosystem in Australia: Structure, Function, and Management; Clough, B.F., Ed.; Australian National University Press: Canberra, Australia, 1982; pp. 3–18. [Google Scholar]
  35. Twilley, R.W.; Lugo, A.E.; Patterson-Zucca, C. Litter production and turnover in basin mangrove forests in Southwest Florida. Ecology 1986, 67, 670–683. [Google Scholar] [CrossRef]
  36. Schmid, J.R.; Worley, K.; Addison, D.S.; Zimmerman, A.R.; Van Eaton, A. Naples Bay Past and Present: A Chronology of Disturbance to an Estuary; Naples Bay Initiative: Naples, FL, USA, 2005. [Google Scholar]
  37. Isacksson, M.; Erlandsson, B.; Mattsson, S. A 10-year study of the 137Cs distribution in soil and comparison of Cs soil inventory with precipitation-determined deposition. J. Environ. Radioact. 2001, 55, 47–59. [Google Scholar] [CrossRef]
  38. Stark, K.; Wallberg, P.; Nylen, T. Post-depositional redistribution and gradual accumulation of 137Cs in a riparian wetland ecosystem in Sweden. J. Environ. Radioact. 2006, 87, 175–187. [Google Scholar] [CrossRef] [PubMed]
  39. Donato, D.C.; Kauffman, J.B.; Mackenzie, R.A.; Ainsworth, A.; Pfleeger, A.Z. Whole-island carbon stocks in the tropical Pacific: Implications for mangrove conservation and upland restoration. J. Environ. Manag. 2012, 97, 89–96. [Google Scholar] [CrossRef] [PubMed]
  40. Appleby, P.G.; Oldfield, F. The calculation of Lead-210 dates assuming a constant rate of supply of unsupported 210Pb to the sediment. Catena 1978, 5, 1–8. [Google Scholar] [CrossRef]
  41. Richie, J.C.; McHenry, J.R. Application of radioactive fallout Cesium-137 for measuring soil erosion and sediment accumulation rates and patterns: A review. J. Environ. Qual. 1990, 19, 215–233. [Google Scholar] [CrossRef]
  42. Craft, C.B.; Richardson, C.J. Peat accretion and N, P, and organic C accumulation in nutrient-enriched and unenriched Everglades peatlands. Ecol. Appl. 1993, 3, 446–458. [Google Scholar] [CrossRef]
  43. Bernal, B.; Mitsch, W.J. Comparing carbon sequestration in temperate freshwater wetland communities. Glob. Chang. Biol. 2012, 18, 1636–1647. [Google Scholar] [CrossRef]
  44. Bernal, B.; Mitsch, W.J. Carbon sequestration in two created riverine wetlands in the Midwestern United States. J. Environ. Qual. 2013, 42, 1236–1244. [Google Scholar] [CrossRef] [PubMed]
  45. Villa, J.A.; Mitsch, W.J. Carbon sequestration in different wetland plant communities in Southwest Florida. Int. J. Biodivers. Sci. Ecosyst. Serv. Manag. 2015, 11, 17–28. [Google Scholar] [CrossRef]
  46. Odum, E.P. Tidal marshes as outwelling/pulsing systems. In International Symposium: Concepts and Controversies in Tidal Marsh Ecology; Weinstein, M.P., Kreeger, D.A., Eds.; Academic Publishers: Dordrecht, The Netherlands, 2000; pp. 3–7. [Google Scholar]
  47. Furukawa, K.; Wolanski, E.; Mueller, H. Currents and sediment transport in mangrove forests. Estuar. Coast. Shelf Sci. 1997, 44, 301–310. [Google Scholar] [CrossRef]
  48. Adame, M.F.; Lovelock, C.E. Carbon and nutrient exchange of mangrove forests with the coastal ocean. Hydrobiologia 2011, 663, 23–50. [Google Scholar] [CrossRef]
  49. McKee, K.L.; Faulkner, P.L. Restoration of biogeochemical function in mangrove forests. Restor. Ecol. 2000, 8, 247–259. [Google Scholar] [CrossRef]
  50. Koch, M.S.; Snedaker, S.C. Factors influencing Rhizophora mangle (red mangrove) seedling development in Everglades carbonate soils. Aquat. Bot. 1997, 59, 87–98. [Google Scholar] [CrossRef]
  51. Harris, R.J.; Milbrandt, E.C.; Everham, E.M.; Bovard, B.D. The effects of reduced tidal flushing on mangrove structure and function across a disturbance gradient. Estuar. Coasts 2010, 33, 1176–1185. [Google Scholar] [CrossRef]
  52. Carter, M.R.; Burns, L.A.; Cavinger, T.R.; Dugger, K.R.; Fore, P.L.; Hicks, D.B.; Revells, H.L.; Schmidt, T.W. Ecosystems Analysis of the Big Cypress Swamp and Estuaries; Environmental Protection Agency: Athens, GA, USA, 1973. [Google Scholar]
  53. Cabezas, A.; MacDonnell, C; Lasso, A.; Bidalek, F.; Mitsch, W.J. Methane emission from mangroves in SW Florida. Environ. Technol. 2016. in review. [Google Scholar]
  54. National Oceanic and Atmospheric Administration. Sea-Level Trends. Available online: http://tidesandcurrents.noaa.gov/sltrends/sltrends.html (accessed on 3 September 2014).
  55. The Royal Society and the National Academy of Sciences. Climate Change: Evidence and Causes. An Overview from the Royal Society and the US National Academy of Sciences. 2014. Available online: https://royalsociety.org/topics-policy/projects/climate-evidence-causes/?utm_source=social_media&utm_medium=hootsuite&utm_campaign=standard (accessed on 18 October 2014).
  56. Watson, C.S.; White, N.J.; Church, J.A.; King, M.A.; Burgette, R.J.; Legresy, B. Unbated global mean sea-level rise over the satellite altimeter era. Nat. Clim. Chang. 2015. [Google Scholar] [CrossRef]
  57. Callaway, J.C.; DeLaune, R.D.; Patrick, W.H., Jr. Sediment accretion rates from four coastal wetlands along the Gulf of Mexico. J. Coast. Res. 1997, 13, 181–191. [Google Scholar]
  58. Breithaupt, J.L.; Smoak, J.M.; Smith, T.J., III; Sanders, C.J. Temporal variability of carbon and nutrient burial, sediment accretion, and mass accumulation over the past century in a carbonate platform mangrove forests of the Florida Everglades. J. Geophys. Res. Biogeosci. 2014, 119, 2032–2048. [Google Scholar] [CrossRef]
  59. Craft, C.B. Dynamics of nitrogen and phosphorus retention during wetland ecosystem succession. Wetl. Ecol. Manag. 1997, 4, 177–187. [Google Scholar] [CrossRef]
  60. Robbins, J.A. Geochemical and geophysical applications of radioactive lead. Biogeochem. Lead Environ. 1978, 2, 285–393. [Google Scholar]
  61. Lugo, A.E.; Brown, S.L.; Dodson, R.; Smith, T.S.; Shugart, H.H. The Holdridge life zones of the coterminous United States in relation to ecosystem mapping. J. Biogeogr. 1999, 26, 1025–1038. [Google Scholar] [CrossRef]
  62. Sanders, C.J.; Smoak, J.M.; Naidu, A.S.; Araripe, D.R.; Sanders, L.M.; Patchineelam, S.R. Mangrove forest sedimentation and its reference to sea level rise, Cananeia, Brazil. Environ. Earth Sci. 2010, 60, 1291–1301. [Google Scholar] [CrossRef]
  63. Brunskill, G.J.; Zagorskis, I.; Pfitzner, J. Carbon burial rates in sediments and a carbon mass balance for the Herbert River region of the Great Barrier Reef continental shelf, North Queensland, Australia. Estuar. Coast. Shelf Sci. 2002, 54, 677–700. [Google Scholar] [CrossRef]
Figure 1. Map detailing study locations in south Naples, Florida near the Gulf of Mexico, of the two mangrove tidal creeks used in this study: disturbed Hamilton Avenue Creek and reference Susan’s Creek. Also shown are the specific locations of the three hydrogeomorphic settings for mangrove soil sampling near, or on, each of the two tidal creeks. Locations of Naples/Dollar Bays, Gulf of Mexico, the Naples Botanical Garden, and the Everglades Wetland Research Park are also shown.
Forests 07 00116 g001
Figure 2. Average bulk density (g·cm−3) for the past 50 years within soils located in seven different mangrove sites in different hydrogeomorphic settings in the hydrologically disturbed Hamilton Avenue Creek (HA) and the reference Susan’s Creek (SC).
Forests 07 00116 g002
Figure 3. Soil carbon concentration (g-C kg−1) in different mangrove landscapes for hydrologically disturbed Hamilton Avenue Creek (HA) and reference Susan’s Creek (SC).
Forests 07 00116 g003
Figure 4. Soil carbon pools (mean ± standard error) of different mangrove landscapes for hydrologically disturbed Hamilton Avenue Creek (HA) and reference Susan’s Creek (SC). Carbon pools have been calculated to a standard 20 cm depth.
Forests 07 00116 g004
Figure 5. Cesium-137 activity (pCi g−1) graphs with depth for estimating sedimentation in mangroves adjacent to Naples Bay. Figures are shown for (a) riverine reference mangroves; (b) riverine disturbed mangroves; (c) fringe reference mangroves; (d) fringe disturbed mangroves; (e) basin reference mangroves; (f) basin disturbed mangroves; and (g) dwarf reference mangroves.
Forests 07 00116 g005
Figure 6. Lead-210 activity (pCi g−1) graphs with depth for estimating sedimentation in mangroves adjacent to Naples Bay. Figures are shown for (a) riverine reference mangroves; (b) riverine disturbed mangroves; (c) fringe reference mangroves; (d) fringe disturbed mangroves; (e) basin reference mangroves; (f) basin disturbed mangroves; and (g) dwarf reference mangroves.
Forests 07 00116 g006
Figure 7. Carbon sequestration rates for seven different mangrove sites in four different hydrogeological settings for the hydrologically disturbed Hamilton Avenue Creek (HA) and reference Susan’s Creek (SC). Bars depict mean (± standard error) carbon sequestration values (n = 3). Similar letters indicate no statistical differences, alpha equals 0.05.
Forests 07 00116 g007
Table 1. Mangrove tree stem density and diameter at breast height (DBH) of sampled mangrove hydrogeomorphic sites at Susan’s Creek (SC; reference) and Hamilton Avenue Creek (HA; disturbed) adjacent to Naples Bay, Naples, Florida.
SCHA
BasinFringeRiverineBasinFringeRiverine
Tree density (stems m−2)
Rhizophora mangle1.20.390.510.180.460.77
Avicennia germinans0.040.010000
Laguncularia racemosa0.080.030.010.020.180.21
Mean DBH (cm) ± SE.
Rhizophora mangle3.6 ± 0.65.5 ± 0.75.9 ± 0.87.4 ± 0.93.2 ± 0.53.3 ± 0.2
Avicennia germinans10.7 **24.4 **- *- *- *- *
Laguncularia racemosa4.5 ± 0.218.2 ± 1.125 **8.1 ± 0.81.4 ± 0.27.0 ± 0.4
plot size (m)5 × 510 × 1010 × 1010 × 105 × 105 × 7.5
* species not present; ** one single specimen.
Table 2. Soil bulk density (past 50 years), sediment accretion rates (two methods), carbon concentration, carbon pool, and carbon sequestration rates at mangrove study sites at Susan’s Creek (SC; reference) and Hamilton Avenue Creek (HA; disturbed), adjacent to Naples Bay.
Hydrogeomorphic Setting
BasinFringeRiverineDwarf
Tidal CreekSCHASCHASCHASC
bulk density (g·cm−3)0.13 ± 0.0090.78 ± 0.090.23 ± 0.030.25 ± 0.0040.22 ± 0.020.13 ± 0.0050.10 ± 0.003
accretion rate (210Pb) (mm·year−1)1.681.582.282.235.433.041.41
accretion rate (137Cs) (mm·year−1)-7.343.263.673.672.85-
carbon concentration (g-C kg−1)238 ± 340 ± 7232 ± 38131 ± 18143 ± 21324 ± 491 ± 5
carbon pool (kg-C m−2)2.5 ± 0.22.3 ± 0.26.3 ± 1.73.7 ± 0.58.1 ± 0.36.2 ± 0.31.0 ± 0.3
carbon sequestration rate (g-C m−2·year−1)50 ± 447 ± 4127 ± 3374 ± 10162 ± 5126 ± 621 ± 5
Carbon sequestration rates in the last row are estimated by using the 210Pb accretion rates. Mean ± standard errors are shown for bulk density, carbon concentration, carbon pool, and carbon sequestration.
Table 3. Comparison of mangrove carbon sequestration rates in this study with other published local, regional, and global rates of carbon sequestration in mangrove wetlands.
LocationHydrogeomorphic EnvironmentSequestration Rate (g-C m−2·year−1)References
Susan’s Creek (reference tidal creek)Riverine162This study
Fringe127
Basin50
Dwarf21
Hamilton Avenue Creek (disturbed tidal creek)Riverine125This study
Fringe73
Basin47
Global Average 174 ± 23[9]
Global Average 163[11]
Global Average 226 ± 39[15]
Everglades, Southeast Florida 123 ± 19[58]
Rookery Bay, Southwest FloridaFringe69[24]
Rookery Bay, Southwest FloridaFringe99[24]
Henderson Creek, Southwest Florida 20Cahoon and Lynch unpublished
Henderson Creek, Southwest Florida 39Cahoon and Lynch unpublished
Florida Keys 209[57]
Florida Keys 67[57]
Shark River, Southeast Florida 151[58]
Terminos Lagoon, MexicoRiverine137[24]
Tamandare, Brazil 949[62]
Trat, ThailandRiverine600[63]
Hinchinbrook Channel, Australia 26[63]
Hinchinbrook Channel, Australia 336[63]
Irian Jaya, Indonesia 412[63]

