Article

Ecosystem Carbon Stock Loss after Land Use Change in Subtropical Forests in China

1
Key Laboratory of Bamboo and Rattan, International Centre for Bamboo and Rattan, Beijing 100102, China
2
Key Laboratory of Ecosystem Network Observation and Modeling, Institute of Geographic Sciences and Natural Resources Research, Chinese Academy of Sciences, 11A Datun Road, Chaoyang District, Beijing 100101, China
3
Faculty of Environment and Natural Resources, Freiburg University, Tennenbacherstr. 4, 79108 Freiburg, Germany
4
School of Natural Resources, West Virginia University, Morgantown, WV 26506, USA
5
Forest Inventory and Remote Sensing, Georg-August-Universität Göttingen, Büsgenweg 5, 37077 Göttingen, Germany
*
Author to whom correspondence should be addressed.
These authors contributed equally to this work.
Current address: Key Laboratory of Bamboo and Rattan, International Centre for Bamboo and Rattan, Beijing 100102, China
Forests 2016, 7(7), 142; https://doi.org/10.3390/f7070142
Submission received: 11 May 2016 / Revised: 21 June 2016 / Accepted: 7 July 2016 / Published: 12 July 2016
(This article belongs to the Special Issue Climate Change Impacts on the Dynamics of Forest Ecosystems)

Abstract

:
Converting secondary natural forests (SFs) to Chinese fir plantations (CFPs) represents one of the most important (8.9 million ha) land use changes in subtropical China. This study estimated both biomass and soil C stocks in a SF and a CFP that was converted from a SF, to quantify the effects of land use change on ecosystem C stock. After the forest conversion, biomass C in the CFP (73 Mg·ha−1) was significantly lower than that of the SF (114 Mg·ha−1). Soil organic C content and stock decreased with increasing soil depth, and the soil C stock in the 0–10 cm layer accounted for more than one third of the total soil C stock over 0–50 cm, emphasizing the importance of management of the top soil to reduce the soil C loss. Total ecosystem C stock of the SF and the CFP was 318 and 200 Mg·ha−1, respectively, 64% of which was soil C for both stands (205 Mg·ha−1 for the SF and 127 Mg·ha−1 for the CFP). This indicates that land use change from the SF to the CFP significantly decreased ecosystem C stock and highlights the importance of managing soil C.

Graphical Abstract

1. Introduction

Forests act as a continuous carbon (C) sink of 1.9–2.6 Pg C (1 Pg C = 1015 g C) per year (from 1990 to 2007), sequestrating one third of C emissions from fossil fuel and land use changes [1,2,3]. Forest biomass and soils are important C reserves. Soils store a C pool of 3150 Pg C, more than four times that in the vegetation (650 Pg C) and the atmosphere (750 Pg C) pools [4]. However, C loss from global soil respiration has been estimated to be 98 Pg C [5], which is more than 10 times the CO2 emissions from fossil fuel combustion [2]. Therefore, small changes in the soil C pools can significantly affect atmospheric CO2 concentrations and produce positive C-climate feedbacks. These changes can result from forest conversions to other land uses, and changes in precipitation or temperature caused by climate change [6,7].
Land use changes are associated with ecosystem C stock change and are the second largest cause of C losses after fossil fuel combustion [8,9,10]. In recent decades, the land use change resulting from human activities, such as for food or timber production [9,11], has led to significant effects on ecosystem C stocks. For instance, land use change from natural lowland forests to oil palm and rubber plantations not only reduces biomass C, but also reduces the biomass C sequestration capability because the C residue time in natural lowland forests is 3–10 times higher than that of the plantations [12]. China is the largest developing country worldwide and has experienced dramatic land use changes during the past few decades, including conversion of natural forests to fast-growing plantations, forests to croplands and other intensive land uses (e.g., tea and agricultural uses). This resulted from an exploding increase in population and living standards. Consequently, a total of 7 Pg C of soil C has been lost within the first 1-m depth due to the cultivation of natural soil according to the second national soil inventory in China [13]. This amount represents 9.5% of the world’s soil C loss from land use change [13]. On the other hand, this illustrates a great potential of restoring C stock by the management of human activities and forests [13,14]. For example, establishing mixed Michelia macclurei and Cunninghamia lanceolata forests can increase C sequestration by 14%–18% compared to mono-specific stands of Michelia macclurei or Cunninghamia lanceolata [15]. Therefore, quantifying the effects of land use change on C stock is clearly very important in terms of estimating global C cycling [3].
During the last several decades, a large number of native broadleaf forests in Southern China have been cleared, burned and converted to monospecific plantations to meet the increasing demand for timber, fuel materials and forest products [16]. Among these conversions, land use change from secondary natural forests (SFs) to Chinese fir (Cunninghamia lanceolata (Lamb.) Hook) mono-specific plantations (CFPs) represents one of the most important changes [17], because Chinese fir is prized for its good timber quality, fast growth, straight stems and high resistance to bending [18]. CFPs are commonly clear cut at an average short rotation age of about 25 years, although this can vary from about 20 to 30 years depending on site quality and management objectives [19,20]. Until 2013, CFPs covered an area of 8.9 million ha, representing the largest share of total plantation area of 19% in China [21]. Compared to the land use changes from native forests to agricultural ecosystems [10,22], the conversion of SFs to plantations has been less intensively studied [16]. The majority of published studies focused on biomass C or soil C stock separately [16,23] and few studies have investigated the effects on land use change on biomass C and soil C in Chinese fir plantations [24]. In this study, all major components of the ecosystem C pools were quantified to examine ecosystem C stock change after land use change from a SF to a CFP in subtropical China. We hypothesized that the conversion of the SF to the CFP would result in a loss of C stored not only in the tree biomass, but also in the soil. These results aim to provide empirical evidence to inform decision-makers involved in planning for land use change and the management of plantations to improve their capacity to sequester C, not only focusing on biomass C, but also considering soil C.

2. Materials and Methods

2.1. Study Area

The study area is located in Shitai County (29°59′–30°24′ N, 117°12′–117°59′ E), Southern Anhui Province, China, which is a mountainous area with about 80% of forest cover and an elevation from 50 m to 1000 m. It has a mid-subtropical, humid, mountainous climate with distinct seasonality [25]. Annual average temperature is 16 °C, ranging from −13.2 °C to 40.9 °C [26]. The mean precipitation is 1668 mm with high inter-annual variability (1226 mm between the highest year and lowest year), with about 70% of annual precipitation occurring from April to September [25]. The average annual sunshine duration is 1704 h and evaporative capacity is 1256 mm [26].

2.2. Land Use History

Forest conversion from SFs to CFPs during the past few decades has been a very common practice to improve the income of local residents. In the study area, this conversion was even more popular due to the financial support of the local government, the World Bank and the German Development Bank (KfW) in the 1990s. Currently, 80% of timber production comes from CFPs with clear-cutting at an average rotation age of about 25 years (unpublished data from the local Forest Bureau). In this study, SFs dominated by Castanopsis sclerophylla (Lindl.) Schott and mixed with Liquidambar formosana (Hance), Cyclobalanopsis glauca (Thunb.) Oerst and mono-specific CFPs were selected that were growing under similar site conditions and soil parent materials (all plots were within area of about 2 km2). The SF plots originated from a natural regeneration following the harvest of primary forest in the 1960s. The CFP was established in 1996 after clear-cutting of SF (by hand without heavy machines), which was the same forest type of the selected SF. Prior to the planting of one-year-old Chinese fir seedlings, the CFP site was prepared by prescribed burning. Understory and weeds were removed by hand to improve seedling survival rates during the first three years. As the stands developed, suppressed and weak trees were removed by thinning, but branches and leaves were left in the stand.

2.3. Estimation of Aboveground and Belowground Biomass

Five plots were established with a nested circular plot design based on a random selection of 100 m × 100 m systematic grids in the SFs and CFPs. Within a 6 m radius (with a plot area of 113 m2), trees with a diameter at breast height (DBH, 1.3 m) ≥ 10 cm were measured, while trees with DBH ≥ 20 cm were measured within a 10 m radius (with a plot area of 314 m2). To quantify the contribution of trees < 10 cm DBH to total biomass C stock, two 1-m radius circular subplots were positioned in the north and south of the 6-m radius plot to measure trees with DBH < 7 cm, while one 2-m radius subplot was established in the plot center to measure the trees 7 cm ≤ DBH < 10 cm. Trees in sample plots were numbered and assigned to three dominance classes—dominant, co-dominant and suppressed trees. Heights of one or two dominant trees, one co-dominant and one suppressed tree were measured in each plot using a Vertex III height meter (Haglöf, Långsele, Sweden). The crown of dominant trees extended above the general layer of the stand and intercepts direct sunlight across the top and upper branches. The DBH of such trees are usually amongst the largest in the stand. The crowns of co-dominant trees were generally within the main layer and the DBH of such trees was usually close to the stand average. The crowns of suppressed trees were usually entirely below the main canopy and the DBH of such trees were amongst the smallest in the stand [27]. Trees representing the average DBH and height of each dominance class were destructively sampled to develop allometric biomass and leaf area models. More details can be found in Guisasola [28], and the allometric models are given in Table 1. The total aboveground biomass was the sum of stem, branch and leaf. Belowground biomass was estimated using a root/shoot ratio of 0.249 for SFs and 0.246 for CFPs, which is based on a review of Chinese forests [29]. Carbon content of 0.5 g·g−1 was used to convert biomass to C stock [30]. Understory and forest floor litter (including woody debris) were collected in three 40 cm × 40 cm subplots in an equilateral triangle shape in each plot. All understory vegetation, including grass and shrubs (woody plants below the canopy), were uprooted from each plot and processed in the laboratory. The understorey and litter samples were dried at 70 °C to constant weight. Carbon content of 0.465 g·g−1 was used to convert litter mass to litter C while carbon content of 0.5 g·g−1 was used for understory [15,30].

2.4. Soil Sampling and Analysis

In November 2013, soil samples were collected in three soil profiles, which were located in 0°, 120° and 240° directions and 3 m away from the plot centre in each plot. Soil samples were collected down to 50 cm in four layers: 0–10 cm, 10–20 cm, 20–30 cm and 30–50 cm, respectively. Soil samples from the same layer were mixed in the field for each given plot, resulting in a one sample per soil layer per plot. At the same time, soil was cored in each layer of the soil profiles to take volumetric samples for bulk density determination [31]. In the lab, a random selection of 20% of the bulk density samples were selected to determine the stone or rock content, however, these contents were less than 5% in the core samples, thus we did not correct for gravel content. Air-dried mineral soil was sieved through 2-mm and 0.15-mm for soil organic C content analysis after removing identifiable plant residues, root materials and stones.
Soil organic C content was analysed using the K2Cr2O7-H2SO4 wet oxidation method. Briefly, 0.1–0.5 g air dried soil samples passed through a 0.15 mm sieve were digested in 5 mL of 0.8 mol·L−1 K2Cr2O7 and 5 mL concentrated H2SO4 (1.84 g·mL−1) for 5 min at 170–180 °C. Secondly, the digested solution samples were titrated with standardized 0.2 mol·L−1 FeSO4 solution mixed with 15 mL concentrated H2SO4 per litre to prevent oxidization [32,33]. After the analysis, the soil organic C stock (Mg·ha−1) for each layer was calculated using the following formula [34]:
S O C   s t o c k = S O C × B D × D / 10
where SOC is the soil organic C concentration (g·kg−1); BD is bulk density (g·cm−3); D is the depth of the soil layer (cm).

2.5. Statistical Analysis

One-way analysis of variance (ANOVA) was used to examine the effects of land use change on biomass C, soil C contents and stocks and multiple comparisons were conducted with a post hoc Tukey’s-HSD test for soil C contents and stocks at different soil layers. The difference level was set at p < 0.05. All statistical analyses were performed in R [35].

3. Results

3.1. Stand Characteristics of the SF and CFP Stand

The stand density of the CFP (1444 trees·ha1) was significantly higher than that of the SF (930 trees·ha1), while the mean DBH of SF was significantly higher than that of CFP. This resulted in similar basal area, stand volume and LAI for both stands. The mean height of CFP and SF were 12.0 and 12.4 m, respectively. The two stands had a similar soil origin, which was demonstrated by the absence of a significant difference in nitrogen content, porosity and same soil type and texture.

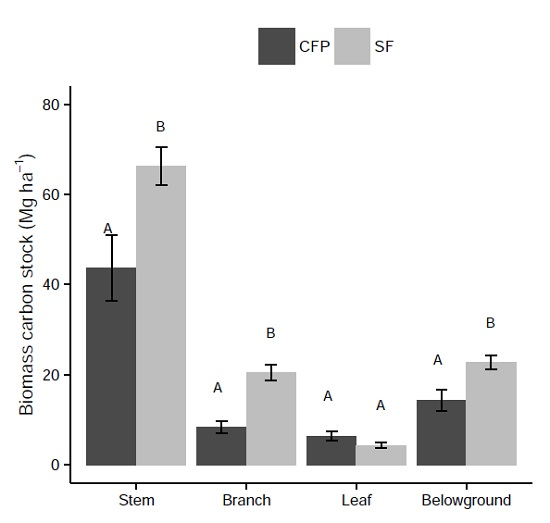
3.2. Effects of Land Use Change on Biomass C Stock

SF biomass C from stems, branches and belowground was significantly higher than that of CFP (Figure 1, all p ≤ 0.028), while leaf C stocks were not significantly different (p = 0.116). The total biomass C stock was 114 Mg·ha−1 for SFs and 73 Mg·ha−1 for CFPs (Figure 1). Stems contained the most C, amounting to about 60% of total biomass C stock in both stands, while leaf C contributed the least at only 4% for SFs and 9% for CFPs.

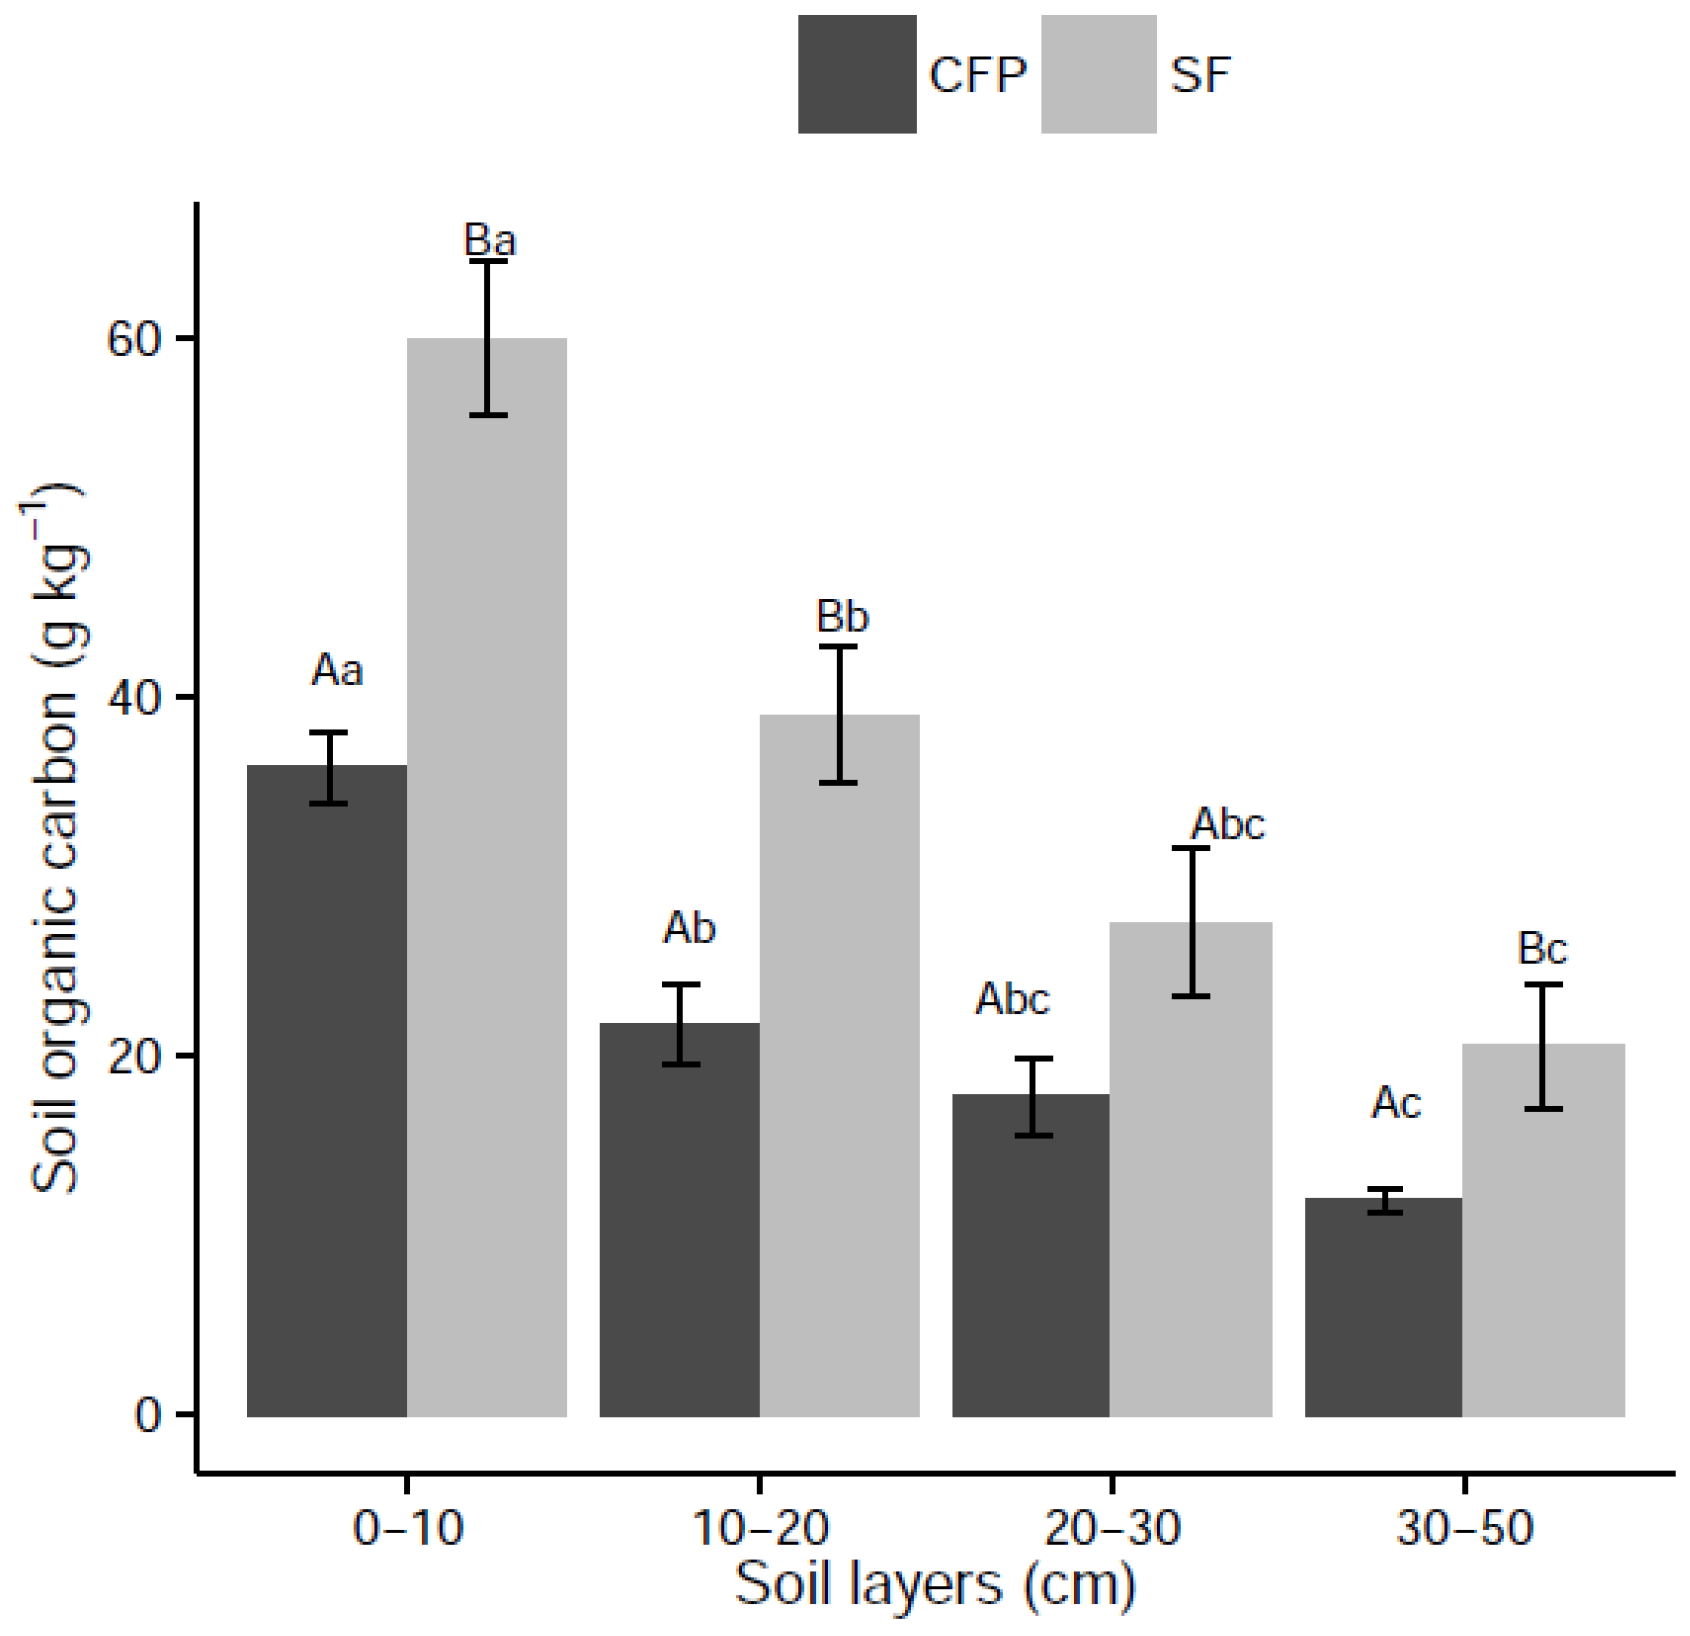
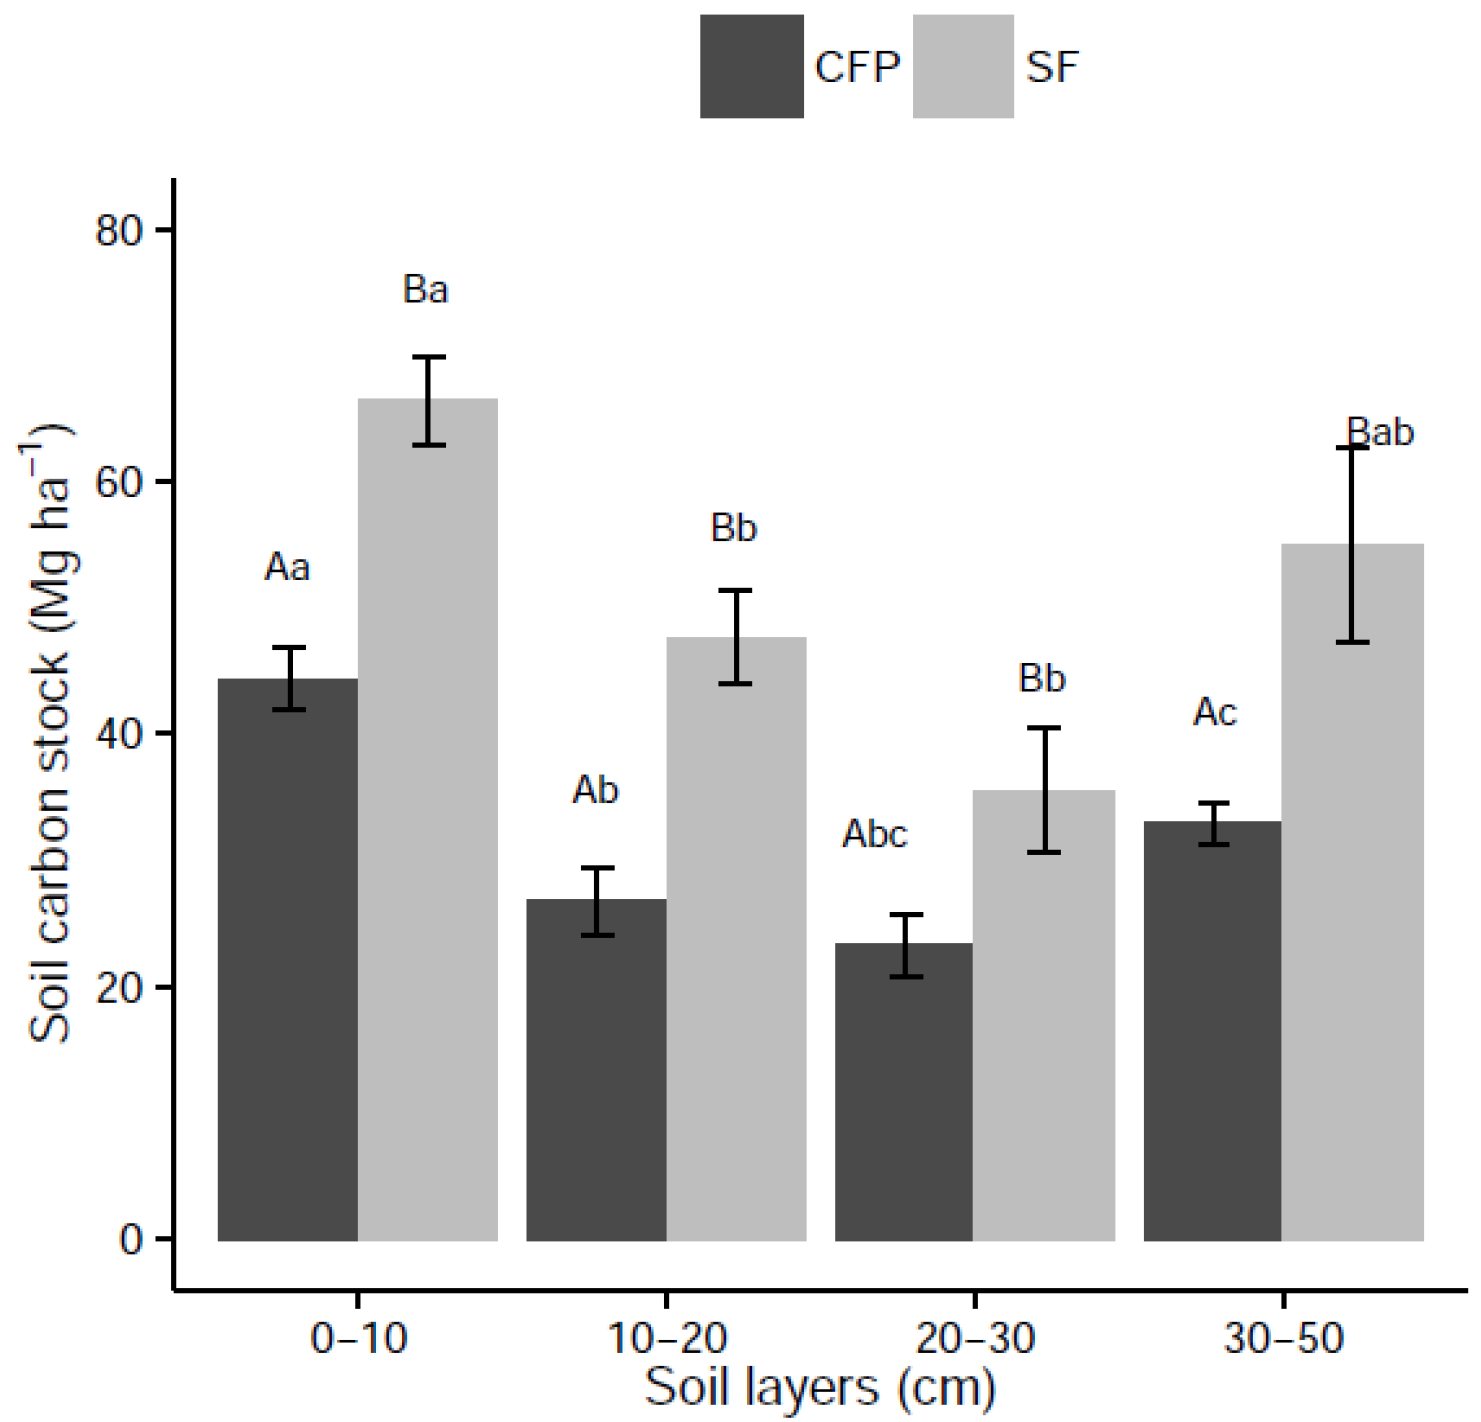
3.3. Effects of Land Use Change on Soil C Stock

Between the two stands, soil organic C content in SFs was significantly (or nearly significantly; p = 0.07 for 20–30 cm) higher than that of CFPs in all soil layers (Figure 2). Specifically, after the land use change, the soil C content in 0–10 cm declined significantly from 60 g·kg1 for the SF to 36 g·kg1 for the CFP. Similarly, soil C contents in 10–20 cm, 20–30 cm and 30–50 cm were 39, 27 and 21 g·kg1 for the SF, respectively, which were 80%, 72% and 54% higher than those for the CFP.
Within the same stand, soil C content in the 0–10 cm layer was significantly higher than that of the other sub-layers for both stands (p < 0.01). There was no significant difference in SOC concentration between 10–20 cm and 20–30 cm (p = 0.20 for SFs and p = 0.46 for CFPs), as well as 20–30 cm and 30–50 cm (p = 0.62 for SFs and p = 0.17 for CFPs).
Similarly, soil C stock declined with soil depth over the 0–30 cm depth, but not for 30–50 cm because the soil depth interval was different from that above 30 cm (Figure 3). Land use change significantly reduced soil C stock for each soil layer (all p < 0.05). Specifically, soil C stock for 0–10 cm decreased from 66 Mg·ha−1 for the SF to 44 Mg·ha−1 for the CFPs. Similarly, soil C stocks of the SF in 10–20 cm, 20–30 cm and 30–50 cm were 47, 36 and 55 Mg·ha−1, respectively, which were significantly higher than those of the CFP with 27, 23 and 33 Mg·ha−1(p < 0.05), respectively.
Soil C stock in the 0–10 cm layer was significantly higher than that at 10–20 cm and 20–30 cm for the two stands. Soil C stock at 0–10 cm accounted for 34% and 38% of total soil C stock over 0–50 cm for the SFs and CFPs, respectively. The total soil C stock of SFs over the 0–50 cm layer was 205 Mg·ha−1, which was 38% higher than that of CFPs (127 Mg·ha−1).

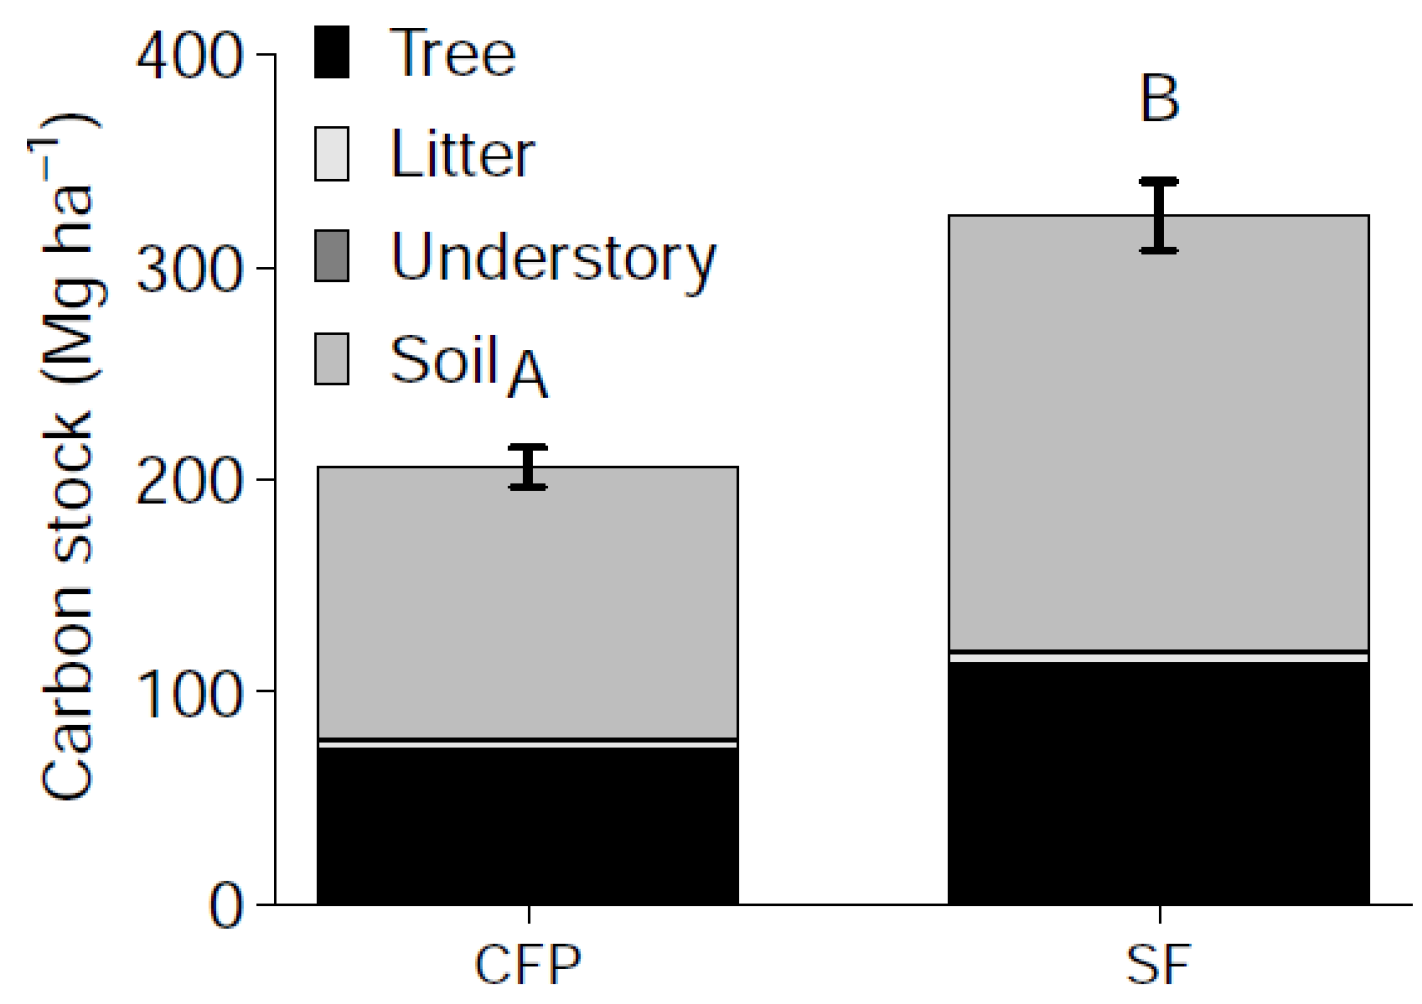
3.4. Effects of Land Use Change on Total Ecosystem C Stocks

Land use change significantly reduced total ecosystem C stock (Figure 4). Total ecosystem C stock was 318 Mg·ha−1 for the SFs, which was 37% higher than that for the CFPs (200 Mg·ha−1). Soil C stock was the main contributor to total C stocks (about 64% for both stands). The understory made only a very negligible contribution to the C stock with 1.5 Mg·ha−1 for SFs and 1 Mg·ha−1 for CFPs. However, land use change did not significantly change the litter C stock, which was 4 Mg·ha−1 and 5 Mg·ha−1 for SFs and CFPs, respectively.

4. Discussion

4.1. Land Use Change Decreased Biomass C

This study demonstrated a significant loss of biomass C after conversion to CFP, which is similar to previous observations [36,37]. Forest conversion led to a reduction in biomass C by 41 Mg·ha−1. Similar changes in biomass C following a land use change in Sumatra were attributed to differences in canopy height, mean stand DBH, wood density, and stand density [12]. However, while the stand density of the SFs was lower than that of the CFPs, its mean stand DBH was significantly higher (Table 2). As a result, the two stands had similar stand basal area and stand volume. Therefore, the difference in biomass C after the land use change from the SF to the CFP resulted from differences in wood density in this study. The wood density was 0.40 g·m−3 for C. lanceolata and 0.64 g·m−3 for C. sclerophylla at these sites [38].
Stand age is another important factor influencing biomass C. In this study, the SF was 54 years old while the CFP was 17 years old, according to stem analyses in the same stand [38]. Biomass C often increases with stand age and the annual biomass C increment reaches its maximum relatively early in the life of the stand [39,40]. The mean biomass C of the SFs was 2.1 Mg·ha−1·year−1, which was significantly lower than that of the CFPs (4.3 Mg·ha−1·year−1, p = 0.015). Therefore, at similar stand ages of CFPs and SFs, the biomass C pool in CFPs is not necessarily lower than that of the SFs. For example, aboveground biomass C was 111 Mg·ha−1 (equaling 222 Mg·ha−1 biomass) in a 40-year CFP in subtropical China [39], which is higher than that of the SFs in this study (91 Mg·ha−1). However, this age effect could not be tested in this study because the study area did not contain any SFs with similar site conditions, forest origin as the CFP.

4.2. Land Use Change Reduced Soil C

In this study, soil C stock was the main component of ecosystem C stock, accounting for 64% of total ecosystem C stocks for both stands, which felled within the report range of the ratio of soil C and total ecosystem C stock (Table 3). However, the ratio of soil C and total ecosystem C stock varied significantly among different forest types (Table 3). A part of this high variability results from differences in the depth of soil sampling, commonly down to 50–100 cm [17,41,42], tree species and forest age [43].
Previous studies have indicated that the conversion from native forests to plantations decreased soil C stock [51]. Globally, land use change from native forests to plantations decreases SOC stock by about 13% [11]. In our study, land use change from SFs to CFPs decreased soil C stock by 38% within 0–50 cm (Figure 2), much higher than the global average [11]. A possible reason is that high rates of soil erosion occur at the observed site due to the high precipitation [52]. Soil C stock within the depth of 0–10 cm amounted for more than one third of total soil C stock, highlighting the high risk of losing the top soil C and the importance of managing the top soil to reduce soil C loss. Soil C stock in the SFs was significantly higher than that of the CFPs for all soil layers (p < 0.05, Figure 3), showing that the conversion of SFs to CFPs not only reduced top soil C stock (0–10 cm), but also that of the sub-layers down to 50 cm, which is consistent with a similar study showing that the conversion of native forest to popular plantation reduced soil C stock down to a depth of 55 cm [53]. However, this finding is inconsistent with Yang et al. (2004), who pointed out that the conversion of secondary forests to rubber plantations did not change the soil C stock deeper than 40 cm. This study also differs from Gelaw, Singh and Lal [22], where there was no significant difference in the soil C stock of different agroforestry ecosystems when the soil was deeper than 30 cm because the soil disturbances only happened in the top layer of the soil.
The factors attributed to the decline in soil C stock after the conversion from the SF to the CFP are very complex. First, soil C stock loss may partly result from site preparation after clear-cutting. To improve soil structure, survival rate and the growth of young Chinese fir seedlings, site preparation was done by digging 20–30 cm deep planting holes. These soil disturbances can significantly increase the decomposition of soil organic C by breaking down the physical protection of soil C [11,54], and increasing the frequency of erosion after rainfall, especially within the first few years [52]. Secondly, prescribed burning can lead to a loss of soil C due to reduced litter input. Sites were burnt before planting young seedling to improve seedling survival and growth rates. Burning reduces soil C stock and additionally aggravates soil erosion due to a lack of understorey and soil bareness [17]. This result is comparable to Chen and Wang [52], who observed a 7% loss of soil C stock after prescribed burning, and another 10% after four years due to soil erosion in the newly established CFP. Similarly, Ma et al. [55] found that soil C stock loss in prescribed burning sites was 7 times compared to that of unburned CFP after six years. However, the survival rates of the young seedlings was 93% after prescribed burning, which was significantly higher than that of the unburned sites [55]. Third, new plantations often suffer from a significant loss of soil C stock due to: (1) destruction of the existing litter layer when seedlings are planted; (2) a significant decrease in litterfall input before crown closure; and (3) an increasing soil organic C mineralization rate [52]. In addition, inter-specific differences of dominant species in C allocation to belowground and fine root biomass turnover may partly explain the differences to soil C loss [11,56].

4.3. Implication for Forest Management

In order to meet the increasing demand for timber and to mitigate the effects of climate change, large areas of plantations have been established since the 1960s on clear-cut sites of natural forests and there has been continuous debate about how to manage these plantations. Although many studies indicate that establishing plantations can lead to higher C sequestration capabilities due to fast growth rates, most studies either estimate the tree biomass C or soil C stock following the forest conversion, but not both [12,17,41]. In this study, if the mean biomass C stock is used to represent the annual biomass C stock increment for the young forests [57], the net biomass C sequestration is 36 Mg·ha−1 for the SFs and 73 Mg·ha−1 for the CFPs, which would not compensate the loss of soil C (77 Mg·ha−1). This result indicates that the CFP suffered from a loss of total ecosystem C stock compared to SF due to the significant decline in soil C following the forest conversion. This argues against the replacement of natural forests by the (short rotation) plantations as a means of climate change mitigation.
Assuming that the soil C stock reaches an equilibrium (or near-equilibrium) of the SF 50 years after forest conversion [11,23,58], and mean biomass C represents the mean annual biomass C increment [57], the biomass C sequestration was 106 Mg·ha−1 for the SF. The value was significantly lower than that of the CFPs (215 Mg·ha−1), indicating that the CFPs accumulate more C in biomass compared to the SFs. These results further indicate that in terms of ecosystem C stock, increasing the rotation age of the CFPs could not only recover and increase biomass C and soil C stock, but also increase the tree dimensions and economic benefits to the plantation owners. However, this is only a case study in CFPs, further studies are still needed on a broad scale. Currently, plantation owners prefer short rotations because of economic benefits and land policy in China. On the other hand, management of plantations, such as fertilization and thinning, may be another choice to improve the ecosystem C stocks.

5. Conclusions

This study estimated C stock in biomass and soil after the land use change from SF to CFP, which contributes to our understanding of the effects of land use change on the C stock at the ecosystem level. Both biomass C stock and soil C stock decreased after the conversion of the SF to the CFP, indicating a loss of total ecosystem C stock in the converted CFP. Soil C stock in the SF was significantly higher than that of the CFP in all soil layers, suggesting that the forest conversion not only affected the soil C in the top layers, but also the soil C stock in sub-layers down to 50 cm. Soil C stock in the 0–10 cm layer was significantly higher than that of the deeper sub-layers, demonstrating the high risk of soil C loss from the surface layer after the land use change.
Increasing rotation age can potentially increase ecosystem C stock, however, this conclusion is based on assumptions from previous studies because the sample trees in the inventory plots and soil were measured only once. Repeated measurements of the sample plots, re-sampling of the soil and re-measurements of different rotation ages of CFPs are the next research topics.

Acknowledgments

This study was supported by “Twelfth Five-year” National Technology Support Program (2012BAD23B04), special research fund of International Centre for Bamboo and Rattan (1632013010), Sino-German Cooperation on Innovative Technologies and Service Capacities of Multifunctional Forest Management (Lin2Value 033L049-CAFYBB2012013) supported by the Federal Ministry of Education and Research (BMBF) and Chinese Academy of Forestry. We would thank Lutz Fehrmann, Hans Fuchs, Sabine Schreiner, Haijun Yang, Torsten Vor and Dengkui Mo from Georg-August-Universität Göttingen for plot design and fieldwork support. We also would thank Director An’guo Fan, Bailing Ding, Yue’e Chu from Shitai Forest bureau for kind organization for fieldwork. Thanks to Xiaozhu Wang, Hongbing Ruan for fieldwork support. At last, we would like to take this opportunity to express our great thanks to the two reviewers.

Author Contributions

X.T. X.X. and D.I.F. conceived and designed the experiments; X.T. and F.G. performed the experiments; X.T. X.X. and S.F. analyzed the data; S.F., F.G. W.M. and X.T. wrote the paper. All authors contributed to review the manuscript. D.I.F. and W.M. contributed to language proof.

Conflicts of Interest

The authors declare no conflict of interest.

Abbreviations

The following abbreviations are used in this manuscript:
Ccarbon
SOCsoil organic carbon
CFPChinese fir plantation
SFsecondary forest
CO2carbon dioxide

References

  1. Pan, Y.; Birdsey, R.A.; Fang, J.; Houghton, R.; Kauppi, P.E.; Kurz, W.A.; Phillips, O.L.; Shvidenko, A.; Lewis, S.L.; Canadell, J.G.; et al. A large and persistent carbon sink in the world’s forests. Science 2011, 333, 988–993. [Google Scholar] [CrossRef] [PubMed]
  2. IPCC. Climate Change 2007: Synthesis Report; Contribution of Working Groups I, II and III to the Fourth Assessment Report of the Intergovernmental Panel on Climate Change; IPCC: Geneva, Switzerland, 2007; pp. 36–41. [Google Scholar]
  3. Houghton, R.A. Balancing the global carbon budget. Annu. Rev. Earth Planet. Sci. 2007, 35, 313–347. [Google Scholar] [CrossRef]
  4. Luo, Y.; Zhou, X. Soil Respiration and the Environment; Academic Press: San Diego, CA, USA, 2006; pp. 18–20. [Google Scholar]
  5. Bond-Lamberty, B.; Thomson, A. Temperature-associated increases in the global soil respiration record. Nature 2010, 464, 579–582. [Google Scholar] [CrossRef] [PubMed]
  6. Jobbágy, E.G.; Jackson, R.B. The vertical distribution of soil organic carbon and its relation to climate and vegetation. Ecol. Appl. 2000, 10, 423–436. [Google Scholar]
  7. Van der Werf, G.R.; Morton, D.C.; DeFries, R.S.; Olivier, J.G.J.; Kasibhatla, P.S.; Jackson, R.B.; Collatz, G.J.; Randerson, J.T. CO2 emissions from forest loss. Nat. Geosci. 2009, 2, 737–738. [Google Scholar] [CrossRef]
  8. Watson, R.T.; Noble, I.R.; Bolin, B.; Ravindranath, N.; Verardo, D.J.; Dokken, D.J. Land Use, Land-Use Change, and Forestry: A Special Report of the Intergovernmental Panel on Climate Change; Cambridge University Press: Cambridge, UK, 2000. [Google Scholar]
  9. Fu, X.; Shao, M.; Wei, X.; Horton, R. Soil organic carbon and total nitrogen as affected by vegetation types in Northern Loess Plateau of China. Geoderma 2010, 155, 31–35. [Google Scholar] [CrossRef]
  10. Lozano-García, B.; Parras-Alcántara, L. Land use and management effects on carbon and nitrogen in Mediterranean Cambisols. Agric. Ecosyst. Environ. 2013, 179, 208–214. [Google Scholar]
  11. Guo, L.B.; Gifford, R.M. Soil carbon stocks and land use change: A meta analysis. Glob. Chang. Biol. 2002, 8, 345–360. [Google Scholar] [CrossRef]
  12. Kotowska, M.M.; Leuschner, C.; Triadiati, T.; Meriem, S.; Hertel, D. Quantifying above- and belowground biomass carbon loss with forest conversion in tropical lowlands of Sumatra (Indonesia). Glob. Chang. Biol. 2015, 21, 3620–3634. [Google Scholar] [CrossRef] [PubMed]
  13. Wu, H.; Guo, Z.; Peng, C. Land use induced changes of organic carbon storage in soils of China. Glob. Chang. Biol. 2003, 9, 305–315. [Google Scholar] [CrossRef]
  14. Post, W.M.; Kwon, K.C. Soil carbon sequestration and land-use change: Processes and potential. Glob. Chang. Biol. 2000, 6, 317–327. [Google Scholar] [CrossRef]
  15. Wang, Q.K.; Wang, S.L.; Zhong, M.C. Ecosystem carbon storage and soil organic carbon stability in pure and mixed stands of Cunninghamia lanceolata and Michelia macclurei. Plant Soil 2013, 370, 295–304. [Google Scholar] [CrossRef]
  16. Yang, Y.; Guo, J.; Chen, G.; Yin, Y.; Gao, R.; Lin, C. Effects of forest conversion on soil labile organic carbon fractions and aggregate stability in subtropical China. Plant Soil 2009, 323, 153–162. [Google Scholar] [CrossRef]
  17. Guan, F.; Tang, X.; Fan, S.; Zhao, J.; Peng, C. Changes in soil carbon and nitrogen stocks followed the conversion from secondary forest to Chinese fir and Moso bamboo plantations. Catena 2015, 133, 455–460. [Google Scholar] [CrossRef]
  18. Zhao, M.; Xiang, W.; Peng, C.; Tian, D. Simulating age-related changes in carbon storage and allocation in a Chinese fir plantation growing in southern China using the 3-PG model. For. Ecol. Manag. 2009, 257, 1520–1531. [Google Scholar] [CrossRef]
  19. Zhang, X.Q.; Kirschbaum, M.U.F.; Hou, Z.H.; Guo, Z.H. Carbon stock changes in successive rotations of Chinese fir (Cunninghamia lanceolata (lamb) hook) plantations. For. Ecol. Manag. 2004, 202, 131–147. [Google Scholar] [CrossRef]
  20. Wu, Z.L. Chinese-Fir; China Forestry Publishing House: Beijing, China, 1984; p. 583. (In Chinese) [Google Scholar]
  21. State Forestry Administration. Report for Chinese Forest Resource—The 8th National Forest Inventory; China Forestry Publishing House: Beijing, China, 2014; p. 94. (In Chinese)
  22. Gelaw, A.M.; Singh, B.R.; Lal, R. Soil organic carbon and total nitrogen stocks under different land uses in a semi-arid watershed in Tigray, Northern Ethiopia. Agric. Ecosyst. Environ. 2014, 188, 256–263. [Google Scholar] [CrossRef]
  23. Cook, R.L.; Binkley, D.; Mendes, J.C.T.; Stape, J.L. Soil carbon stocks and forest biomass following conversion of pasture to broadleaf and conifer plantations in southeastern Brazil. For. Ecol. Manag. 2014, 324, 37–45. [Google Scholar] [CrossRef]
  24. Yang, Y.S.; Guo, J.F.; Chen, G.S.; Xie, J.S.; Gao, R.; Li, Z.; Jin, Z. Carbon and nitrogen pools in Chinese fir and evergreen broadleaved forests and changes associated with felling and burning in mid-subtropical China. For. Ecol. Manag. 2005, 216, 216–226. [Google Scholar] [CrossRef]
  25. Geng, T.S.; Wang, H.H. Research on the water and soil conservation in Shitai County of Anhui Province. J. Anhui Agric. Sci. 2011, 39, 451–452, 482. (In Chinese) [Google Scholar]
  26. Lu, C.M. Rock-soil geochemical features for Dashan Area, Shitai, Anhui. Geol. Anhui 2010, 20, 120–125. (In Chinese) [Google Scholar]
  27. Tang, X.; Lu, Y.; Fehrmann, L.; Forrester, D.I.; Guisasola-Rodríguez, R.; Pérez-Cruzado, C.; Kleinn, C. Estimation of stand-level aboveground biomass dynamics using tree ring analysis in a Chinese fir plantation in Shitai County, Anhui Province, China. New For. 2015, 47, 319–332. [Google Scholar] [CrossRef]
  28. Guisasola, R. Allometric Biomass Equations and Crown Architecture in Mixed-Species Forests of Subtropical China; Albert-Ludwigs Universität Freiburg: Freiburg, Germany, 2014. [Google Scholar]
  29. Luo, Y.J.; Wang, X.K.; Zhang, X.Q.; Booth, T.H.; Lu, F. Root: shoot ratios across China’s forests: Forest type and climatic effects. For. Ecol. Manag. 2012, 269, 19–25. [Google Scholar] [CrossRef]
  30. Fang, J.Y.; Wang, G.G.; Liu, G.H.; Xu, S.L. Forest biomass of China: An estimate based on the biomass-volume relationship. Ecol. Appl. 1998, 8, 1084–1091. [Google Scholar]
  31. Zhang, W.R.; Yang, G.Y.; Tu, X.N.; Zhang, P. Determination of Forest Soil Water-Physical Properties; China Standard Press: Beijing, China, 1999; Volume 1999, pp. 21–24. (In Chinese) [Google Scholar]
  32. Zhang, W.R.; Yang, G.Y.; Tu, X.N.; Zhang, P. Determinatlon of organic matter in forest soil and calculation carbon-nitrogen ratio. In Standards of Forest Soil Measurement; Zhang, W.R., Yang, G.Y., Tu, X.N., Zhang, P., Eds.; China Standard Press: Beijing, China, 1999; Volume 1999, pp. 105–108. (In Chinese) [Google Scholar]
  33. Zhang, L.H.; Xie, Z.K.; Zhao, R.F.; Wang, Y.J. The impact of land use change on soil organic carbon and labile organic carbon stocks in the Longzhong region of Loess Plateau. J. Arid Land 2012, 4, 241–250. [Google Scholar]
  34. Xie, Z.; Zhu, J.; Liu, G.; Cadisch, G.; Hasegawa, T.; Chen, C.; Sun, H.; Tang, H.; Zeng, Q. Soil organic carbon stocks in China and changes from 1980s to 2000s. Glob. Chang. Biol. 2007, 13, 1989–2007. [Google Scholar] [CrossRef]
  35. Team, R.C.R. A Language and Environment for Statistical Computing; R Foundation for Statistical Computing: Vienna, Austria. Available online: http://www.R-project.org/ (accessed on 6 March 2015).
  36. Liao, C.; Luo, Y.; Fang, C.; Li, B. Ecosystem carbon stock influenced by plantation practice: Implications for planting forests as a measure of climate change mitigation. PLoS ONE 2010, 5, e10867. [Google Scholar] [CrossRef] [PubMed]
  37. Arevalo, C.B.M.; Bhatti, J.S.; Chang, S.X.; Sidders, D. Ecosystem carbon stocks and distribution under different land-uses in north central Alberta, Canada. For. Ecol. Manag. 2009, 257, 1776–1785. [Google Scholar] [CrossRef]
  38. Tang, X. Estimation of Biomass, Volume and Growth of Subtropical Forests in Shitai County, China; Georg-August-University Göttingen: Göttingen, Germany, 2015. [Google Scholar]
  39. Chen, G.S.; Yang, Z.J.; Gao, R.; Xie, J.S.; Guo, J.F.; Huang, Z.Q.; Yang, Y.S. Carbon storage in a chronosequence of Chinese fir plantations in southern China. For. Ecol. Manag. 2013, 300, 68–76. [Google Scholar] [CrossRef]
  40. Acker, S.A.; Halpern, C.B.; Harmon, M.E.; Dyrness, C.T. Trends in bole biomass accumulation, net primary production and tree mortality in Pseudotsuga menziesii forests of contrasting age. Tree Physiol. 2002, 22, 213–217. [Google Scholar] [CrossRef] [PubMed]
  41. Zhang, J.; Wang, X.; Wang, J. Impact of land use change on profile distributions of soil organic carbon fractions in the Yanqi Basin. Catena 2014, 115, 79–84. [Google Scholar] [CrossRef]
  42. Lou, Y.; Xu, M.; Chen, X.; He, X.; Zhao, K. Stratification of soil organic C, N and C:N ratio as affected by conservation tillage in two maize fields of China. Catena 2012, 95, 124–130. [Google Scholar] [CrossRef]
  43. Ming, A.; Liu, S.; Nong, Y.; Cai, D.; Jia, H.; Huang, D.; Wang, Q.; Nong, Z. Comparison of carbon storage in juvenile monoculture and mixed plantation stands of three common broadleaved tree species in subtropical China. Acta Ecol. Sin. 2015, 35, 180–188. (In Chinese) [Google Scholar] [CrossRef]
  44. Hu, Y.L.; Zeng, D.H.; Fan, Z.P.; Chen, G.S.; Zhao, Q.; Pepper, D. Changes in ecosystem carbon stocks following grassland afforestation of semiarid sandy soil in the southeastern Keerqin Sandy Lands, China. J. Arid Environ. 2008, 72, 2193–2200. [Google Scholar] [CrossRef]
  45. Li, K.R.; Wang, S.Q.; Cao, M.K. Carbon stock in vegetation and soil in China. Sci. China Ser. D Earth Sci. 2003, 33, 72–80. (In Chinese) [Google Scholar]
  46. Wang, H.; Huang, Y.; Feng, Z.; Wang, S. C and N stocks under three plantation forest ecosystems of Chinese fir, Michelia macclurei and their mixture. Front. For. China 2007, 2, 251–259. [Google Scholar] [CrossRef]
  47. Bing, K.; Shirong, L.; Daoxiong, C.; Lihua, L. Characteristics of biomass, carbon accumulation and its spatial distribution in Cunninghamia lanceolata forest ecosystem in low subtropical area. Sci. Silvae Sin. 2009, 45, 147–153. (In Chinese) [Google Scholar]
  48. Xiao, F.M.; Fan, S.H.; Wang, S.L.; Xiong, C.Y.; Zhang, C.; Liu, S.P.; Zhang, J. Carbon storage and spatial distribution in Phyllostachy pubescens and Cunninghamia lanceolata plantation ecosystem. Acta Ecol. Sin. 2007, 27, 2794–2801. (In Chinese) [Google Scholar]
  49. Ji, Y.; Guo, K.; Ni, J.; Xu, X.; Wang, Z.; Wang, S. Current forest carbon stocks and carbon sequestration potential in Anhui Province, China. Chin. J. Plant Ecol. 2016, 40, 395–404. [Google Scholar]
  50. Huang, C.; Zhang, J.; Yang, W.; Zhang, G. Characteristics of carbon stock in artificial forest ecosystem in Sichuan Province of China. Chin. J. Appl. Ecol. 2008, 19, 1644–1650. (In Chinese) [Google Scholar]
  51. Wang, S.; Wang, X.; Ouyang, Z. Effects of land use, climate, topography and soil properties on regional soil organic carbon and total nitrogen in the Upstream Watershed of Miyun Reservoir, North China. J. Environ. Sci. 2012, 24, 387–395. [Google Scholar] [CrossRef]
  52. Chen, J.N.; Wang, S.L. Dynamic of soil carbon pool in Cunninghamia lanceolata plantation: Recent advances and future prospects. Guangxi For. Sci. 2007, 36, 147–151. (In Chinese) [Google Scholar]
  53. Ferré, C.; Comolli, R.; Leip, A.; Seufert, G. Forest conversion to poplar plantation in a Lombardy floodplain (Italy): Effects on soil organic carbon stock. Biogeosci. Discuss. 2014, 11, 9601–9627. [Google Scholar]
  54. Wang, Q.; Wang, S.; Yu, X. Decline of soil fertility during forest conversion of secondary forest to Chinese Fir plantations in subtropical China. Land Degrad. Dev. 2011, 22, 444–452. [Google Scholar] [CrossRef]
  55. Ma, X.; Yang, Y.; Lin, K.; Liu, A.; He, Z. Effect of different ground clearance on Chinese fir plantation ecosystems. Acta Ecol. Sin. 1996, 17, 176–183. [Google Scholar]
  56. Lugo, A.; Brown, S. Management of tropical soils as sinks or sources of atmospheric carbon. Plant Soil 1993, 149, 27–41. [Google Scholar] [CrossRef]
  57. Meng, X. Forest Mensuration, 3rd ed.; China Forestry Publishing House: Beijing, China, 2006. [Google Scholar]
  58. Liu, S.L.; Fu, B.J.; Chen, L.D.; Lu, Y.H.; Ma, K.M. Effects of land use changes on soil properties in Wolong Nature Reserve. Geogr. Res. Aust. 2002, 21, 682–688. (In Chinese) [Google Scholar]
Figure 1. Effects of land use change on the C stock of stems, branches, leaves and belowground biomass. The error bars are the standard error of the mean (n = 5) and different capital letters (A and B) above the bars indicate significant differences between the SFs and CFPs (p < 0.05).
Forests 07 00142 g001
Figure 2. Effects of land use change on soil organic C content. The error bars are the standard error of the mean (n = 5). Different capital letters (A and B) above the bars indicate significant differences in soil organic C content between SFs and CFPs, while lowercase letters (a and b) indicate significant differences among soil layers based on Tukey’s HSD tests (p < 0.05).
Forests 07 00142 g002
Figure 3. Effects of land use change on soil C stock. The error bars are the standard error of the mean (n = 5). The different capital letters (A and B) above the bars indicate significant differences in soil organic C stock between SFs and CFPs, while lowercase letters (a and b) indicate significant differences among soil layers based on Tukey’s HSD tests (p < 0.05).
Forests 07 00142 g003
Figure 4. Effects of land use change on total ecosystem C stock. The error bars indicate the standard error of total ecosystem C (n = 5). The capital letters (A and B) above the error bar indicate the significant difference at a level of 0.01.
Forests 07 00142 g004
Table 1. Allometric models used for aboveground biomass and leaf area (LA) estimation [28].
SpeciesComponentsModelR2adjnRMSE
Cunninghamia lanceolataStem0.0202 × (DBH2·H)0.9670.9764120.0179
Branch0.0118 × DBH3.742 × H−1.6030.9722120.0294
Leaf0.0319 × DBH3.207 × H−1.5110.9522120.0363
LA0.1635 × DBH3.2532 × H−1.53340.9500120.0351
Castanopsis sclerophyllaStem0.0240 × (DBH2·H)1.01230.9795240.0213
Branch0.0471 × DBH2.1870.8889240.0863
Leaf0.102 × DBH1.873 × H−0.7310.8138240.0735
LA0.4040 × DBH1.41930.7501240.0969
H is the total tree height (m); DBH is the diameter at breast height (1.3 m) in cm; LA is the leaf area (m2); R2adj is the adjusted coefficient of determination; n is the sample size and RMSE is the root mean square error.
Table 2. Stand and soil characteristics of the SF and CFP stands (means ± standard errors).
StandSFCFPF Valuesp Values
N (trees·ha−1)930 ± 73 a1444 ± 342 a2.1630.18
DBH (cm)22.3 ± 0.3 a18.5 ± 0.8 b20.490.002
H (m)12.0 ± 0.2 a12.4 ± 0.4 a0.6860.432
BA (m2·ha−1)31.5 ± 2.1 a33.1 ± 6.5 a0.0530.824
Volume (m3·ha−1)219.5 ± 14.8 a205.0 ± 37.5 a0.1290.728
LAI (m2·m−2)7.4 ± 0.5 a5.3 ± 1.0 a3.5380.097
Bulk density (g·cm−3)1.11 ± 0.03 a1.23 ± 0.01 b10.7370.011
Nitrogen (mg·g−1)2.10 ± 0.54 a1.33 ± 0.10 a1.9290.202
Porosity (%)37.48 ± 1.99 a42.78 ± 1.90 a3.6040.094
Soil typeAlfisolAlfisol2.1630.18
Soil textureSilty clay loamSilty clay loam20.490.002
DBH is diameter at breast height (1.3 m); H is the mean height of standing trees; N is the number of trees per hectare; BA is the stand basal area; LAI is the leaf area index. Different letters (a and b) followed the numbers in the same row indicate significant differences (ANOVA; p < 0.05).
Table 3. Comparisons of the ratios of soil C stock to ecosystem C stock of different forest types.
Forest TypeLocationSpeciesMean Age (Years)Soil Depth (cm)Soil/Ecosystem CRef.
PGlobalGlobal forests3010051%[36]
NFGlobalGlobal forests-10045%[36]
PTemplate ChinaPinus sylvestris var. mongolica156075%[44]
PTemplate ChinaPopulus simonii156037%[44]
MPNFChinaDeciduous forests-10069%[45]
MPNFChinaEvergreen forests-10048%[45]
PSubtropical ChinaErythrophleum fordii810074%[43]
PSubtropical ChinaCastanopsis hystrix810079%[43]
PSubtropical ChinaMytilaria laosensis810058%[43]
PSubtropical ChinaMixed E. fordii, C. hytrix and M. laosensis810063%[43]
PSubtropical ChinaCunninghamia lanceolata2210053%[46]
PSubtropical ChinaCunninghamia lanceolata136074%[47]
PSubtropical ChinaCunninghamia lanceolata156062%[48]
MPNFSubtropical ChinaSubtropical forests-10044%[49]
MPNFSubtropical ChinaSubtropical forests-10088%[50]
P = plantations; NF = native forests; MPNF = mixed plantation and native forests.

