1. Introduction
Increasing demands for sustainable forestry require highly precise and fast forest inventories. Tree height and diameter at breast height (DBH) are the most important parameters in taking forest inventories. DBH is usually measured manually with a caliper or a measuring tape and it is recorded together with species during field inventories [
1]. Tree height is usually measured by a height measuring instrument based on angle and distance measurements. Although the spatial information (horizontal structure of stand or tree positions) is difficult to obtain, it represents important information regarding the forest inventory itself (the stem density) as well as for studies of distance-dependent growth and dynamics of trees and stands [
2].
Manual inventory methods for collecting forest information used nowadays are labor cost- and time-demanding and there is a need to find alternative methods. Many methods for simplifying DBH measurement using non-contact methods have been proposed in the past decades summarized, for example, by Clark et al. [
3]. Their findings show that accuracy, productivity, and cost requirements, as well as practical restrictions, must be considered when evaluating whether a project benefits from a new instrument compared to traditional field measurements. Nowadays, advanced technologies that enable the acquisition of three-dimensional (3D) data for further analysis are widely used in research of specific forest environments. Some of these technologies can provide fast data acquisition of large areas, e.g., aerial photogrammetry (AP) or airborne laser scanning (ALS), and these are commonly used for commercial purposes in forest inventories [
4,
5,
6]. Point clouds derived from images by AP are usually generated by computer vision/photogrammetry techniques, such as structure from motion (SfM) [
7]. SfM operates in accordance with principles of traditional stereoscopic photogrammetry, using well-defined geometrical features captured in multiple images from different angular viewpoints to generate a 3D point cloud [
8]. However, these technologies have limited (ALS) or almost no (AP) ability to penetrate dense canopies and gain information about the ground, undergrowth, or even shape and size of stems, because the view from the top does not allow sufficient detail of internal forest structure, especially in the case of richly-structured forests with different spatial, age, and tree species composition. Wallace et al. (2016) [
8] recently described the difference between AP and ALS from small unmanned aerial vehicle and demonstrated that the ALS has better canopy penetration than the AP. AP and ALS can provide good information about forest canopy structure for the analysis, e.g., heights of trees, but tree height estimates may be underestimated because, in the case of ALS, laser pulses could miss the treetops (especially in the case of conifers with narrow canopies), could be reflected from lower levels of the forest stand and, thus, detect the sides of the trees instead of the treetops [
9,
10]. Both technologies have the advantage of larger scale and very fast data acquisition of relatively large forest areas in a short time and with very high resolution. A lower density of point clouds could influence the ability of successful individual tree detection [
8].
Apart from large scale measurements based on aerial data acquisition, terrestrial laser scanning (TLS) is being increasingly applied in forestry. Although TLS provides a large amount of detailed information from the forest environment and about forest and tree parameters [
6,
11,
12], the current price of laser scanning devices still makes it difficult to be deployed in management inventories.
There are several studies on estimation of stem attributes using terrestrial photogrammetry (TP) work by [
13] was performed on analogue images and concludes that manual measurements in analogue images would be unfeasible due to long processing times. More recently [
14,
15] presented methods for stem profiling and measurement based on digital photogrammetry. This method, however, places several constraints on the imaging process. Dick et al. [
16] described a technique for the deployment of panoramic 360-degree photographs for tree horizontal structure mapping. The proposed technique was tested on a large set of plots and the authors reported the overall accuracy of 0.38–0.44 m in distance and 2.3–2.5 in azimuth measurements.
In 2014, Liang et al. [
17] described a method for terrestrial photogrammetry using a hand-held consumer camera and reported 88% accuracy in stem detection and 2.39 cm error in diameter estimation. The authors described the main advantages of terrestrial photogrammetry compared to terrestrial laser scanner to be the low cost of the equipment, fast field measurement, and automated data processing. Surový et al. [
18] described the accuracy of point reconstruction on individual stems using a hand held camera with stop-and-go method and showed that the spatial error proved to be stabilized when more than eight cameras point to the evaluated point. Forsman et al. [
1] developed a method for terrestrial mapping of tree structure using a multi-camera rig. The rig was composed of six cameras which simultaneously captured images. After the creation of a point cloud, the stem points are fitted with circle function for diameter estimation. The authors reported the highest accuracy on plots with clearly visible stems and the DBH estimation was reported to be with a RMSE of 2.8–9.5 cm. Miller et al. [
19] designed and described a method for individual tree models using SfM and multi-view stereo-photogrammetry (MVS) techniques and they estimated the 2D and 3D accuracy of the reconstruction. They used xyllometry as the most accurate ground truth validation of volume and found the total volume to be estimated with a RMSE of 18.53% (slightly better for stems, and much higher error was reported for branch volume estimation). The 2D metrics reported by the authors were better; 3.74% RMSE for height estimation and 9.6% for DBH. However, it is important to mention that only smaller trees were used in the study. In our study, we wanted to estimate the accuracy and feasibility of the deployment of SfM and MVS techniques for mature forest stands with canopy heights of 25 m and higher and to evaluate the possible replacement of terrestrial manual measurements, both because of time-efficiency and higher precision, as well as richer data (including the stem form, taper, horizontal asymmetry, etc.). For that purpose, we conducted geodetic measurement of almost 1 hectare of forest stand with subsequent AP and TP data acquisition and data processing for further accuracy and suitability assessment.
2. Materials and Methods
2.1. Study Area
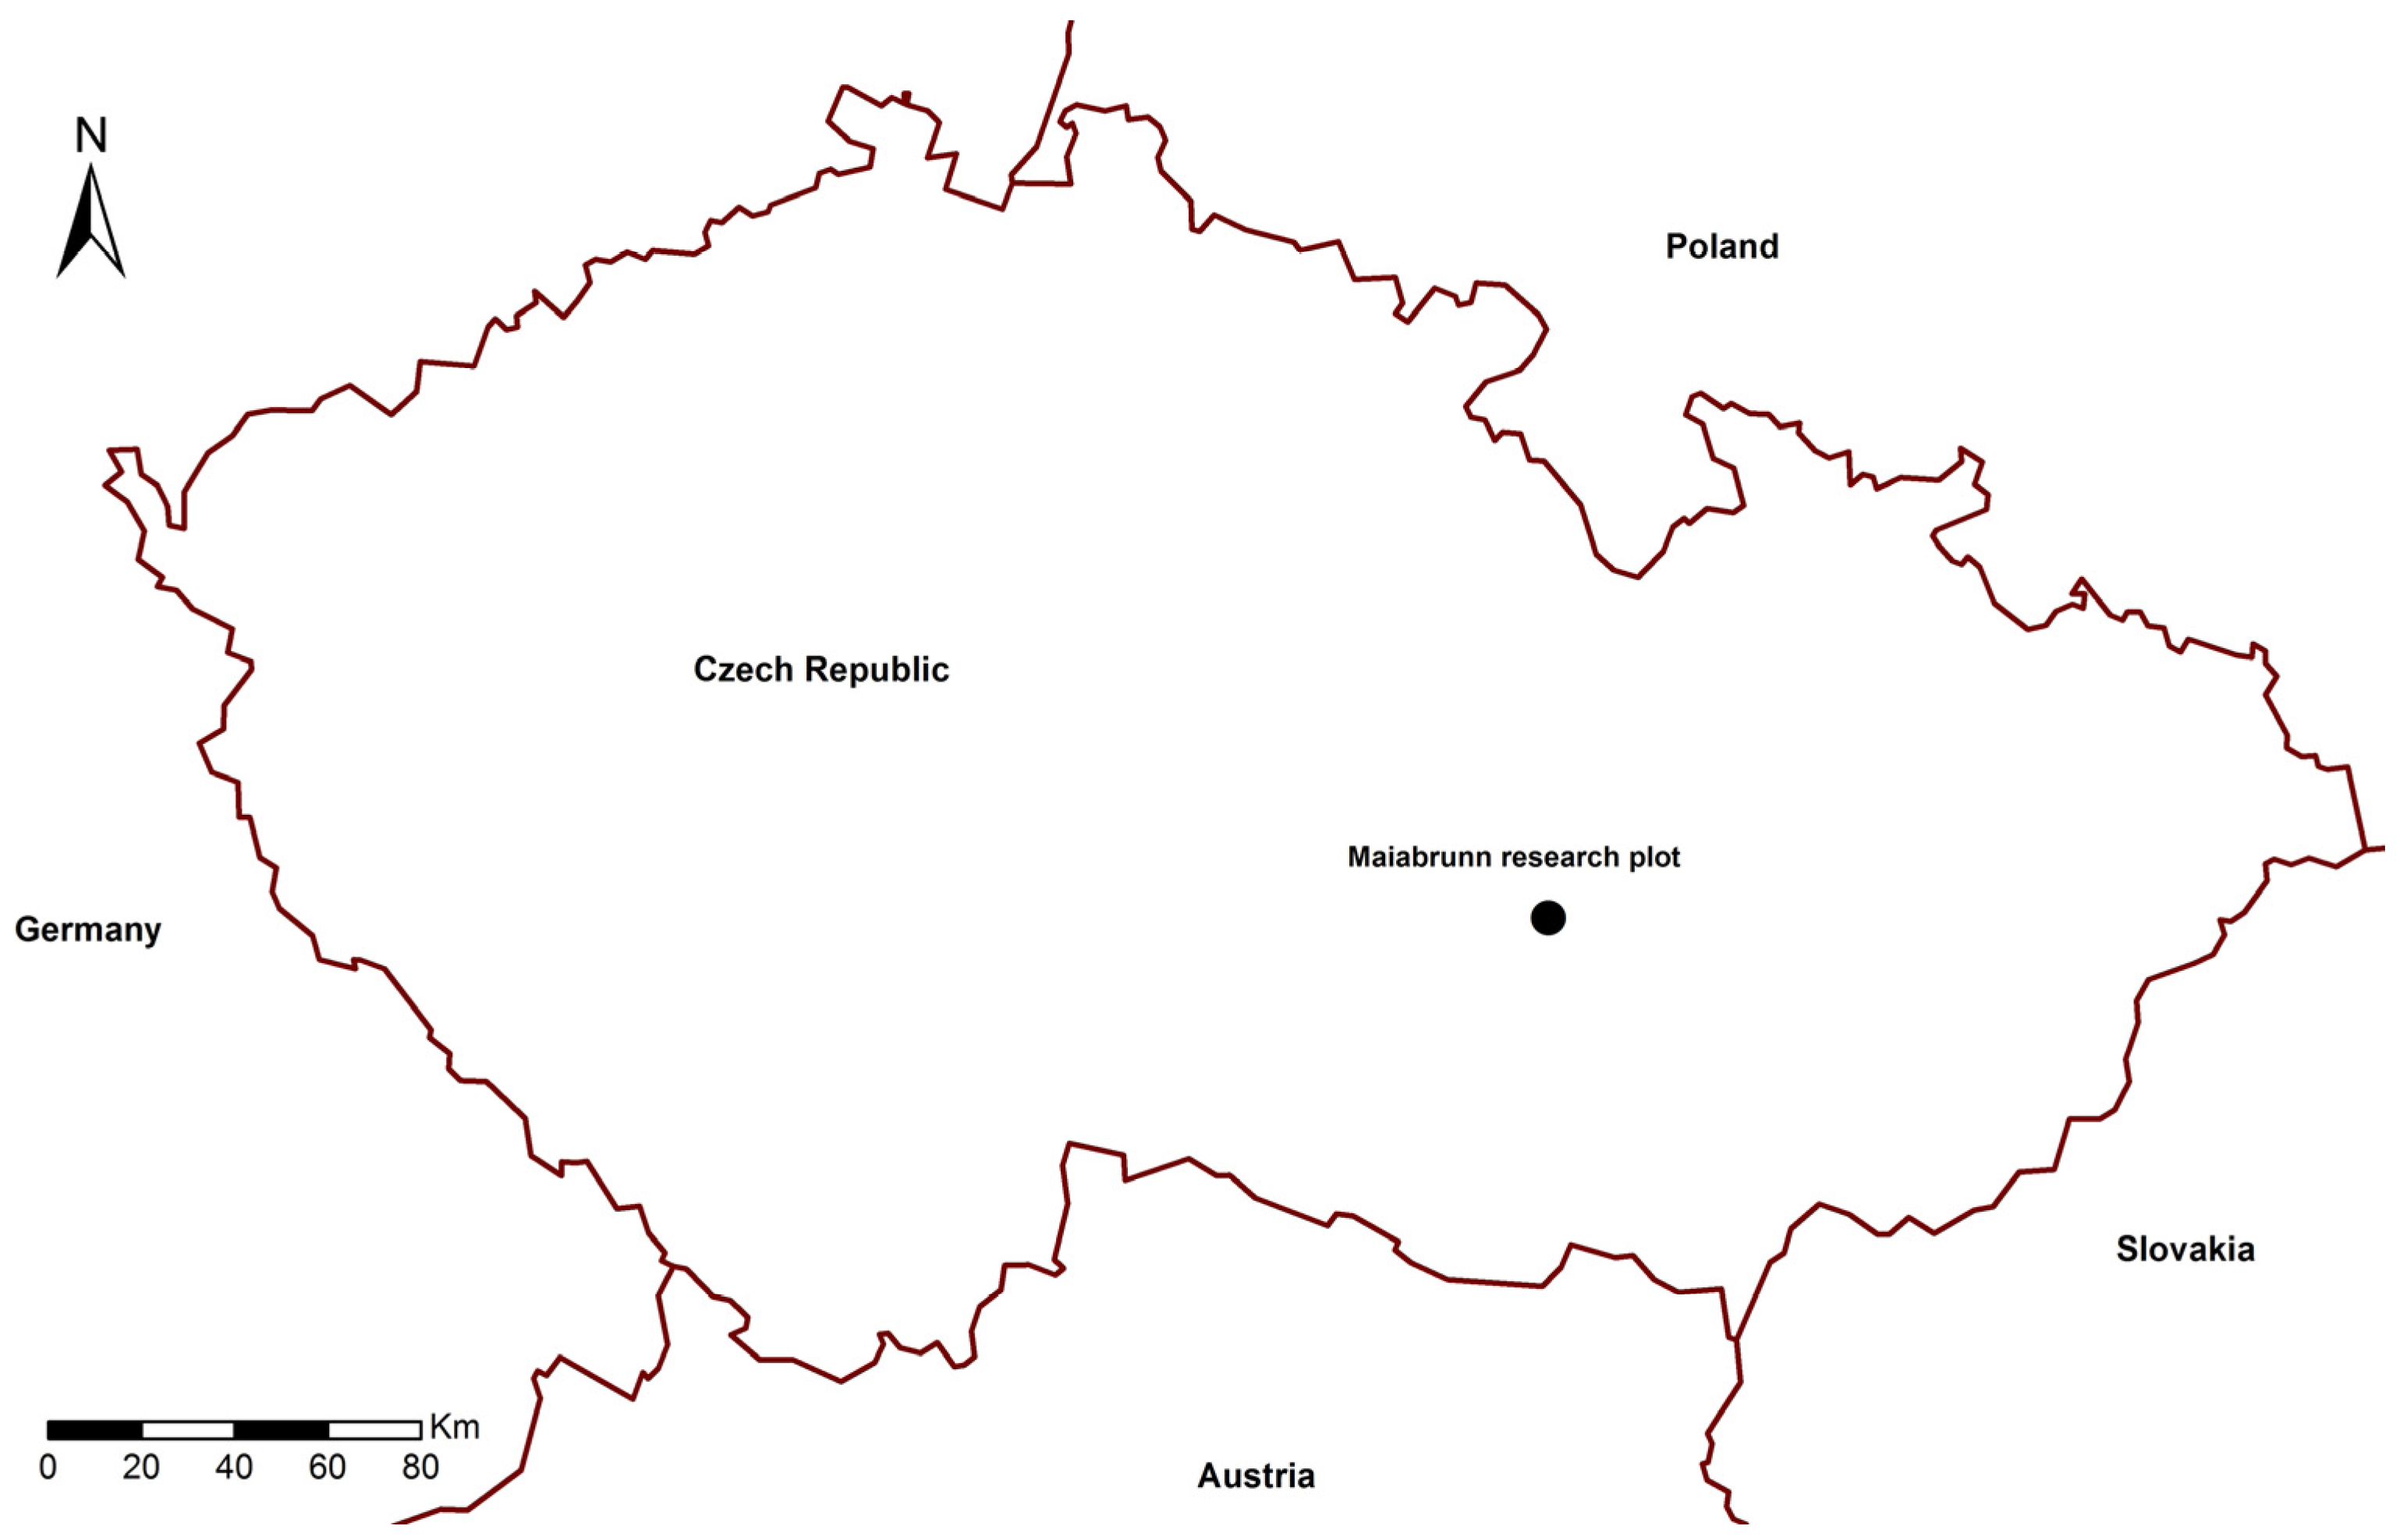
The test area is located in the eastern part of Czech-Moravian Highland (
Figure 1). This site was established in 1891 according to the former methodology of the Forest Research Institute in Mariabrunn, Vienna. It was conducted under registration number 170 and it is one of the oldest well-preserved forest research plots in Central Europe. Originally, it was established for the research of the effect of different planting clasps on the production and function of the subsequent forest stands on an area of 1.5 hectares. Current research on this plot focuses on mechanical and environmental stability of forest stands with regard to health conditions and transformation of the species, age, and spatial structure of the forest. The plot is located 650 m above sea level with a mostly flat surface, with a slight slope to the prevailing southeast aspect.
The research plot was chosen because of a previous geodetic survey of the position of all trees, including surveying DBH and heights of individual trees. Only a part of the area was selected for the purpose of this study—an area of 0.8 hectares with 100% of 124 year-old spruce growth. The aim was to find a homogeneous surface without forest regeneration and almost no other vegetation in the understory.
2.2. Field Survey
A geodetic survey was carried out in combination with GNSS measurements with a Topcon Hiper Pro (Topcon Corporation, Tokyo, Japan) and Trimble M3 Total Station (Trimble Navigation Limited, Sunnyvale, CA, USA) in the Czech national coordinate system (so called Unified Triangulation Cadastral Network). DBH of trees were measured by Häglof caliper (Häglof Sweden AB, Långsele, Sweden) in two perpendicular directions, and tree heights were measured by a Häglof vertex device. For accurate measurement, each tree was measured three times from different places, whereas the distance was equivalent to at least the height of the trees. Final DBHs and heights of the trees were calculated as the arithmetic mean of all measures. A total of 118 trees were measured with the average height of 31 m (max = 36 m, min = 22 m), and the mean DBH 38.2 cm (max = 54.5 cm, min = 18.5 cm) (
Table 1). All surveyed positions correspond with the closest point at the base of the stem. The characteristics of measured trees are presented in
Table 1.
During the geodetic survey, the locations of altogether 10 ground control points (GCP) were also measured, located across the plot in places with low canopy density for the alignment with the UAS-based model. We used white metal targets with size of 20 cm × 20 cm with a black cross (size 5 cm × 5 cm) for good recognition on images both from AP and TP (
Figure 2).
2.3. Aerial Image Acquisition
Aerial images were acquired by a multirotor unmanned aerial system (UAS) hexacopter DJI S800 Spreading Wings (DJI, Shenzhen, China) with Sony NEX 5R camera (Sony Corporation, Tokyo, Japan) with a Sigma lens with a fixed focal length of 19 mm. The sensor size of camera is APSC (24 mm × 16 mm) and the resolution is 16 megapixels (4912 × 3264 pixels). Aerial photographs were taken at midday on 10 July 2015 from a height of 120 m.
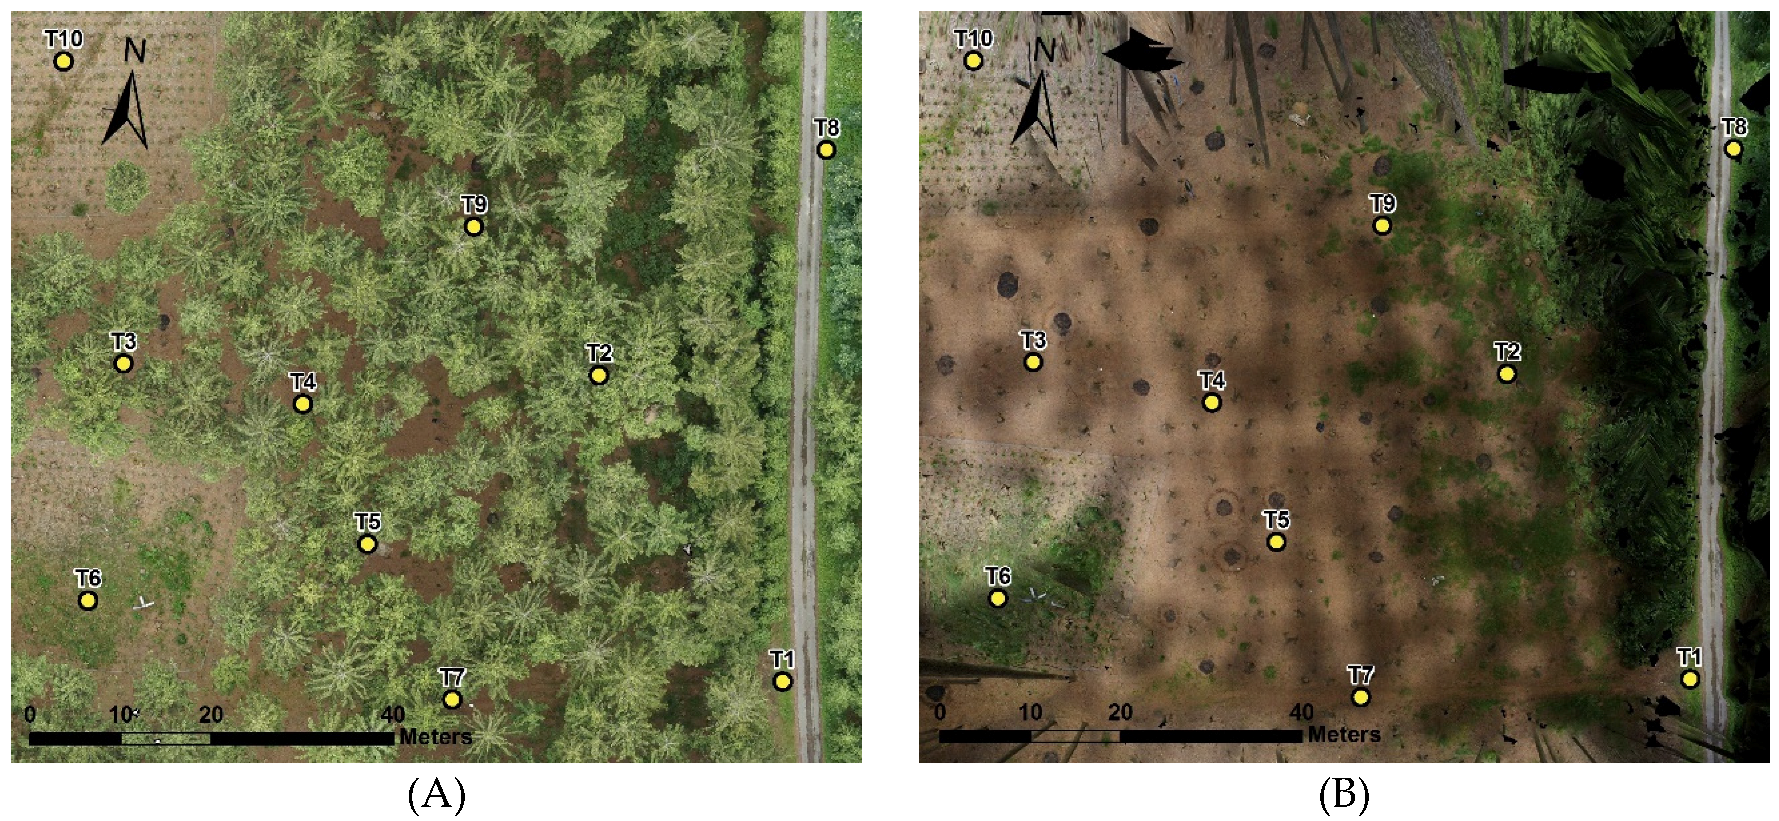
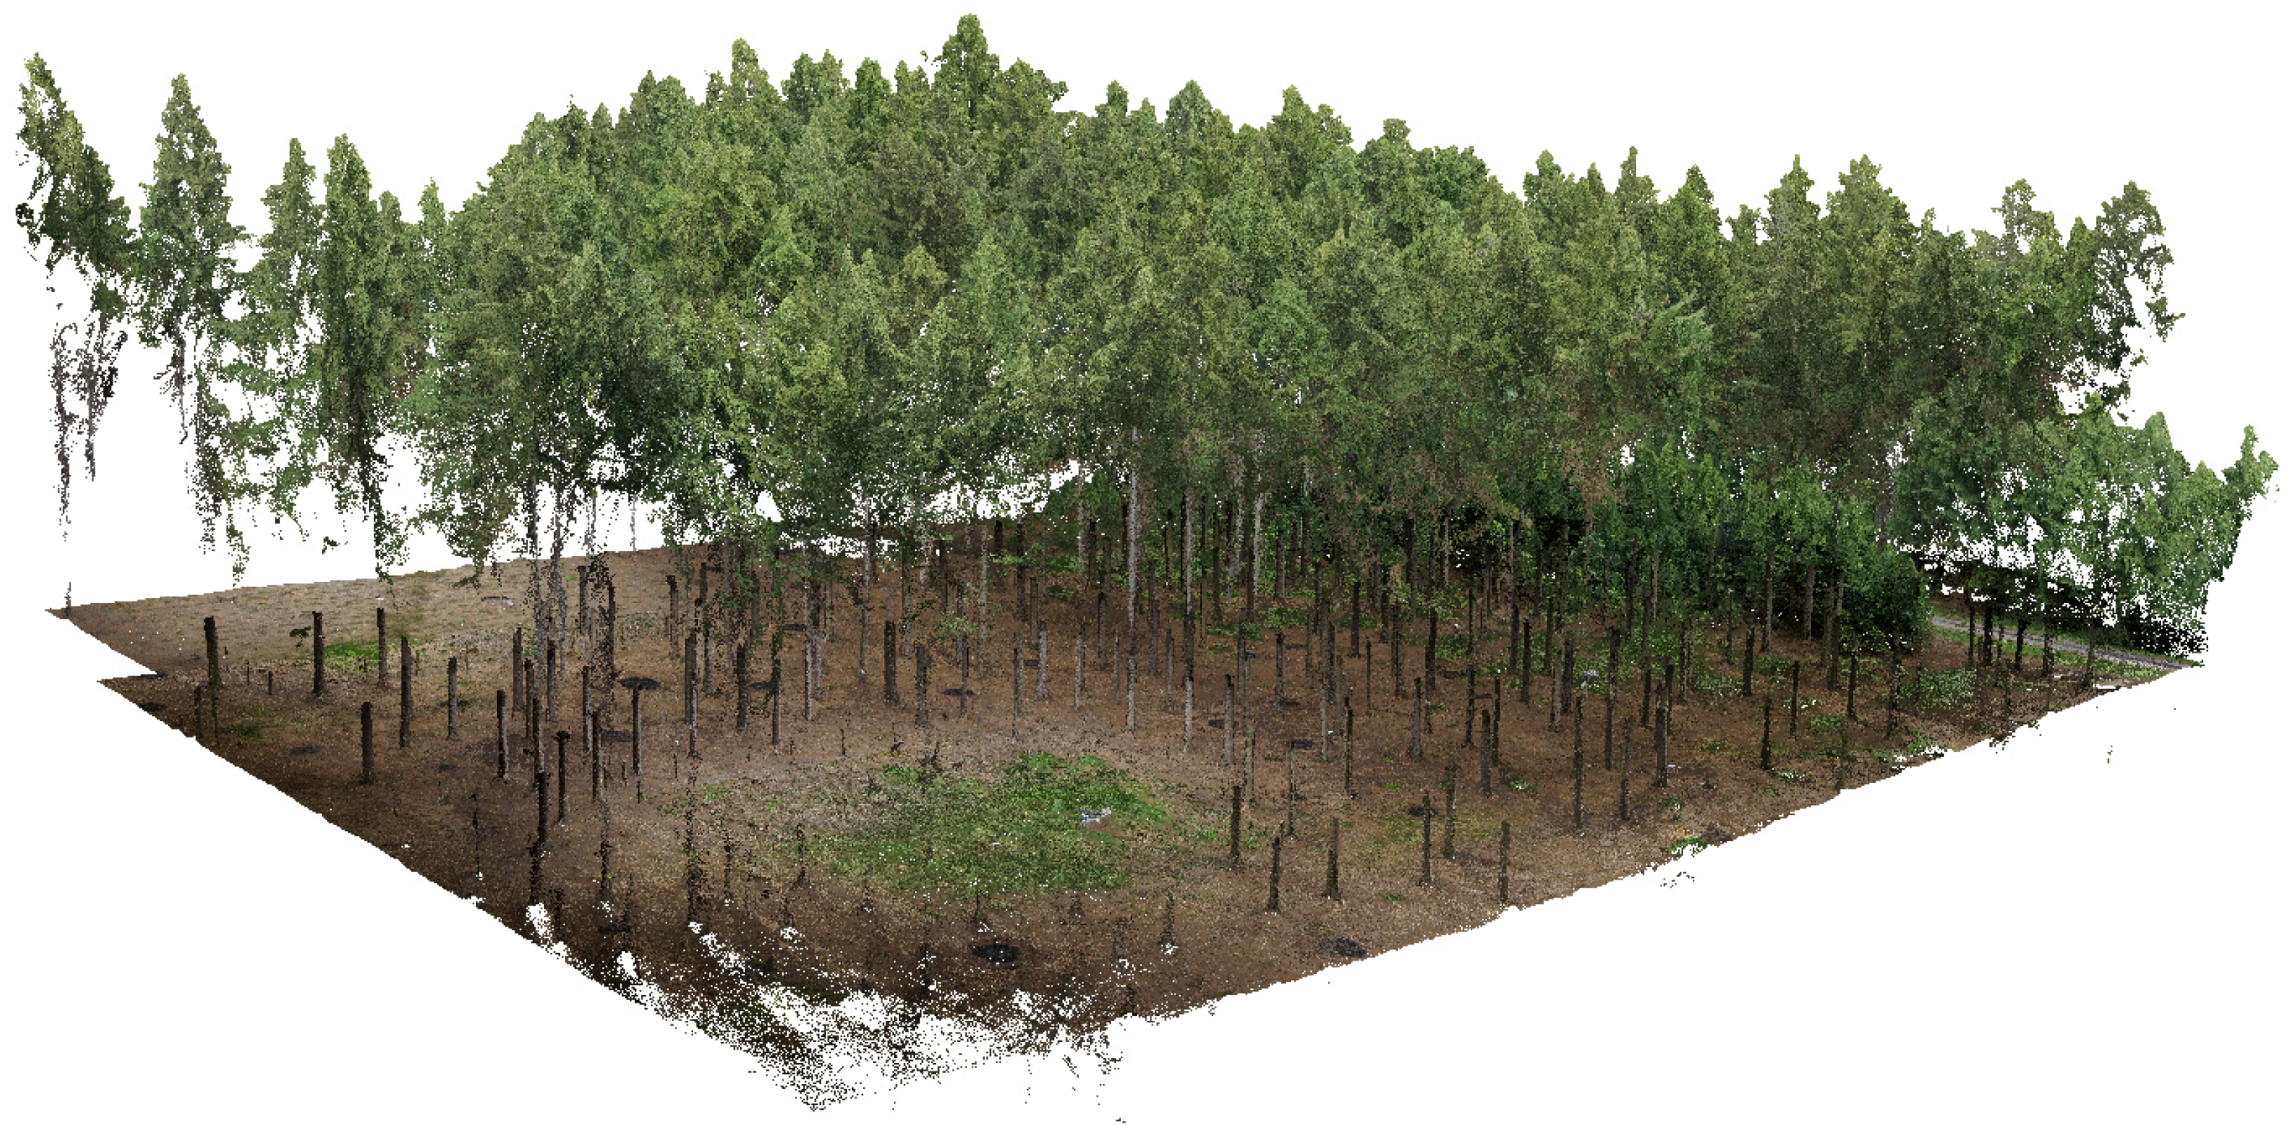
Data processing of a total of 210 images was carried out in AGISOFT Photoscan 1.2.5 software (Agisoft LLC, St.Petersburg, Russia) into the ortophoto with resolution of 1 cm and dense point cloud that consists of more than 18 million points (
Figure 3). The AGISOFT Photoscan Professional software, which implements modern SfM algorithms, was used to generate a point cloud from the RGB photographs. Detailed descriptions of the Photoscan workflow can be found, for example, in [
20,
21].
2.4. Terrestrial Photogrammetry
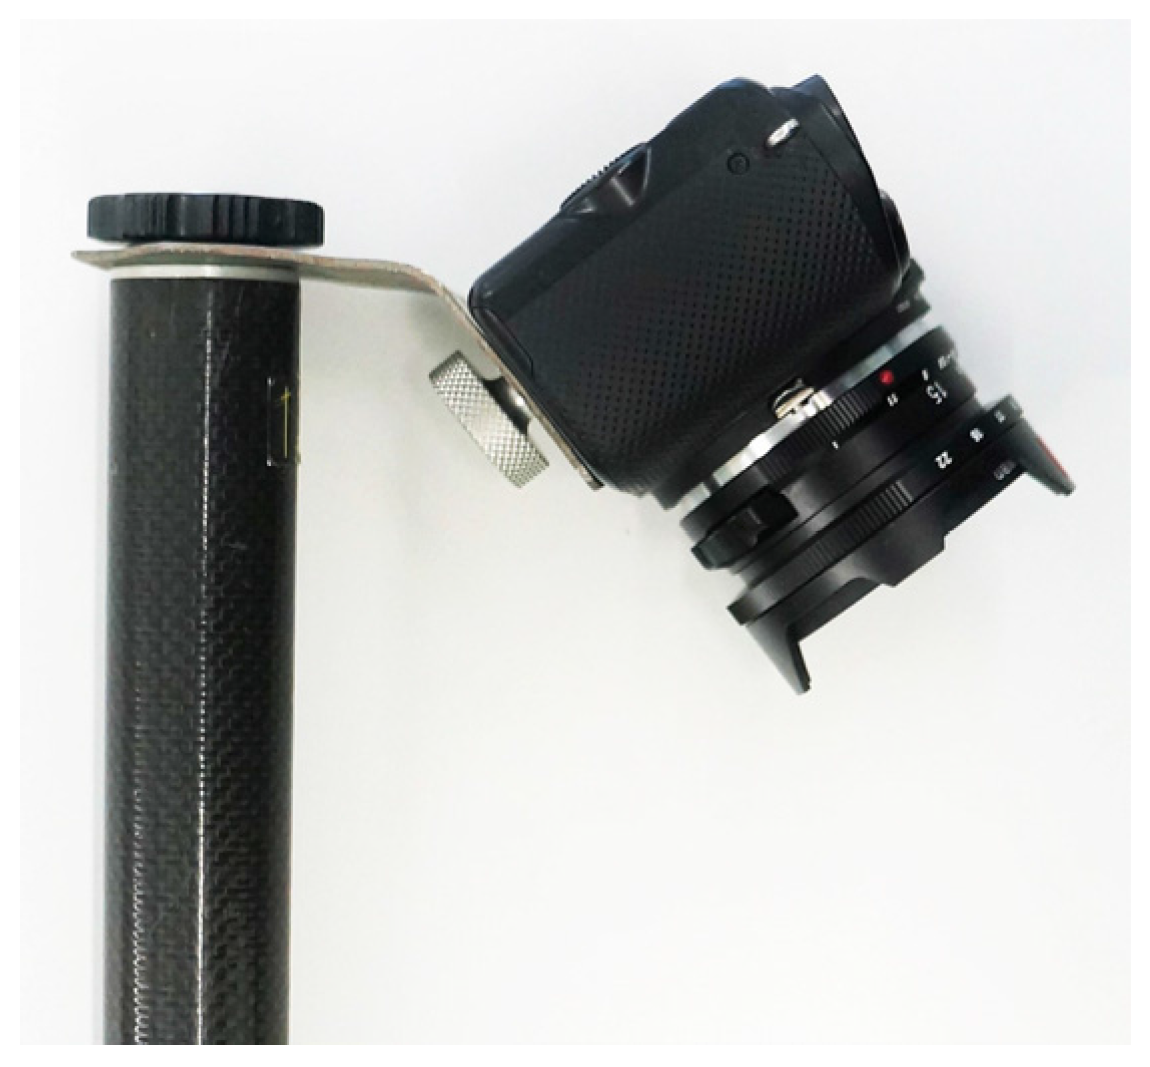
Terrestrial photogrammetry was carried out by the same camera placed in a special holder on a measuring pole at a height of 4 m pointing forward. The holder was designed so that the axis of the camera forms an angle of approximately 45 degrees with the vertical axis (
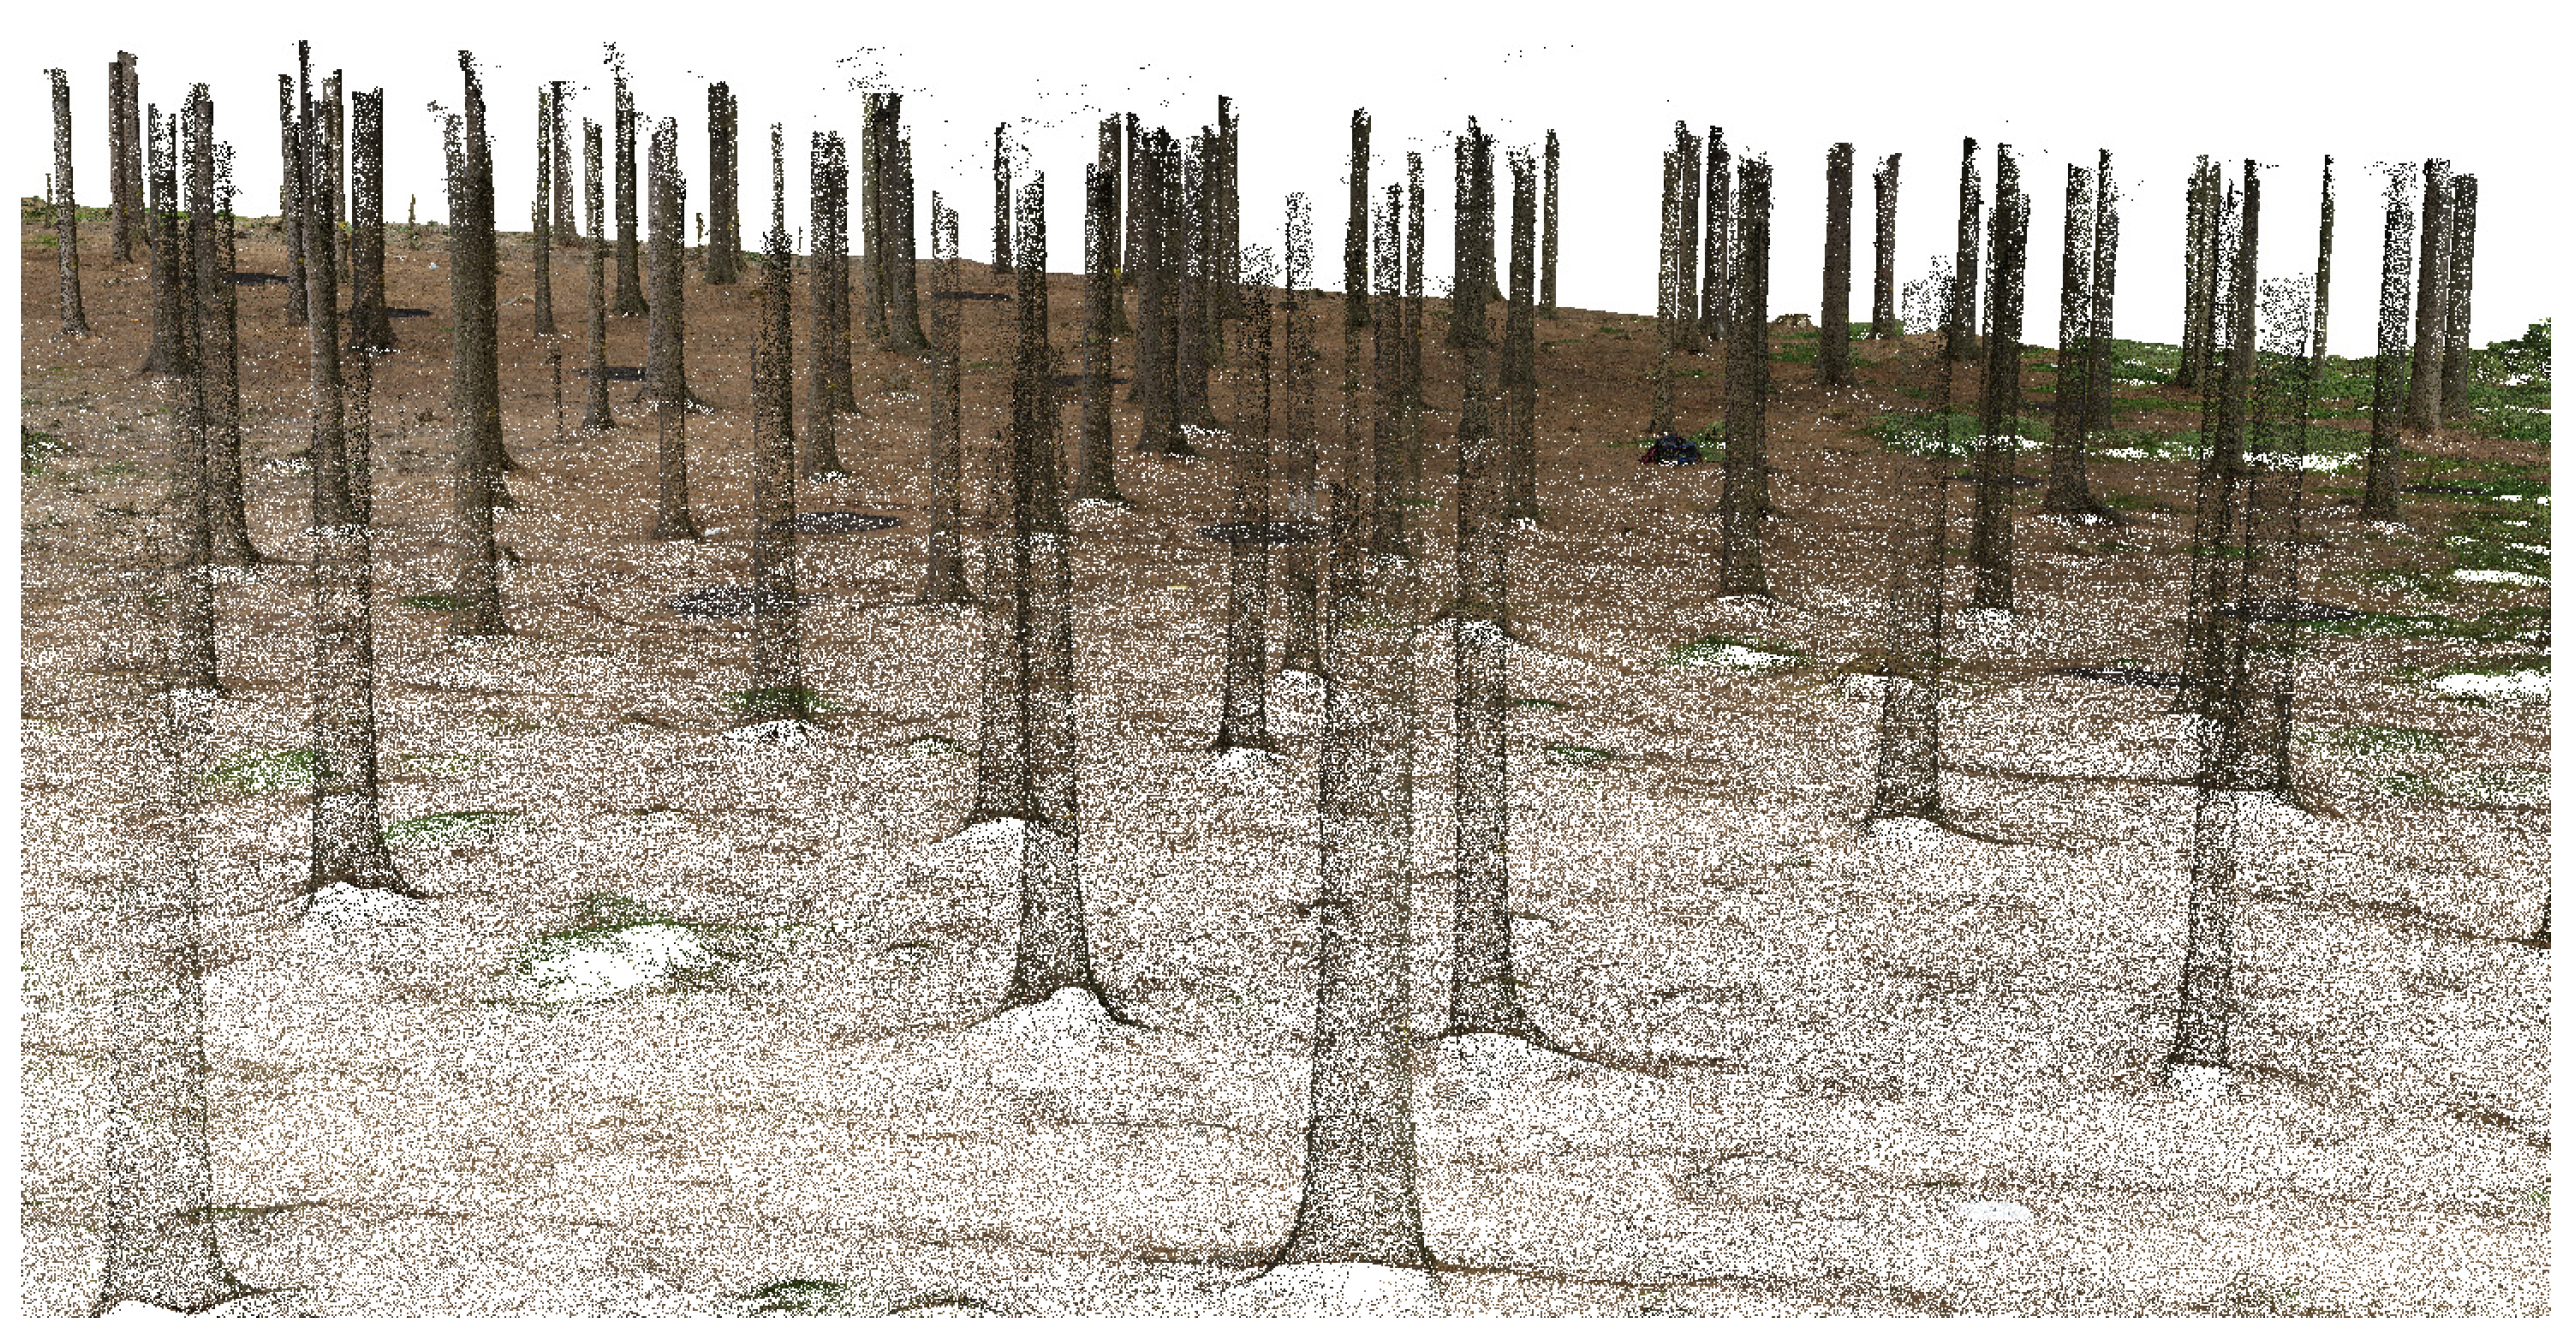
Figure 4). The image shooting was done based on continuous capturing of images during crossing through the forest with a speed of approximately 5 km per hour with the interval of one second per captured image. This procedure ensured high overlap of images, thus, most locations were covered by more than nine images. For referencing the same GCPs as for aerial images were used. In this way, 1774 images altogether were collected and further processed into a dense point cloud of more than 79 million points (
Figure 5).
2.5. Data Processing
The automatic classification procedure in AGISOFT PhotoScan consists of two steps. At the first step the dense cloud is divided into cells of a certain size. In each cell the lowest point is detected. Triangulation of these points gives the first approximation of the terrain model. At the second step a new point is added to the ground class, providing that it satisfies two conditions: it lies within a certain distance from the terrain model and that the angle between the terrain model and the line to connect this new point with a point from a ground class is less than a certain angle. The second step is repeated while there still are points to be checked.
After processing and classification into ground and non-ground points in AGISOFT Photoscan, both (aerial and terrestrial) point clouds were exported to LAS 1.3. format (LASer File Format for Exchange of ASPRS—The Imaging and Geospatial Information Society) for subsequent processing in ArcGIS 10.3 software (ESRI, Redlands, LA, USA), with the Spatial Analyst extension, and LAStools (Rapidlasso GmBH, Gilching, Germany) (
Figure 6). The aim of the data processing was automatic identification of tree positions and automatic detection of tree DBH and tree heights.
First, we processed the data from TP, with ground points used for digital terrain modelling and the non-ground points serving for the modelling of tree stems. After that it was possible to create the horizontal cross-section of the point cloud at breast height above terrain with LASheight tool. A created DTM from classified ground points was used as reference. Due to sufficient point density of the point cloud, only a very thin cut with a height interval of 10 mm was used (all points in the interval from 1.29 m to 1.30 m above terrain were chosen). Further, the cross-sections in LAS format were converted into a geodatabase feature class and a buffer zone with the diameter of 10 cm was created around each point with subsequent merging into one feature. After breaking down into single isolated features, all segments were assigned a unique ID of separated polygons. This procedure enabled us to get relevant point cuts of individual trees (point clusters), which were subsequently delineated by circumscribed circle or convex hull methods and, as a result, they gave us the approximate shape of stem cross-sections. By transferring the centers of gravity of these elements, horizontal centers of the trees were obtained as a new point layer.
Automated Delineation of Stem Circumference and Diameters
We tested two automatic methods for delineation of stem circumference:
- -
Circle fitting; and
- -
Convex hull.
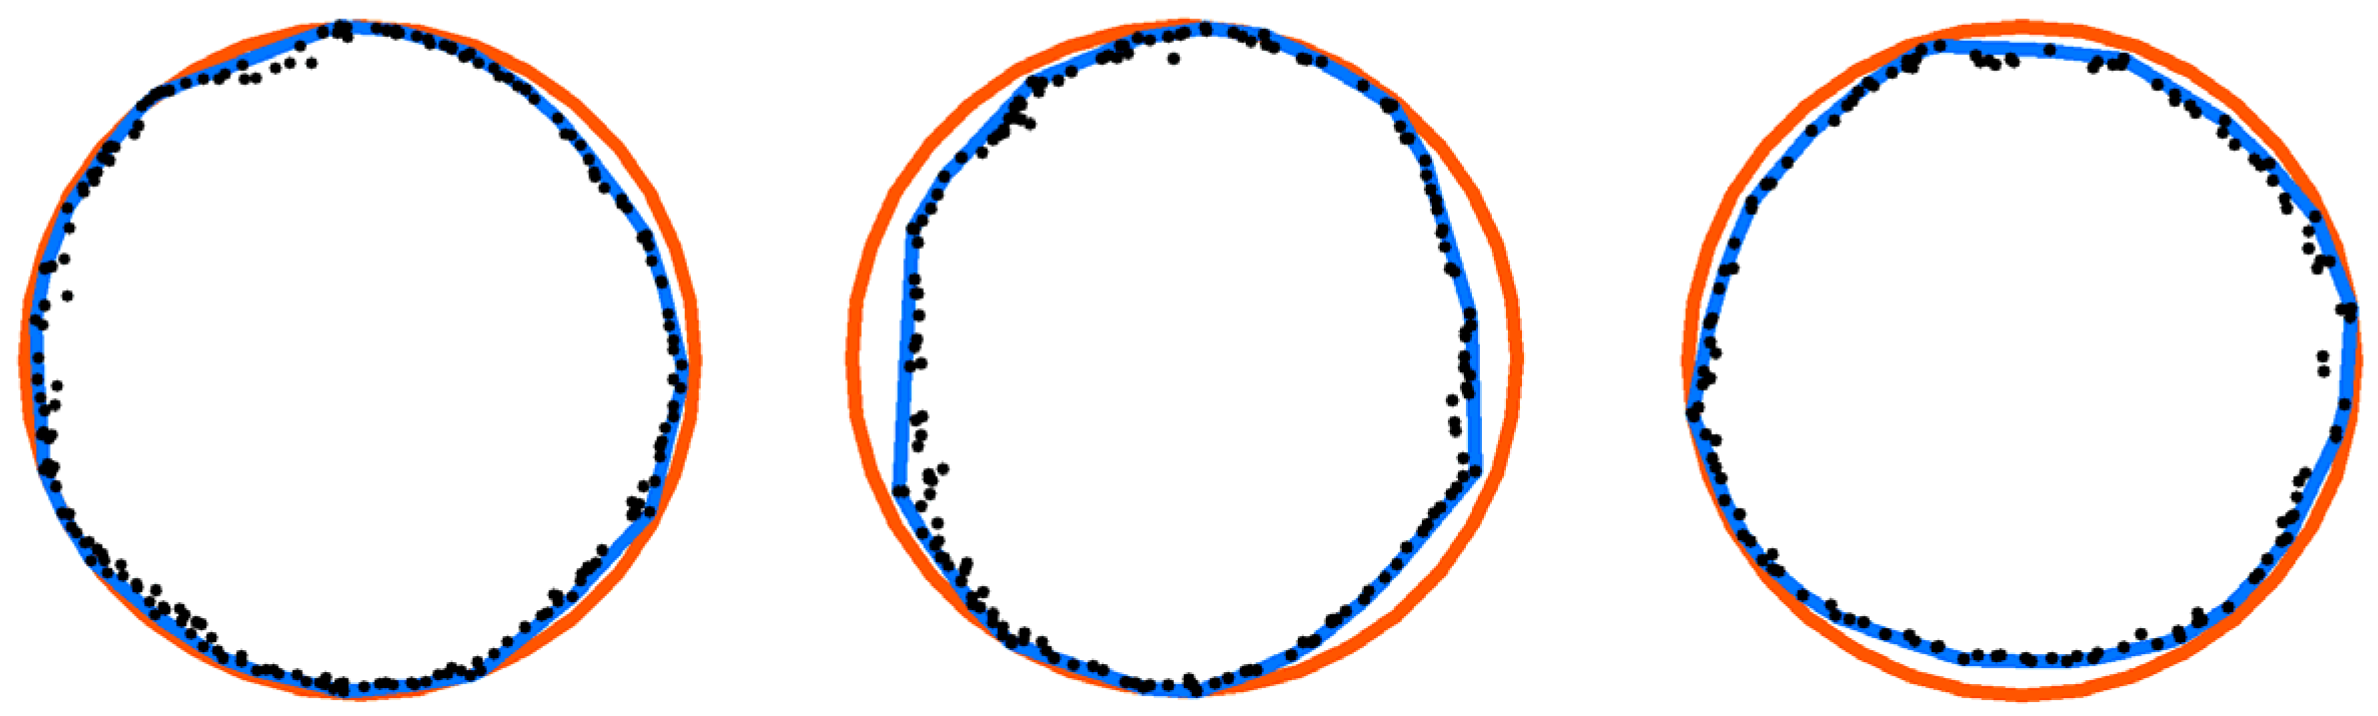
First, we conducted the processing of stem cuts by means of a regular circle. This method allows processing of the point cloud into a circle even in the cases when the whole stem is not covered by images from all sides. The resulting accuracy of this method can be negatively influenced by the irregularity of the tree stem (
Figure 7). The second method for DBH delineation is an algorithm called the convex hull method. Formally, when we have a set of points X, the convex hull may be defined as the intersection of all convex sets containing X or as the set of all convex combinations of points in X. With the latter definition, convex hulls may be extended from Euclidean spaces to arbitrary real vector spaces; they may also be generalized further, to oriented matroids [
22]. It creates a connected polygon of points and, in the case of high density data, it can describe the whole shape of the stem in a tree cut with very low generalization.
2.6. Tree Height Assessment
A terrain DTM was extracted from the minimum elevation data in the TP point cloud and a DSM was extracted from the maximum elevation data in the AP point cloud.
Based on the difference of DSM and DTM, we calculated a canopy height model (CHM) expressing the height of the objects above ground. Heights of trees were assigned to a tree point layer by zonal statistics as a local maxima of tree canopies conducted by the inversed watershed segmentation of CHM [
23].
2.7. Stem Volume Calculation
Stem volumes were calculated by an allometric equation for Norway spruce according to Petráš and Pajtík [
24] (Equation (1)):
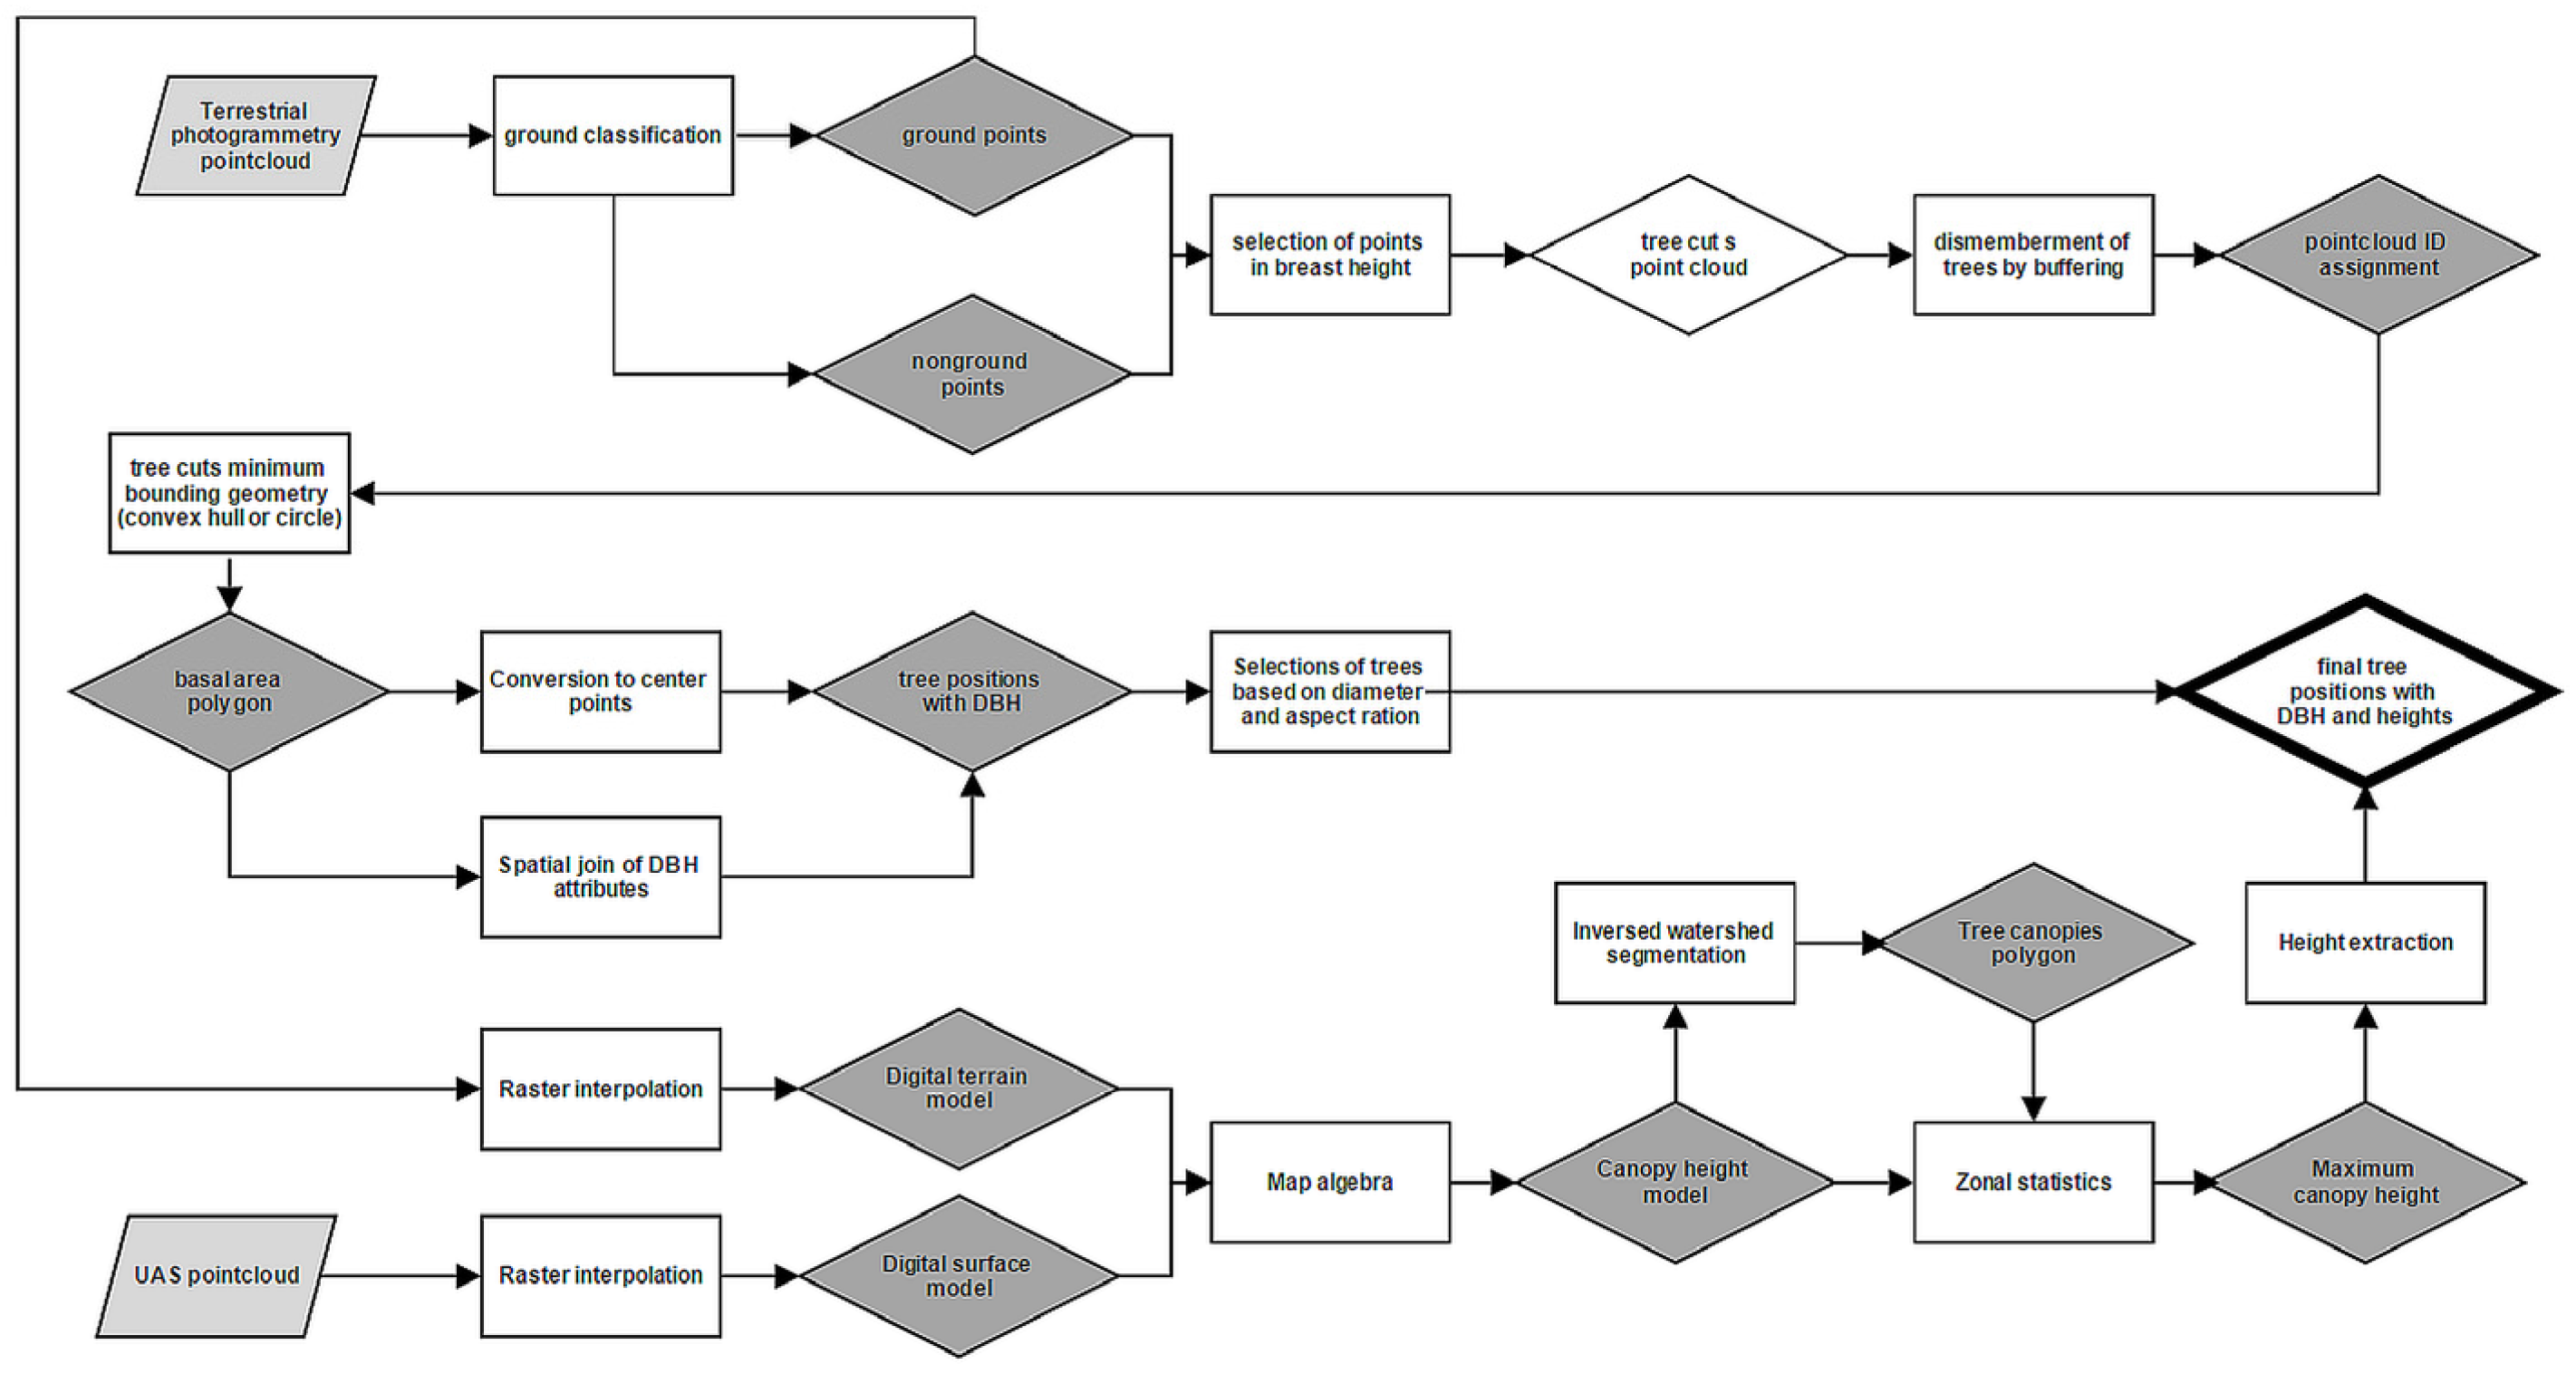
Our method was transformed into a model for automatic calculation based on AP and TP photogrammetric point clouds as a source layer with final results in the form of a tree point layer with attributes of height, DBH, and tree volume. The detailed workflow is shown in
Figure 8.
2.8. Accuracy Assessment
According to the report from AGISOFT Photoscan, horizontal precision of 0.034 m and vertical precision of 0.011 m calculated on GCPs was reached during the processing of AP data. After classification of ground points and noise points, the final point cloud with average density of 1890 points per square meter was created.
In the case of TP, we reached a horizontal precision of 0.028 m and a vertical precision of 0.004 m, with an average density of 10,385 points per square meter (
Table 2).
In the first part, we assessed the accuracy of terrestrial photogrammetry for digital terrain modeling. Thanks to previous geodetic survey of tree locations we could evaluate the vertical accuracy of the created digital terrain model (DTM). This validation was carried by comparison of field-measured geodetic points (position of trees) with the DTM interpolated from classified ground points from TP (Equation (2)). Results of this assessment were statistically evaluated using basic parameters—min, max, mean, standard deviation and root mean square error (Equation (3)):
where
is the elevation of geodetic points and
is the elevation taken from classified ground points from TP interpolated into raster DTM.
where RMSE is the root mean square error,
is the mean, and
is the standard deviation of all values.
The final calculated DBHs, tree heights, and tree stem volumes were compared with field measurements of trees for the agreement of accuracy of automatic forest stand inventory and, again, statistically evaluated by basic statistic parameters analogous to elevation in the previous step.
4. Discussion
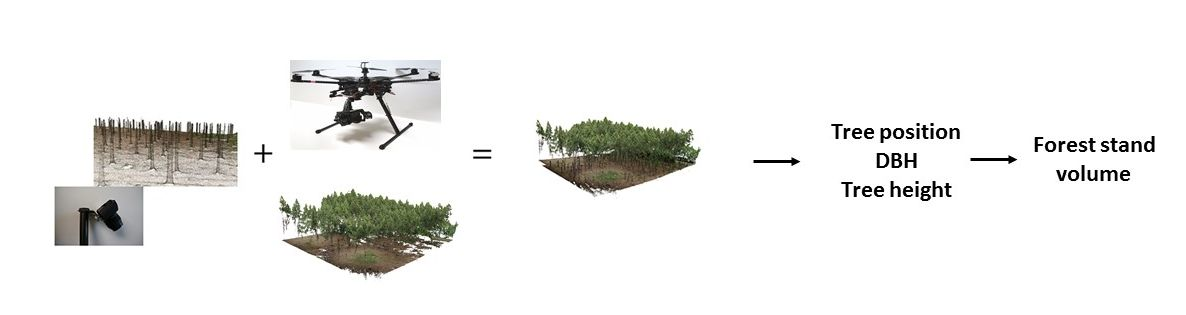
This study has demonstrated the ability of combined aerial and terrestrial photogrammetry for automatic calculation of tree parameters specially targeted to forest management inventory purposes. Our intention was to test the possible use of a common commercial digital camera for the creation of 3D models capable of providing high-resolution realistic point clouds which can be used for the delineation of individual trees and the estimation of common inventory parameters, such as the number of trees per hectare, height, and the diameter of individual trees.
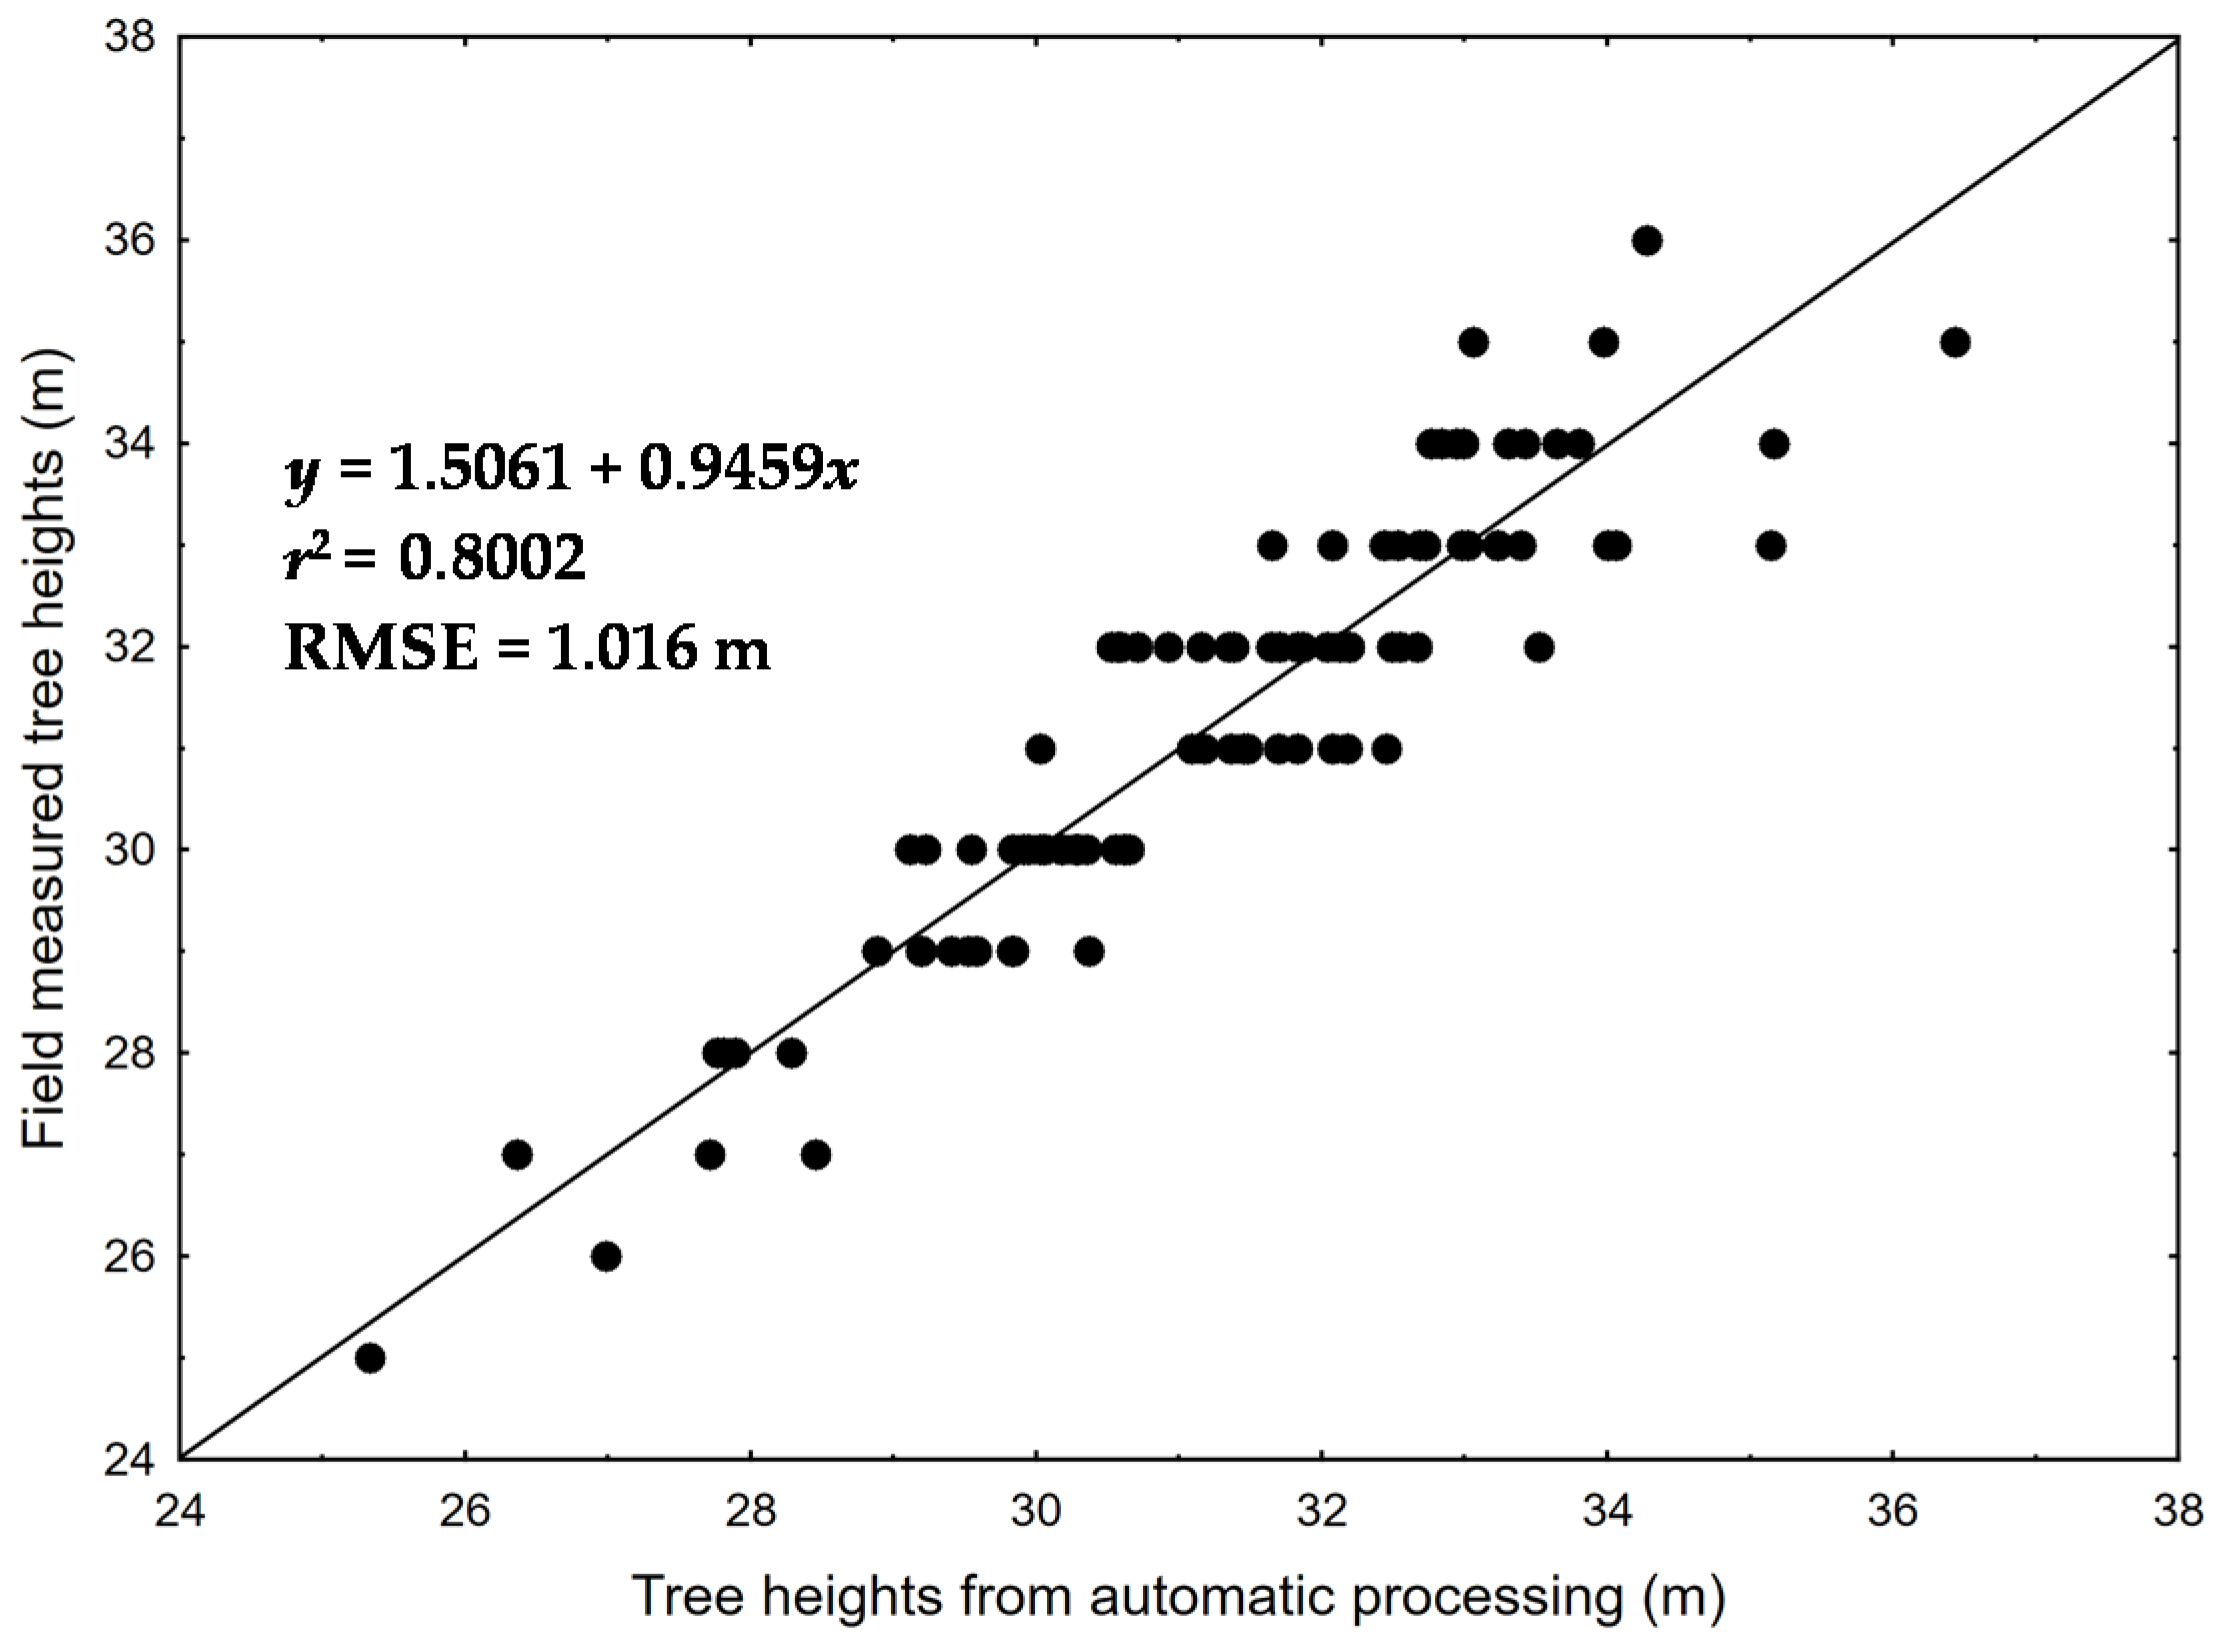
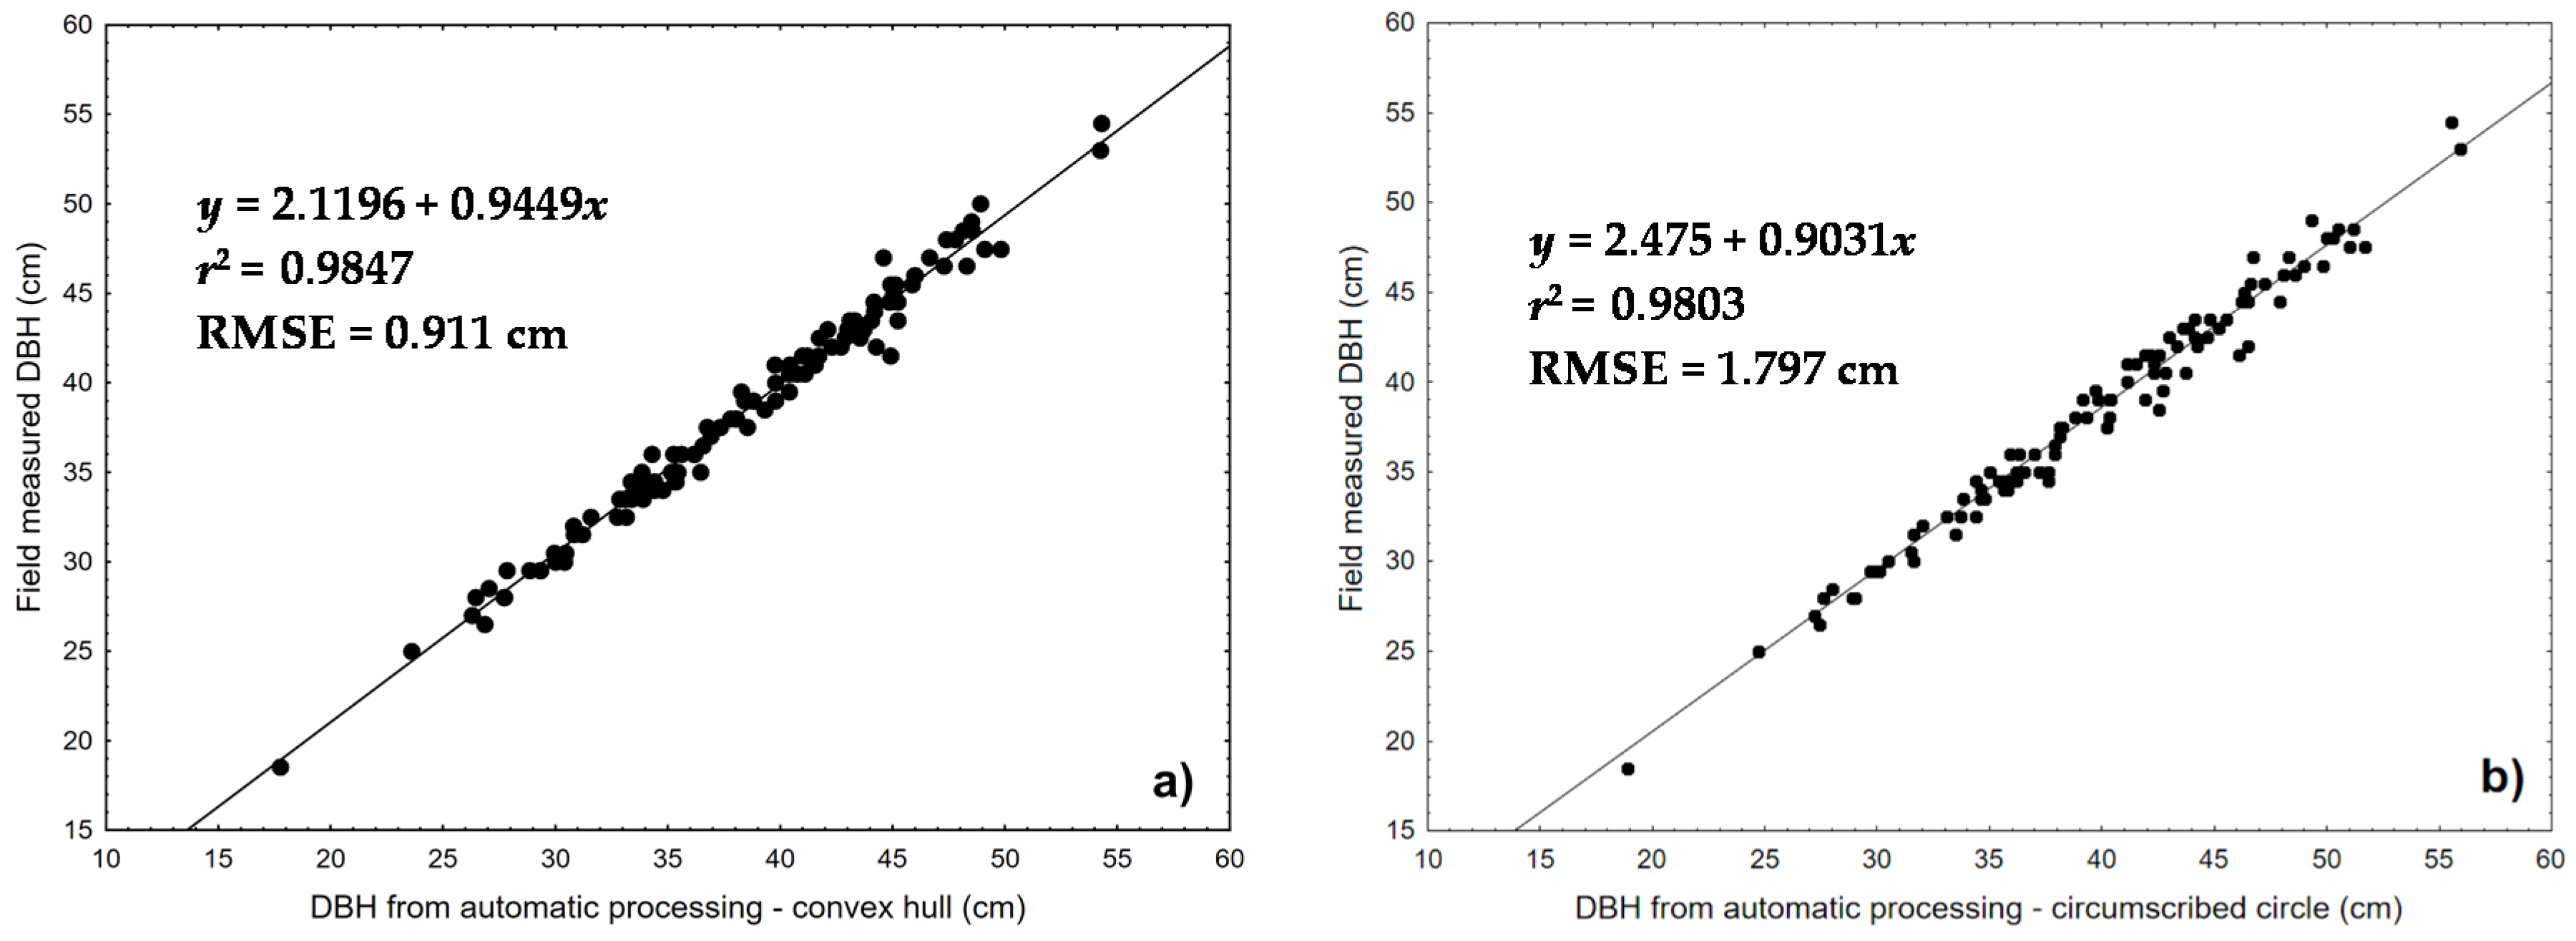
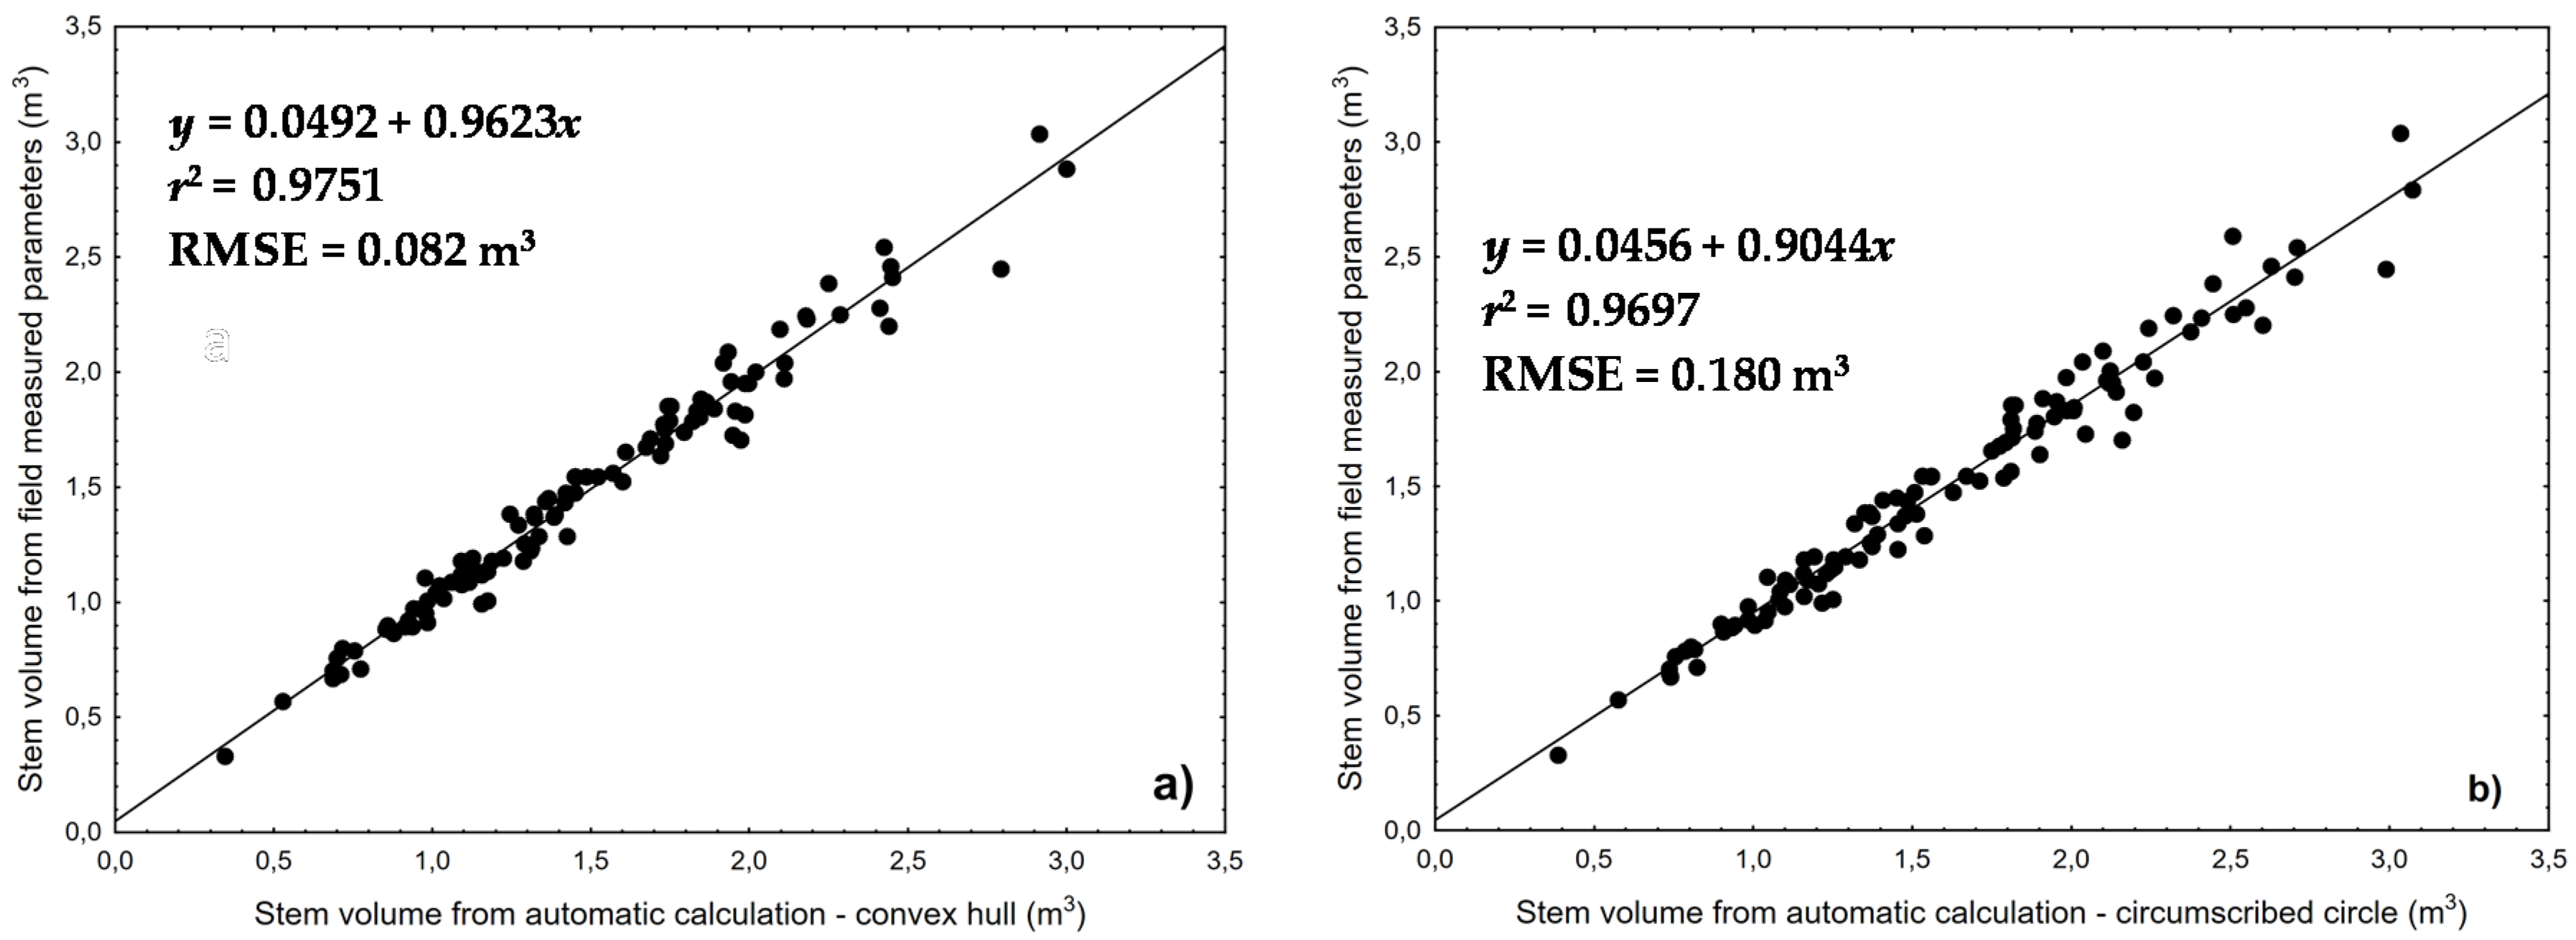
The combination of both methods provided excellent characterization of the stand terrain compared to geodetic measurements (RMSE of 0.065 m, which was possible because of a lack of dense vegetation) and very good characterization of individual trees in their positions (RMSE of 0.463 m), tree heights (RMSE 1.016 m), and DBH (RMSE of 0.911 cm for convex hull and 1.797 cm for the circumscribed circle method). When comparing stem volumes calculated on the basis of the equation (Equation (3)), we also achieved very good results (RMSE of 0.082 m
3 for convex hull processing and 0.180 m
3 for circumscribed circle processing) (
Figure 10). The calculation of stem volume is based on empirical equations and regression models that are location and forest stand specific [
24,
25,
26]. The final accuracy is highly influenced by the vertical shape of the stem and it is presented only to illustrate the difference between the methods. The equation used [
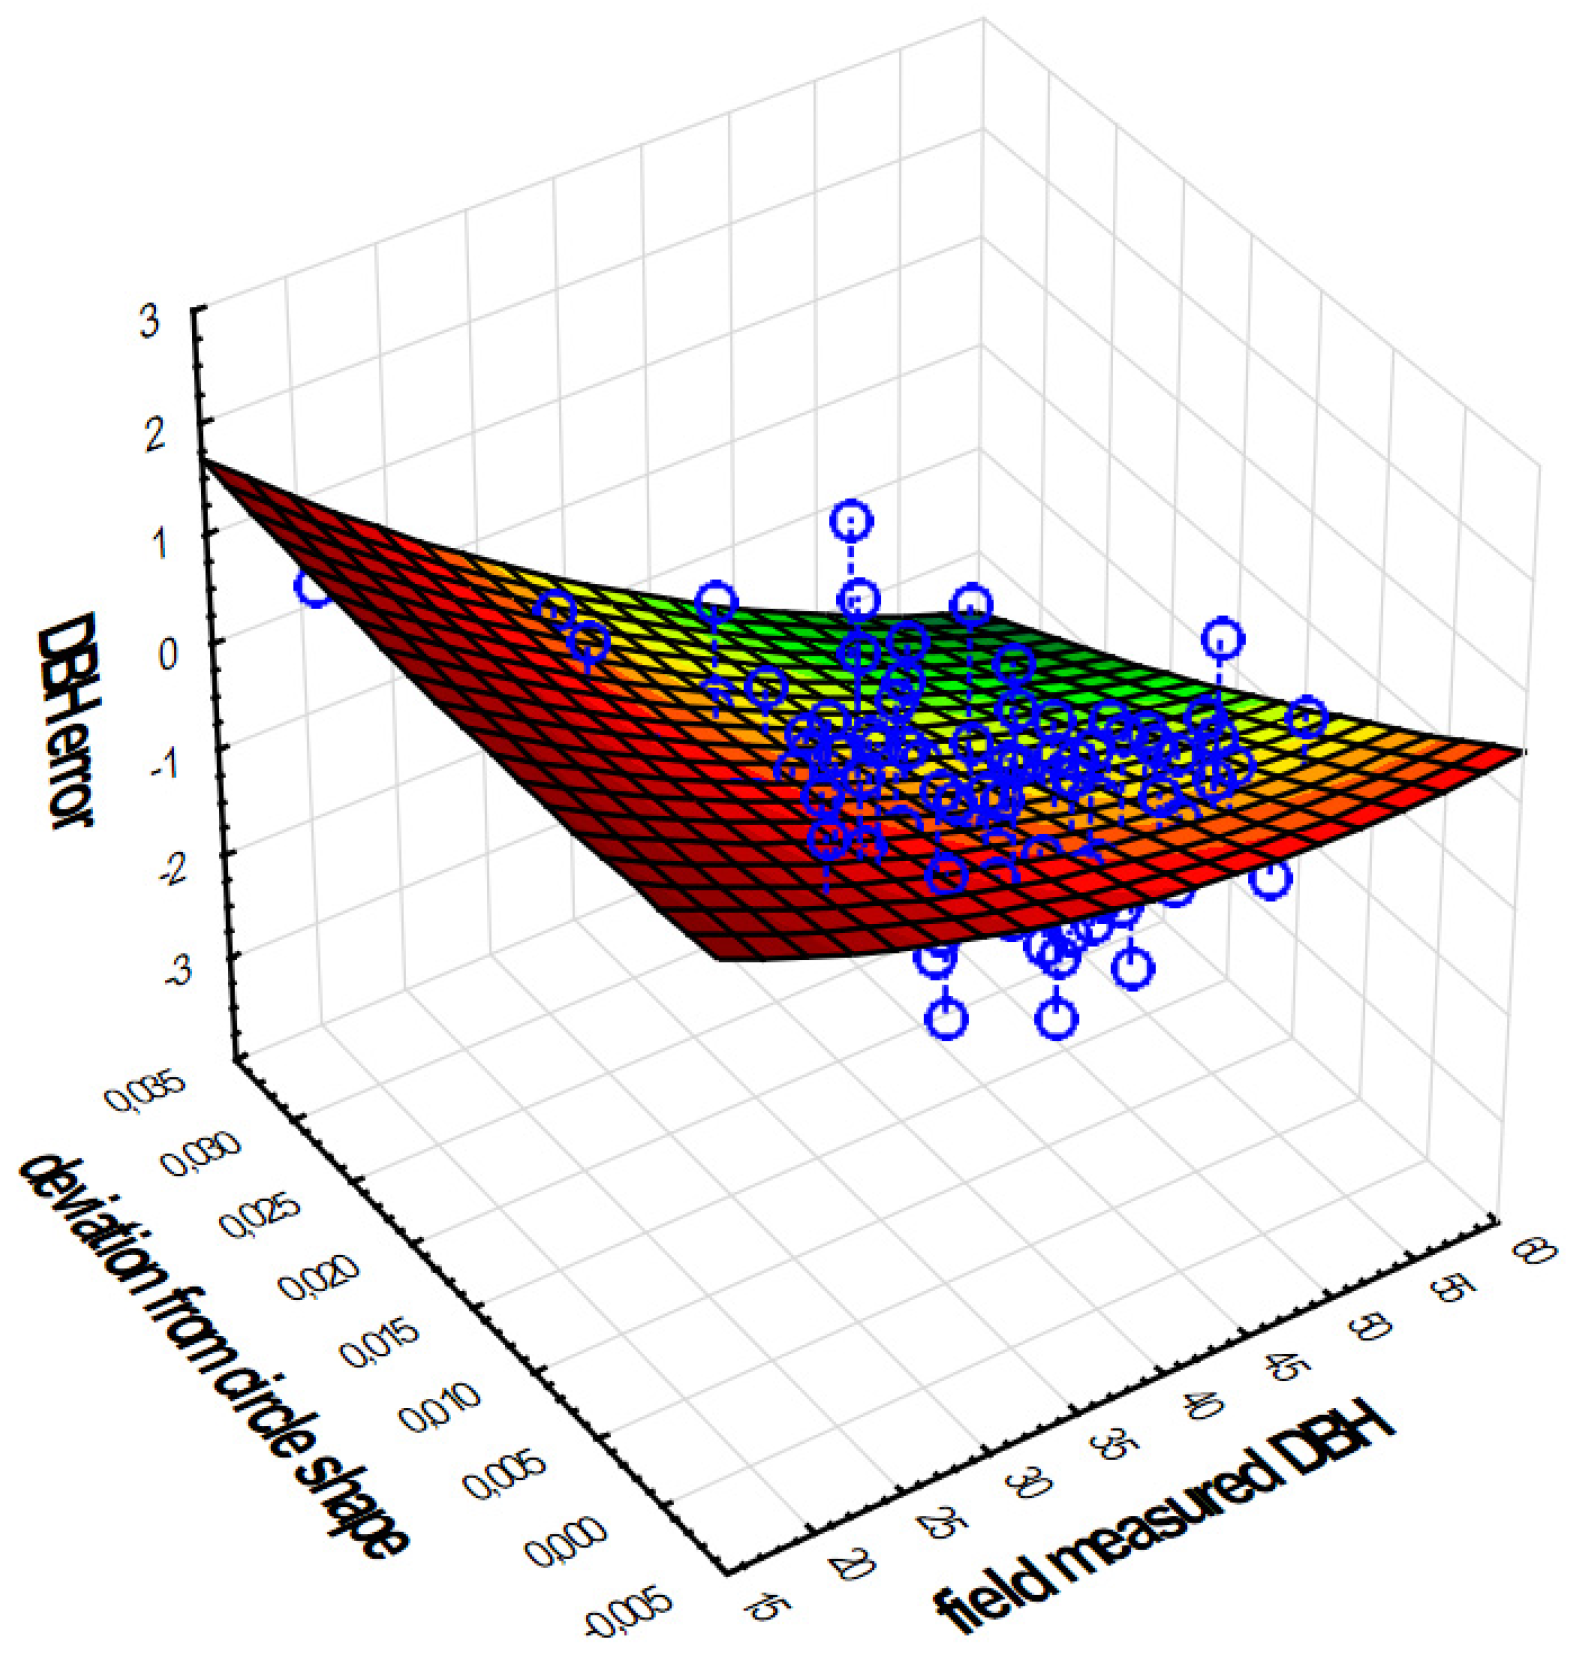
24] is the most suitable one, because it was primarily calculated for the territory of Central Europe. We found only a small correlation between the absolute DBH error and the deviation from the circular shape. In the case of multidimensional regression, it was found out that DBH error changes depending both on DBH (increases with the size of DBH) and on the deviation of the stem shape from the regular circular shape. At trees with a regular circular shape the error is relatively constant, unchanging with the diameter of the stem and mostly positive. Contrary to this, at trees with an irregular shape this error steeply decreases with diameter and is mostly negative (
Figure 12).
Apart from the mentioned accuracy, the method of combined aerial and terrestrial photogrammetry for forest inventory is very time-efficient in terms of field work and can reduce labor costs. In comparison with field measurement, we can reach sufficient accuracy in heights of trees, almost the same accuracy in DBH and furthermore we can get information about tree positions for forest structure modeling. However, the method can add some more time and money costs in terms of data processing, because it increases the requirements on software and hardware equipment. After optimization process, this methodology could serve as a good tool for fast forest inventory even in a commercial sector. Possible drawbacks for the deployment of this methodology in practice may be the rich vertical structure of the forest stands where it may be difficult to distinguish the points belonging to the stem from the points belonging to the regeneration or understory vegetation. Such problems may be solved by spectral-based classification of the pixels (point clouds). In temperate climate zone mixed forests rich in species, it may be also possible to use this kind of classification for species detection. Another drawback may be the occlusion of reference points in very dense canopies. The proposed method is targeting the mature stands before harvest where some canopy openings are expected, but in case of a fully closed upper crown layer these may become invisible. The possible solutions like placement of points outside the canopy, trying to enhance the visibility of those in the stand may be the subject of further research in this area.
5. Conclusions
In this work we presented a novel method for the determination of management inventory parameters using the combination of aerial and terrestrial SfM photogrammetry. This methodology may be a cheap and fast alternative for terrestrial measurement, with special focus on quick and precise determination of stem attributes in high-value timber class stands. We found the accuracy for height estimation to be highly precise, with a RMSE of 1 m, and for DBH estimation to be 0.9 cm and 1.8 cm for the two tested methods of convex hull and circumscribed circle, respectively. The two methods were selected as the most practical to be applied for the automatic shape detection. The method of convex hull, however, appears to be more precise and, so, it is recommendable for the point fields resulting from this kind of data acquisition.


