Article

Forest Biomass and Net Primary Productivity in Southwestern China: A Meta-Analysis Focusing on Environmental Driving Factors

1
State Key Laboratory of Environmental Geochemistry, Institute of Geochemistry, Chinese Academy of Sciences, Lincheng West Road 99, Guiyang 550081, China
2
Puding Karst Ecosystem Research Station, Chinese Academy of Sciences, Shawan at Longga village, Puding, Anshun 561000, China
3
College of Earth Sciences, University of Chinese Academy of Sciences, Yuquan Road 19A, Beijing 100049, China
*
Author to whom correspondence should be addressed.
Forests 2016, 7(8), 173; https://doi.org/10.3390/f7080173
Submission received: 18 June 2016 / Revised: 1 August 2016 / Accepted: 2 August 2016 / Published: 6 August 2016
(This article belongs to the Collection Forests Carbon Fluxes and Sequestration)

Abstract

:
Biomass and net primary productivity (NPP) are important factors for studying terrestrial carbon storage and the carbon cycle. Using data from existing literature, this study synthesized and analyzed a comprehensive database of direct field observations of forest biomass and NPP for Southwestern China. The biomass of mature natural forests and mature planted forests range from 81.2 Mg·ha−1 to 692.6 Mg·ha−1 (mean = 288.1 Mg·ha−1) and from 76.8 Mg·ha−1 to 670.1 Mg·ha−1 (mean = 181.5 Mg·ha−1), respectively. Mature natural forests have higher biomass than mature planted ones. The NPP values of natural and planted forests range from 1.4 Mg·ha−1·year−1 to 29.6 Mg·ha−1·year−1 (mean = 13.6 Mg·ha−1·year−1) and from 0.6 Mg·ha−1·year−1 to 26.5 Mg·ha−1·year−1 (mean = 9.9 Mg·ha−1·year−1), respectively. Correlations among biomass, NPP, and environmental factors show that NPP significantly decreases with latitude and increases with mean annual temperature, mean annual precipitation, growing degree-days on a 0 °C base, and mean annual drought index, whereas biomass positively correlates with stand age and leaf area index strongly. Karst forests exhibit almost the same NPP as non-karst forests, but the former have significantly lower biomass compared to the latter. Comprehensive regional data synthesis and analysis based on direct field observations of forest biomass and NPP are important for benchmarking global and regional vegetation and carbon models, estimating regional carbon content, restoring vegetation, and mitigating climate change.

Graphical Abstract

1. Introduction

Analysis of biomass and net primary productivity (NPP) is crucial to comprehensively understand carbon storage and the carbon cycle in terrestrial ecosystems at local, regional, and global scales. Site-based biomass and NPP observations were conducted by the International Biological Program from the 1960s to the 1970s, followed by subsequent regional as well as global carbon budget estimations, especially under global warming conditions in the Anthropocene. Since then, other methodologies, such as forest inventory, remote sensing, and vegetation and carbon modeling have been successfully utilized to adequately estimate vegetation biomass and NPP [1,2,3,4,5,6]. However, insufficiency of direct field biomass and NPP observations has severely limited the parameterization, validation, and uncertainty analysis of vegetation model-based and remote sensing-based carbon estimations [4,7,8]. These standardly and comprehensively synthesized observational data [9,10] not only provide accurate means to measure local, regional, and global carbon, but also serve as a basis for benchmarking land surface models [11,12,13].
From boreal forests to tropical rain forests, the majority of forest types worldwide can be found in China. They cover approximately half of China’s land area. The forest biomass in China influences both regional and global carbon budgets [14,15,16]. Therefore, large-scale biomass data syntheses based on field observations and forest inventories are needed to estimate carbon storage and understand the spatial processes in forest ecosystems. The biomass and NPP of China’s forests (natural and planted) have been measured and calculated in the field since the 1980s. Luo [17] was the first to perform country-level collection and synthesis of forest biomass and NPP data on the basis of field observations. However, the report was not officially published. Ni et al. [3] synthesized the key biomass features of major forest types in China on the basis of Luo’s digitized data (yet to be publically accessible). Ni [4] later numerically compared the observed NPP data with the simulated data from the Lund-Potsdam-Jena dynamic global vegetation model. Direct field observations of biomass and NPP in various forest zones [18,19] and their allocations [20] have also been summarized. However, these data are inaccessible and rarely updated. Forest classifications have sometimes been coarse because they focus on national-level syntheses. For example, Li and Ren [19] only studied five forest types. Regional synthesis of forest biomass data focused mostly on individual tree species, especially plantations such as Pinus massoniana [21] and Cunninghamia lanceolata [22]. There is an urgent need for national and regional biomass and NPP databases to be updated, as well as for other forest types in China to be included.
Southwestern China has diverse morphology consisting of mountains, hills, and plains, in addition to the peculiar feature of having large, continuous distributions of limestone and dolomite. Southwestern China is the largest of the three regions worldwide with extensively distributed continuous karst terrains. Its seven typical areas have been listed as Natural Heritages of the United Nations Educational, Scientific, and Cultural Organization since 2007. This whole region lies in the subtropical and northern tropical climate zones controlled by the East Asian monsoon system in the east and influenced by the Indian summer monsoon system in the west. Two types of morphologies set this region apart in terms of water use, soil, and vegetation. Zonal vegetation and its dominant soils [23,24] comprise tropical rain forests and seasonal forests (“laterite soil” in the soil classification system of China, and “Rhodic Ferralsol” in the FAO soil classification system), subtropical evergreen broadleaved forests (latosolic red soil/Haplic Ferralsol, Eurtic Vertisol, Humic Acrisol and Haplic Acrisol, red soil/Haplic Acrisol, and yellow soil/Haplic Alisol and Haplic Acrisol), and northern subtropical mixed evergreen-deciduous broadleaved forests (yellow-brown soil/Haplic Luvisol). However, azonal vegetation, instead of zonal forest types controlled by climates, dominates karst regions. Such vegetation covers mixed evergreen-deciduous forests and thorn shrubland (a degraded special vegetation dominated by shrubs with thorn branches) determined by the local calcareous soil [23,24]. Karst forests often grow on rocks or in fissures, thereby complicating biomass sampling, especially for roots. As a result, biomass research on karst forests trails far behind that of non-karst forests. Human disturbance has strongly influenced regional environments for ages, limiting natural forests only to natural reserves and remote mountains. Rocky desertification (a desert-like landscape with exposed rock) often occurs after deforestation or land degradation because of intensive anthropogenic disturbances [25]. Protecting these forests is very necessary and biomass and NPP features of these forests must be studied in Southwestern China.
Regional syntheses of forest biomass and NPP data were reported on the basis of Luo’s data [26] and other updates [27]. However, only some administrative divisions in Southwestern China were included in these studies. In the present study, an extended search was conducted to identify forest biomass and NPP observations in Southwestern China in publications up to 2013. It aims to (1) explore spatial patterns of forest biomass and NPP, and then to average biomass densities to generate further estimates of regional carbon budget; and (2) investigate their relationships with driving ecological (climate factors and stand characteristics) and geological factors (morphology) to quantify their differences in terms of vegetation types, stand features, bioclimate zones, and morphologies. Natural and planted forests were separately analyzed. These data will be included in the global database for model validation and will contribute to the improvement of regional forest management.

2. Materials and Methods

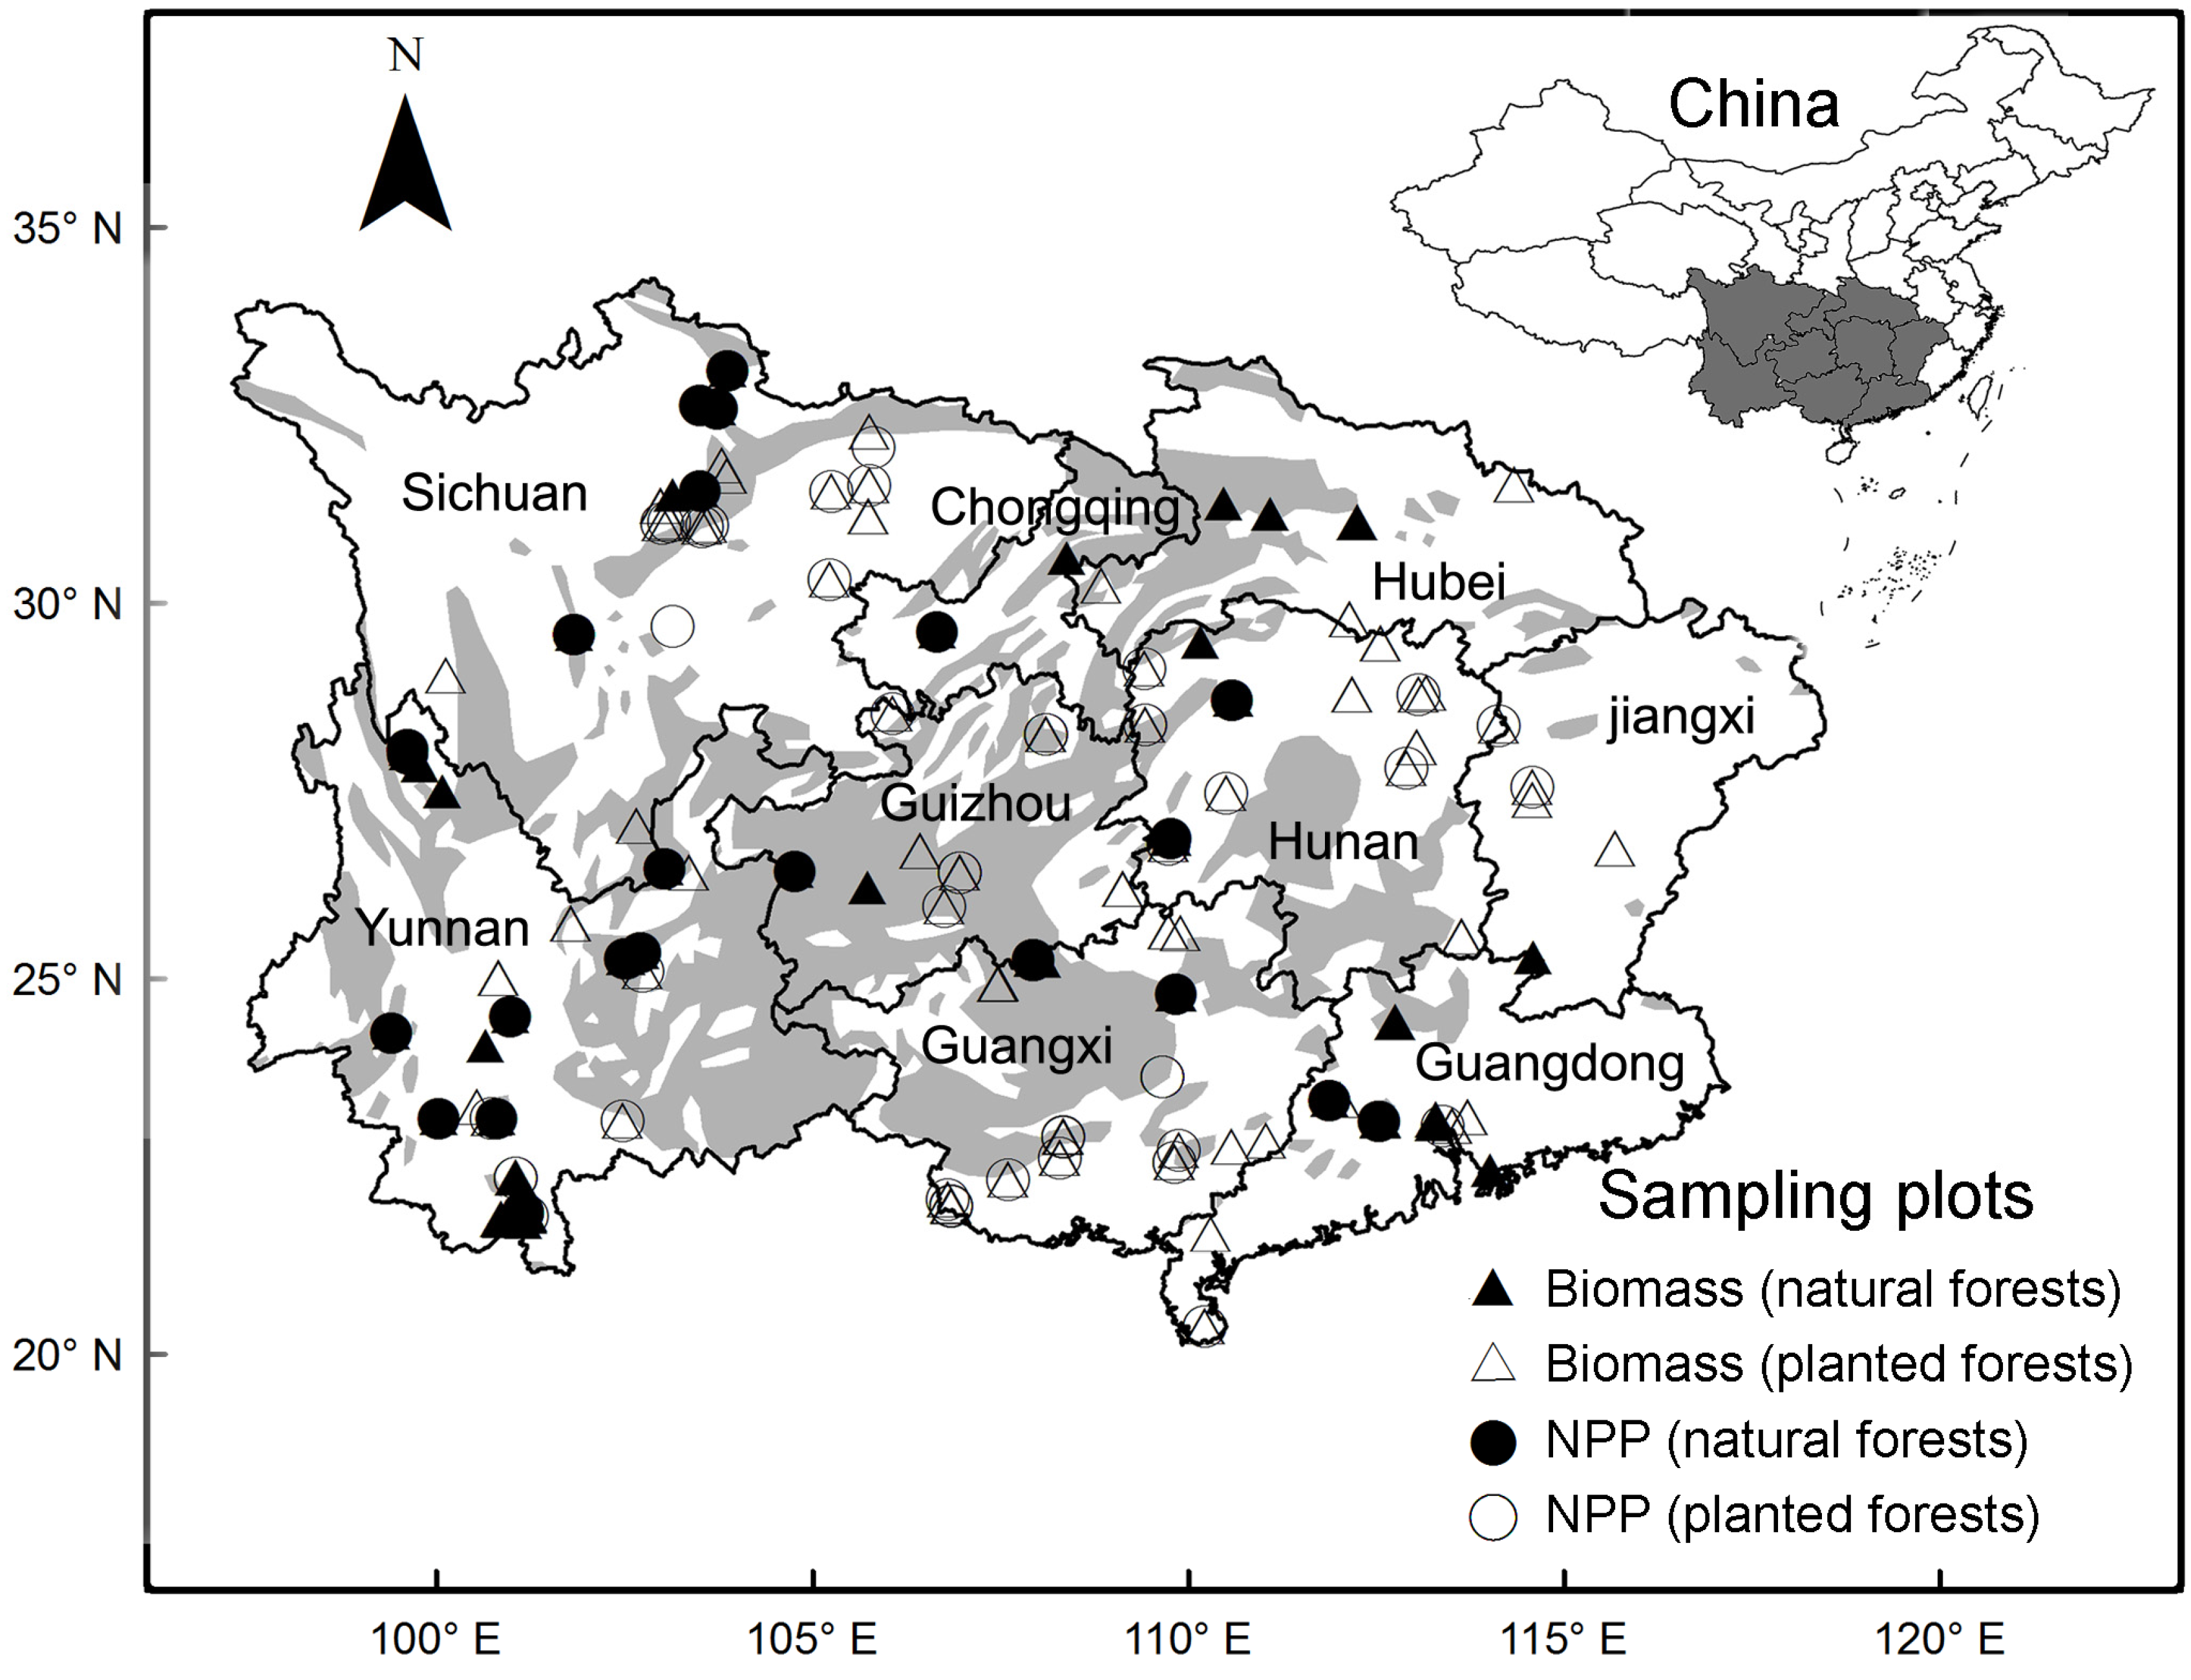
2.1. Data Collection and Treatments

Direct field observational data of forest biomass and NPP were extracted from papers in 62 peer-reviewed journals published from 1982 to early 2013. Forests from the Southwestern China including Guangdong, Guangxi, Guizhou, Hunan, Sichuan, Yunnan, Hubei, Jiangxi, and Chongqing (Figure 1) were classified into seven types (Table 1). All available forest samples were initially collected, but only samples with observations of total forest biomass or NPP, including all components and, with clear documentation, were used for further analyses (see Table S1 for details). The stand age and leaf area index (LAI) were occasionally recorded. In total, data from 411 plots were adopted, including 14 SEDBFs, 117 SEBFs, 53 SDBFs, 13 SSEBFs, 154 SECFs, 28 SCBFs, and 32 TRSFs. Data measured and calculated from natural forests (with no anthropogenic disturbances such as harvest and fertilization, but with some grazing cows and goats) and plantations, as well as from karst and non-karst forests, were separated in accordance with the original literature.
Each sampling site had one or multiple sampling plots. The original data and not the further averaged data across the multiple sampling plots at a given sampling site were used in this study. The database was sorted by forest type with records of latitude, longitude, elevation, species composition, and measured biomass, and/or calculated NPP of each component (e.g., leaf, branch, stem, and root). In general, the aboveground biomass (AGB) of trees was measured using allometric functions, or by the average standard tree method using the stand density multiplied by biomass of average standard trees which could represent the stand. The belowground biomass (BGB) was measured using various techniques such as allometric functions, average standard tree, soil column, and AGB–BGB ratio. For estimating biomass by the allometric function method, tree height and diameter at breast height are commonly used to determine their relationships with AGB and BGB. The biomass of lianas, saplings, shrubs and herbs (both AGB and BGB) were measured using the direct harvest method. Forest NPP was the sum of annual net increments of lianas, saplings, shrubs, herbs, and tree stem, branch, leaf, and root. The re-census periods varied across different studies, typically from two to seven years. Methods for measuring LAI are mentioned only sparingly in the literature. Here, the weighing method, which considers the specific leaf area and dry leaf weight of standard trees, shrubs, and herbs, was used to calculate LAI.
The database used in this study rejected data with only partial components (e.g., AGB) to ensure high data quality. The total forest biomass and NPP adopted in the present study are aimed at living green vascular plants. Ground layer biomass, which includes lichens, bryophytes, litter, and woody debris, was not always included. Measurements of loss due to mortality and grazing in NPP estimation were not included in these studies, either. However, these are imperfections that exist in current biomass and NPP studies, and should not influence the quality of our database or analyses. Nevertheless, a more complete database that includes all possible components, especially belowground parts, as well as accurate biomass measurements and NPP calculations must be considered in future studies of vegetation ecology and global change science.

2.2. Climate Factors

Many of the biomass/NPP study sites are located far from meteorological stations and have different sampling intervals. Therefore, spatially-interpolated climate data within the same observational period was used. The monthly temperature, precipitation, and percentage of sunshine hours used in this study were averaged over long-term records from 1971 to 2000 at 1814 meteorological stations across China (China Meteorological Administration, unpublished data from 2003). Data were interpolated into 1 km grid cells using a thin plate smoothing spline surface fitting technique [28] that considers the impact of elevation on the basis of the SRTM digital elevation model [29]. Mean annual temperature (MAT), mean annual precipitation (MAP), growing degree-days on a 0 °C base (GDD0), and mean annual drought index (DI) (the D-value of potential and actual evaporation divided by potential evaporation) were calculated as described by Prentice et al. [30] and Gallego-Sala et al. [31] to analyze relationships between biomass/NPP and climates.

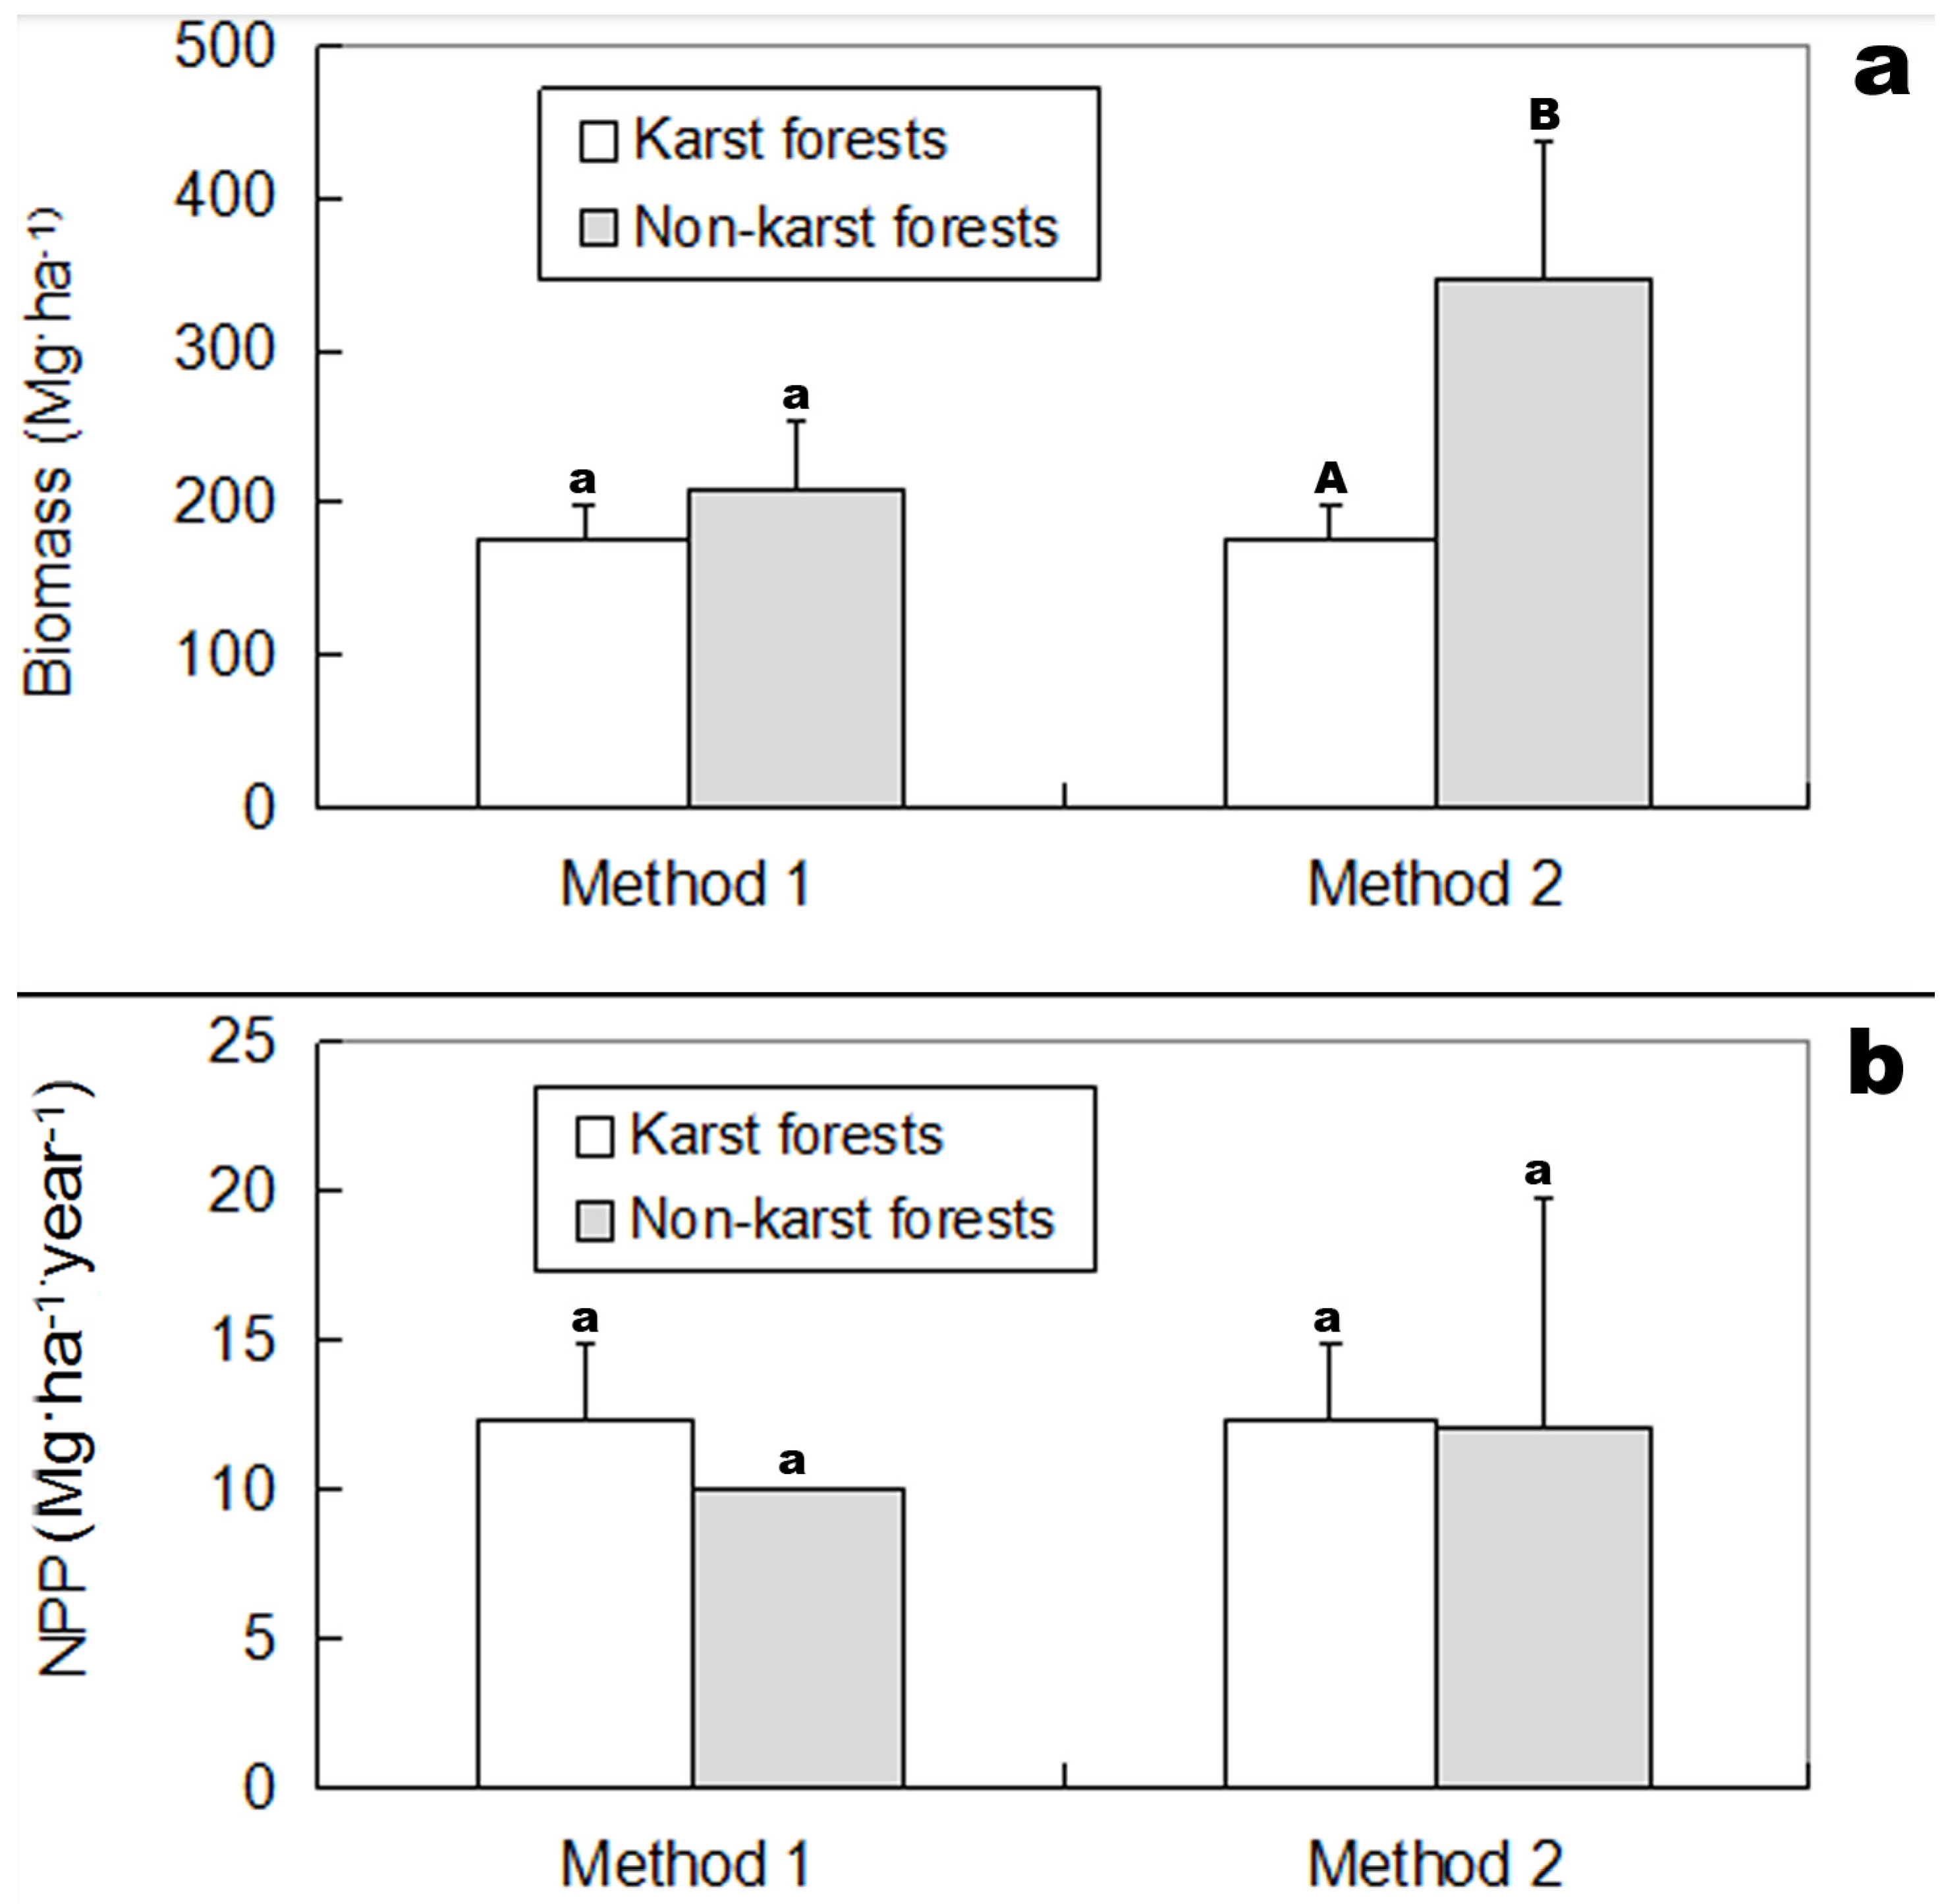
2.3. Biomass and NPP of Karst and Non-Karst Forests

Since the number of karst forests is very limited, we cannot focus on every forest type and on each latitudinal belt. Therefore, only a certain forest type and a certain latitudinal belt were selected. Two methods were used to analyze the biomass and NPP discrepancies between karst and non-karst forests. One involved analyzing discrepancies within a certain forest type, which was resolved by excluding the influence of forest type. The non-karst zonal SEDBF and the karst azonal SEDBF are examples of this scenario. The other involved analyzing discrepancies between karst and non-karst forests within a small latitude interval of 25° to 27°, where most karst forests are distributed. In such cases, the influence of climate was excluded as much as possible.

2.4. Data Analyses

Deficiencies in the database with more than 50% of missing data for some variables make us not to be able to use the multiple regression [32] or structural equation modelling [33] to analyze patterns of biomass and NPP data related to environments, multivariate analyses are therefore used here. One-Way analysis of variance (ANOVA) was used to analyze differences in biomass among various forest types. Independent samples t-test was conducted to determine differences in biomass and NPP between natural and planted forests, between karst and non-karst forests, and to show differences in climates (MAT and MAP) between karst and non-karst forests. Pearson’s correlation analysis and redundancy analysis (RDA) were further used to explore the relationships among forest biomass, NPP and environmental driving factors. All statistical analyses were performed using SPSS version 19 and CANOCO 5.

3. Results

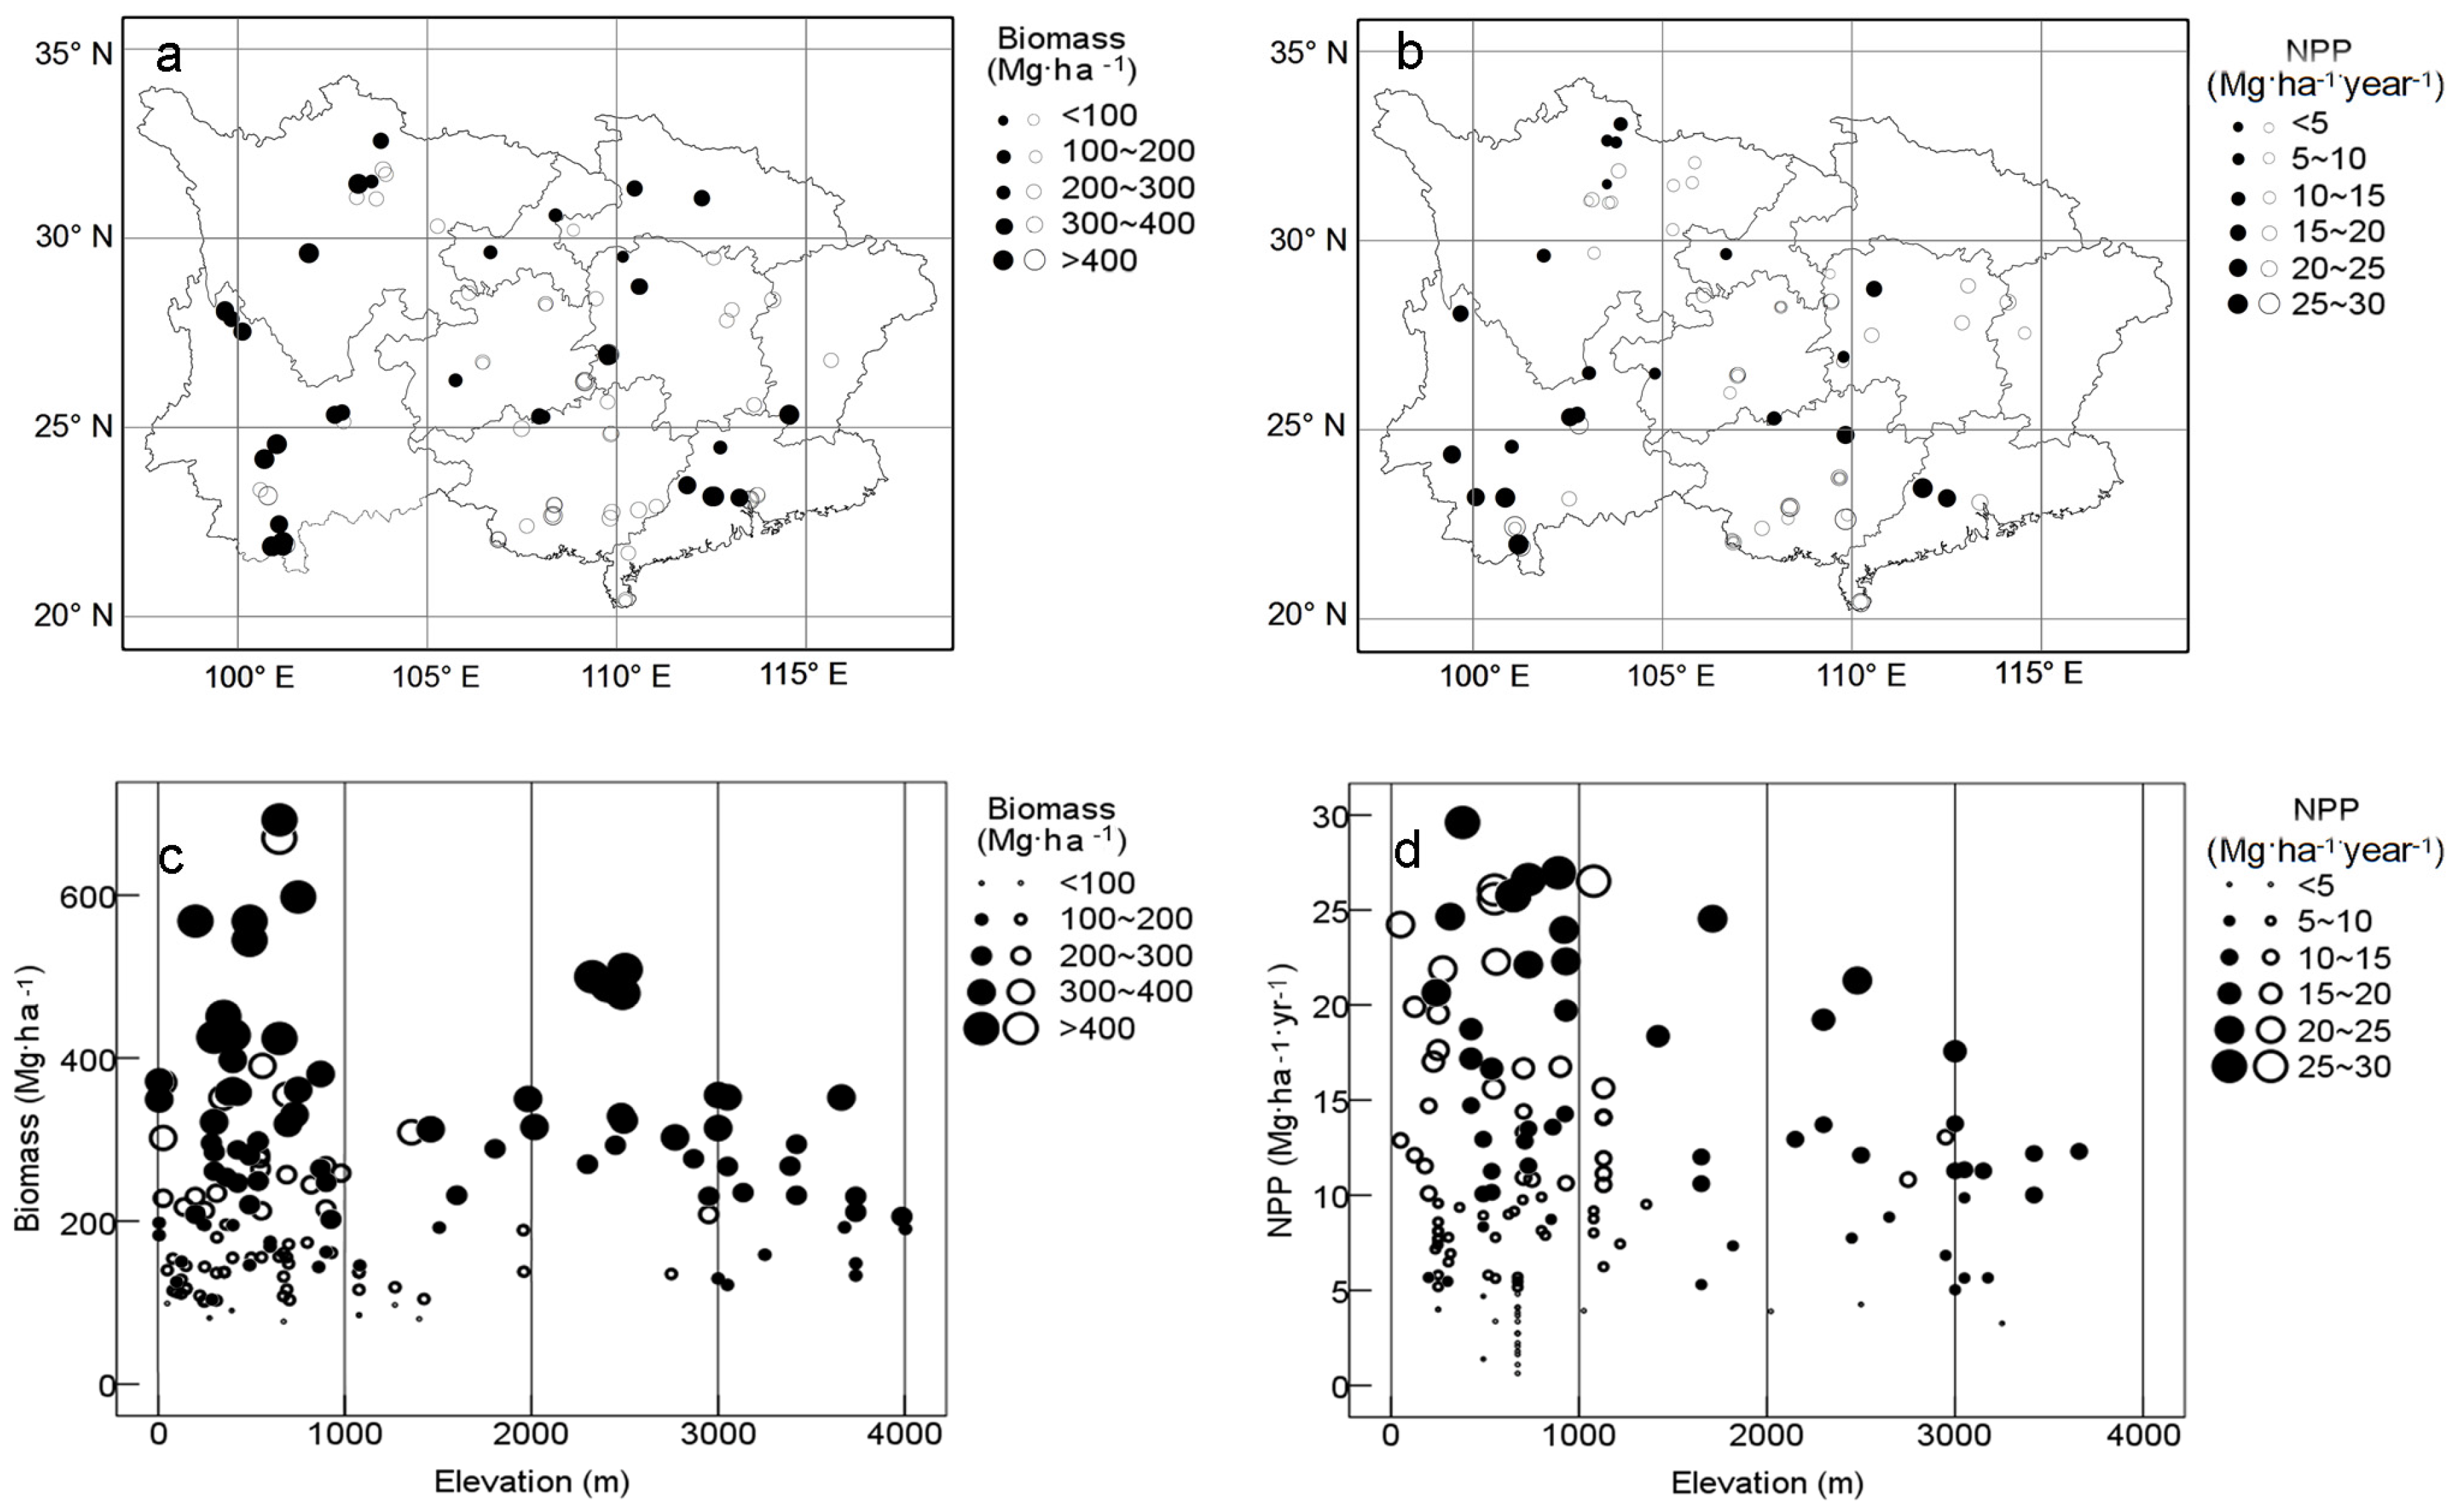
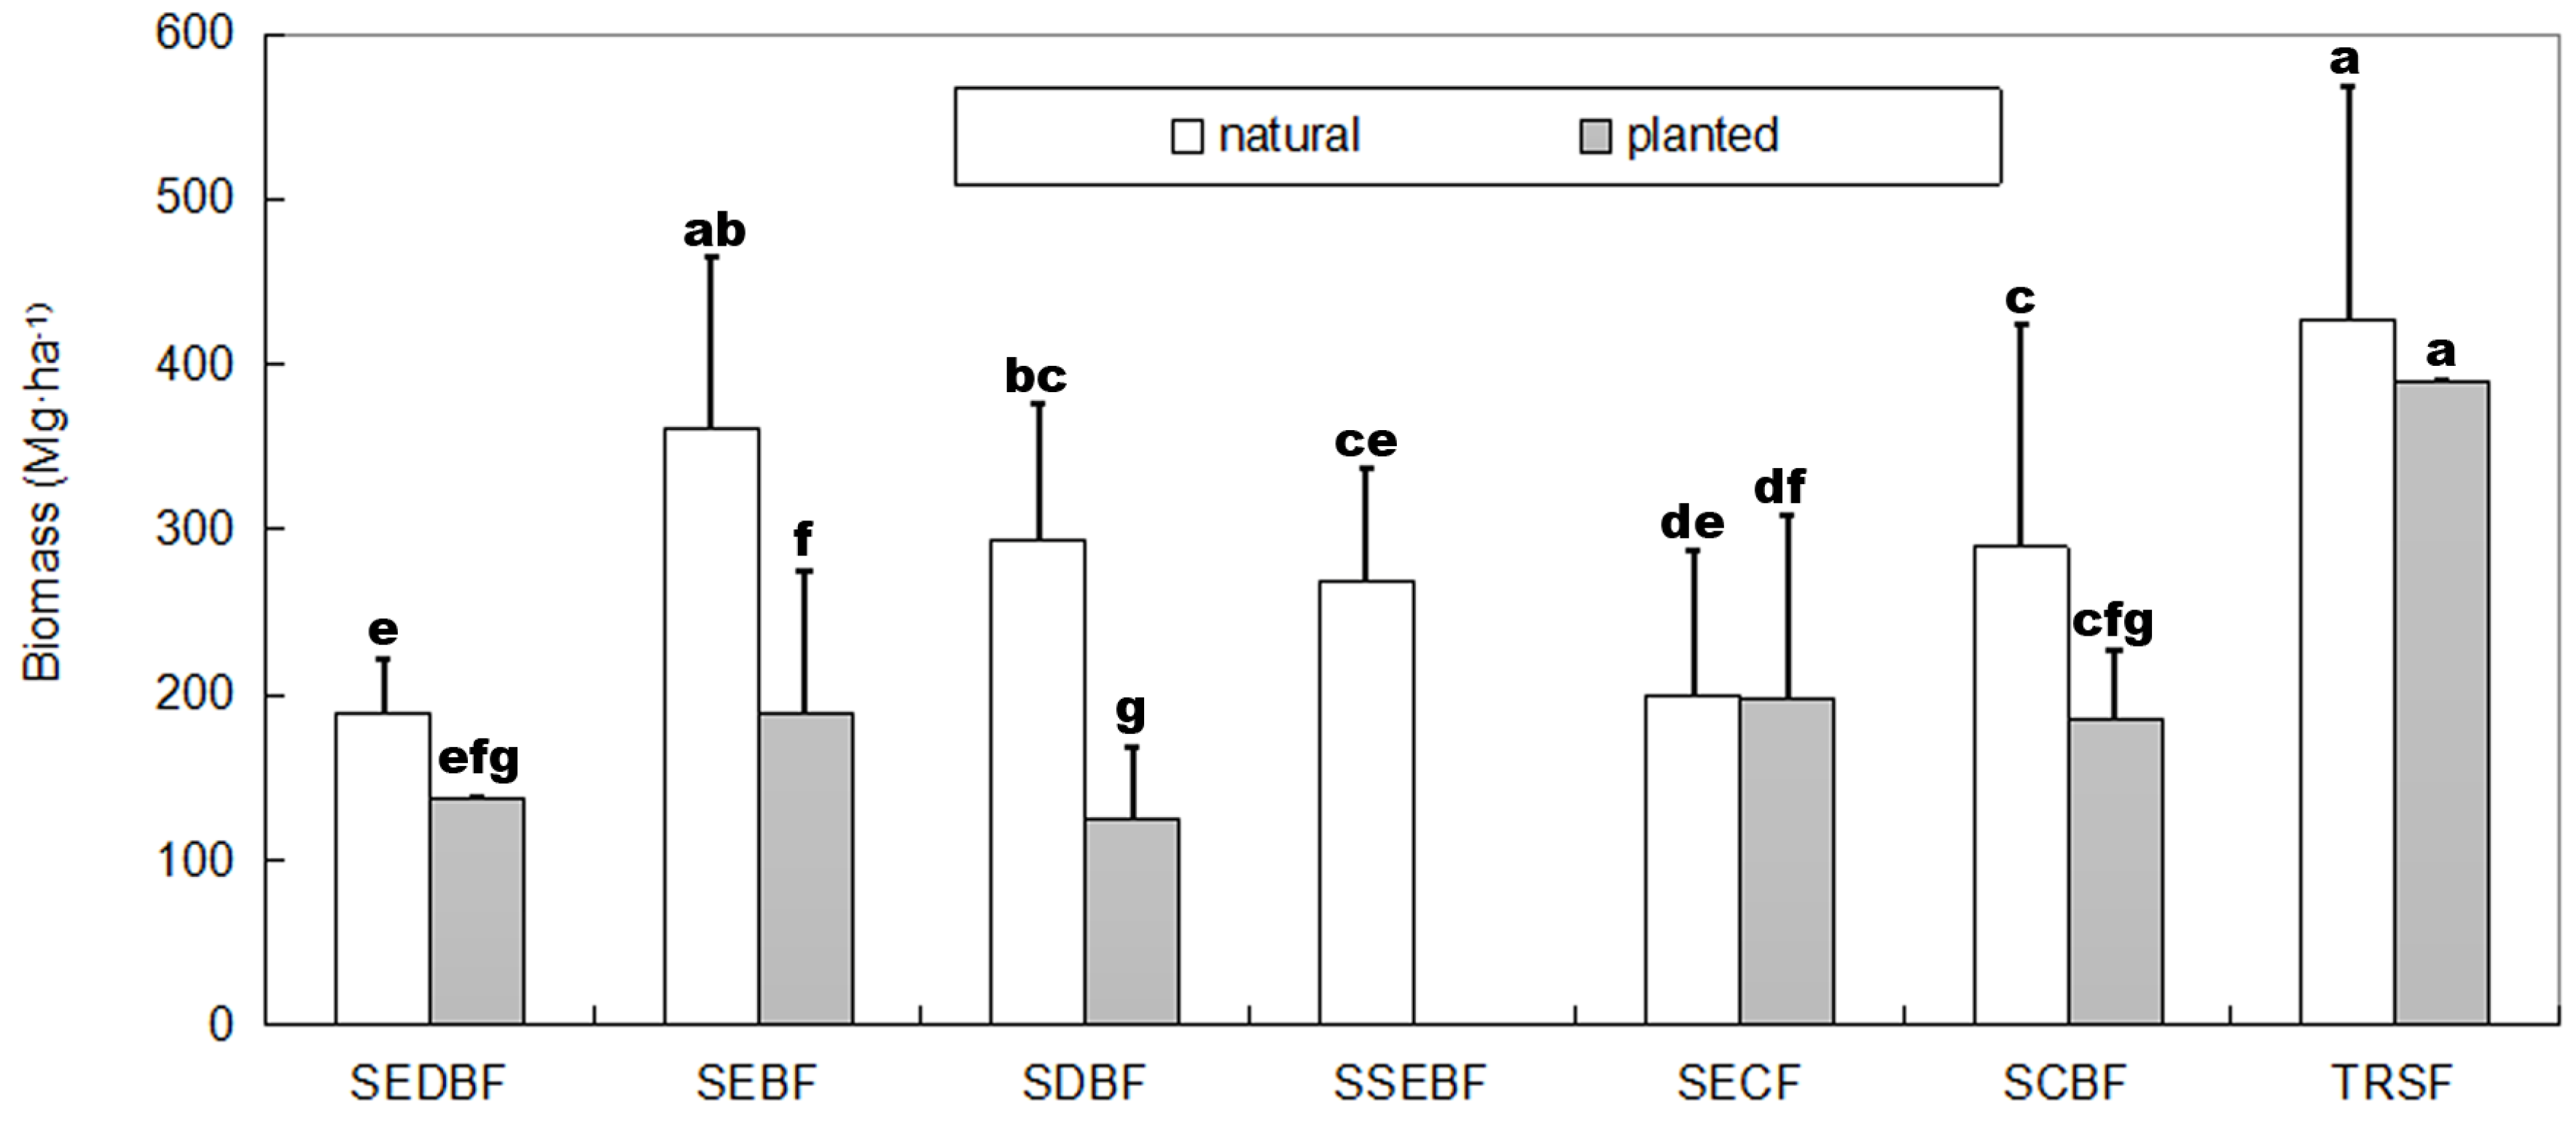
3.1. Biomass and NPP

The biomass of mature natural forests ranged from 81.2 Mg·ha−1 to 692.6 Mg·ha−1 (mean = 288.1 Mg·ha−1), whereas those of mature planted forests ranged from 76.8 Mg·ha−1 to 670.1 Mg·ha−1 (mean = 181.5 Mg·ha−1) (Figure 2a). Biomass differs in terms of forest type (Figure 3). TRSFs have the highest biomass in both natural and planted forests. However, the biomass order of other forest types is inconsistent between natural and planted forests (Figure 3). Mature natural forests have higher biomass than mature planted ones (p < 0.01). As for different forest types, all natural forest types have relatively higher biomass than their planted counterparts (Figure 3). This is especially true (p < 0.01) for SEBFs and SDBFs, wherein the biomass of natural forest types are approximately twice those of planted ones. The NPP values of natural and planted forests range from 1.4 Mg·ha−1·year−1 to 29.6 Mg·ha−1·year−1 (mean = 13.6 Mg·ha−1·year−1) and from 0.6 Mg·ha−1·year−1 to 26.5 Mg·ha−1·year−1 (mean = 9.9 Mg·ha−1·year−1), respectively (Figure 2b). Both NPP and biomass show no clear relationships with longitude (correlation coefficients are between −0.165 and 0.087) but negatively correlate with latitude (between −0.069 and −0.648). In particular, NPP (p < 0.01) and biomass of natural forests (p < 0.05) significantly increase from north to south (Figure 2a,b and Figure 4). The elevation of natural forest biomass study sites ranges from 5 m to 4003 m (mean = 1425.2 m), whereas that of natural forest NPP study sites ranges from 200 m to 3660 m (mean = 1557.5 m) (Figure 2c,d). However, the elevation spans of planted forest biomass and NPP study sites are much smaller, only ranging from 28 m to 2950 m (mean = 649.3 m) and from 50 m to 2950 m (mean = 688.3 m), respectively (Figure 2c,d), because of data availability.
High-biomass natural forests only occur in the TRSFs of the southernmost areas and in the old SECFs of remote mountain areas. However, high-biomass forests are more evenly distributed across all of the planted forests. In addition, TRSFs, SECFs, and SEBFs grown under conducive environmental conditions can be high-biomass forests. Some coniferous forests (e.g., Pinus massoniana and Cunninghamia lanceolata forests) and deciduous broadleaved forests (e.g., Betula alnoides forest) that grow under harsh environmental conditions are low-biomass forests (Table S1). High NPP occurs in TRSFs and subtropical broadleaved forests in southernmost areas, and low NPP occurs in very mature SCBFs and SECFs (Table S1).
The average biomass of karst SEDBFs is 176.2 Mg·ha−1, which is slightly (p > 0.05) lower than that of non-karst forests (209.9 Mg·ha−1) (Figure 5a). In the latitude interval of 25° to 27°, the average biomass of karst forests (176.2 Mg·ha−1) is significantly (p < 0.01) lower than that of non-karst forests (347.3 Mg·ha−1) (Figure 5a). However, karst forests and non-karst forests share almost the same NPP (Figure 5b).

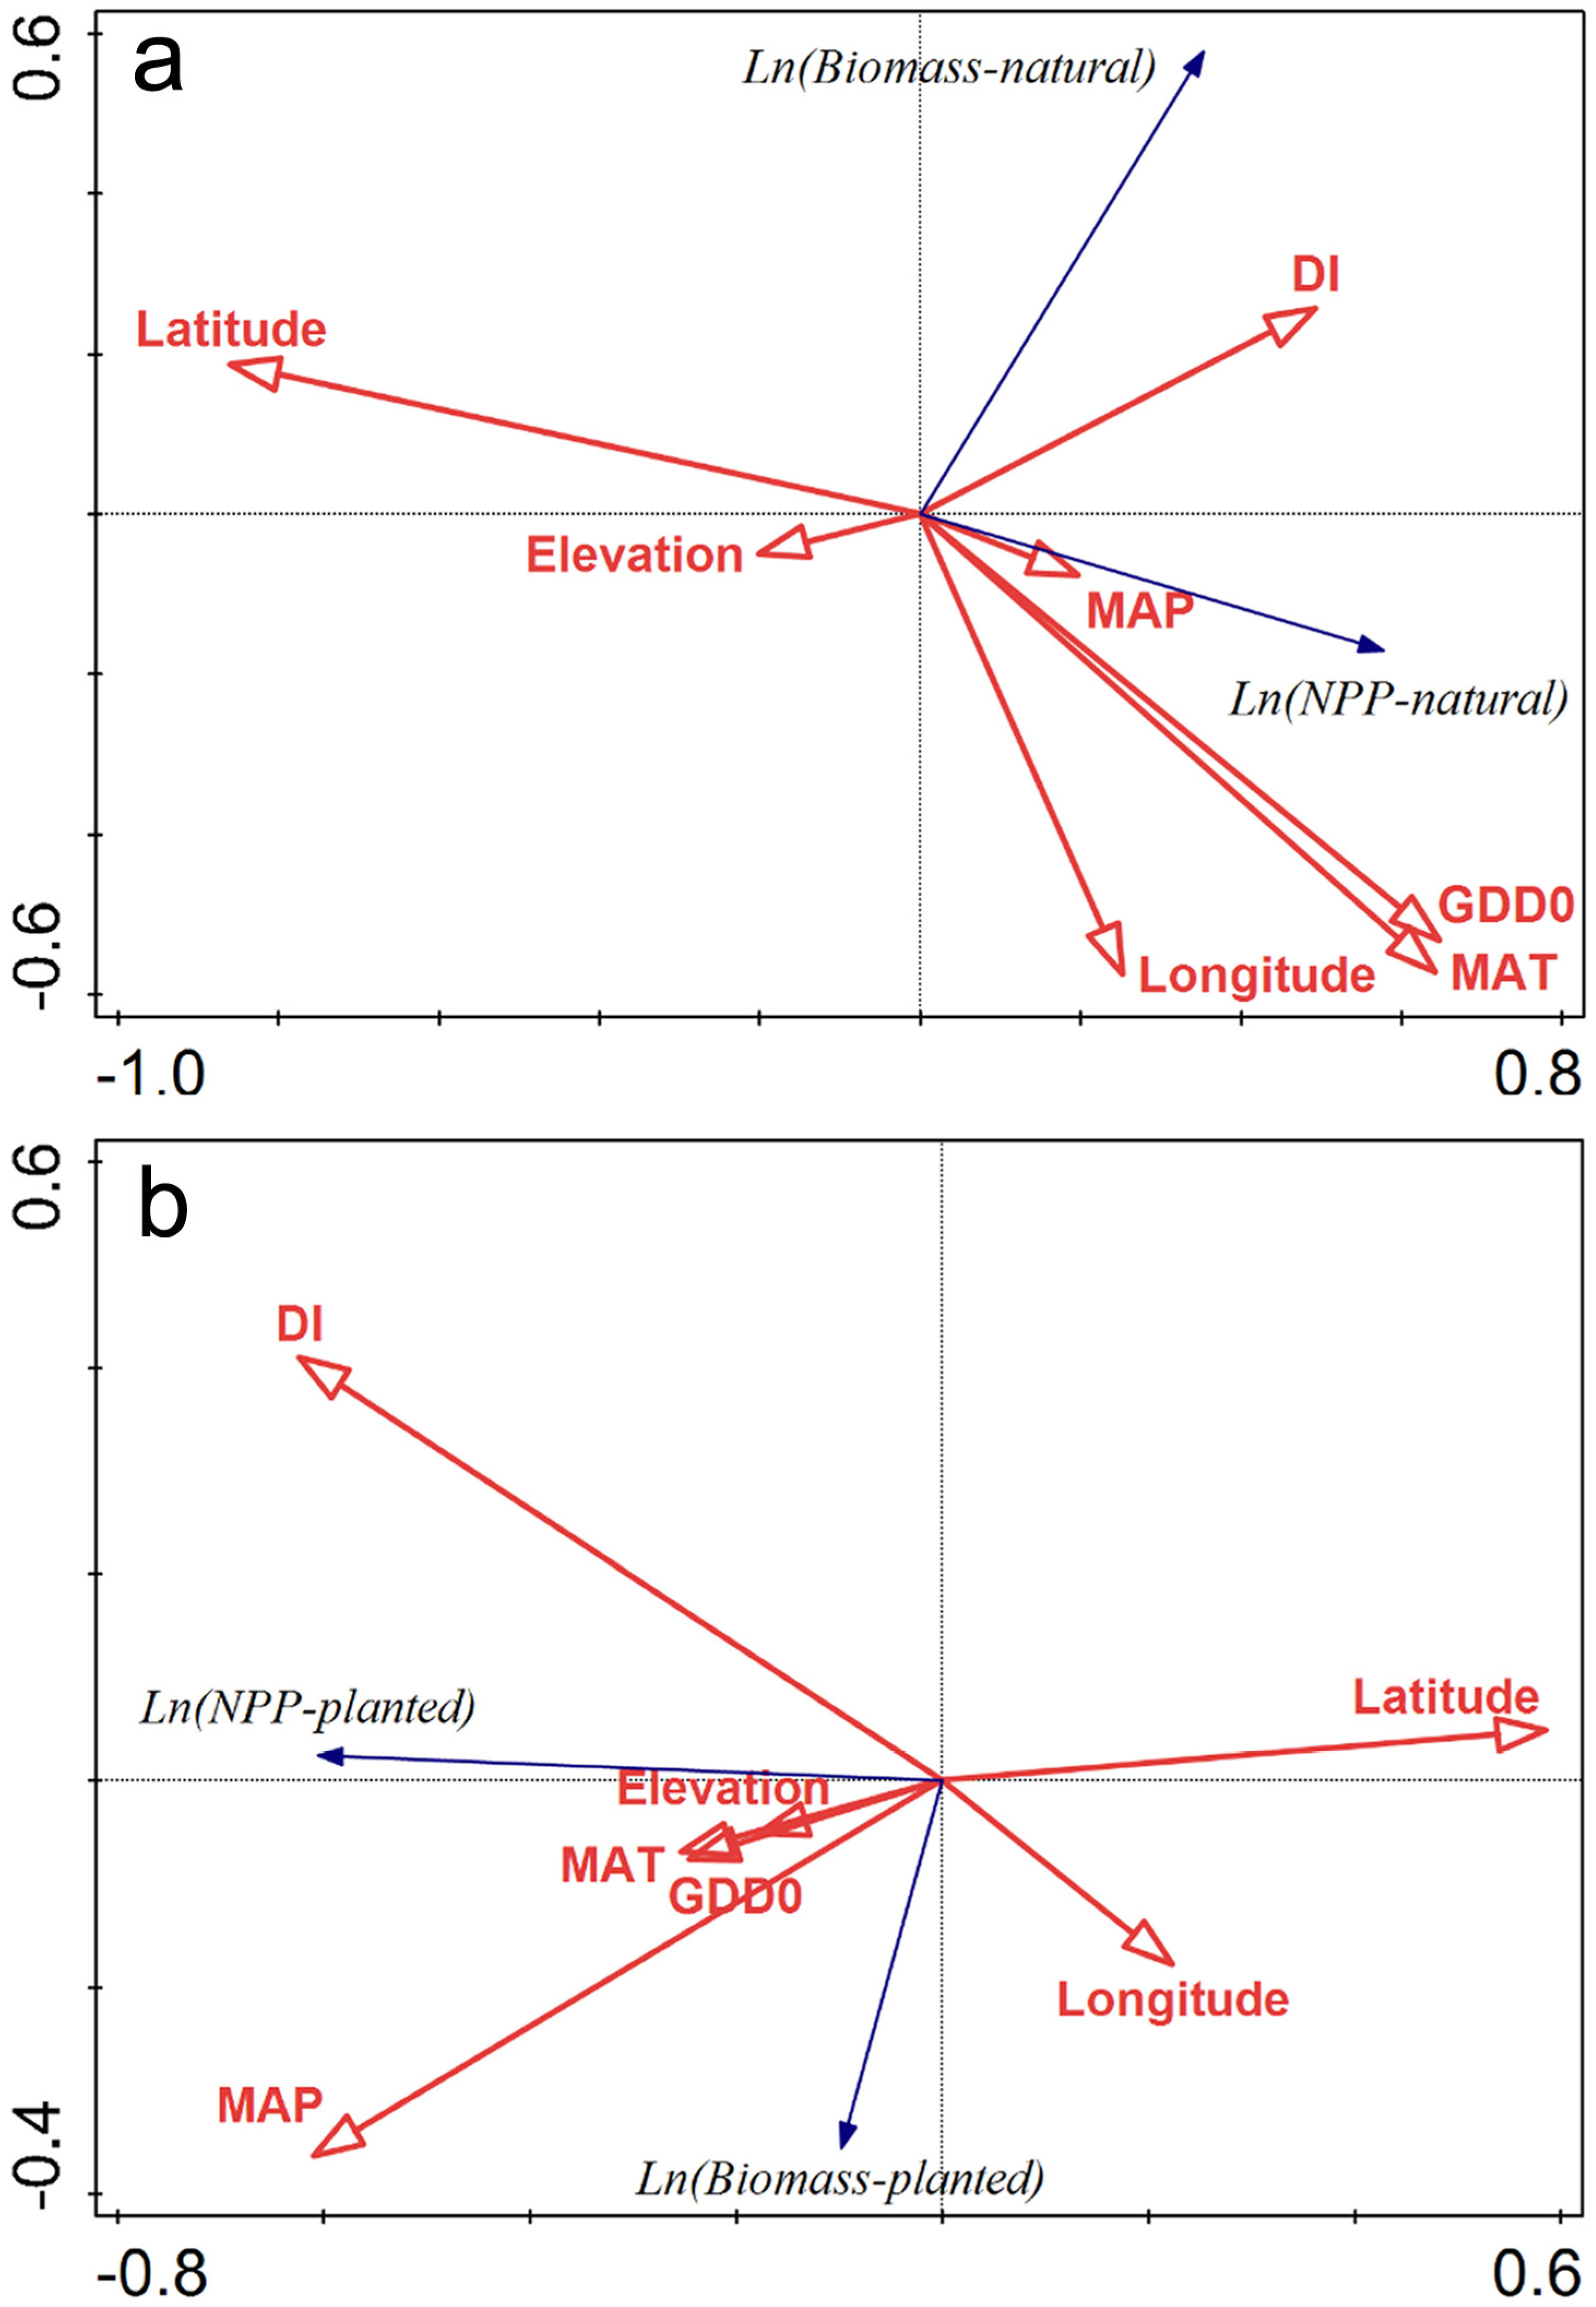
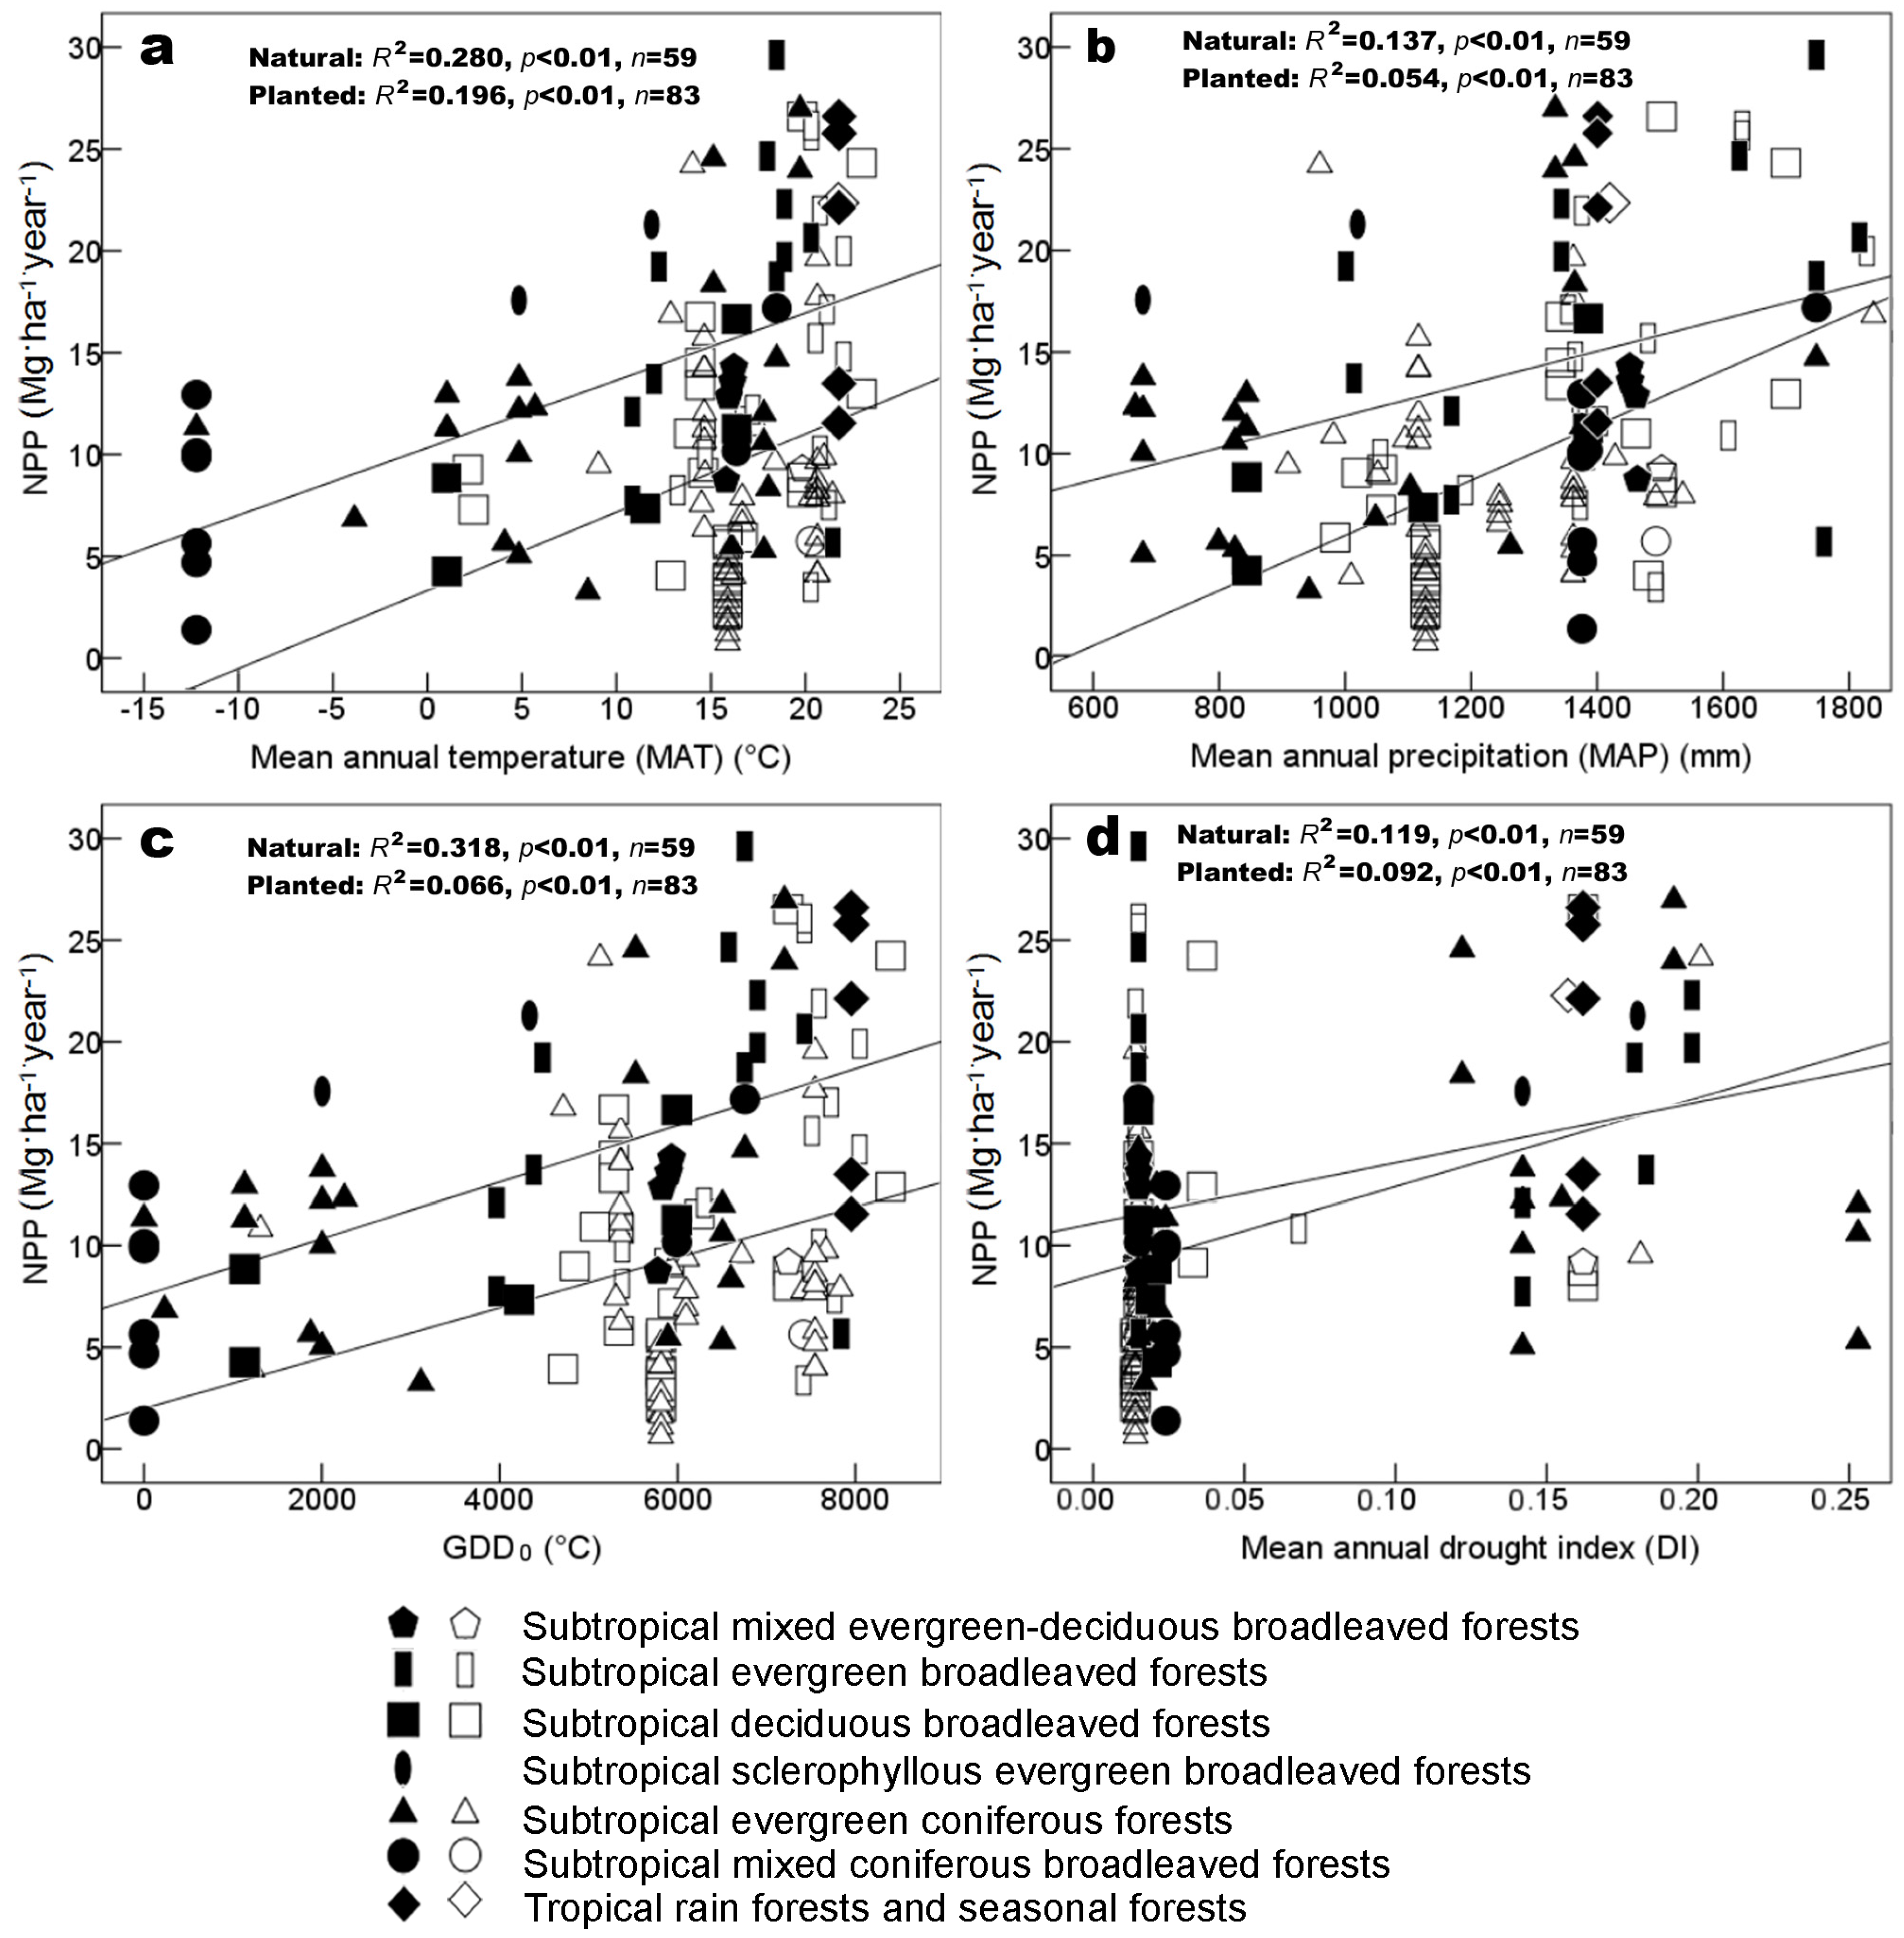
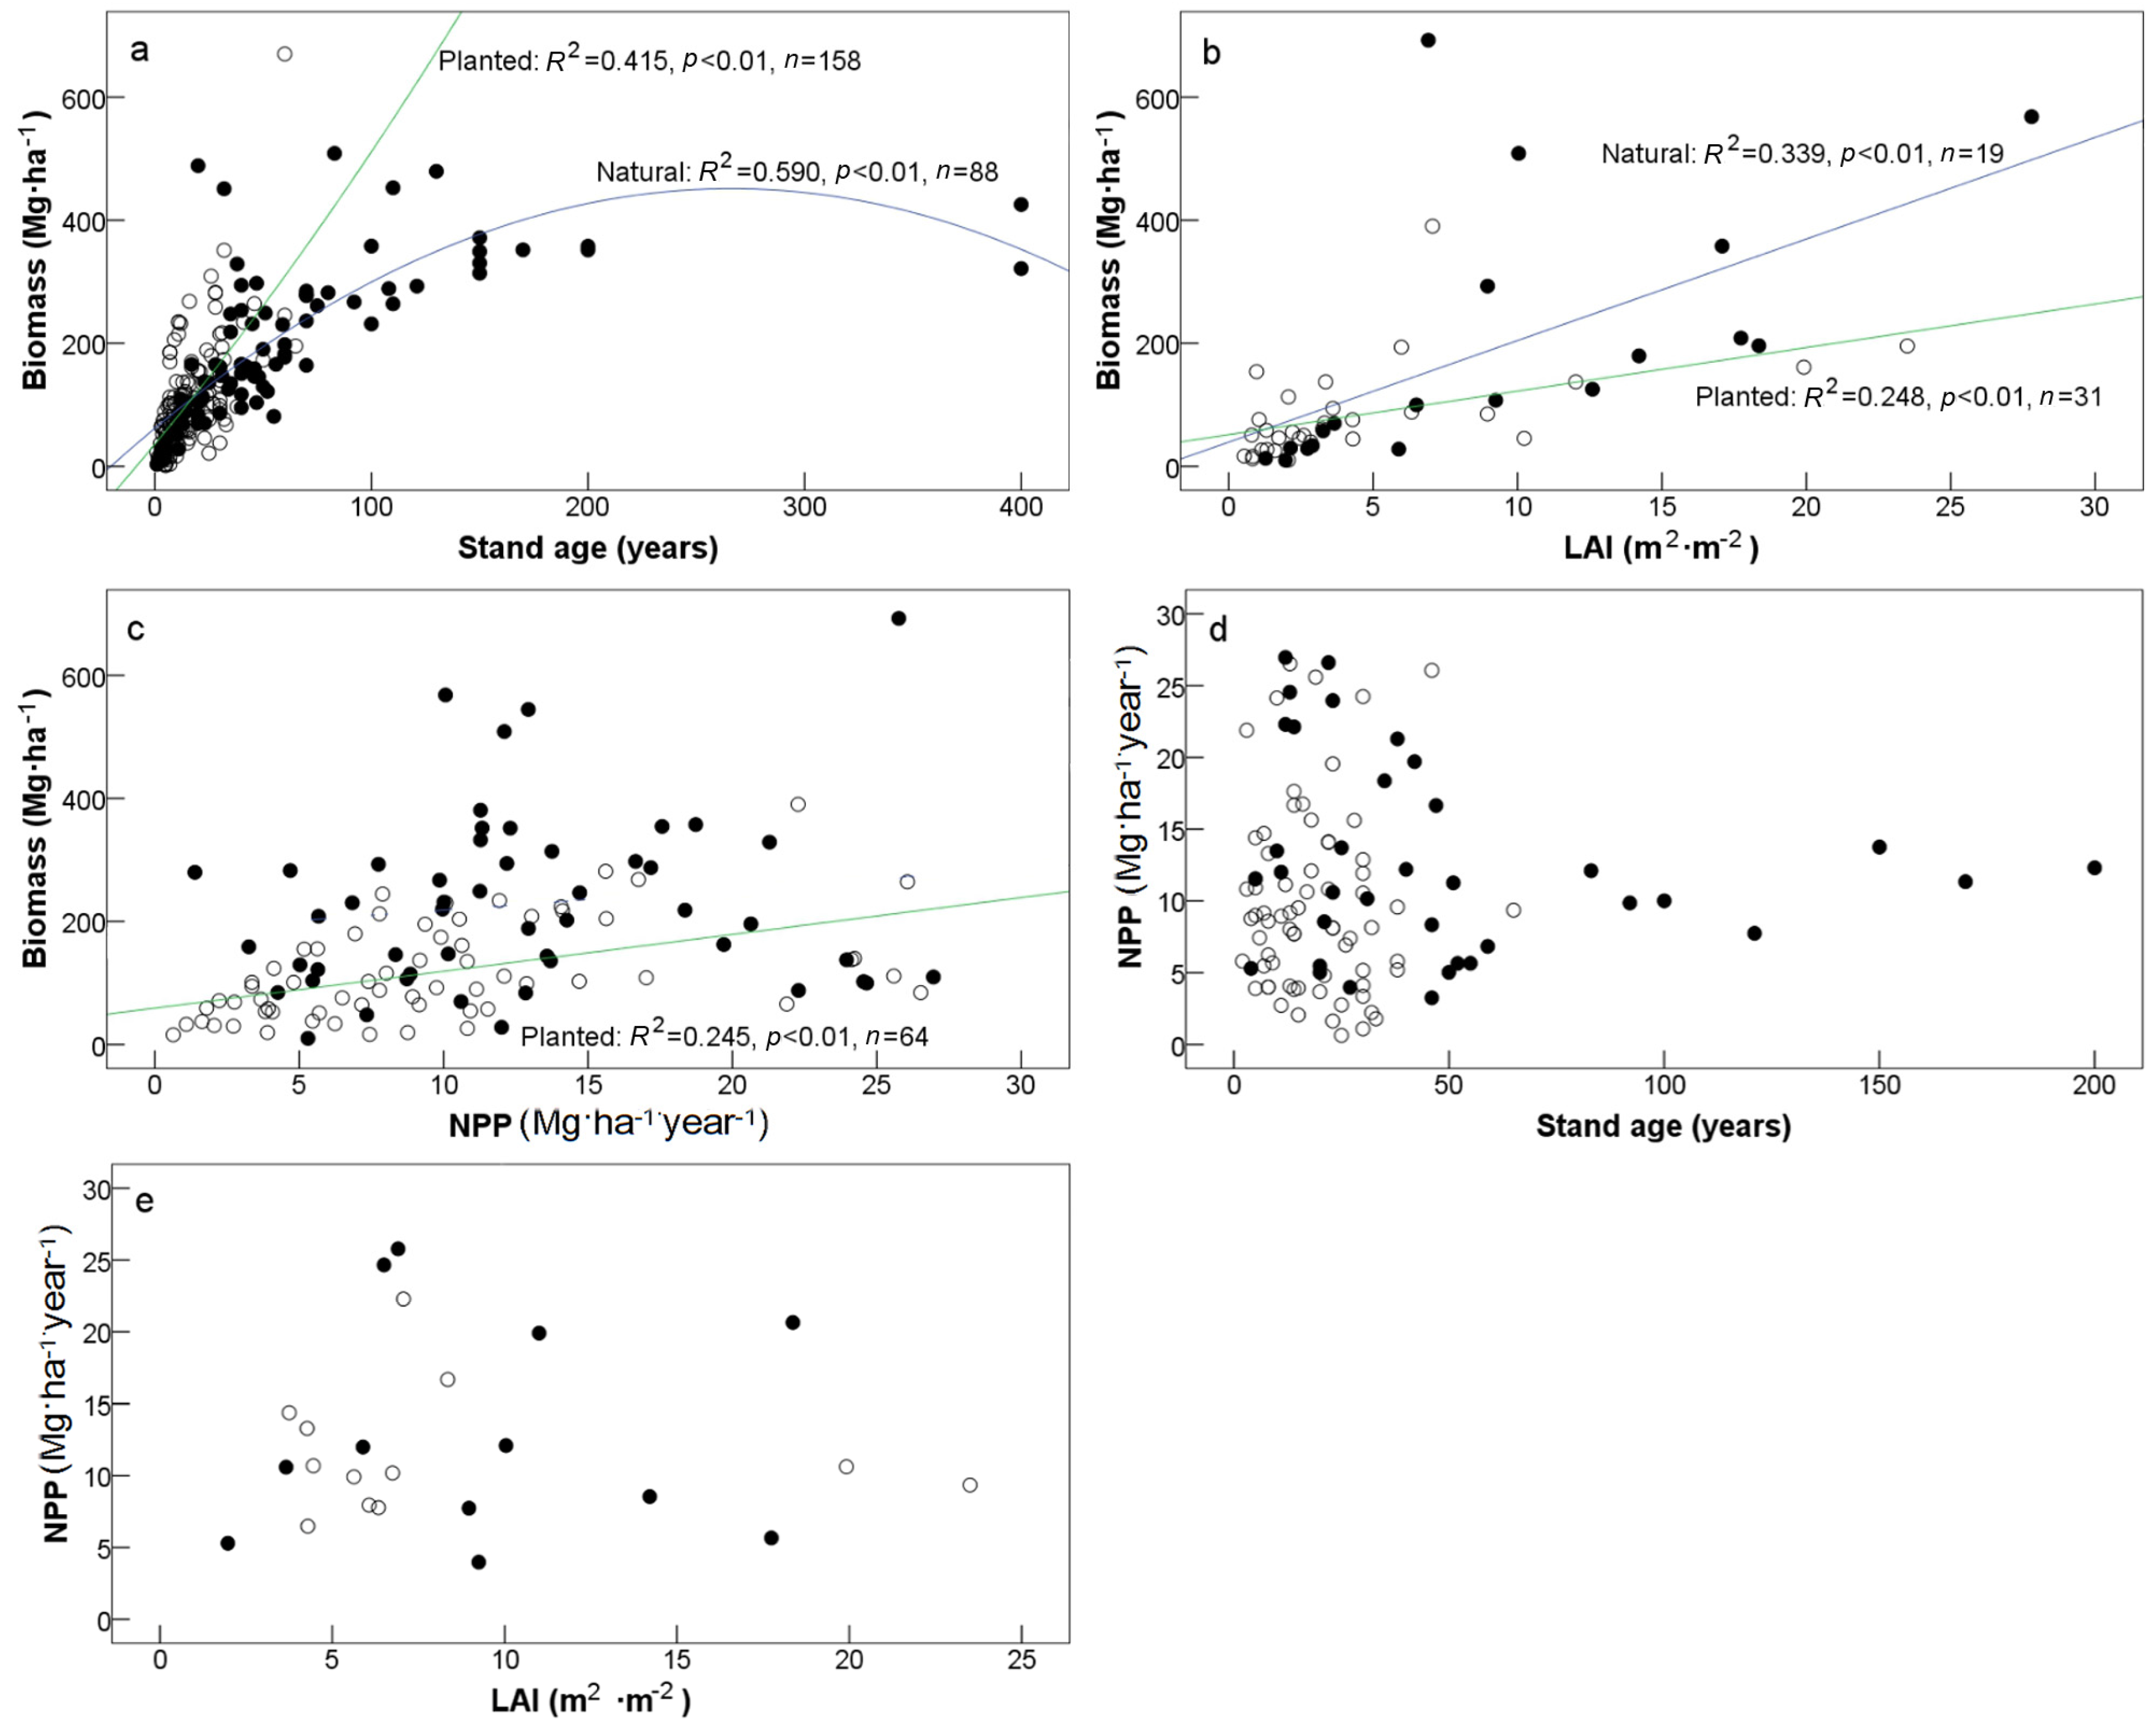
3.2. Environmental Factors Controlling Biomass and NPP

The forest biomass in Southwestern China shows no clear relationships with MAT, MAP, and GDD0 (p > 0.05). Conversely, forest NPP is clearly related to temperature and precipitation; in particular, forest NPP significantly (p < 0.05) increases with increasing MAT, MAP, GDD0, and DI (Figure 4 and Figure 6a–d).
Before forests mature excessively, forest biomass remains significantly (p < 0.01) related to stand age (Figure 7a) and LAI (Figure 7b). Only planted forest biomass clearly (p < 0.01) correlates with NPP (Figure 7c). This result can be ascribed to the fact that the slow biomass accumulation in natural forests are more dependent on stand age and other stand characteristics than NPP. Forest NPP show slight negative correlation (p > 0.05) with stand age (Figure 7d) but shows no clear relationship with LAI (Figure 7e).

4. Discussion

4.1. Productivity vs. Forest Stand Origin

Biomass and NPP distribution patterns based on the current database are constantly changing. Such a phenomenon is likely to occur in the southeast forestry area of the study area, where planted forests have been well developed over the past several decades. Natural forests degenerate and new planted forests replace original ones. The biomass distribution pattern (Figure 2a,c) presented in this study resulted from biomass specific data extracted from data on mature forests. Current young forests or shrubland vegetation at these biomass sampling sites can be potentially cultivated into high-biomass forests. Thus, the findings of the present study are highly relevant and significant for forest management and vegetation restoration.
Although planted forests have the advantage of fast growth, early efficiency gain, high yield capacity, and more stable timber size and quality, natural forests have higher biomass (Figure 3) and can sequester more CO2 from the atmosphere. Moreover, natural forests have higher species diversity, higher water use efficiency, and stronger resistance to natural disasters or human disturbance than planted forests [34,35,36,37,38]. Therefore, natural forests are irreplaceable and greatly contribute to carbon sequestration and climate change mitigation.
Feng et al. [18] estimated the biomass and NPP of Chinese forests by synthesizing data published since 1960 but excluded some common forest types (e.g., SCBF and SDBF) in Southwestern China. In most cases, natural and planted forests were not carefully separated. Ni et al. [3] also estimated the biomass and NPP of natural and planted forests in China on the basis of Luo’s [17] data between 1989 and 1993. For each of the forest types except for SEBFs, the forest biomass in Southwestern China was found to be much higher in the present study than in those by Feng et al. [18] and Ni et al. [3] (Table 2). This result can be attributed to the fact that the biomass data used in the present study were derived from mature forests. The NPP values in the present study and in the study by Feng et al. [18] are lower than those in the study by Ni et al. [3], with the exception of SSEBFs (Table 2). This result may be attributed to the fact that Ni et al. [3] used two biomass data sources, namely, forest inventory and field observations [17].

4.2. Productivity vs. Topography and Parent Materials

At the macro-scale potential natural vegetation is mainly controlled by climate, but at landscape to regional scales, climatic factors are not the only components that affect vegetation patterns; other environmental components, such as topography, fire, soils, and parent materials, as well as human disturbances, also play important roles in vegetation distribution and function [10,39]. In the present study, the average MAT and MAP of karst forests included in the NPP comparison are 16.2 °C and 1415.8 mm, respectively, which are both superior (MAT: p > 0.05; MAP: p < 0.01) to those (only 9.9 °C and 1088.9 mm, respectively) of non-karst forests. This may be the main reason why karst forests have almost the same NPP with non-karst forests in our study (Figure 5b). Similarly, in the biomass comparison, karst forests have better (MAT: p > 0.05; MAP: p > 0.05) climate conditions than non-karst forests, but the former still have significantly lower biomass than the latter (Figure 5a). Topography alters local water balance and parent materials affect soil formation and dominate local nutrient cycling [10]. These two factors more particularly influence vegetation formation (karst azonal SEDBF rather than non-karst zonal TRSF, SEBF, and SEDBF) and function (low biomass) in karst regions than in non-karst regions.
Forests in karst terrain in Southwestern China have a unique topography and soil conditions. They are extremely fragile to anthropogenic activities and intensive land use. For instance, rocky desertification has been seen wherever forests had been destroyed previously [25]. Thus, natural, and even secondary, karst forests are only distributed in small areas (only limited data from karst forests are included in our database). Fortunately, reforestation and afforestation have been done extensively in Southwestern China. Furthermore, a large area of forest plantations in Southwestern China contain young forests [40], and the biomass and stand age relationship (Figure 7a) supposes that these young forests have great potential as carbon sinks for mitigating increased atmospheric CO2 concentration under the Kyoto Protocol of the United Nations Framework Convention on Climate Change [14,40,41].

4.3. Productivity vs. Latitude and Climates

Our findings suggest that temperature and precipitation do not primarily control forest biomass but closely relate to the spatial distribution of forest NPP in Southwestern China. Several forests located in the same area may share the same climate but differ in biomass and NPP. Globally, a clear relationship has been observed between NPP and latitude and climate variables [39,42,43], but such relationships can be weakened if the database includes chronosequences and sites that span large altitudinal ranges [10]. Our database also covers wide time and altitudinal spans, which may be why the biomass of mature forests shows no clear relationship with climates, and the relationships between NPP and climates are more scattered than would be expected for clear linear relationships (Figure 6). Data gaps in geographical space may be another reason for the scattered relationships. Forest stand characteristics such as age and forest origin, topography, and soils seem to be key reasons why biomass has no clear relationships with climates [44]. For example, the Abies fabri forest in the mountainous area of Western China has MAT of −12.2 °C and GDD0 of 0 °C, but its biomass can reach up to 351.8 Mg·ha−1 (Table S1), which is higher than that of most forests with superior climates in southeastern areas. This suggests that biomass and NPP are related not only to climate factors but also to other environmental factors, such as forest type, stand age, and tree species composition.
On the other hand, the shape of global productivity-climate relationship can change depending on forest type [10]. At local to regional scales, this shape is more changeable when looking at vegetation type-based individual relationships (Figure 6), implying that regional and global databases must include as many vegetation types as possible. This is especially true for the global relationship between forest productivity and biomass [9]. When sites from tropical forest type were added, the global aboveground NPP–biomass relationship acquired a quadratic shape, which differs fundamentally from the strongly positive, linear relationship reported in earlier analyses. A summary of biomass and NPP together with key climate variables in Southwestern China shows clear differences in terms of forest types (Table 3).

4.4. Inspirations for the Development of Regional to Global Productivity Databases

Regional to continental and global ecosystem carbon counting require biomass and NPP databases at as many spatial scales and with as much detail as possible. Currently, information on vegetation biomass and NPP is available from a variety of sources, including in situ measurements, national forest inventories, administrative-level statistics, ecosystem model outputs, and remote sensing products. These data tend to be regional or national based on the methodologies and are not easily accessible [45]. There are only a few global forest biomass databases available for Earth science researchers. Forest inventory databases with large spatial coverage and continuous measurements, which have been successfully used in national and global forest carbon estimations [2,14,16], are a good example of this. Disadvantages of forest inventory, such as coarse vegetation survey and lack of understory and belowground biomass samplings, make plot-based biomass and NPP measurements necessary. Therefore, comprehensive regional data synthesis and analysis of direct field observations of forest biomass and NPP [9,10], together with data derived from remote sensing observatories and eddy covariance flux measurements [46,47], can provide more precise counting of regional and global carbon [10], and for benchmarking global and regional vegetation and carbon models [12,13]. Such data also serve as background data for the purposes of restoring vegetation and mitigating climate change. A database called the Biomass and Allometry Database (BAAD) for woody plants of the world has recently been established [48], and includes all details about size metrics, properties of individuals, and information of the growing environment. This kind of comprehensive database has the potential to improve our ability to understand plant growth, ecosystem dynamics, and carbon cycling worldwide.
Direct measurements of biomass have been attempted to obtain the main components of plant organisms as many as possible [10,49], but some components are often missing and have to be estimated based on standardization relationships or factors [9], especially root biomass, litter and its loss to decomposition, and biomass loss to herbivory. This makes productivity and carbon estimations incomplete and inaccurate. Current biomass and NPP databases for China [3,17,18,19] generally as well as those for Southeastern China [27], including this study, all face such problems. Measuring missing components of biomass and NPP in the field is therefore urgently needed. A five-year strategic priority research program called the “Climate Change: Carbon Budget and Relevant Issues” sponsored by the Chinese Academy of Sciences has recently been implemented [50]. Nationwide systematic field surveys have been conducted across more than 16,000 plots in forest, shrubland, grassland, and farmland ecosystems across China, emphasizing litter and root biomass in 1 m soils. This has the potential to generate a huge database that will aid in accurately evaluating carbon storage, sequestration rates, and potential capacity of all ecosystems at a national scale, and for developing and validating new ecosystem models.
Another major limitation of the existing regional and global productivity databases is that there is no quantitative estimate of observational uncertainties. The benchmarking approach, however, has shown that observational uncertainty is larger than differences in model performance with respect to site-based annual average NPP measurements, and these observational uncertainties are also greater than model biases in NPP [12]. The use of multiple databases may be one way of assessing uncertainty, but the only comprehensive solution to the problem is for measurement uncertainties to be routinely assessed for each site. Therefore, numerical judgment and assessment of site data is highly required, in addition to more detailed and complete in situ measurements. Long-term and multisite measurements are further necessary to demonstrate variability and uncertainty of productivity data from local to global scales. This is especially important for field measurements in karst regions. Extremely high heterogeneity of the karst rock-soil landscape results in large variation of morphological- and soil-based vegetation distribution, as well as great spatial variation in forest biomass pattern [51]. For example, in the Maolan National Natural Reserve of southern Guizhou province, different aboveground tree biomass was found in the karst funnel (147.74 Mg·ha−1), slope (164.07 Mg·ha−1) and mountain ridge (102.08 Mg·ha−1) [52]. This is also true in Puding county in central Guizhou province: three karst forest communities in this region have very different AGB for tree and shrub layers in the upper (85.6 Mg·ha−1) and middle slopes (65.3 Mg·ha−1 and 115.2 Mg·ha−1, respectively) [53].

5. Conclusions

We established a new regional database of forest biomass and NPP for Southwestern China. This database includes 411 sampling plots from seven forest types. Mature natural forest types have higher biomass than their mature planted counterparts. Karst forests have similar NPP as non-karst forests, but significantly lower biomass than the latter. Biomass is positively related to stand age and leaf area index. NPP is negatively related to latitude, and positively related to mean annual temperature, mean annual precipitation, growing degree-days on a 0 °C base, and mean annual drought index.

Supplementary Materials

The following are available online at www.mdpi.com/1999-4907/7/8/173/s1, Table S1: Species composition, stand age, biomass, net primary productivity (NPP), leaf area index (LAI), mean annual temperature (MAT), and mean annual precipitation (MAP) of the 411 sampling plots (including 14 SEDBFs, 117 SEBFs, 53 SDBFs, 13 SSEBFs, 154 SECFs, 28 SCBFs, and 32 TRSFs) in southwestern China. SEBF: subtropical evergreen broadleaved forest; SSEBF: subtropical sclerophyllous evergreen broadleaved forest; SEDBF: subtropical mixed evergreen-deciduous broadleaved forest; SECF: subtropical evergreen coniferous forest; SCBF: subtropical mixed coniferous broadleaved forest; SDBF: subtropical deciduous broadleaved forest; TRSF: tropical rain forests and seasonal forests; *: karst forest; #: confirmable mature forests; N: natural forest; P: planted forest.

Acknowledgments

This work was supported by the National Basic Research Program of China (2013CB956704), the Hundred Talents Program of the Chinese Academy of Sciences (2011031), the National Science Foundation of China (41471049), and the Science and Technique Foundation of Guizhou Province (GKH-J-2012-2332).

Author Contributions

Jian Ni and Libin Liu conceived and designed the research; Libin Liu and Huamei Yang collected the data; Libin Liu analyzed the data; Yue Xu and Yinming Guo contributed analysis tools; Libin Liu and Jian Ni wrote the paper.

Conflicts of Interest

The authors declare no conflict of interest.

References

  1. Dixon, R.K.; Brown, S.; Houghton, R.A.; Solomon, A.M.; Trexler, M.C.; Wisniewski, J. Carbon pools and flux of global forest ecosystems. Science 1994, 263, 185–190. [Google Scholar] [CrossRef] [PubMed]
  2. Alexeyev, V.; Birdsey, R.; Stakanov, V.; Korotkov, T. Carbon in vegetation of Russian forests: Methods to estimate storage and geographical distribution. Water Air Soil Pollut. 1995, 82, 271–282. [Google Scholar] [CrossRef]
  3. Ni, J.; Zhang, X.S.; Scurlock, J.M.O. Synthesis and analysis of biomass and net primary productivity in Chinese forests. Ann. For. Sci. 2001, 58, 351–384. [Google Scholar] [CrossRef]
  4. Ni, J. Net primary productivity in forests of China: Scaling-up of national inventory data and comparison with model predictions. For. Ecol. Manag. 2003, 176, 485–495. [Google Scholar] [CrossRef]
  5. Houghton, R.A. Aboveground forest biomass and the global carbon balance. Glob. Chang. Biol. 2005, 11, 945–958. [Google Scholar] [CrossRef]
  6. Powell, S.L.; Cohen, W.B.; Healey, S.P.; Kennedy, R.E.; Moisen, G.G.; Pierce, K.B.; Ohmann, J.L. Quantification of live aboveground forest biomass dynamics with Landsat time-series and field inventory data: A comparison of empirical modeling approaches. Remote Sens. Environ. 2010, 114, 1053–1068. [Google Scholar] [CrossRef]
  7. Cramer, W.; Moore, B., III; Sahagian, D. Data needs for modelling global biospheric carbon fluxes: Lessons from a comparison of models. IGBP Newsl. 1996, 27, 13–15. [Google Scholar]
  8. Scurlock, J.M.O.; Cramer, W.; Olson, R.J.; Parton, W.J.; Prince, S.D. Terrestrial NPP: Towards a consistent data set for global model evaluation. Ecol. Appl. 1999, 9, 913–919. [Google Scholar] [CrossRef]
  9. Keeling, H.C.; Phillips, O.L. The global relationship between forest productivity and biomass. Glob. Ecol Biogeogr. 2007, 16, 618–631. [Google Scholar] [CrossRef]
  10. Luyssaert, S.; Inglima, I.; Jung, M.; Richardson, A.D.; Reichstein, M.; Papale, D.; Piao, S.L.; Schulze, E.D.; Wingate, L.; Matteucci, G.; et al. CO2 balance of boreal, temperate, and tropical forests derived from a global database. Glob. Chang. Biol. 2007, 13, 2509–2537. [Google Scholar] [CrossRef]
  11. Luo, Y.Q.; Randerson, J.T.; Abramowita, G.; Bacour, C.; Blyth, E.; Carvalhais, N.; Ciais, P.; Dalmonech, D.; Fisher, J.B.; Fisher, R.; et al. A framework for benchmarking land models. Biogeosciences 2012, 9, 3857–3874. [Google Scholar] [CrossRef]
  12. Kelley, D.I.; Prentice, I.C.; Harrison, S.P.; Wang, H.; Simard, M.; Fisher, J.B.; Willis, K.O. A comprehensive benchmarking system for evaluating global vegetation models. Biogeosciences 2013, 10, 3313–3340. [Google Scholar] [CrossRef]
  13. Piao, S.L.; Sitch, S.; Ciais, P.; Friedlingstein, P.; Peylin, P.; Wang, X.H.; Ahlström, A.; Anav, A.; Canadell, J.G.; Cong, N.; et al. Evaluation of terrestrial carbon cycle models for their response to climate variability and to CO2 trends. Glob. Chang. Biol. 2013, 19, 2117–2132. [Google Scholar] [CrossRef] [PubMed]
  14. Fang, J.Y.; Chen, A.P.; Peng, C.H.; Zhao, S.Q.; Ci, L.J. Changes in forest biomass carbon storage in China between 1949 and 1998. Science 2001, 292, 2320–2322. [Google Scholar] [CrossRef] [PubMed]
  15. Piao, S.L.; Fang, J.Y.; Ciais, P.; Peylin, P.; Huang, Y.; Sitch, S.; Wang, T. The carbon balance of terrestrial ecosystems in China. Nature 2009, 458, 1009–1013. [Google Scholar] [CrossRef] [PubMed]
  16. Pan, Y.; Birdsey, R.A.; Fang, J.; Houghton, R.; Kauppi, P.E.; Kurz, W.A.; Phillips, O.L.; Shvidenko, A.; Lewis, S.L.; Canadell, J.G.; et al. A large and persistent carbon sink in the world’s forests. Science 2011, 333, 988–993. [Google Scholar] [CrossRef] [PubMed]
  17. Luo, T.X. Patterns of Net Primary Productivity for Chinese Major Forest Types and Their Mathematical Models; The Commission for Integrated Survey of Natural Resources, Chinese Academy of Sciences: Beijing, China, 1996. (In Chinese) [Google Scholar]
  18. Feng, Z.W.; Wang, X.K.; Wu, G. Biomass and Primary Productivity of Forest Ecosystems in China; Science Press: Beijing, China, 1999. (In Chinese) [Google Scholar]
  19. Li, G.F.; Ren, H. Biomass and net primary productivity of the forests in different climatic zones of China. Trop. Geogr. 2004, 24, 306–310. (In Chinese) [Google Scholar] [CrossRef]
  20. Luo, Y.J.; Wang, X.K.; Zhang, X.Q.; Lu, F. Biomass and Its Allocation of Forest Ecosystems in China; China Forestry Publishing House: Beijing, China, 2013. (In Chinese) [Google Scholar]
  21. Xiang, W.H.; Liu, S.H.; Deng, X.W.; Shen, A.H.; Lei, X.D.; Tian, D.L.; Zhao, M.F.; Peng, C.H. General allometric equations and biomass allocation of Pinus massoniana trees on a regional scale in southern China. Ecol. Res. 2011, 26, 697–711. (In Chinese) [Google Scholar] [CrossRef]
  22. Liu, W.W. Application of Allometric Equations and Biomass Expansion Factor for Estimating Cunninghamia lanceolata Forest Biomass on Large Scale. Master’s Thesis, Central South University of Forestry & Technology, Changsha, China, 2009. [Google Scholar]
  23. Editorial Committee for Vegetation of China (ECVC). Vegetation of China; Science Press: Beijing, China, 1980. (In Chinese) [Google Scholar]
  24. Editorial Committee of Vegetation Map of the People’s Republic of China (ECVMC); Chinese Academy of Sciences. Vegetation Map of the People’s Republic of China (1:1 000 000); Geology Press: Xi’an, China, 2007. (In Chinese) [Google Scholar]
  25. Jiang, Z.C.; Lian, Y.Q.; Qin, X.Q. Rocky desertification in Southwest China: Impacts, causes, and restoration. Earth-Sci. Rev. 2014, 132, 1–12. [Google Scholar] [CrossRef]
  26. Yu, W.L.; Dong, D.; Ni, J. Comparisons of biomass and net primary productivity of karst and non-karst forests in mountainous areas, Southwestern China. J. Subtrop. Resour. Environ. 2010, 5, 25–30. (In Chinese) [Google Scholar]
  27. Wu, P.; Ding, F.J.; Chen, J. Study on the biomass and productivity of forest in Southwest China. Hubei Agric. Sci. 2012, 51, 1513–1518, 1527. (In Chinese) [Google Scholar]
  28. Hutchinson, M.; Hancock, P.A. Spatial interpolation of large climate data sets using bivariate thin plate smoothing splines. Environ. Model. Softw. 2006, 21, 1684–1694. [Google Scholar]
  29. Farr, T.G.; Rosen, P.A.; Caro, E.; Crippen, R.; Duren, R.; Hensley, S.; Kobrick, M.; Paller, M.; Rodriguez, E.; Roth, L.; et al. The shuttle radar topography mission. Rev. Geophys. 2007, 45. [Google Scholar] [CrossRef]
  30. Prentice, I.C.; Sykes, M.T.; Cramer, W. A simulation model for the transient effects of climate change on forest landscapes. Ecol. Model. 1993, 65, 51–70. [Google Scholar] [CrossRef]
  31. Gallego-Sala, A.V.; Clark, J.M.; House, J.I.; Orr, H.G.; Prentice, I.C.; Smith, P.; Farewell, T.; Chapman, S.J. Bioclimatic envelope model of climate change impacts on blanket peatland distribution in Great Britain. Clim. Res. 2011, 45, 151–162. [Google Scholar] [CrossRef] [Green Version]
  32. Coomes, D.A.; Flores, O.; Holdaway, R.; Jucker, T.; Lines, E.R.; Vanderwel, M.C. Wood production response to climate change will depend critically on forest composition and structure. Glob. Chang. Biol. 2014, 20, 3632–3645. [Google Scholar] [CrossRef] [PubMed]
  33. Chu, C.; Bartlett, M.; Wang, Y.; He, F.; Weiner, J.; Chave, J.; Sack, L. Does climate directly influence NPP globally? Glob. Chang. Biol. 2016, 22, 12–24. [Google Scholar] [CrossRef] [PubMed]
  34. Xu, H.C. A comparative evaluation of the man-made forest and natural forest. World For. Res. 1991, 3, 50–56. (In Chinese) [Google Scholar]
  35. Xing, S.H.; Ji, W.Y.; Guo, N.; Cui, G.F.; Wang, M.; Xue, Q.; Jiang, X.M. Comparison of community character between the natural spruce forest and the plantation in Miyaluo in west Sichuan. J. Mt. Sci. 2010, 28, 218–225. (In Chinese) [Google Scholar]
  36. Ghimire, C.P.; Bruijnzeel, L.A.; Lubczynski, M.W.; Bonell, M. Rainfall interception by natural and planted forests in the middle mountains of central Nepal. J. Hydrol. 2012, 475, 270–280. [Google Scholar] [CrossRef]
  37. Sánchez-Salguero, R.; Camarero, J.J.; Dobbertin, M.; Fernández-Cancio, Á.; Vilà-Cabrera, A.; Manzanedo, R.D.; Zavala, M.A.; Navarro-Cerrillo, R.M. Contrasting vulnerability and resilience to drought-induced decline of densely planted vs. natural rear-edge Pinus nigra forests. For. Ecol. Manag. 2013, 310, 956–967. [Google Scholar] [CrossRef]
  38. Woziwoda, B.; Kopeć, D. Afforestation or natural succession? Looking for the best way to manage abandoned cut-over peatlands for biodiversity conservation. Ecol. Eng. 2014, 63, 143–152. [Google Scholar] [CrossRef]
  39. Scurlock, J.M.O.; Olson, R.J. Terrestrial net primary productivity—A brief history and a new worldwide database. Environ. Rev. 2002, 10, 91–109. [Google Scholar] [CrossRef]
  40. Zhao, M.; Zhou, G.S. Estimation of biomass and net primary productivity of major planted forests in China based on forest inventory data. For. Ecol. Manag. 2005, 207, 295–313. [Google Scholar] [CrossRef]
  41. Schulze, E.D.; Wirth, C.; Heimann, M. Managing forests after Kyoto. Science 2000, 289, 204–205. [Google Scholar] [CrossRef]
  42. Gillman, L.N.; Wright, S.D.; Cusens, J.; McBride, P.D.; Malhi, Y.; Whittaker, R.J. Latitude, productivity and species richness. Glob. Ecol. Biogeogr. 2015, 24, 107–117. [Google Scholar] [CrossRef]
  43. Lieth, H.F.H.; Whittaker, R.H. Primary Productivity of the Biosphere; Springer-Verlag: New York, NY, USA, 1975. [Google Scholar]
  44. Pan, Y.; Birdsey, R.A.; Phillips, O.L.; Jackson, R.B. The structure, distribution, and biomass of the World’s forests. Annu. Rev. Ecol. Evol. Syst. 2013, 44, 593–622. [Google Scholar] [CrossRef]
  45. Kindermann, G.E.; McCallum, I.; Fritz, S.; Obersteiner, M. A global forest growing stock, biomass and carbon map based on FAO statistics. Silva Fenn. 2008, 42, 387–396. [Google Scholar] [CrossRef]
  46. Beer, C.; Reichstein, M.; Tomelleri, E.; Ciais, P.; Jung, M.; Carvalhais, N.; Rödenbeck, C.; Arain, M.A.; Baldocchi, D.; Bonan, G.B.; et al. Terrestrial gross carbon dioxide uptake: Global distribution and covariation with climate. Science 2010, 329, 834–838. [Google Scholar] [CrossRef] [PubMed]
  47. Jung, M.; Reichstein, M.; Margolis, H.A.; Cescatti, A.; Richardson, A.D.; Arain, M.A.; Arneth, A.; Bernhofer, C.; Bonal, D.; Chen, J.Q.; et al. Global patterns of land-atmosphere fluxes of carbon dioxide, latent heat, and sensible heat derived from eddy covariance, satellite, and meteorological observations. J. Geophys. Res.-Biogeosci. 2011, 116, G00J07. [Google Scholar] [CrossRef]
  48. Falster, D.S.; Duursma, R.A.; Ishihara, M.I.; Barneche, D.R.; FitzJohn, R.G.; Vårhammar, A.; Aiba, M.; Ando, M.; Anten, N.; Aspinwall, M.J.; et al. BAAD: A biomass and allometry database for woody plants. Ecology 2015, 96, 1445. [Google Scholar] [CrossRef]
  49. Clark, D.A.; Brown, S.; Kicklighter, D.W.; Chambers, J.Q.; Thomlinson, J.R.; Ni, J. Measuring net primary production in forests: Concepts and field methods. Ecol. Appl. 2001, 11, 356–370. [Google Scholar] [CrossRef]
  50. Fang, J.Y.; Yu, G.R.; Ren, X.B.; Liu, G.H.; Zhao, X.Q. Carbon sequestration in China’s terrestrial ecosystems under climate change: Progress on ecosystem carbon sequestration from the CAS Strategic Priority Research Program. Bull. Chin. Acad. Sci. 2015, 30, 848–857. [Google Scholar]
  51. Ni, J.; Luo, D.H.; Xia, J.; Zhang, Z.H.; Hu, G. Vegetation in karst terrain of southwestern China allocates more biomass to roots. Solid Earth 2015, 6, 799–810. [Google Scholar] [CrossRef]
  52. Zhu, S.Q.; Wei, L.M.; Chen, Z.R.; Zhang, C.G. A preliminary study on biomass components of karst forest in Maolan of Guizhou province, China. Acta Phytoecol. Sin. 1995, 19, 358–367. (In Chinese) [Google Scholar]
  53. Liu, C.C.; Wei, Y.F.; Liu, Y.G.; Guo, K. Biomass of canopy and shrub layers of karst forest in Puding, Guizhou, China. Chin. J. Plant Ecol. 2009, 33, 698–705. (In Chinese) [Google Scholar]
Figure 1. Locations of biomass and NPP sampling plots in the distribution map of karst terrain (the grey) in Southwestern China.
Forests 07 00173 g001
Figure 2. Distribution patterns of mature forest biomass and all forest NPP classes in relation to latitude, longitude (a,b), and elevation (c,d). Dots: biomass/NPP of natural forests; cycles: biomass/NPP of planted forests.
Forests 07 00173 g002
Figure 3. Average forest biomass in mature natural and mature planted forests. Biomass with different letters among forest types and between natural and planted forests are significantly different (one-way ANOVA and t-test, p < 0.05).
Forests 07 00173 g003
Figure 4. Biplots of biomass/NPP and environmental variables from redundancy analyses. (a) Natural forests; and (b) planted forests; MAT: mean annual temperature; MAP: mean annual precipitation; GDD0: growing degree-days on a 0 °C base; and DI: mean annual drought index.
Forests 07 00173 g004
Figure 5. Comparisons of biomass of mature forests (a) and NPP of all forests (b) in karst and non-karst regions. Method 1: biomass and NPP discrepancies between karst and non-karst subtropical mixed evergreen-deciduous broadleaved forests; method 2: biomass and NPP discrepancies between karst and non-karst forests within a latitude interval of 25° to 27°. Biomass and NPP values with different letters between karst and non-karst forests are significantly different (t-test, p > 0.05 or p < 0.01).
Forests 07 00173 g005
Figure 6. Relationships between NPP and climate factors. Solid symbols: NPP of natural forests; hollow symbols: NPP of planted forests. (a) MAT; (b) MAP; (c) GDD0; and (d) DI.
Forests 07 00173 g006
Figure 7. Relationships among biomass, NPP, and stand characteristics. Dots: biomass/NPP of natural forests; cycles: biomass/NPP of planted forests. (a) Biomass and stand age; (b) biomass and LAI; (c) biomass and NPP; (d) NPP and stand age; (e) NPP and LAI.
Forests 07 00173 g007
Table 1. Major forest types in Southwestern China.
Forest TypeAbbreviationGeographical RangeElevation (m)Dominant Taxa
subtropical evergreen broadleaved forestSEBF99–118° E, 23–32° N5–2800Castanopsis, Cyclobalanopsis, Lithocarpus, Machilus, Schima, Theaceae
subtropical sclerophyllous evergreen broadleaved forestSSEBF97–103° E, 25–32° N2000–4300Quercus
subtropical mixed evergreen-deciduous broadleaved forestSEDBF, including northern zonal SEDBF and karst azonal SEDBF97–118° E, 25–34° N500–2000Carpinus, Castanopsis, Cyclobalanopsis, Cinnamomum, Itea, Lithocarpus, Platycarya
subtropical evergreen coniferous forestSECF97–118° E, 24–34 °N20–4000Abies, Cunninghamia, Cryptomeria, Cupressus, Picea, Pinus, Taiwania, Tsuga
subtropical mixed coniferous broadleaved forestSCBF97–118° E, 23–34° N5–3050Abies, Acacia confusa, Alnus cremastogyne, Cupressus, Liquidambar formosana, Michelia macclurei, Picea, Pinus, Populus, Sassafras tzumu, Schima superba, Tsuga
subtropical deciduous broadleaved forestSDBF97–118° E, 24–34° N50–2650Alnus, Betula, Liquidambar formosana, Populus, Quercus, Robinia pseudoacacia
tropical rain forest and seasonal forestTRSF97–115° E, 20–23° N150–1500Baccaurea ramiflora, Dipterocarpus tonkinensis, Macaranga denticulata, Mallotus paniculatus, Parashorea chinensis, Pometia, Terminalia myriocarpa, Vatica astrotricha
Table 2. Summary of forest biomass and NPP in Southwestern China. The present study and those of reference [18] obtained data from field observations; reference [3] obtained data from both forest inventory and field observations. N: natural forests; P: planted forests. All abbreviations of forest types can be found in Table 1.
Forest TypeSEBFSSEBFSEDBFSECFSCBFTRSF
Biomass (Mg·ha−1)Reference [18]N292.3 ± 129.1/164.1 ± 45.2158.8 ± 99.2//
P103.4 ± 86.6////
Reference [3] 248.6 ± 111.7247.9 ± 53.7200.3 ± 90.4147.6 ± 24.6173.3 ± 82.4440.0 ± 290.9
This studyN361.6 ± 102.9268.4 ± 68.0188.8 ± 33.8200.0 ± 86.8289.4 ± 135.1427.2 ± 141.6
P188.8 ± 86.1/137.1 ± 0.3198.3 ± 110.2185.4 ± 41.1390.4
NPP (Mg·ha−1·year−1)Reference [18]N20.3 ± 4.7/4.6 ± 2.212.7 ± 7.6//
P25.8 ± 0.3////
Reference [3] 21.9 ± 5.311.4 ± 1.615.2 ± 3.013.5 ± 3.09.9 ± 2.727.1 ± 9.2
This studyN17.6 ± 7.219.4 ± 2.611.9 ± 2.412.1 ± 6.59.0 ± 5.020.9 ± 6.7
P14.5 ± 6.9/9.28.3 ± 5.15.622.3
N: natural forests; P: planted forests. All abbreviations of forest types can be found in Table 1.
Table 3. Summary of biomass and NPP together with key climate variables in Southwestern China.
Forest TypeBiomass Mg·ha−1NPP Mg·ha−1·year−1MAP mmMAT °CGDD0 °CDI
SEBFN361.6 ± 102.917.6 ± 7.21525.3 ± 288.917.3 ± 4.06331.0 ± 1451.80.069 ± 0.073
P188.8 ± 86.114.5 ± 6.91432.0 ± 185.019.6 ± 2.67148.5 ± 942.30.017 ± 0.009
SSEBFN268.4 ± 68.019.4 ± 2.6808.7 ± 94.58.9 ± 2.83325.4 ± 883.40.193 ± 0.045
P//////
SEDBFN188.8 ± 33.811.9 ± 2.41355.7 ± 170.111.7 ± 10.64972.7 ± 2217.10.016 ± 0.003
P137.1 ± 0.39.21502.4 ± 0.019.8 ± 0.07244.9 ± 0.00.162 ± 0.000
SECFN200.0 ± 86.812.1 ± 6.51058.0 ± 375.38.8 ± 9.13685.9 ± 2646.70.085 ± 0.078
P198.3 ± 110.28.3 ± 5.11291.4 ± 233.616.7 ± 4.16122.3 ± 1443.90.027 ± 0.044
SCBFN289.4 ± 135.19.0 ± 5.01515.4 ± 195.20.6 ± 16.22899.7 ± 3673.80.020 ± 0.005
P185.4 ± 41.15.61677.4 ± 184.820.3 ± 1.97414.8 ± 696.00.015 ± 0.000
SDBFN294.5 ± 82.39.7 ± 4.71273.4 ± 256.612.8 ± 5.74795.8 ± 1852.80.017 ± 0.003
P124.9 ± 44.09.5 ± 6.61343.1 ± 209.316.8 ± 3.06145.5 ± 1090.50.042 ± 0.055
TRSFN427.2 ± 141.620.9 ± 6.71392.2 ± 63.321.6 ± 0.77903.1 ± 260.80.166 ± 0.011
P390.422.31419.921.87941.80.157
MAP: mean annual precipitation; MAT: mean annual temperature; GDD0: growing degree-days on a 0 °C base; DI: mean annual drought index; N: natural forests; P: planted forests. All abbreviations of forest types can be found in Table 1.

