Article

Quantifying Tree and Soil Carbon Stocks in a Temperate Urban Forest in Northeast China

1
Northeast Institute of Geography and Agricultural Ecology, Chinese Academy of Sciences, Changchun 130102, China
2
University of Chinese Academy of Sciences, No. 19A Yuquan Road, Beijing 100049, China
3
Key Laboratory of Forest Plant Ecology, Northeast Forestry University, Harbin 150040, China
*
Author to whom correspondence should be addressed.
Forests 2016, 7(9), 200; https://doi.org/10.3390/f7090200
Submission received: 30 June 2016 / Revised: 2 September 2016 / Accepted: 6 September 2016 / Published: 10 September 2016
(This article belongs to the Special Issue Urban and Periurban Forest Diversity and Ecosystem Services)

Abstract

:
Society has placed greater focus on the ecological service of urban forests; however, more information is required on the variation of carbon (C) in trees and soils in different functional forest types, administrative districts, and urban-rural gradients. To address this issue, we measured various tree and soil parameters by sampling 219 plots in the urban forest of the Harbin city region. Averaged tree and soil C stock density (C stocks per unit tree cover) for Harbin city were 7.71 (±7.69) kg C·m−2 and 5.48 (±2.86) kg C·m−2, respectively. They were higher than those of other Chinese cities (Shenyang and Changchun), but were much lower than local natural forests. The tree C stock densities varied 2.3- to 3.2-fold among forest types, administrative districts, and ring road-based urban-rural gradients. In comparison, soil organic C (SOC) densities varied by much less (1.4–1.5-fold). We found these to be urbanization-dependent processes, which were closely related to the urban-rural gradient data based on ring-roads and settlement history patterns. We estimated that SOC accumulation during the 100-year urbanization of Harbin was very large (5 to 14 thousand tons), accounting for over one quarter of the stored C in trees. Our results provide new insights into the dynamics of above- and below-ground C (especially in soil) during the urbanization process, and that a city’s ability to provide C-related ecosystem services increases as it ages. Our findings highlight that urbanization effects should be incorporated into calculations of soil C budgets in regions subject to rapid urban expansion, such as China.

1. Introduction

Urban forests are one of the most important types of green infrastructures in cities [1]; they provide many important ecosystem services. Carbon stocks of urban forests influence local climate, carbon cycles, energy use, and climate change [2]. Consequently, the C stock capacity of urban forests is of great importance and is receiving increasing focus [2,3]. Researchers worldwide have studied and evaluated carbon stocks and sequestration by urban trees [2,3,4,5,6,7,8]. Cities in China like Beijing [4,5], Xiamen [6], Hangzhou [7] and cities worldwide in the US [2,8] and Europe [9] have available information regarding carbon stocks and sequestration in urban forests. These studies mostly quantified the current amount of carbon stored in the urban forest and its ecological services while focusing less on the C variations and long-term dynamics [6,9]. Ren et al. [6] indicated that urban sprawl negatively affected the surrounding forests, and human disturbance played the dominant role in influencing the carbon stocks and density of forest patches close to human activities [6]. Trees and forests in cities have long been influenced by humans. Thus, a better understanding of the long-term dynamics of urban vegetation is essential in determining its ecosystem services and improving its management [9].
C stock density is the C stocks in trees and/or soils per unit area. The distribution of C stock density is spatially uneven in urban forests, and is affected by human activities, such as road construction and real estate development [10]. A 110-year study has shown that changes in tree stocks were not constant across the urban area but varied with the current intensity of urbanization [9]. Urbanization gradients (e.g., history of settlements, which could to some extent substitute long-term dynamics and land use patterns) may possibly impact the spatial variation of C stored in tree biomass [11,12] and soils [13,14]. By dividing urban forests according to different administrative districts, functional forest types, ring roads (periphery transportation routes to ease traffic flows), and history of settlements (based on the time at which urban areas were settled), it may be possible to statistically detect these variations in C [14].
Compared with tree biomass C dynamics, fewer studies have focused on the C dynamics of soils in urban forests [15,16,17], even though soil C stocks are three times greater than the vegetation biomass C stocks [16]. Soil characteristics are influenced not only by plant-soil interaction and afforestation [18], but human activities, such as real estate development and road construction activities. These activities may have stronger influences on surface soils than tree biomass [19]. Studies have shown that the age of parks, in general, may be highly influential on soil variables, such as C sequestration [20]. Further, a study of 67 yards with home age ranging from 3 years to 87 years found that the relationship between soil C and home age was positive at 0–15 cm (p = 0.0003, R2 = 0.19) [21]. We therefore hypothesized that at a large scale, the urbanization level or age of a city may have a decisive influence on soil C in urban forests. Knowledge of how urbanization levels (ring roads and history of settlements), urban forest types, and administrative districts affect variation of C in soils is important to better estimate and maximize the carbon sequestration function of urban forests [15,17,22]. The urbanization level of a city can be characterized by urban-rural gradient belts [23], ring-road regions (urban sprawl with ring-road development) [14] and differences in the years since urban settlement [24]. Accordingly, these approaches are used in this study. To date, few studies have quantified urbanization influences on soil C [25,26,27]. Relations between variations of C and urbanization levels must be clearly clarified [25].
Harbin is the most populated city in northeastern China. It is an ideal area for identifying variations of C in urban forests. There are sufficient data available to evaluate how urbanization gradients affect tree and soil C dynamics. Long-term records on urbanization process are available dating back to the 1900s. Few studies have investigated the C stocks or variations in tree biomass and soils of urban forests in Harbin [28,29,30]. Furthermore, these studies did not consider the heterogeneous distribution of C or its relations with urban-rural gradients.
Our study aimed to determine: (1) the C stock density of urban forest trees and soils in comparison with other nearby cities and natural forests; (2) spatial variations in trees: C stock density, DBH, and basal area (3) spatial variations in SOC density, SOC content and soil bulk density; and (4) the implications of scientific estimates of urban forest C stocks and how results could be maximized along urban–rural gradients.

2. Materials and Methods
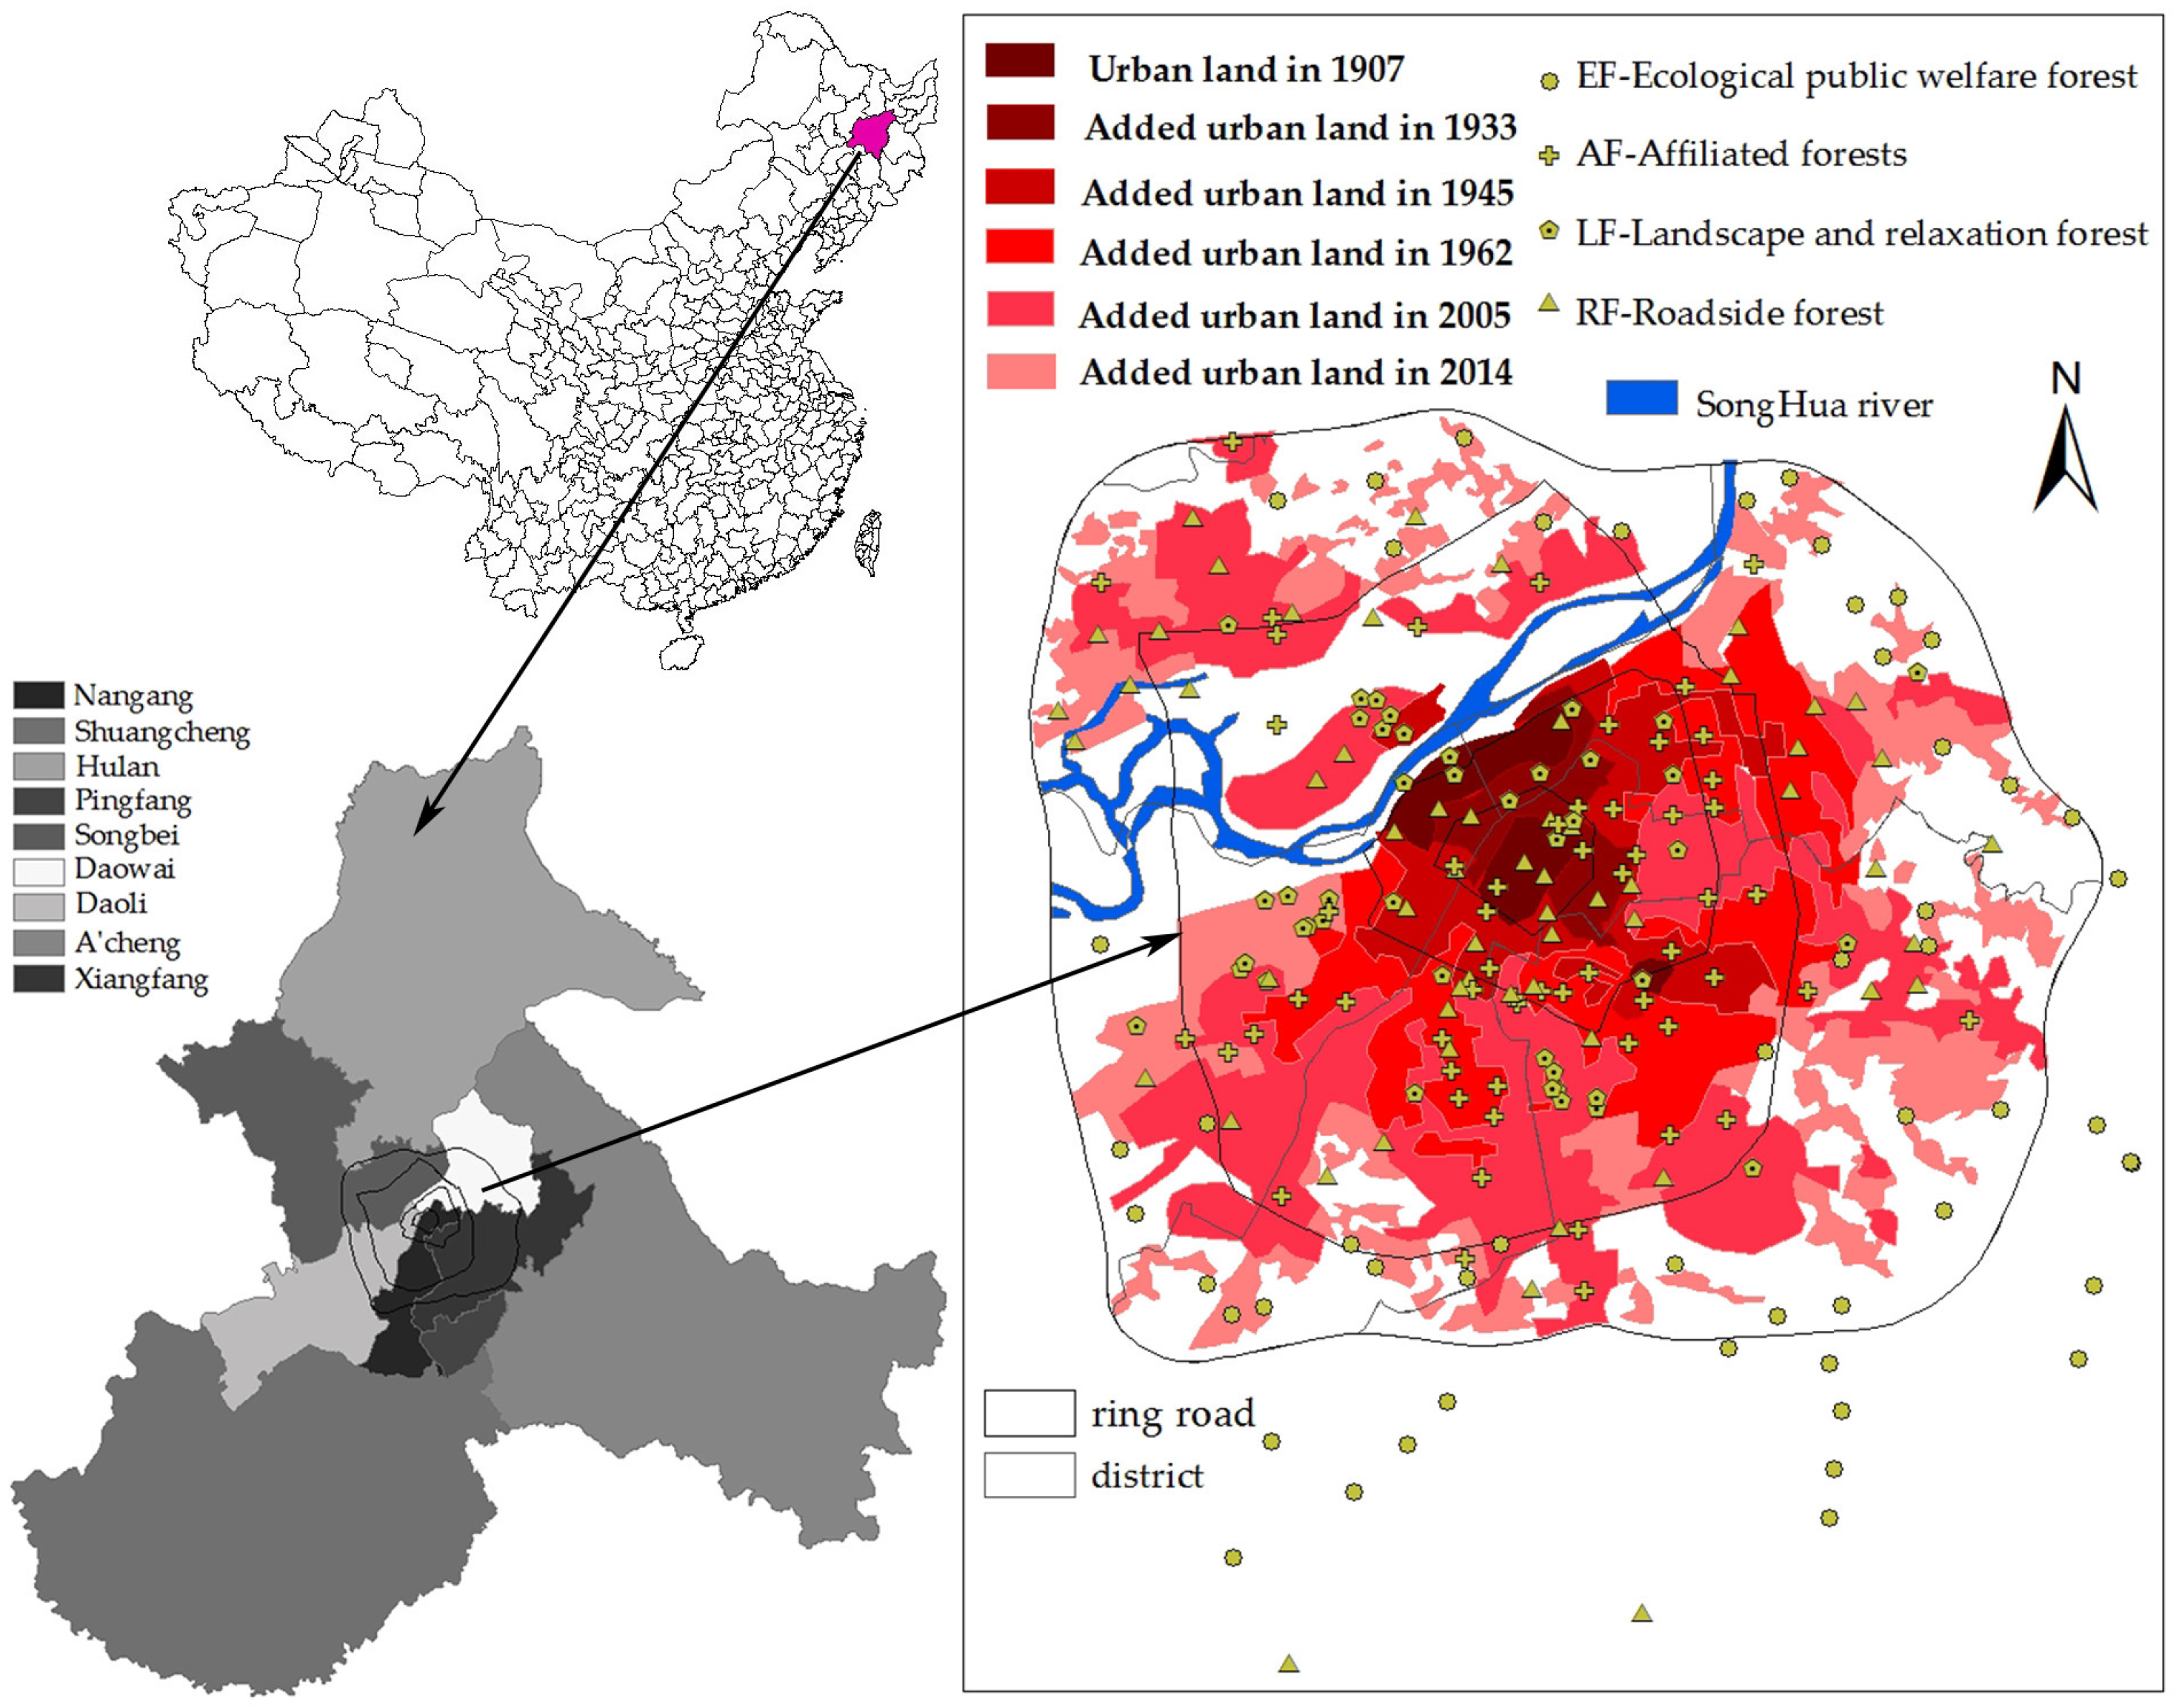
2.1. Study Area

The study area is located in the urban area of Harbin City (45°45′ N; 126°38′ E). Harbin is the capital of Heilongjiang Province in north-eastern China, and is an important city in this region. The average elevation of Harbin city is 151 m above sea level. The municipal district covers an area of 10,198 km2. The built-up area within the fourth ring road covers an area of 345.31 km2. The urban area contains 3.95 million people. The mean temperature in January is only −18.4 °C (−1.1 °F), and mean temperature in July is 23.0 °C (73.4 °F) based on climate data from 1971 to 2000. Annual precipitation is 524 millimeters (20.6 in). The frost-free period lasts 140 days, while the ice period lasts 190 days [31]. The most prevalent soils across Harbin are black soil (Luvic Phaeozem, FAO). There are also chernozem (Haplic Chernozem, FAO), and meadow soils (Eutric Vertisol, FAO) [32,33].
Harbin was founded in 1898, with the arrival of the Chinese Eastern Railway. Consequently, the city has a long history and clear regional boundaries [34]. The initial urban area of Harbin City was constructed near to the Middle East railway in 1896. After a commercial port was opened in 1907, Harbin gradually became a single city with multiple towns, and urban areas gradually expanded. In 1932, Harbin fell under the control of Japanese invaders. During this period, the Japanese built military constructions in Harbin, until liberation in 1945. After the founding of China in 1949, Harbin progressively proceeded with urban planning. After the 1980s reform and opening-up policy, Harbin entered a period of rapid development with a much faster rate of urbanization. Urban area settlement time is used to represent the level of urbanization. In China and around the underdeveloped regions in the world, cities like Harbin tend to expand radially from the old city territory [35].

2.2. Field Survey

The urban forest in Harbin has been previously classified into 4 types of forest: (1) roadside forest (RF), which is distributed on either side of the road or railway; (2) ecological public welfare forest (EF), which mainly refers to shelterbelt forests for farmland and nursery forests that provide greening infrastructure development; (3) landscape and relaxation forest (LF), which is primarily forest parks and public parks; and (4) affiliated forest (AF), which refers to forests that are affiliated with different universities, public institutes and large community districts [36]. A stratified random sampling method was adopted to locate sampling plots in different regions of the city. These plots were selected based on their forest coverage and size of surveyed regions (administrative districts, ring-road region, and urban settlement time). The sampling plots are presented in Figure 1.
Field surveys were conducted from August to September 2014. For each plot, the longitude, latitude, and altitude at the center of each location were recorded. The diameter at breast height (1.3 m, DBH) and basal area (1.3 m, at breast height) of trees with a diameter greater than 1 cm were recorded. The species name, genus name, and family name of each tree were also recorded. Tree height was measured using a Nikon forestry PRO550 (Jackson, MS, USA). Soil samples were collected at the same time using a 100 cm3 cutting ring (4 cutting rings per plot, M&Y Instrument Technology Co. Ltd., Shanghai, China). The shapes of the plots used in this study were dependent on forest type. RF and EF were surveyed as rectangular plots, with the width being fixed (8 to 20 m), while the length was adjusted to obtain survey areas of at least 400 m2. LF was usually quite large in area; thus, plots were fixed at 20 m × 20 m. AF often had an irregular shape, and the plots were fixed as rectangular or square shapes to obtain an area of about 400 m2. This type of survey method guaranteed a similar survey area for the forest types. Further, each plot was under tree coverage.
A total of 219 plots were surveyed, which includes 58 plots for AF, 42 plots for LF, 62 plots for RF, and 56 plots for EF. The study area includes 5 administrative districts, and out of the 219 surveyed plots, Songbei district (SB) contained 34 plots, Nangang district (NG) contained 52, Xiangfang district (XF) contained 59, Daoli district (DL) contained 33, and Daowai district (DW) contained 31. In the 219 plots, 16 plots fell within the first ring road (built in 1990 and abbreviated as “First”), 32 plots were distributed between the 1st and 2nd roads (built in 2001, Second), 77 plots were distributed between the 2nd and 3rd ring roads (built in 2016, Third), 74 plots were distributed between the 3rd and 4th ring roads (built in 2009, Fourth), and the remaining 20 plots were distributed outside the of 4th ring (in the planning, Outside or Fifth in regression analysis). The furthest plot was 10 kilometers from the 4th ring road, which is located within the planning 5th ring road. Among the 219 plots, 7 plots had a 100-year history, 11 plots had an 80-year history, 27 plots had a 70-year history, 26 plots had a 50-year history, 43 plots had a 10-year history, and 52 plots were located in the newly built-up region. The remaining 53 plots were located in rural regions.

2.3. Calculation of Tree Carbon Stock Densities

The tree C stock density (kg C·m−2) was measured as C stocks in trees per unit tree cover in each plot. Aboveground dry weight biomass of trees was estimated using tree biomass allometric growth equations obtained from published literature studies (Table A1) that were geographically near our study area [37]. We adjusted the equations based on the following rules: If no species-specific allometric equation was found, an equation for the same genus or family of the species was used [38]. If no equations for a genus or a family were found, a generalized equation was used [39]. If no tree root biomass equation was found, a root-shoot ratio of 0.26 was used [40]. Urban trees tend to have less aboveground tree biomass than trees in a natural forest because of pruning and maintenance; thus, the tree biomass estimate was multiplied by a factor of 0.8 for trees with a diameter greater than 30 cm [36]. Individual tree biomass was converted to C by multiplying by a factor of 0.5. The mean C stock density for each plot was calculated using the following equation:
C D j = i = 1 n D i A j
where CDj is the average C stock density for the jth plot; Di is the C stocks for the ith tree-shrub species; n is the tree-shrub species number; and Aj is the plot area for the jth plot.

2.4. Soil Organic C, Bulk Density Measurement, and SOC Density Calculation

Soils were sampled within 1 m of the main tree species for each plot (the main tree species are listed in Table A1). Only the surface soil was sampled (0–20 cm soil depth). Soil bulk density was measured using the ring-cup (100 mL) method. The ring-cup was inserted into the soil with a plastic hammer. Then, the intact soil with 100 mL fixed volume was taken out. Fixed volume intact soil (400 cm3, 4 cutting rings per plot) was kept in a cloth soil bag, and air-dried in a dry ventilated room to constant weight for laboratory analysis [41].
Soil dry mass is the fully air-dried soil mass in a cloth bag after at least 2 months. It is less than 1 percent different from oven dried (105 °C) soil, and can be used as the experimental samples for SOC content analysis.
Soil organic C was determined by the heated dichromate/titration method [42], with this method being described previously [41].
SOC density was the product of SOC content, soil bulk density, and sampling soil depth (20 cm in this study).

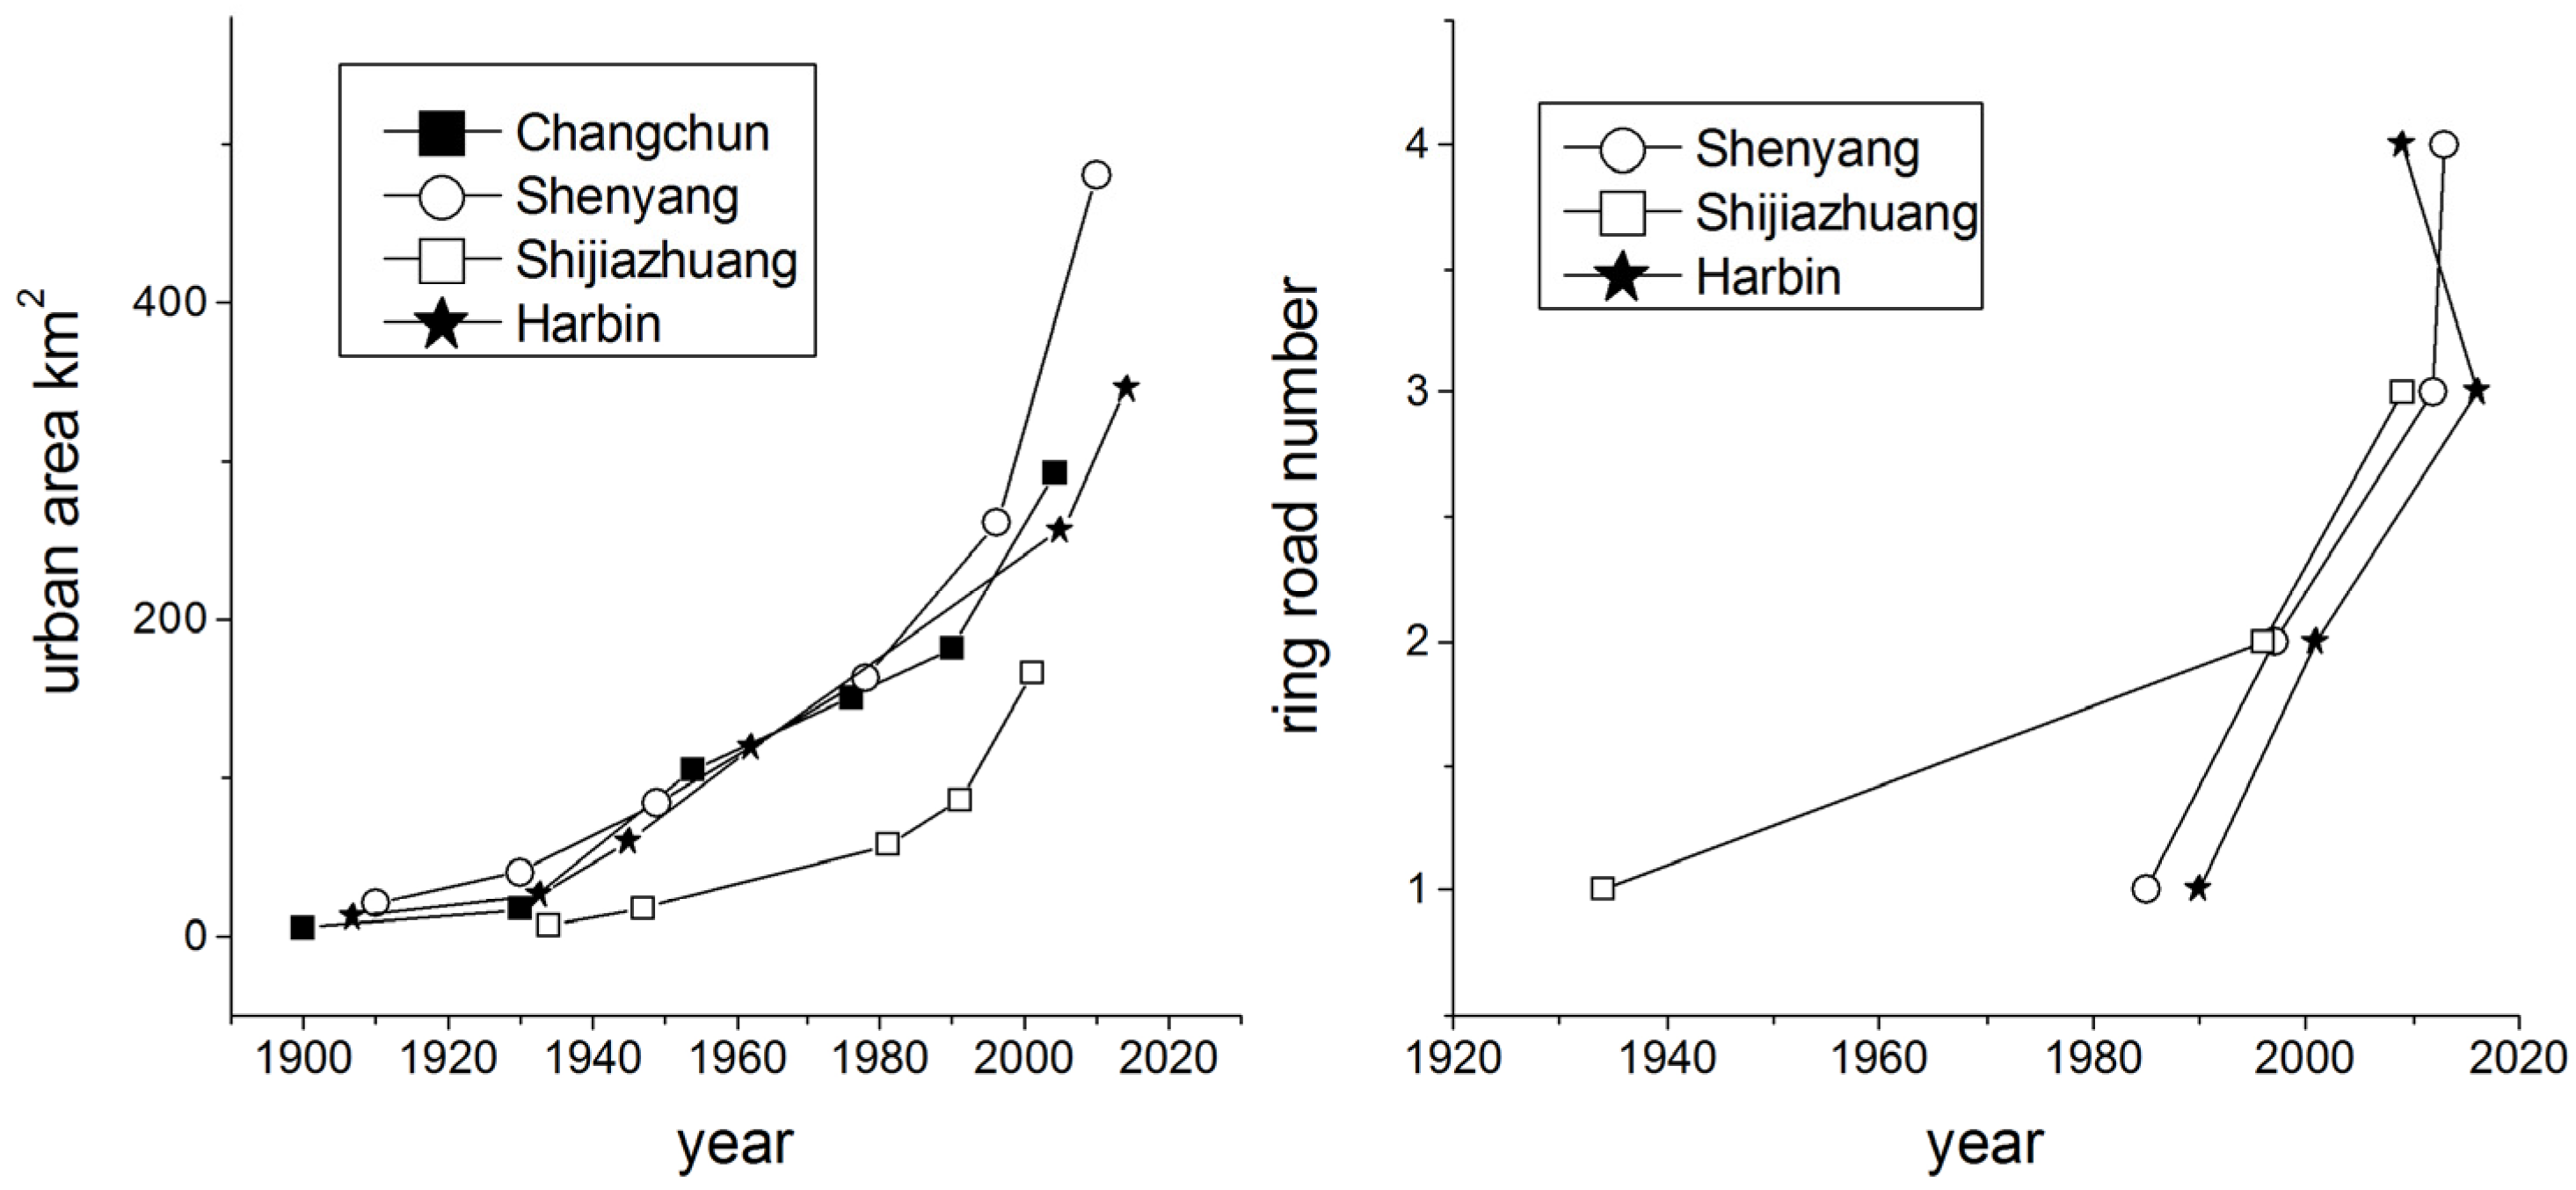
2.5. Analysis of the Urbanization Gradients, Mainly Represented as Ring Road and Urban Settlement Time

According to the city ring road development, 5 regions (1st ring road, 2nd ring road, 3rd ring road, 4th ring road, and outside 5th ring road) were used to represent urban-rural gradients from the central urban (first ring road region-downtown older city) to rural area (outside ring road region-rural younger city, Table 1). Previous studies [14,43] have used ring roads as a proxy for the degree of urbanization [43] or urban-rural gradients [14].
According to settlement time, 6 urban regions have been classified with settlement times of 0, 10, 50, 70, 80, and 100 years, which represent human disturbance history. The specific classification method is displayed in Table 1. We determined settlement time breakpoints according to the urban development process of Harbin [34]. Previous studies [15,44] have performed similar research and used the ages of residential areas or parks as a factor to assess the influence on soil C and nitrogen [15] or heavy metals [44].
DaoLi district, DaoWai district, and XiangFang district are all old districts, and may represent a high level of urbanization. NanGang district is younger than those three districts, and represents a medium level of urbanization. SongBei district is a new district, and represents a low level of urbanization (Figure 1).

2.6. Statistical Analysis

One-way ANOVA and Duncan’s new multiple range method were used to examine differences in C stock density in tree biomass and soil, SOC contents, soil bulk density, diameter at breast height (DBH), and basal area at breast height (simplified as basal area) among different urban forest types, urbanization gradients of ring-road regions and urban areas with different settlement history, and different administrative districts. These were performed using SPSS (version 19.0, 2010, IBM, Armonk, NY, USA) and MS Excel (14.0.4760.1000, 2010, Microsoft, Redmond, WA, USA). The significance level was 0.05.
Spatial variation in tree C stock density, SOC density, SOC content, soil bulk density, diameter at breast height (DBH), and basal area were quantified and mapped using ArcGIS 10.0 software (Esri, Beijing, China).

3. Results

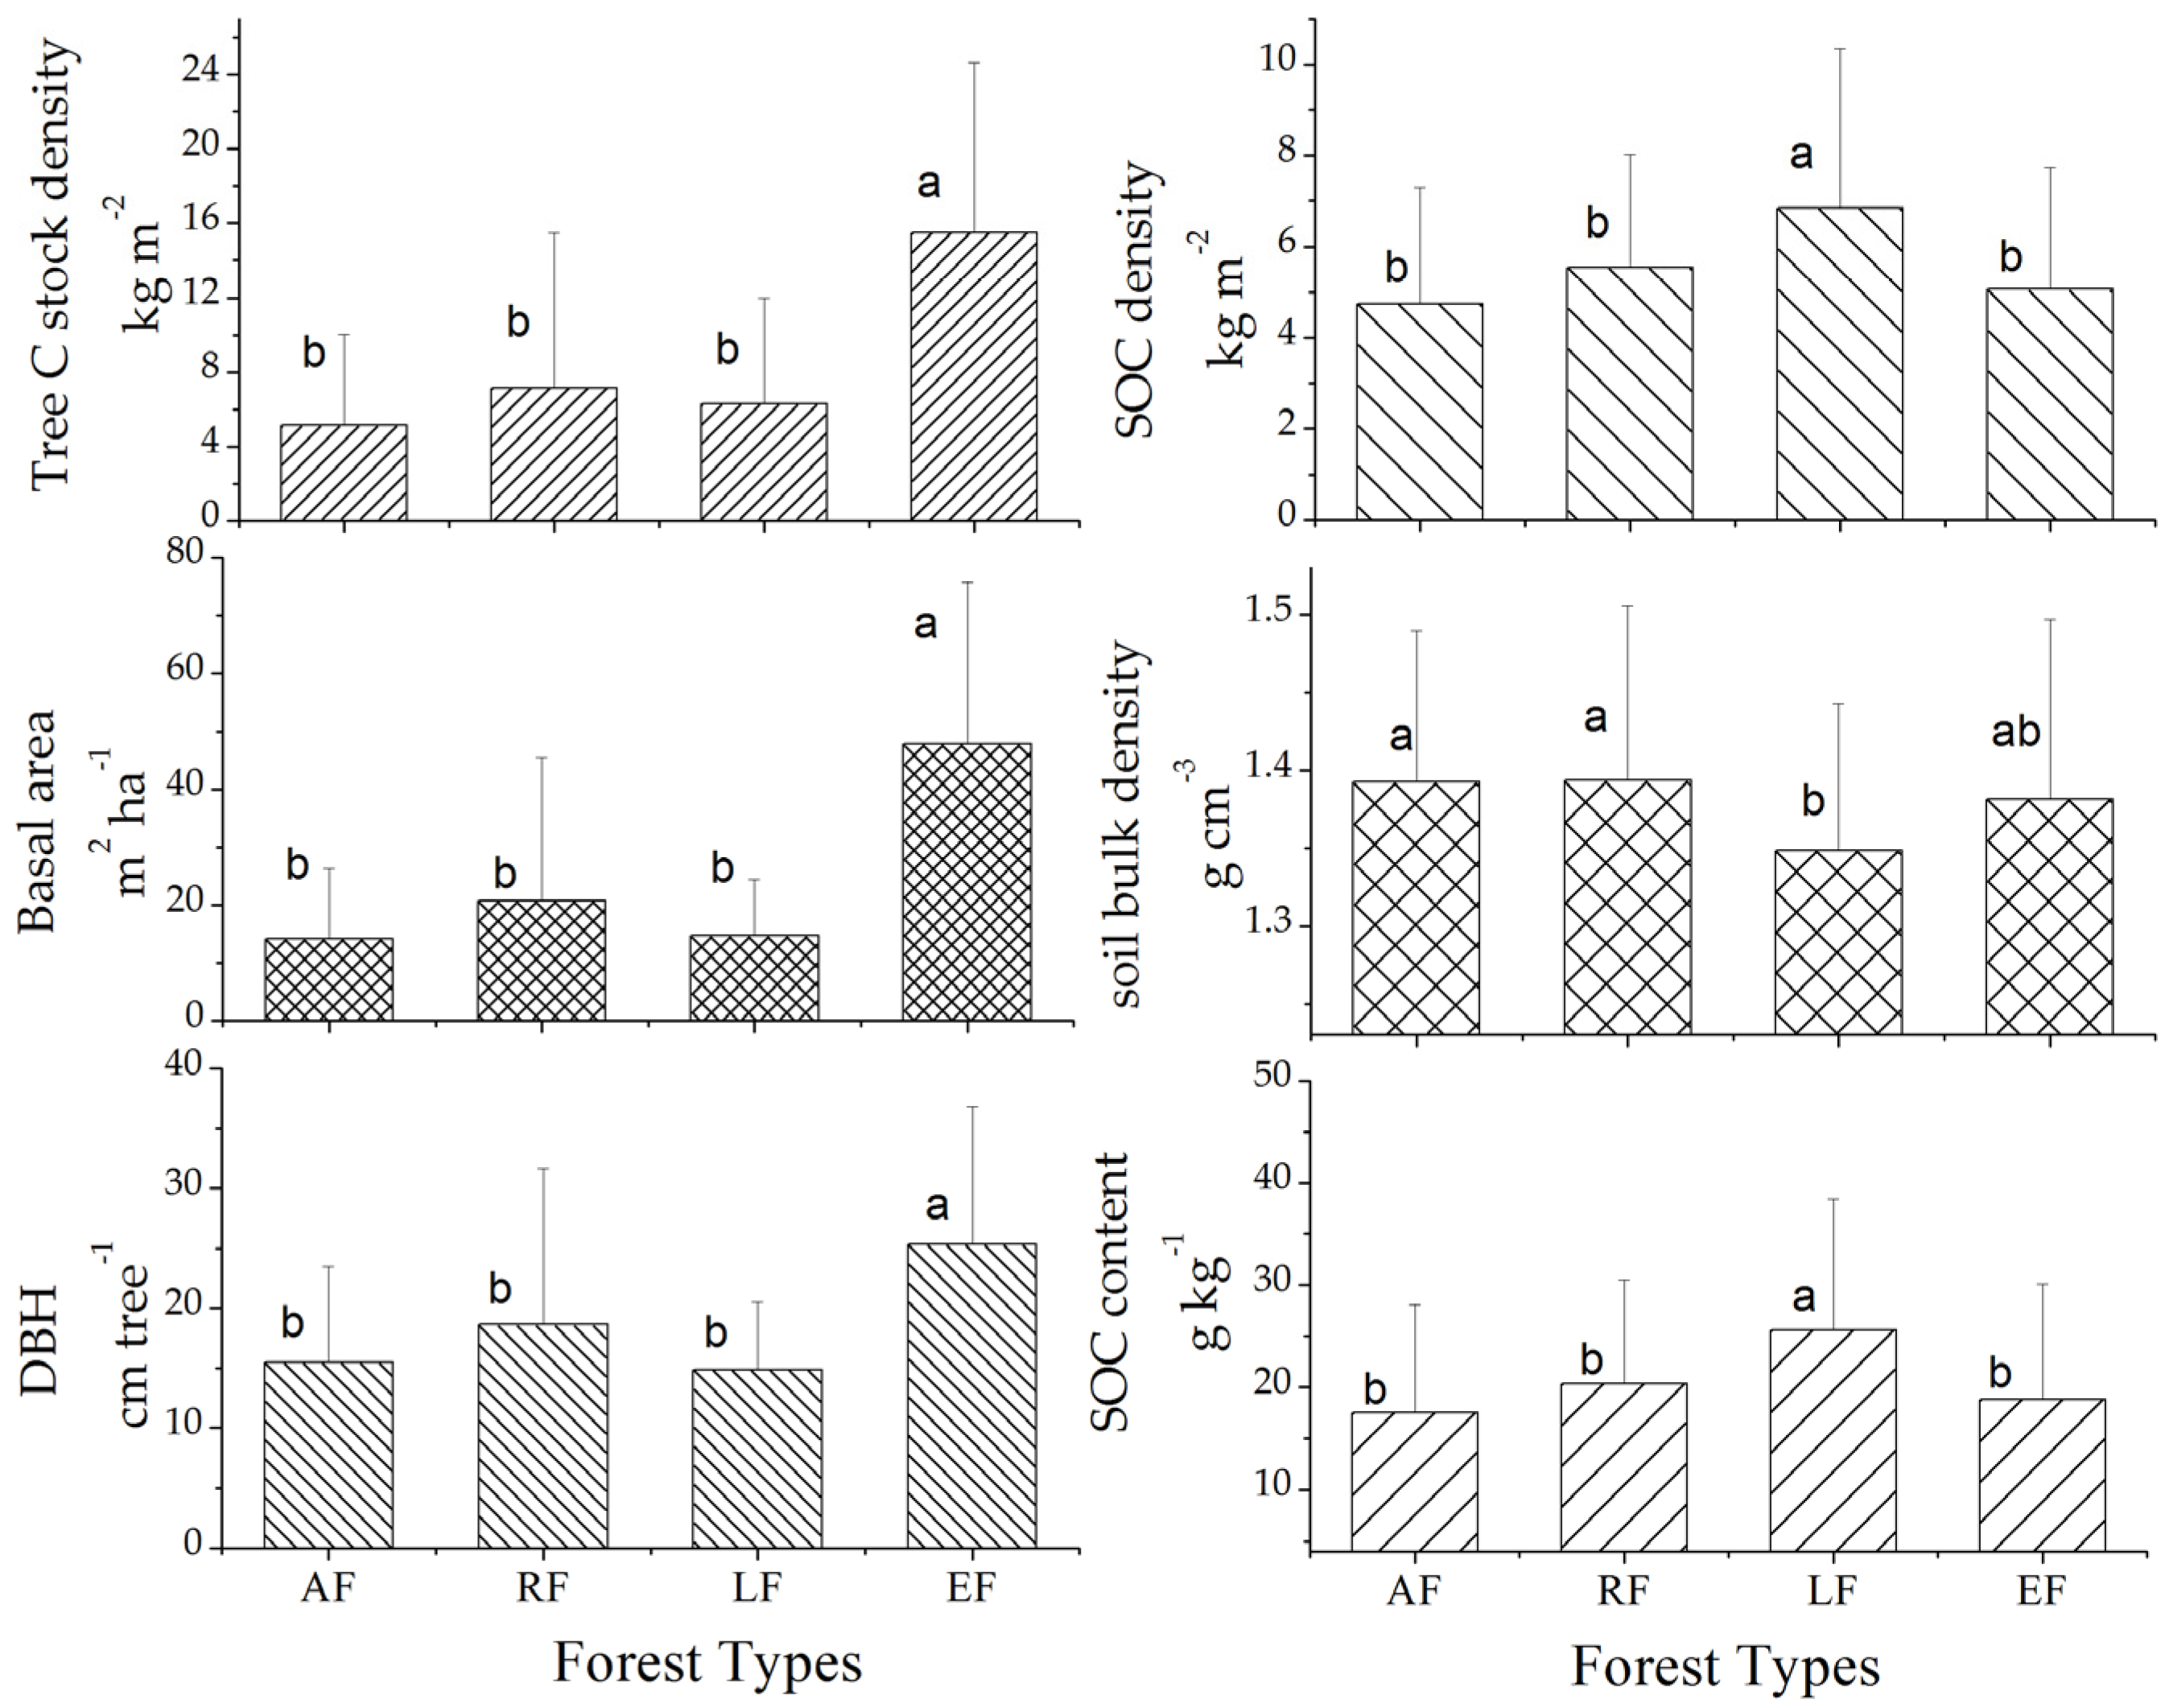
3.1. Variation in Forest Types with Respect to Tree Biomass and Soil C-Related Parameters

Tree C stock density, SOC density, SOC content, basal area, and DBH differed significantly among different forest types (Figure 2, Table A2). The highest tree C stock density (15.50 kg·m−2), basal area (47.76 m2·ha−1), and DBH (25.31 cm) in EF were 1.7 to 3 times those of other forest types. The tree C stock density, basal area, and DBH in AF, RF, and LF were not significantly different (p > 0.05, Figure 2 left).
The peak SOC density (6.85 kg·m−2) and SOC content (25.62 g·kg−1) in LF were 1.4 to 1.5 times higher than those of the other 3 forest types, whereas the lowest soil bulk density (1.35 g·cm−3) also occurred in LF. the SOC density, soil bulk density, and SOC content of AF, RF, and EF did not differ significantly (p > 0.05, Figure 2 right).

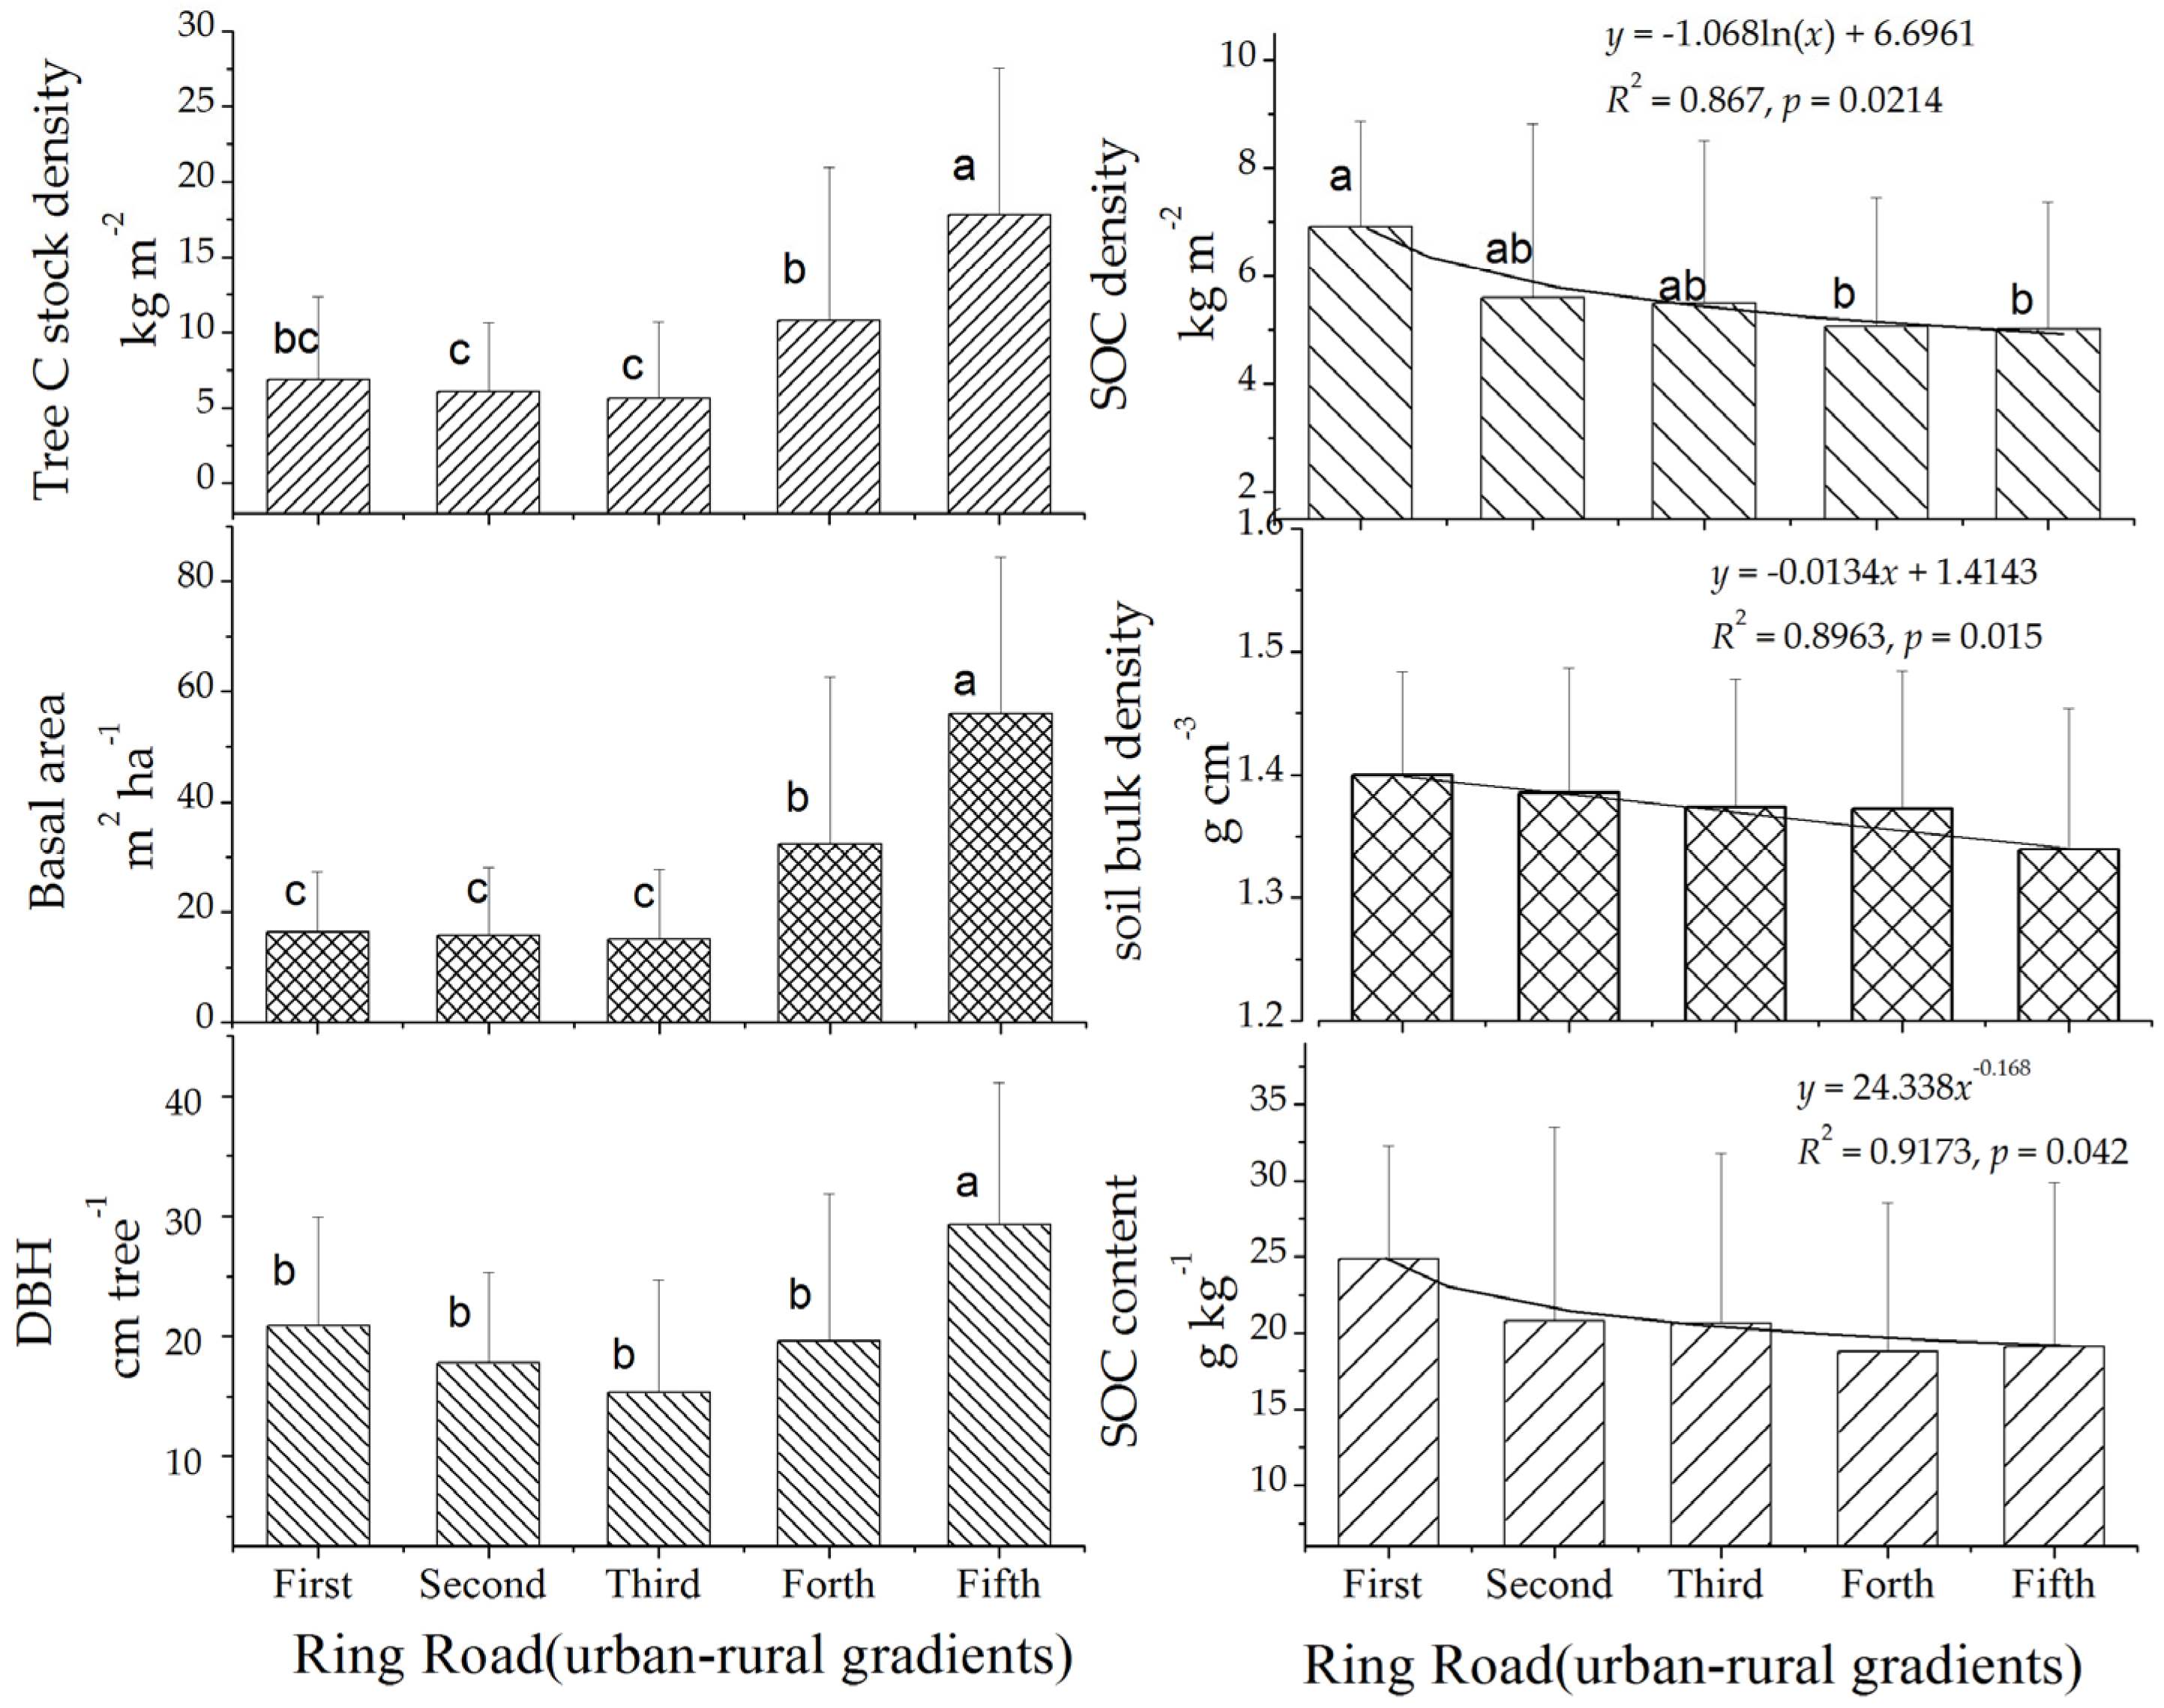
3.2. Variation in Ring Roads with Respect to Tree Biomass and Soil C-Related Parameters

Tree C stock density, DBH, and basal area differed significantly among different ring-roads (Figure 3 left, Table A2). They were greater in the outer ring roads (forth and fifth ring road) than inner ring roads (first, second, and third ring road) (p < 0.05). In comparison, SOC density, soil bulk density, and SOC content were greater in the inner ring roads (first and second ring road) than outer ring roads (third, forth, and fifth ring road).
The highest tree C stock density, basal area, and DBH in the fifth (outside of forth) ring road (17.82 kg·m−2, 56.00 m2·ha−1, and 29.30 cm respectively) were 2 to 3 times those of the other 4 ring roads. No correlations were detected for tree C stock density, basal area or DBH along this urban-rural gradients (Figure 3 left).
There were no significant differences in SOC density, soil bulk density, and SOC content among different ring roads (Table A2). However, SOC density logarithmically declined with increasing ring road number (R2 = 0.87, p < 0.05, Figure 3 right), declining from 6.91 kg·m−2 to 5.01 kg·m−2. Soil bulk density linearly declined with increasing ring road number (R2 = 0.9, p < 0.05), declining from 1.40 g·cm−3 to 1.37 g·cm−3. The SOC content exponentially declined with increasing ring road number (R2 = 0.92, p < 0.05), declining from 24.88 g·kg−1 to 18.59 g·kg−1.

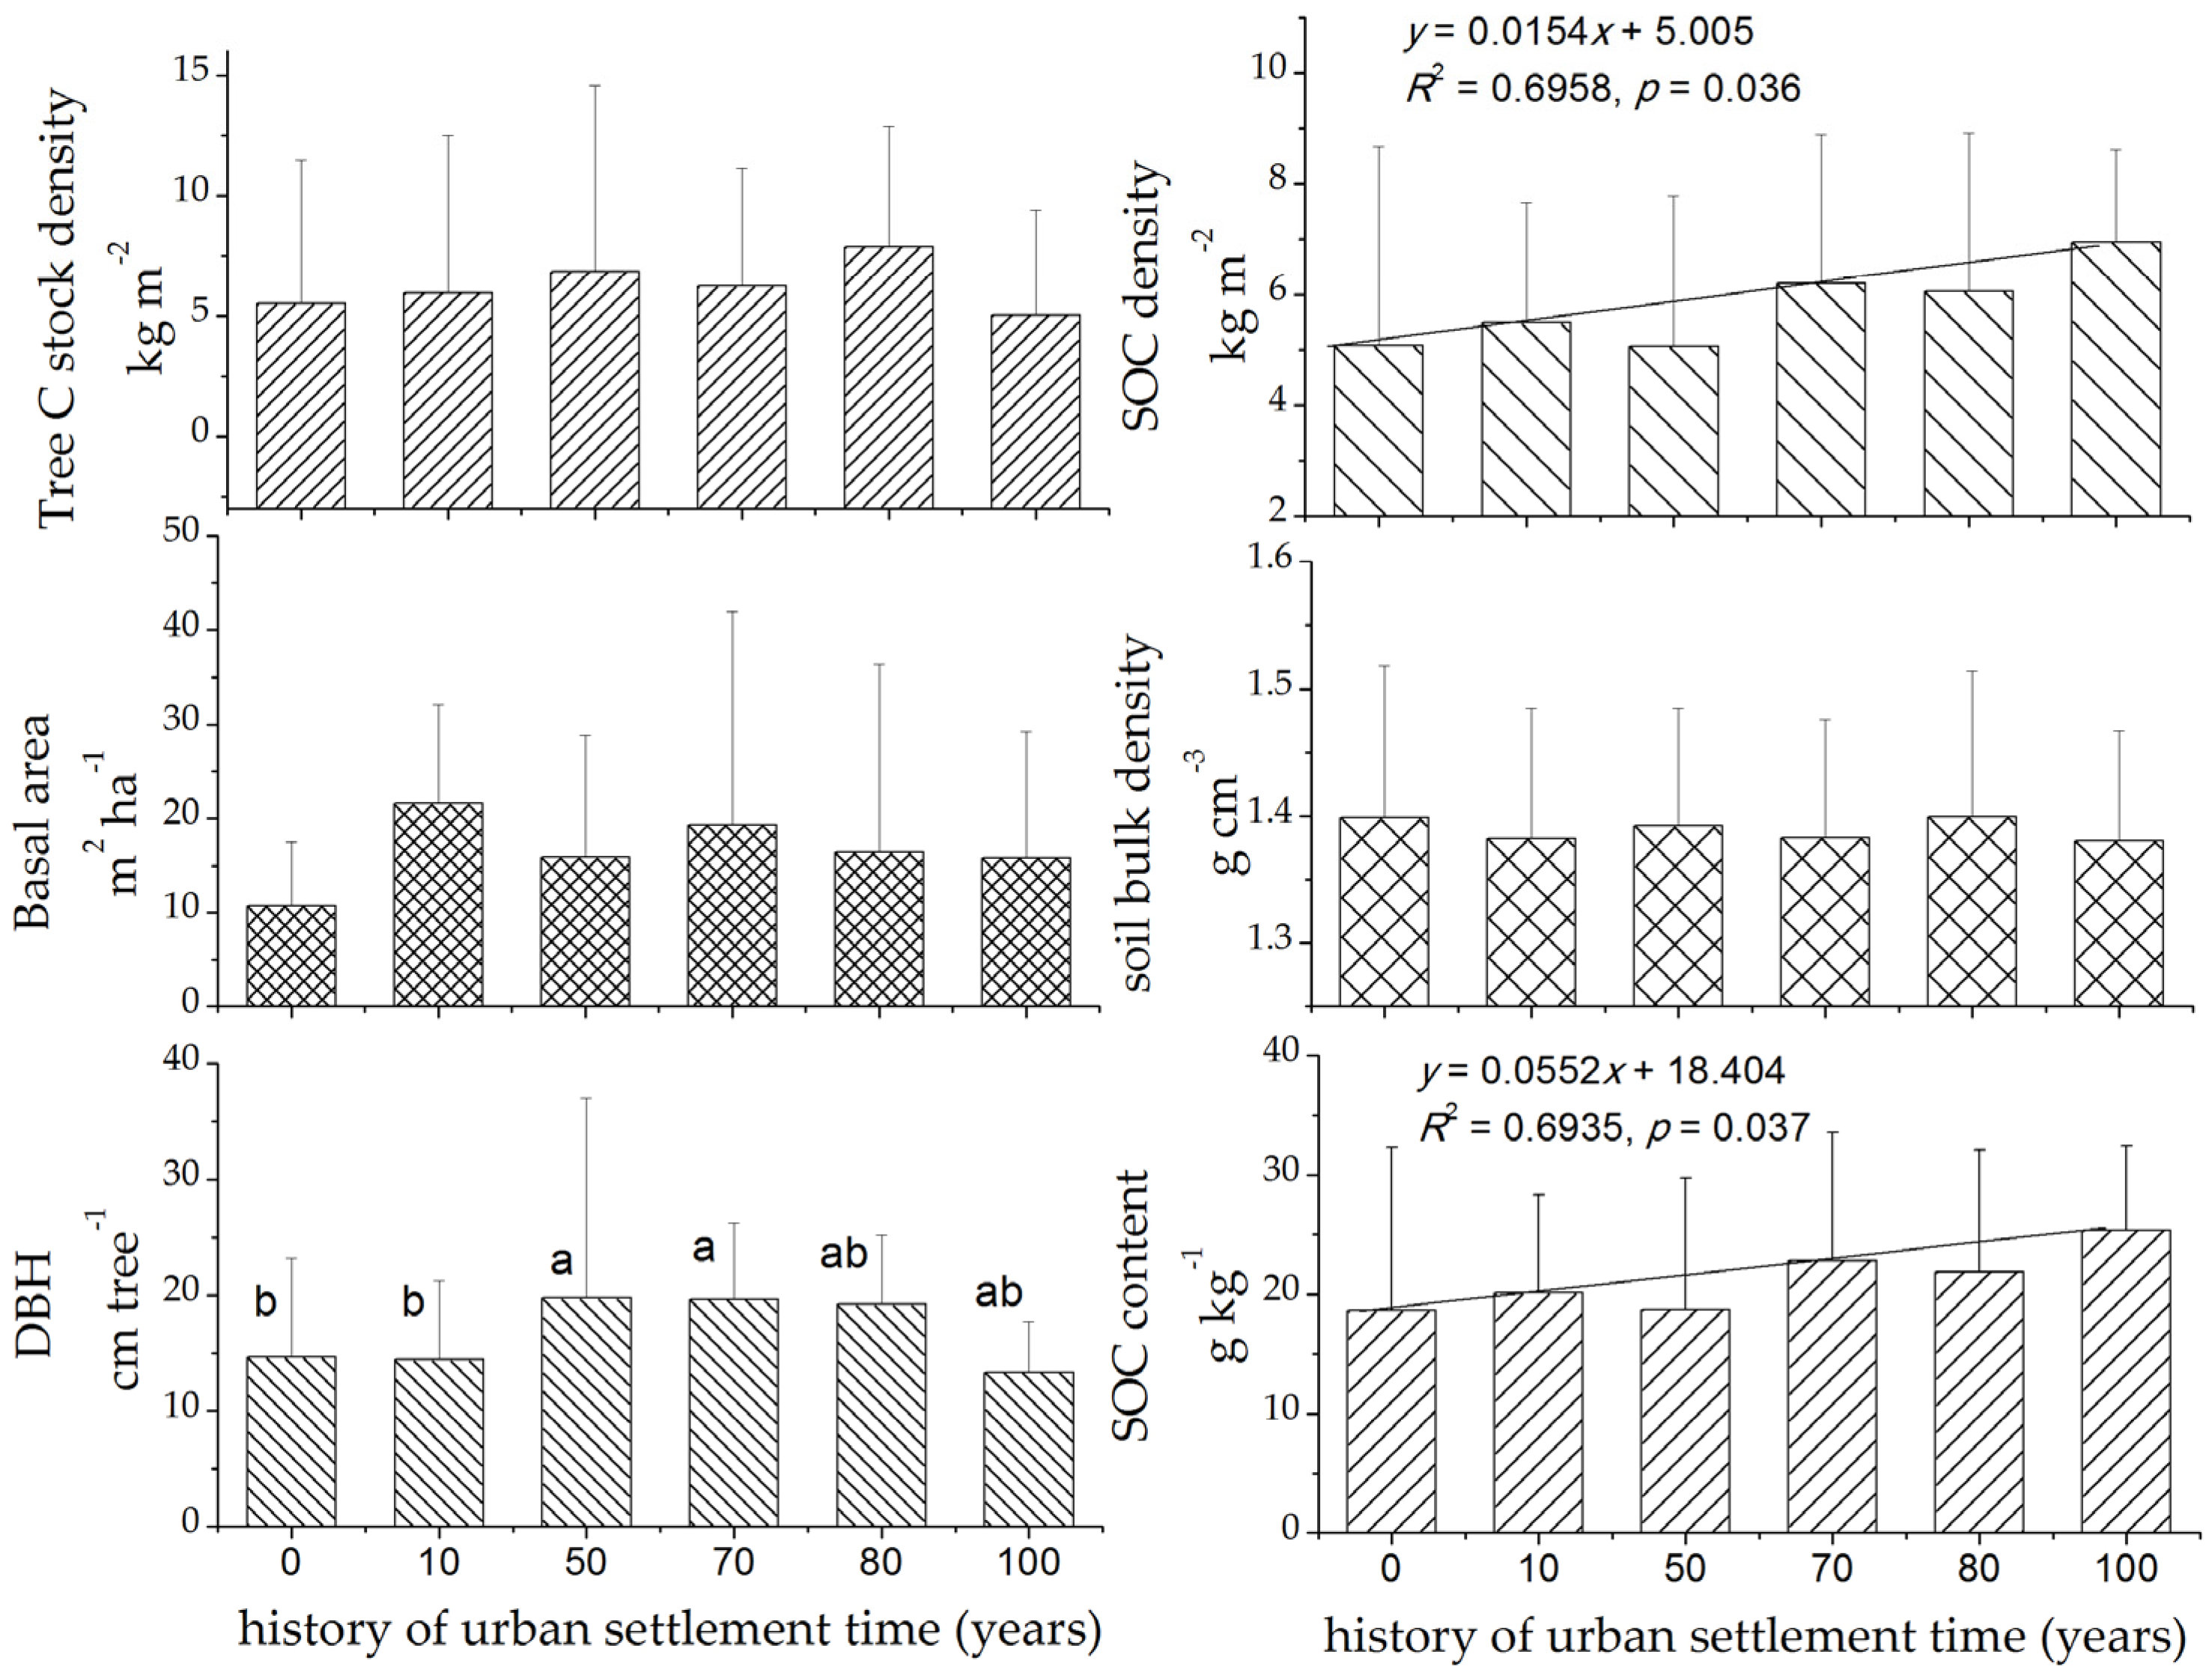
3.3. Variation in History of Settlement Region with Respect to Tree Biomass and Soil C-Related Parameters

Average DBH differed significantly among urban areas with different settlement times (p < 0.05; Figure 4, Table A2). No significant differences were found in other parameters. Even though there were no significant differences in SOC density and SOC content between different urban settlement times, the regression analysis showed that they both linearly increased with urban settlement time (p < 0.05). SOC density increased from 5.06 kg·m−2 to 6.94 kg·m−2 with an increasing rate of 15.4 g·m−2·year−1, and SOC content increased from 18.62 g·kg−1 to 25.38 g·kg−1, with an increasing rate of 0.055 g·kg−1·year−1 (Figure 4, right).

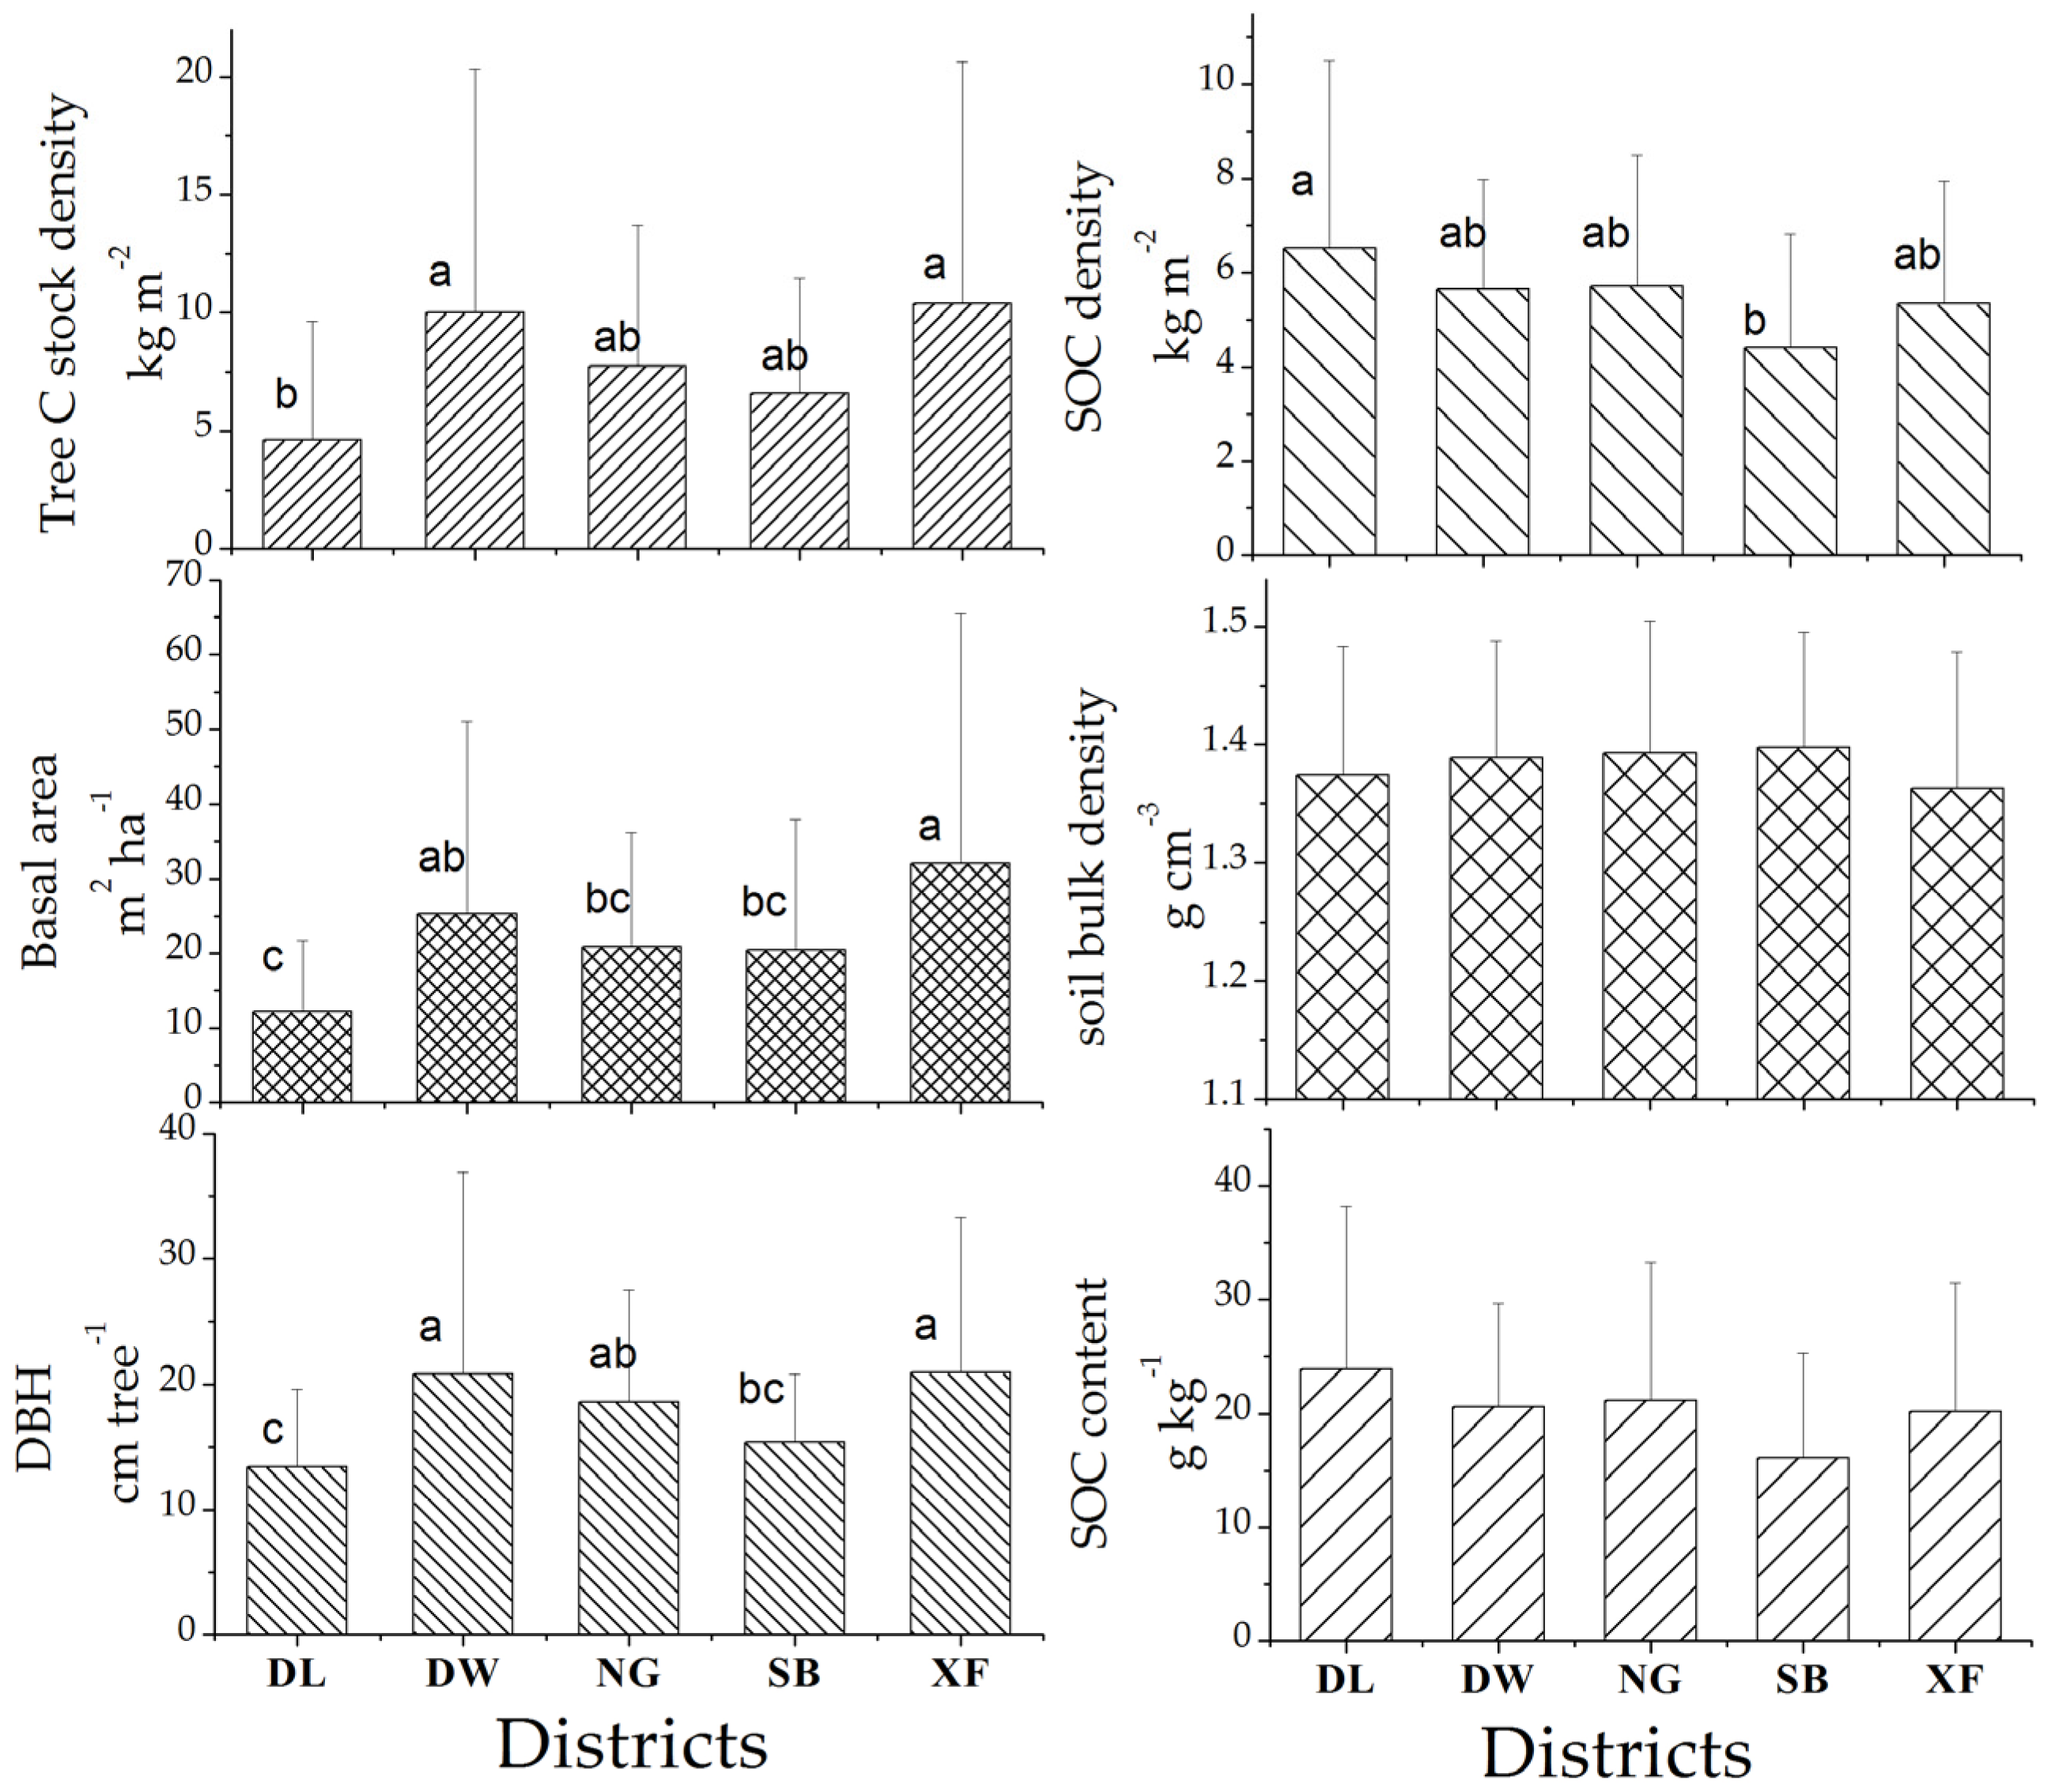
3.4. Variation in Administrative Districts with Respect to Tree Biomass and Soil C-Related Parameters

Tree C stock density, SOC density, basal area, and DBH differed significantly among different administrative districts (p < 0.05; Figure 5, Table A2), and no significant differences were found in other parameters. Compared with SOC density (1.47-fold), much greater variation was found in tree C stock density (1.47-fold versus 2.25-fold, respectively). The highest tree C stock density in the DW district (10.40 kg·m−2) was 2-fold higher than that in the DL district (4.62 kg·m−2). DBH and basal area were highest in the XF district (20.95 cm, 32.06 m2·ha−1) and lowest in the DL district (13.43 cm, 12.14 m2·ha−1). The highest SOC density and SOC content in the old district (high level of urbanization) of DL (6.52 kg·m−2, 23.94 g·kg−1) were 1.47 times those of the young district (low level of urbanization) of SB (4.42 kg·m−2, 16.11 g·kg−1).

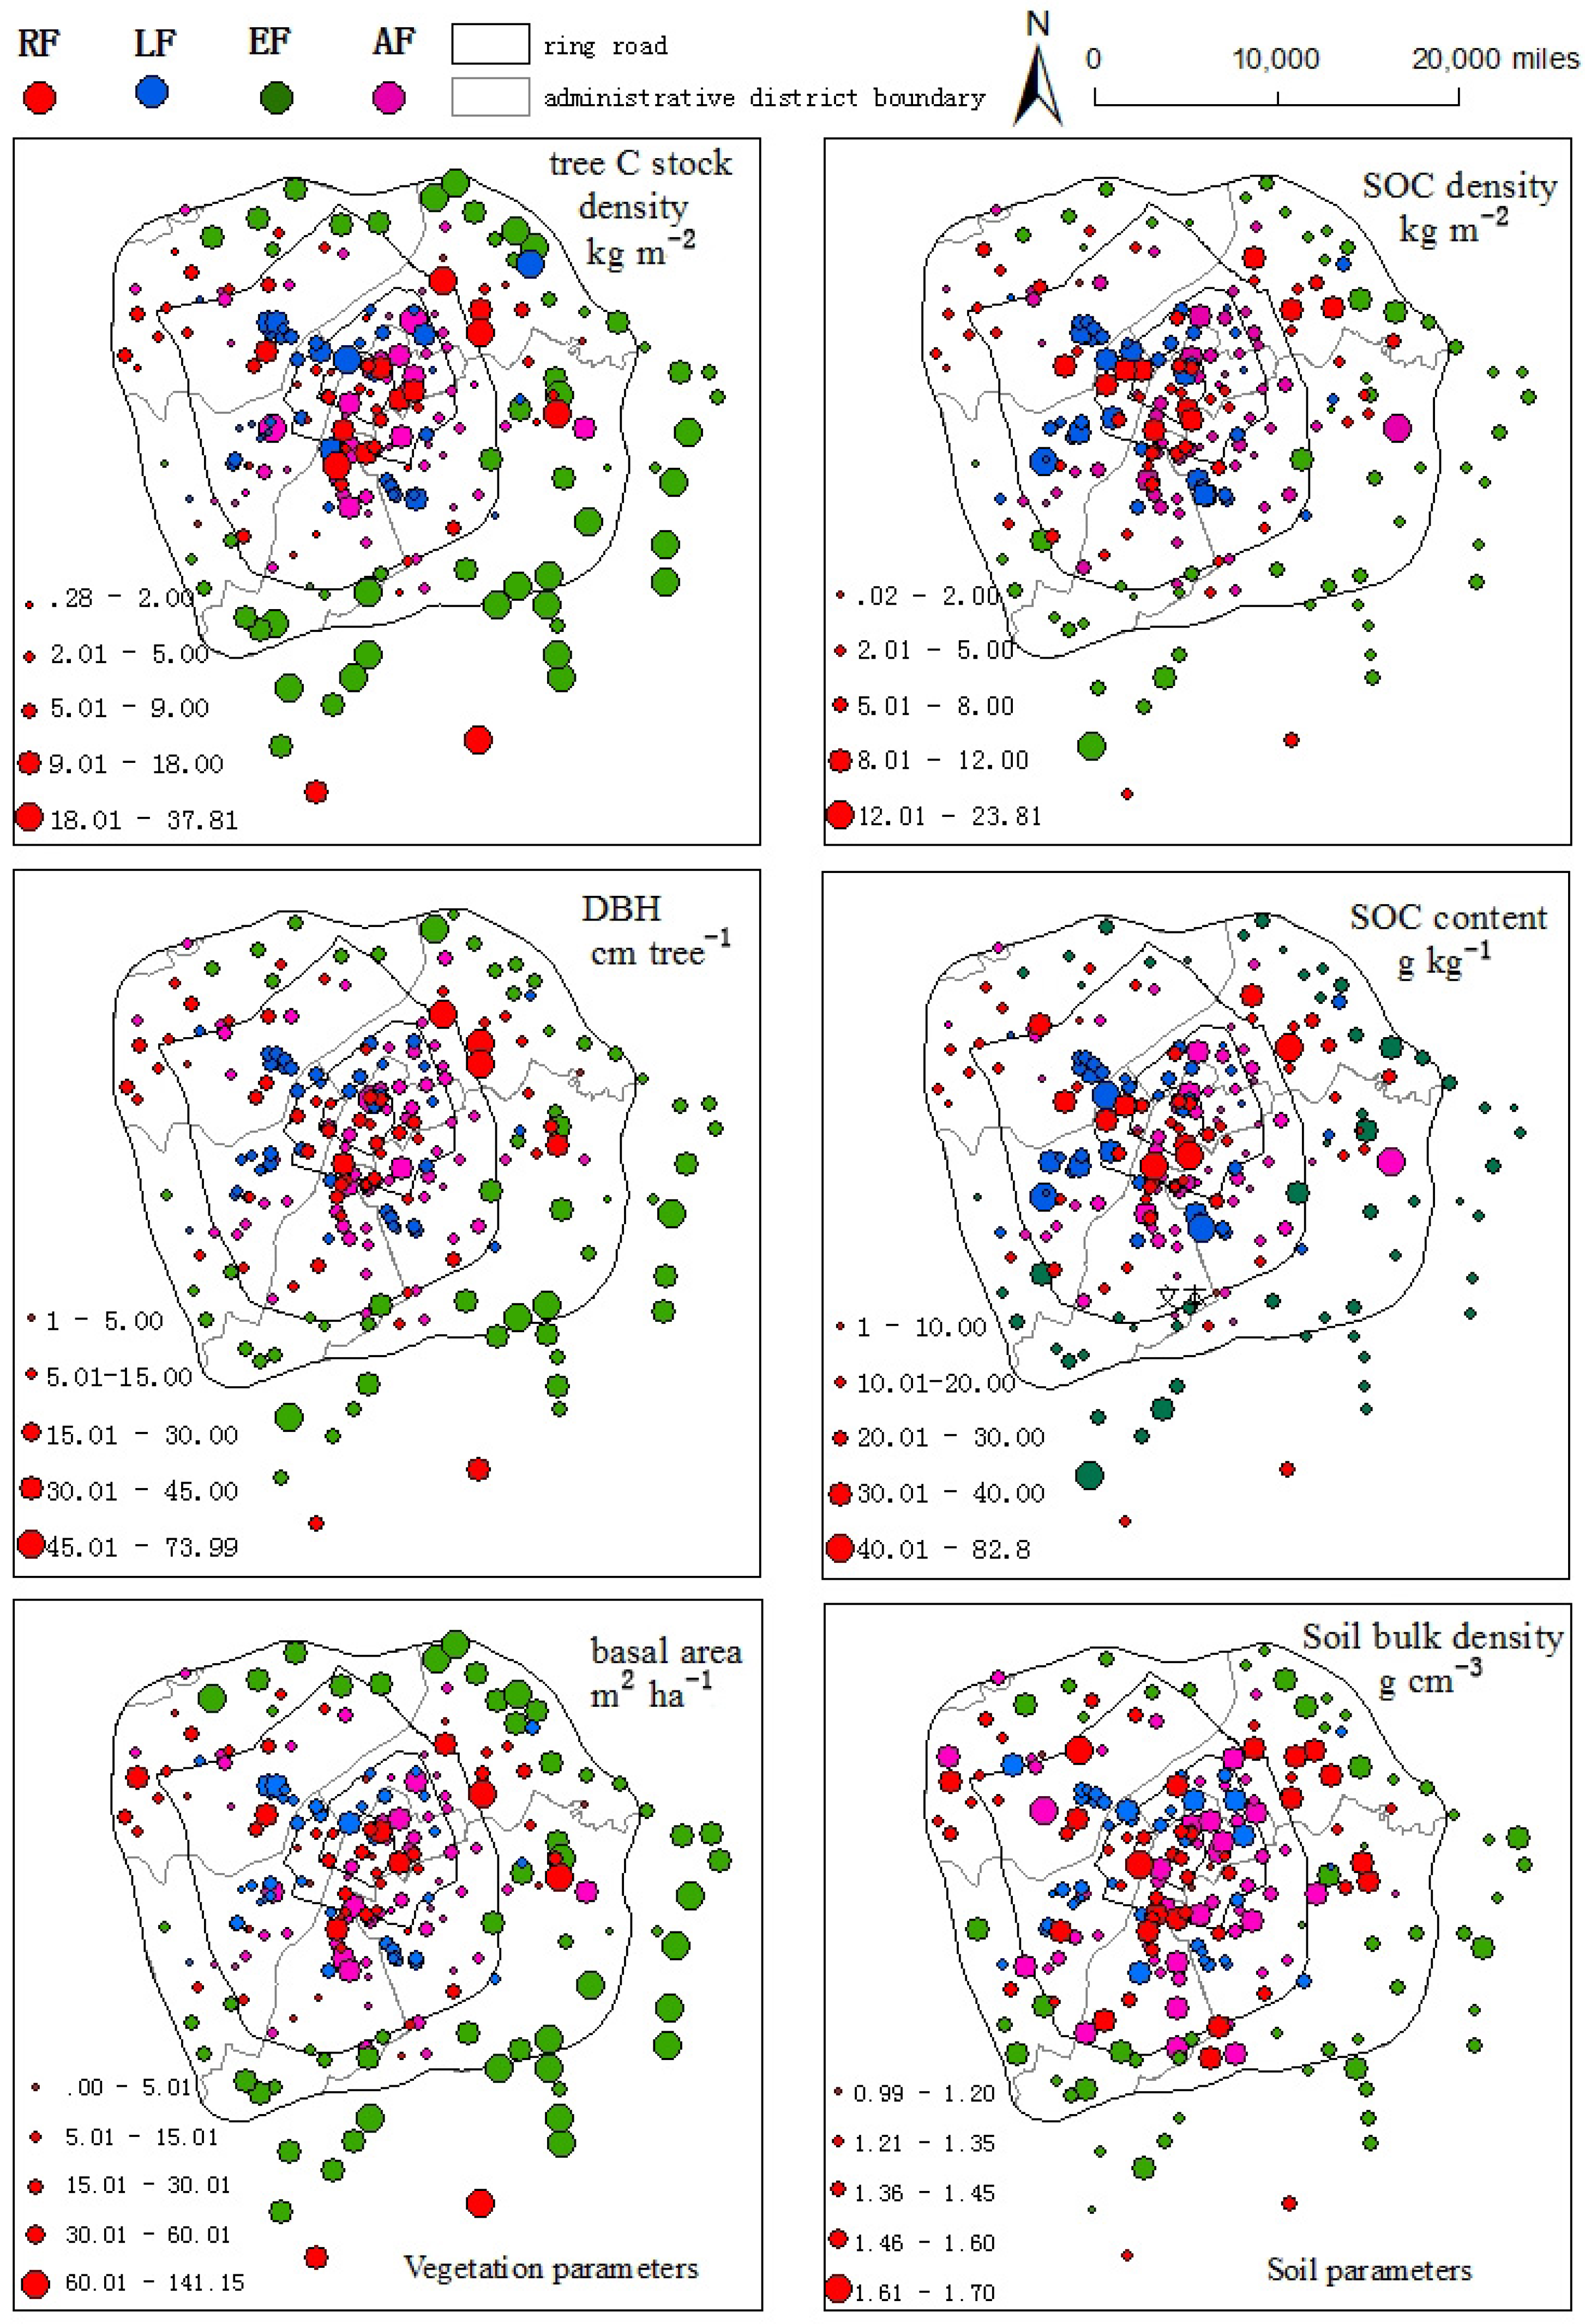
3.5. Spatial Distribution Map: Visual Confirmation of Variation

The variations of C in tree biomass and soils had different spatial distributions. Specifically, spatial variations of tree C stock density, DBH and basal area were similar in that these parameters of EF in the outer ring roads were greater than those in the inner ring roads for all forest types (Figure 6). However, the spatial variations of SOC density and SOC content of LF and RF in the inner ring road regions were greater than the outer ring roads for all forest types. Compared with soil C variations, the spatial distribution of tree C was more uneven (Figure 6).

4. Discussion

4.1. Tree and Soil C Stock Density of Harbin City Versus Other Cities and Natural Forests

The tree C stock density of Harbin’s urban forests ranged from 0.36 to 37.81 kg C·m−2, and averaged 7.71 kg C·m−2. This average value was much higher than Los Angeles and Sacramento, USA, reported by McPherson et al. [8], and cities in China like Beijing, Xiamen, and Hangzhou (Table 2). However, this average value was within the range of 3.14 kg C·m−2 for South Dakota and 14.14 kg C·m−2 in Omaha, NE, as reported by Nowak et al. [2]. The total C sequestration offsets by street trees and urban forests varied from 0.2% in Beijing [4] to 18.57% in Hangzhou [7], relative to their annual CO2-equivalent emissions from total energy consumption.
The average C stock density value in Harbin was higher than that in other nearby urban areas, such as 3.32 kg C·m−2 in Shenyang [27] and 4.41 kg C·m−2 in Changchun [8] (Table 2). These cities have the same climate and same soil type as Harbin City. However, this C stock density value was much lower than that documented for nearby natural forests located at the same latitude (45° N) [45]. The larger tree C stock density in Harbin City compared with other nearby cities may be because of the larger trees in Harbin. Tree DBH >30 cm accounted for 13.89% of total trees in Harbin, of which, 4.85% had a DBH >45 cm, and only 18.26% of the total trees in Harbin had a DBH of <7.6 cm (Table 3). In comparison, 50% of trees in Shenyang City had a DBH of <7.6 cm [37]. Furthermore, almost 70% of trees in Changchun had a DBH of <15.2 cm [14].
The surface soil (0–20 cm) organic C stock density of urban forests in Harbin ranged from 0.31 to 23.8 kg·m−2 (average: 5.48 kg·m−2). This value was within the range of 1.5 kg·m−2 for Washington, DC, and 16.3 kg·m−2 for Chicago, IL, but lower than that recorded for nearby natural forests (Table 2). The SOC content of Harbin was 19.98 g·kg−1 on average, which was between Shenyang and Changchun (Table 2). Soil bulk density data are not available for these two nearby cities; thus, we could only assume that their SOC density was similar to that of Harbin City because of the similar SOC content in these two cities. Due to the limits of urban management, we only collected surface soils (surface to 20 cm depth) from Harbin, which could lead to an underestimate of the SOC stocks in its urban forest.

4.2. Tree C Stock Variation along the Urban-Rural Gradients

Urban forests have decreased with increasing urbanization [50]. Meanwhile, many afforestation movements have been initiated in cities [51]. Since the 1980s, large areas of urban green spaces in China have been occupied due to accelerating urbanization and real estate development. However, China simultaneously implemented the concept of Forest Cities (designated by the State Forestry Administration of the People’s Republic of China) to increase urban forest coverage. By 2014, 96 cities across the country were awarded the title of “national forest city” [52]. Parallel deforestation and afforestation in the same urban region showed no noticeable or inconsistent spatial patterns in Harbin. Consequently, variation of tree C in urban space exhibited a casual-like process at different urbanization levels. For instance, tree C stock density showed no relations with urban-rural gradients. There was as much as 2.3- to 3.2-fold tree C variations in different forest types, ring roads, and administrative districts (Figure 2, Figure 3 and Figure 5, p < 0.05) in Harbin city. Regression analysis showed no significant relations between tree C and urbanization levels in this city (Figure 3 and Figure 4 left).

4.3. SOC Density Changes along Urban-Rural Gradients

In contrast to tree C, the spatial distribution of soil C was more like an urbanization-dependent process, which increased with rural-urban gradients (represented by decreasing ring road or increasing history of settlements) in the research region (Figure 3 and Figure 4). These results support those obtained by previous studies [15,17,25]. Pouyat et al. [17] showed that the highest organic matter content is found in the surface soil of urban areas (97 ± 3.3 g·kg−1), followed by suburban areas (83 ± 2.6 g·kg−1), and rural areas (73 ± 4.3 g·kg−1). In addition, the authors showed that forest floor mass decreased with increasing distance to central urban areas (y = −0.0295x + 8.2385, R2 = 0.54) [17]. Koerner and Klopatek [25] showed that SOC content and SOC stocks were higher in the surface soils (0–10 cm and 10–20 cm) of downtown regions compared with suburban and rural regions, regardless of whether the canopy was Larrea tridentata or interplant space. Our results showed that urban forest soil appears to accumulate C over settlement time. For instance, there was a 37.92% increase in SOC density between the area of outside ring-road region (rural) and the first ring road region (central urban, Figure 3), representing an accumulation rate of 15.4 g·C·m−2·year−1 (55.2 g·SOC·kg−1·year−1) over the 100 years of urbanization in Harbin City (Figure 4). By surveying soil to 100 cm depth, a previous study reported much larger SOC accumulation in Baltimore City, USA, that used housing age as a predictor of soil C with the accumulation rate of 82 g·C·m−2·year−1 [15]. Our study supports these preceding studies, showing that the urbanization has an incremental consequence on SOC density.
The mechanisms that dominate higher SOC content in downtown regions are unclear. Many factors influence SOC accumulation in downtown regions, with various studies investigating how to clarify the underlying mechanism. Researchers have shown that pools of labile C are lower, whereas pools of passive C are higher, in urban trees stands relative to rural forest stands [53]. In addition, lower microbial tree biomass [53] and lower litter quality in urban forests (decays 25% more slowly than litter in rural forest) [54] may lead to reduced C decomposition rates and consequent SOC accumulation in urban region. These phenomena may lead to higher SOC in urban forests compared with rural forests [17]. However, urban conditions (including higher temperature) may on the other hand accelerate litter decomposition [17,55], which is not conducive to SOC accumulation. In fact, the urbanization of arid and semiarid ecosystems leads to enhanced C cycling rates that may alter regional C budgets [27]. To sum up, certain conclusions may be drawn about SOC accumulation over time, but we cannot be certain of the mechanisms that drive this pattern due to the complex, sometimes opposing factors controlling C stocks in urbanized regions [15].

4.4. Implications for Urbanization-Induced C Stocks in China

Since 1978, China has experienced a rapid and unprecedented process of urbanization, with urban areas almost exponentially expanding outwards in many cities in parallel with ring road construction (Figure A1). For instance, the urban area in Harbin expanded by 65% over a 30-year period, from 200 km2 in the 1980s to 330 km2 in the 2010s. Further, in the 1980s, Harbin had only two ring roads, which increased to four ring-roads in the 2010s (Figure A1). With urban sprawl, the city area became a great source of carbon owing to human-related C emissions, and urban forests could serve as an important C stocks in cities. A basic assumption for previous estimations is the independence of SOC density to urbanization. Our results indicate that soil C is higher in the older central urban area than rural urban area. In future estimations of C stocks in urban forests, this urbanization-induced SOC accrual should be fully considered for a precise estimation. The amount of SOC accumulation in urban forests during urban sprawl was estimated from the SOC density accumulation rate (Figure 4 right for settlement time; Figure 3 right for ring-road expansion), along with the built-up area, urban settlement time (assuming that variation in SOC was due to urbanization), and average forest coverage (10%). The urbanization gradients (ring road expansion and/or history of urban settlement) in Harbin have led to about 5 to 14 thousand tons of SOC accumulating in the 0–20 cm soil layer. Previous studies showed that the total aboveground tree C stocks in the urban forests of Harbin are about 19 thousand tons [30]. Our data demonstrated that SOC accumulation in the soil during urbanization (about 100 years) in Harbin is about 26%–74% of this total tree C stocks [30]. This result shows the importance of underground SOC accumulation for estimating the total C stocks in urban areas, especially locations and regions subject to rapid urbanization [17]. The fact that SOC density increases during urbanization should be considered when making robust estimates of how urbanization affects the C sequestration function.

5. Conclusions

Urban forests act as a sink for carbon by storing carbon in tree biomass and accumulating carbon in soils. The C stocks of urban forests are of great importance because they influence local climate, carbon cycles, energy use and climate change. Urban forest tree biomass and SOC density in Harbin were higher than other local cities, but much lower than local natural forests. There was a 2- to 3-fold spatial variation in tree C stock density among forest types, administrative districts and ring roads, which randomly varied with urbanization gradients (e.g., ring roads and history of settlements). In comparison, regular urbanization-dependent changes were observed in soil C, as demonstrated by the close relationship between SOC density and urbanization gradients (ring roads and urban settlement history). A city’s ability to provide C-related ecosystem services, especially soil C, increases as it ages. Urbanization favors C sequestration in soil with an accumulation rate of 15.4 g·C·m−2·year−1. We estimated that urbanization-induced SOC accumulation is about 5 to 14 thousand tons in the whole region, which is of importance when comparing it with total tree C. Future studies on urban forest C dynamics should focus on urbanization effects especially for belowground C dynamics.

Acknowledgments

This study was supported financially by the One Hundred Talents Program in Chinese Academy of Sciences (Grand No. Y3H1051001), Outstanding Youth Fund from Heilongjiang Province (JC201401), basic research fund for national universities from the Ministry of Education of China (2572014EA01), key project from Chinese Academy of Sciences (Grand No. KFZD-SW-302), and NSFC project (Grand No. 31670699). Thanks are also due to Wei Chenhui, Ren Manli, Pei Zhongxue, and Zhang Dan for their help during the field survey and data processing. We would like to thank Editage (www.editage.com) for English language editing.

Author Contributions

Hailiang Lv, Wenjie Wang, and Xingyuan He conceived and designed the experiments; Hailiang Lv, Lu Xiao, Wei Zhou, and Bo Zhang performed the experiments; Hailiang Lv and Wenjie Wang analyzed the data; Lu Xiao, Wei Zhou, and Bo Zhang contributed reagents/materials/analysis tools; Hailiang Lv wrote the paper.

Conflicts of Interest

The authors declare no conflict of interest.

Appendix

Table A1. Allometric relations used in this paper.
Latin NameTree Biomass EquationsCitations
Pinus tabuliformisBag = Bstem + Bbranch + Bleaf; Bstem = 0.11 × D2.34; Bbranch = 0.01 × D2.58; Bleaf = 0.0049 × D2.48; Br = 0.64 × D2.1Ma [56]; Liu and Li [37]
UlmusBag = Bstem + Bbranch + Bleaf; Bstem = 0.043 × D2.87; Bbranch = 0.0074 × D2.67; Bleaf = 0.0028 × D2.50Chen and Guo [57]; Liu and Li [37]
PiceaBag = Bstem + Bbranch + Bleaf; Bstem = 0.057 × D2.48; Bbranch = 0.012 × D2.41; Bleaf = 0.083 × D2.37; Br = 0.0088 × D2.54Chen and Guo [57]; Liu and Li [37]
Betula platyphyllaBag = 102.159 × D2.367/1000; Br = 101.358 × D2.518/1000Wang [39]
PopulusBag = 101.826 × D2.558/1000; Br = 101.025 × D2.56/1000Wang [39]
Pinus koraiensisBag = 102.236 × D2.144/1000; Br = 101.296 × D2.376/1000Wang [39]
Larix gmeliniiBag = 101.977 × D2.451/1000; Br = 101.085 × D2.57/1000Wang [39]
AcerBag = 101.930 × D2.535/1000; Br = 102.112 × D1.981/1000Wang [39]
FraxinusBag = 102.136 × D2.408/1000; Br = 101.396 × D2.467/1000Wang [39]
Juglans mandshuricaBag = 102.235 × D2.287/1000; Br = 101.226 × D2.397/1000Wang [39]
PhellodendronamurenseBag = 101.942 × D2.332/1000; Br = 101.024 × D2.617/1000Wang [39]
TiliaBag = 101.606 × D2.668/1000; Br = 101.273 × D2.452/1000Wang [39]
Quercus mongolicaBag = 102.002 × D2.456/1000; Br = 101.482 × D2.356/1000Wang [39]
Pinus sylvestris L. var. sylvestriformisBag = Bstem + Bbr + Bleaf; Br = 200.0322 × D1.495/1000; Bstem = 0.0159368 × D2.949 + 0.6300862 × D0.759; Bbranch = 0.0557699 × D2.483; Bleaf = 0.1090 × D4.293/1000Zou et al. [58]
Pinus sylvestris var. mongolica Litv.Bag = Bstem + Bbranch + Bleaf; Bstem = 0.0439 × (D2H)0.8852; Bbranch = 0.02388 × D4.1912H−2.3076; Bleaf = 0.1082 × D2.7169H−1.3955Jia et al. [59]
PlatycladusBag = Bstem + Bbranch + Bleaf; Bstem = 0.013 × (D2H)0.5969 + 0.0036 × (D2H)0.6758; Bbranch = 0.00274 × (D2H)0.5973 + 0.004965 × (D2H)0.5975 + 0.00055 × (D2H)0.5879; Bleaf = 0.003787 × (D2H)0.5976Chang et al. [60]
PadusracemosaBag = 0.00009 × D2.696; Br = 0.035 × D2.641/1000Li [61]
RosaceaeBag = 10 − 0.6657 × D1.7041Wu [62]
Tree generalized equationBag = 101.945 × D2.467/1000; Btotal = 102.033 × D2.469/1000; Br = Btotal − BagWang [40]
Acer ginnalaBag = 0.527 × D2.217/1000; Br = 0.149 × D2.261/1000Li [61]
Syringa reticulataBag = 0.395 × D2.3/1000; Br = 0.129 × D2.302/1000Li [61]
Euonymus alatusBag = 0.095 × D2.655/1000; Br = 0.089 × D2.291/1000Li [61]
RhamnusschneideriBag = 0.169 × D2.555/1000; Br = 0.092 × D2.314/1000Li [61]
Viburnum sargentiBag = 0.141 × D2.649/1000; Br = 0.245 × D1.994/1000Li [61]
Tree Shrub generalized equationBag = 0.182 × D2.487/1000; Br = 0.089 × D2.37/1000Li [61]
D means DBH (cm), H means height (m), Bag means aboveground biomass (kg), Br means root biomass.
Table A2. Tree and soil carbon stocks differences in different forest types, ring roads, administrative districts, urban area settlement time of urban forests in Harbin City: One-way ANOVA results.
SourceDependent VariabledfFSig.
Forest typesSOC density kg·m−235.181<0.01 **
Tree C stocks density kg·m−2323.026<0.001 ***
SOC content g·kg−134.735<0.01 **
Soil bulk density g·cm−331.8130.146
DBH cm37.403<0.001 ***
Basal area m2·ha−1331.598<0.001 ***
Ring roads (urban-rural gradients)SOC density kg·m−241.5350.193
Tree C stocks density kg·m−2412.670<0.001 ***
SOC content g·kg−141.0950.360
Soil bulk density g·cm−340.2840.207
DBH cm47.403<0.001 ***
Basal area m2·ha−1418.103<0.001 ***
History of settlementsSOC density kg·m−251.1160.354
Tree C stocks density kg·m−250.3830.860
SOC content g·kg−150.9720.437
Soil bulk density g·cm−350.1670.975
DBH cm52.325<0.05 *
Basal area m2·ha−150.5290.754
DistrictsSOC density kg·m−252.373<0.05 *
Tree C stocks density kg·m−256.059<0.001 ***
SOC content g·kg−152.0470.073
Soil bulk density g·cm−350.6950.533
DBH cm511.683<0.01 **
Basal area m2·ha−156.723<0.01 **
Note: * represent 0.05 significant level, ** represent 0.01 significant level, and *** represent 0.001 significant level.
Figure A1. Rapid urbanization of sample cities in China, data acquired and anlyzed based on papers [35,63,64].
Forests 07 00200 g007

References

  1. Jim, C.Y.; Chen, W.Y. Ecosystem services and valuation of urban forests in China. Cities 2009, 26, 187–194. [Google Scholar] [CrossRef]
  2. Nowak, D.J.; Greenfield, E.J.; Hoehn, R.E.; Lapoint, E. Carbon storage and sequestration by trees in urban and community areas of the United States. Environ. Pollut. 2013, 178, 229–236. [Google Scholar] [CrossRef] [PubMed]
  3. Escobedo, F.; Varela, S.; Zhao, M.; Wagner, J.E.; Zipperer, W. Analyzing the efficacy of subtropical urban forests in offsetting C emissions from cities. Environ. Sci. Policy 2010, 13, 362–372. [Google Scholar] [CrossRef]
  4. Yang, J.; McBride, J.; Zhou, J.X.; Sun, Z.Y. The urban forest in Beijing and its role in air pollution reduction. Urban Forest. Urban Green. 2005, 3, 65–78. [Google Scholar] [CrossRef]
  5. Tang, Y.J.; Chen, A.P.; Zhao, S.Q. Carbon storage and sequestration of urban street trees in Beijing, China. Front. Ecol. Evol. 2016, 4, 53. [Google Scholar]
  6. Ren, Y.; Yan, J.; Wei, X.H.; Wang, Y.J.; Yang, Y.S.; Hua, L.Z.; Xiong, Y.Z.; Niu, X.; Song, X.D. Effects of rapid urban sprawl on urban forest carbon stocks: Integrating remotely sensed, GIS and forest inventory data. J. Environ. Manag. 2012, 113, 447–455. [Google Scholar] [CrossRef] [PubMed]
  7. Zhao, M.; Kong, Z.H.; Escobedo, F.J.; Gao, J. Impacts of urban forests on offsetting carbon emissions from industrial energy use in Hangzhou, China. J. Environ. Manag. 2010, 91, 807–813. [Google Scholar] [CrossRef] [PubMed]
  8. McPherson, E.G.; Xiao, Q.; Aguaron, E. A new approach to quantify and map carbon stored, sequestered and emissions avoided by urban forests. Landsc. Urban Plan. 2013, 120, 70–84. [Google Scholar] [CrossRef]
  9. Díaz-Porras, D.F.; Gaston, K.J.; Evans, K.L. 110 years of change in urban tree stocks and associated carbon storage. Ecol. Evol. 2014, 4, 1413–1422. [Google Scholar] [CrossRef] [PubMed]
  10. Shakeel, T.; Conway, T.M. Individual households and their trees: Fine-scale characteristics shaping urban forests. Urban For. Urban Green. 2014, 13, 136–144. [Google Scholar] [CrossRef]
  11. Yoon, T.K.; Park, C.W.; Lee, S.J.; Ko, S.; Kim, K.N.; Son, Y.; Son, Y. Allometric equations for estimating the aboveground volume of five common urban street tree species in Daegu, Korea. Urban For. Urban Green. 2013, 12, 344–349. [Google Scholar] [CrossRef]
  12. Timilsina, N.; Escobedo, F.J.; Staudhammer, C.L.; Brandeis, T. Analyzing the causal factors of C stores in a subtropical urban forest. Ecol. Complex. 2014, 20, 23–32. [Google Scholar] [CrossRef]
  13. Edmondson, J.L.; O’Sullivan, O.S.; Inger, R.; Potter, J.; McHugh, N.; Gaston, K.J.; Leake, J.R. Urban Tree Effects on Soil Organic C. PLoS ONE 2014, 9. [Google Scholar] [CrossRef] [PubMed]
  14. Zhang, D.; Zheng, H.; Ren, Z.; Zhai, C.; Shen, G.; Mao, Z.; He, X. Effects of forest type and urbanization on C storage of urban forests in Changchun, Northeast China. Chin. Geogr. Sci. 2015, 25, 147–158. [Google Scholar] [CrossRef]
  15. Raciti, S.M.; Groffman, P.M.; Jenkins, J.C.; Pouyat, R.V.; Fahey, T.J.; Pickett, S.T.; Cadenasso, M.L. Accumulation of C and Nitrogen in Residential Soils with Different Land-Use Histories. Ecosystems 2011, 14, 287–297. [Google Scholar] [CrossRef]
  16. Pouyat, R.V.; Yesilonis, I.D.; Nowak, D.J. Carbon storage by urban soils in the United States. J. Environ. Qual. 2006, 35, 1566–1575. [Google Scholar] [CrossRef] [PubMed]
  17. Pouyat, R.; Groffman, P.; Yesilonis, I.; Hernandez, L. Soil C pools and fluxes in urban ecosystems. Environ. Pollut. 2002, 116, S107–S118. [Google Scholar] [CrossRef]
  18. Oldfield, E.E.; Felson, A.J.; Wood, S.A.; Hallett, R.A.; Strickland, M.S.; Bradford, M.A. Positive effects of afforestation efforts on the health of urban soils. For. Ecol. Manag. 2014, 313, 266–273. [Google Scholar] [CrossRef]
  19. Zhao, Y.G.; Zhang, G.L.; Zepp, H.; Yang, J.L. Establishing a spatial grouping base for surface soil properties along urban–rural gradient—A case study in Nanjing, China. Catena 2007, 69, 74–81. [Google Scholar] [CrossRef]
  20. Setälä, H.M.; Francini, G.; Allen, J.A.; Hui, N.; Jumpponen, A.; Kotze, D.J. Vegetation Type and Age Drive Changes in Soil Properties, Nitrogen, and Carbon Sequestration in Urban Parks under Cold Climate. Front. Ecol. Evol. 2016, 4. [Google Scholar] [CrossRef]
  21. Huyler, A.; Chappelka, A.H.; Prior, S.A.; Somers, G.L. Influence of aboveground tree biomass, home age, and yard maintenance on soil carbon levels in residential yards. Urban Ecosyst. 2014, 17, 787–805. [Google Scholar] [CrossRef]
  22. Zhang, H.X.; Zhuang, S.Y.; Qian, H.Y.; Wang, F.; Ji, H.B. Spatial Variability of the Topsoil Organic C in the Moso Bamboo Forests of Southern China in Association with Soil Properties. PLoS ONE 2015, 10. [Google Scholar] [CrossRef] [PubMed]
  23. Chen, H.; Zhang, W.; Gilliam, F.S.; Liu, L.; Huang, J.; Zhang, T.; Mo, J. Changes in soil C sequestration in Pinus massoniana forests along an urban-to-rural gradient of southern China. Biogeosciences 2013, 10, 6609–6616. [Google Scholar] [CrossRef] [Green Version]
  24. Drayton, B.; Primack, R.B. Plant Species Lost in an Isolated Conservation Area in Metropolitan Boston from 1894 to 1993. Conserv. Biol. 1996, 10, 30–39. [Google Scholar] [CrossRef]
  25. Koerner, B.A.; Klopatek, J.M. C fluxes and nitrogen availability along an urban-rural gradient in a desert landscape. Urban Ecosyst. 2010, 13, 1–21. [Google Scholar] [CrossRef]
  26. Rao, P.; Hutyra, L.R.; Raciti, S.M.; Finzi, A.C. Field and remotely sensed measures of soil and biomass C and nitrogen across an urbanization gradient in the Boston metropolitan area. Urban Ecosyst. 2013, 16, 593–616. [Google Scholar] [CrossRef]
  27. Kaye, J.P.; McCulley, R.L.; Burke, I.C. Carbon fluxes, nitrogen cycling, and soil microbial communities in adjacent urban, native and agricultural ecosystems. Glob. Chang. Biol. 2005, 11, 575–587. [Google Scholar] [CrossRef]
  28. Gao, Y. Study on Soil of Harbin Urban Biomass. Master’s Thesis, Northeast Forestry University, Harbin, China, July 2002. [Google Scholar]
  29. Hu, H.; Chen, X.; Xu, S. Soil nutrients and plant cultivation Countermeasures of Urban green sapce in Harbin. Res. Environ. Sci. 2013, 20, 110–114. [Google Scholar]
  30. Ying, T.; Li, M.; Fan, W.Y. Estimation of C storage of Urban Forests in Harbin city. J. Northeast For. Univ. 2009, 9, 33–35. [Google Scholar]
  31. Zhang, X.M.; Chen, L.; Ji, J.Z.; Wang, J.; Wang, Y.B.; Guo, W.; Lan, B.W. Climate change and its effect in Harbin from 1881 to 2010. J. Meteorol. Environ. 2011, 27, 13–20. [Google Scholar]
  32. Overview of Harbin, People’s Government Portal Website of Harbin City. Available online: http://www.hlj.xinhuanet.com/wq/2011–06/09/c_13919750.htm (assessed on 20 August 2016).
  33. Chang, J. The Study on Investigation of Soil in Urban Green Space and Effects for the Improving in Harbin. Master’s Thesis, Northeast Forestry University, Harbin, China, 2015. [Google Scholar]
  34. He, Y.; Yu, B. Yesterday-Today-Tomorrow: An Overview of Harbin Landscape; Heilongjiang People’s Publishing House: Harbin, China, 2011. [Google Scholar]
  35. Xiao, J.; Shen, Y.; Ge, J.; Tateishi, R.; Tang, C.; Liang, Y.; Huang, Z. Evaluating urban expansion and land use change in Shijiazhuang, China, by using GIS and remote sensing. Landsc. Urban Plan. 2006, 75, 69–80. [Google Scholar] [CrossRef]
  36. He, X.; Liu, C.; Chen, W.; Guan, Z.; Zhao, G. Discussion on urban forest classification. Chin. J. Ecol. 2004, 23, 175–178. [Google Scholar]
  37. Liu, C.; Li, X. Carbon storage and sequestration by urban forests in Shenyang, China. Urban For. Urban Green. 2012, 11, 121–128. [Google Scholar] [CrossRef]
  38. Davies, Z.G.; Edmondson, J.L.; Heinemeyer, A.; Leake, J.R.; Gaston, K.J. Mapping an urban ecosystem service: Quantifying above-ground C storage at a city-wide scale. J. Appl. Ecol. 2011, 48, 1125–1134. [Google Scholar] [CrossRef]
  39. Wang, C.K. Biomass allometric equations for 10 co-occurring tree species in Chinese temperate forests. For. Ecol. Manag. 2006, 222, 9–16. [Google Scholar] [CrossRef]
  40. Nowak, D.J.; Crane, D.E. C storage and sequestration by urban trees in the USA. Environ. Pollut. 2002, 116, 381–389. [Google Scholar] [CrossRef]
  41. Wang, W.W.; Qiu, L.; Zu, Y.G.; Su, D.X.; An, J.; Wang, H.Y.; Zheng, G.Y.; Sun, W.; Chen, X.Q. Changes in soil organic C, nitrogen, pH and bulk density with the development of larch (Larix gmelinii) plantations in China. Glob. Chang. Biol. 2011, 17, 2657–2676. [Google Scholar]
  42. Bao, S. Soil Agro-Chemistrical Analysis; China Agriculture Press: Beijing, China, 2000. [Google Scholar]
  43. Huang, D.C.; Su, Z.M.; Zhang, R.Z.; Koh, L.P. Degree of urbanization influences the persistence of Dorytomus weevils (Coleoptera: Curculionoidae) in Beijing, China. Landsc. Urban Plan. 2010, 96, 163–171. [Google Scholar] [CrossRef]
  44. Chen, T.B.; Zheng, Y.M.; Lei, M.; Huang, Z.C.; Wu, H.T.; Chen, H.; Fan, K.K.; Yu, K.; Wu, X.; Tian, Q.Z. Assessment of heavy metal pollution in surface soils of urban parks in Beijing, China. Chemosphere 2005, 60, 542–551. [Google Scholar] [CrossRef] [PubMed]
  45. Zhang, Q.Z. Carbon Density and Carbon Sequestration Capacity of Six Temperate Forests in Northeast China. Master’ Thesis, Northeast Forestry University, Harbin, China, 2010. [Google Scholar]
  46. Wang, Q.B.; Duan, Y.Q.; Wei, Z.Y. Spatial variability of urban soil organic C in Shenyang. Chin. J. Soil Sci. 2009, 40, 252–257. [Google Scholar]
  47. Wang, Y.; Li, C.Y.; Li, C.L.; Han, Y.N.; Li, Y.; Zhang, J.J. Preliminary Study on the Quantitative Characteristics of Organic C in Soils under Different Land Use Patterns in Changchun City. J. Jilin Agric. Univ. 2011, 33, 51–56. [Google Scholar]
  48. Wang, W.J.; Wang, H.M.; Zu, Y.G. Temporal changes in SOM, N, P, K, and their stoichiometric ratios during reforestation in China and interactions with soil depths: Importance of deep-layer soil and management implications. For. Ecol. Manag. 2014, 325, 8–17. [Google Scholar] [CrossRef]
  49. Wang, W.J.; Su, D.X.; Qiu, L.; Wang, H.M.; An, J.; Zheng, G.; Zu, Y. Concurrent changes in soil inorganic and organic carbon during the development of larch, Larix gmelinii, plantations and their effects on soil physicochemical properties. Environ. Earth Sci. 2013, 69, 1559–1570. [Google Scholar] [CrossRef]
  50. DeFries, R.S.; Rudel, T.; Uriarte, M.; Hansen, M. Deforestation driven by urban population growth and agricultural trade in the twenty-first century. Nat. Geosci. 2010, 3, 178–181. [Google Scholar] [CrossRef]
  51. Nielsen, A.B.; Jensen, R.B. Some visual aspects of planting design and silviculture across contemporary forest management paradigms–perspectives for urban afforestation. Urban For. Urban Green. 2007, 6, 143–158. [Google Scholar] [CrossRef]
  52. Let City Embrace Forest, Working Hard to Build a Forest City in Our Country. Available online: http://www.gov.cn/xinwen/2015–11/24/content_2971646.htm (accessed on 24 Novermber 2015).
  53. Groffman, P.M.; Pouyat, R.V.; McDonnell, M.J.; Pickett, S.T.; Zipperer, W.C. Carbon pools and trace gas fluxes in urban forest soils. In Advances in Soil Science: Soil Management and Greenhouse Effect; CRC Press, Inc.: Boca Raton, FL, USA, 1995; pp. 147–158. [Google Scholar]
  54. Carreiro, M.M.; Howe, K.; Parkhurst, D.F.; Pouyat, R.V. Variation in quality and decomposability of red oak leaf litter along an urban-rural gradient. Biol. Fertil. Soils 1999, 30, 258–268. [Google Scholar] [CrossRef]
  55. Davidson, E.A.; Janssens, I.A. Temperature sensitivity of soil C decomposition and feedbacks to climate change. Nature 2006, 440, 165–173. [Google Scholar] [CrossRef] [PubMed]
  56. Ma, Y.A. Study on the bimass of Chinese Pine forests. J. Beijing For. Univ. 1989, 11, 1–10. [Google Scholar]
  57. Chen, C.; Guo, X. Research on biomass of broad-leaved Korean pine forest. For. Investig. Des. 1984, 10–19. [Google Scholar]
  58. Zou, C.; Pu, J.; Xu, W. Biomass and productivity of Pinus sylvestrif ormis plantation. Chin. J. Appl. Ecol. 1995, 6, 123–127. [Google Scholar]
  59. Jia, W.; Jiang, S.; Li, F.R. Biomass of Single Tree of Pinus sylvestris var. mongolica in Eastern Heilongjiang. J. Liaoning For. Sci. Technol. 2008. [Google Scholar] [CrossRef]
  60. Chang, X.X.; Che, K.J.; Song, C.F.; Li, B.X. Biomass and Nutrient Element Accumulation of Sabina prez ewalskii Foret Community. J. Northwest For. Coll. 1997, 12, 24–29. [Google Scholar]
  61. Li, X. Biomass Allometry and Allocation of Common Understory in a Natural Secondary Forest in Maoershan, Northeast China. Master’s Thesis, Notheast Forestry University, Harbin, China, 2010. [Google Scholar]
  62. Wu, F. Appraisal of Carbon Storage in Urban Forest Patches and Its Distribution Pattern in Maanshan City, Master’s Thesis, Anhui Agricultural University, Hefei, China, 2012. [Google Scholar]
  63. Kuang, W.H.; Zhang, S.W.; Zhang, Y.Z.; Sheng, Y. Analysis of Urban Land Utilization Spatial Expansion Mechanism in Changchun City since 1900. Acta Geogr. Sin. 2005, 60, 841–850. [Google Scholar]
  64. Sun, Y.; Liu, Z.; Wang, Q.B.; Liu, H.B. Spatial Structure Evolution of Urban Land Use in Shenyang during 1910–2010. Prog. Geogr. 2012, 31, 1204–1211. [Google Scholar]
Figure 1. Location of the study area showing Harbin City in northeastern China, and the distribution of sampling plots in the Harbin City region.
Forests 07 00200 g001
Figure 2. Differences in tree C stock density, basal area, and diameter at breast height (DBH) (left), plus differences in soil organic carbon (SOC) density, SOC content, and soil bulk density (right) among different forest types in Harbin City. Note: AF, affiliated forest; RF, roadside forest; LF, landscape and relaxation forest; EF, ecological public welfare forest. Error bars showed standard deviation, and lowercase letters (a and b) indicate significant differences (p < 0.05) based on the one-way ANOVA test statistics. The same letters (a and a, ab) indicate no significant differences, and different letters (a and b) indicate significant differences.
Forests 07 00200 g002
Figure 3. Differences in tree C stock density, basal area, and diameter at breast height (DBH) (left), plus differences in soil organic carbon (SOC) density, SOC content, and soil bulk density (right) across ring-road-based urban-rural gradients in Harbin City. The same letters (e.g., a and a, ab) indicate no significant differences, and different letters (e.g., a and b, or b and c) indicate significant differences (p < 0.05) based on the one-way ANOVA test statistics.
Forests 07 00200 g003
Figure 4. Differences in tree C stock density, basal area, and diameter at breast height (DBH) (left), plus differences in soil organic carbon (SOC) density, SOC content, and soil bulk density (right) across the history of urban settlement time-based urban-rural gradients in Harbin City. The same letters (e.g., a and a, ab) indicate no significant differences, and different letters (e.g., a and b, or b and c) indicate significant differences (p < 0.05) based on the one-way ANOVA test statistics.
Forests 07 00200 g004
Figure 5. Tree biomass differences in tree C stock density, basal area, and diameter at breast height (DBH) (left), plus differences in soil organic carbon (SOC) density, SOC content, and soil bulk density (right) among different administrative districts in Harbin City. Note: DL, Daoli District; DW, Daowai District; NG, Nangang District; SB, Songbei District; XF, Xiangfang District. The same letters (e.g., a and a, a and ab) indicate no significant differences, and different letters (e.g., a and b, or b and c) indicate significant differences (p < 0.05) based on the one-way ANOVA test statistics.
Forests 07 00200 g005
Figure 6. Variation in the spatial distribution of urban forest in Harbin City with respect to tree C stock density, basal area, and diameter at breast height (DBH) (left), plus variation in the spatial distribution of soil organic carbon (SOC) density, SOC content, and soil bulk density (right). Note: AF, affiliated forest; RF, roadside forest; LF, landscape and relaxation forest; EF, ecological public welfare forest. Label colors represent urban forest types, while label size represents the value range of each parameter.
Forests 07 00200 g006
Table 1. Urban forest classification based on urban settlement time and ring roads in Harbin City.
Urban Forest ClassificationClassified RegionsDescriptionUrban-Rural Gradients
Ring road region (fast road or express way)FirstWithin 1st ring roadUrban
SecondDistribute between 1st ring and 2nd ring road Forests 07 00200 i001
ThirdDistribute between 2nd ring and 3rd ring road
ForthDistribute between 3rd ring and 4th ring road
OutsideOutside of forth ring roadRural
Urban settlement time (history of settlements)100-yearUrban area constructed before 1906Urban
80-yearurban area constructed between 1933 and 1907 Forests 07 00200 i002
70-yearurban area constructed between 1945 and 1934
50-yearurban area constructed between 1962 and 1946
10-yearurban area constructed between 2005 and 1963
0-yearurban area constructed during 2006 and 2014Rural
Note: the black arrows represent the urbanization degree from high to low.
Table 2. Tree C stock density, soil organic carbon (SOC) density, SOC content, and soil bulk density in Harbin City compared with other cities and local natural forests.
CityTree C Stocks kg·m−2SOC Density kg·m−2SOC Content g·kg−1Soil Bulk Density g·cm3Soil Depth cmCitations
Beijing3.19--------Tang et al., 2005 [4]
Xiamen2.08--------Ren et al., 2012 [6]
Hangzhou3.03--------Zhao et al., 2010 [7]
Los Angeles, Sacramento0.82; 1.54--------McPherson et al., 2013 [8]
Other cities in US3.14–14.141.5–16.3------Nowak et al., 2013 [2]; Pouyat et al., 2006 [16]
Shenyang3.32--19.29--20Liu and Li, 2012 [37]; Wang et al., 2009 [46]
Changchun4.41--22--20Zhang et al., 2015 [14]; Wang et al., 2011 [47]
Local natural forest10.547.5233.421.08>20Zhang, 2010 [45]; Wang et al., 2014 [48], Wang et al., 2013 [49]
Harbin7.715.4819.981.3820This research
-- means no data.
Table 3. Urban forest tree diameter distribution in major cities in northeastern China.
City<7.67.6–15.215.3–30.5>30.6Citations
Shenyang50%32%15%3%Liu and Li, 2012 [37]
Changchun18.14%48.94%26.07%6.85%Zhang et al., 2015 [14]
Harbin18.26%36.99%30.86%13.89%This research

