
Response of Mid-Rotation Loblolly Pine (Pinus taeda L.) Physiology and Productivity to Sustained, Moderate Drought on the Western Edge of the Range

Abstract
:1. Introduction
2. Materials and Methods
2.1. Study Site
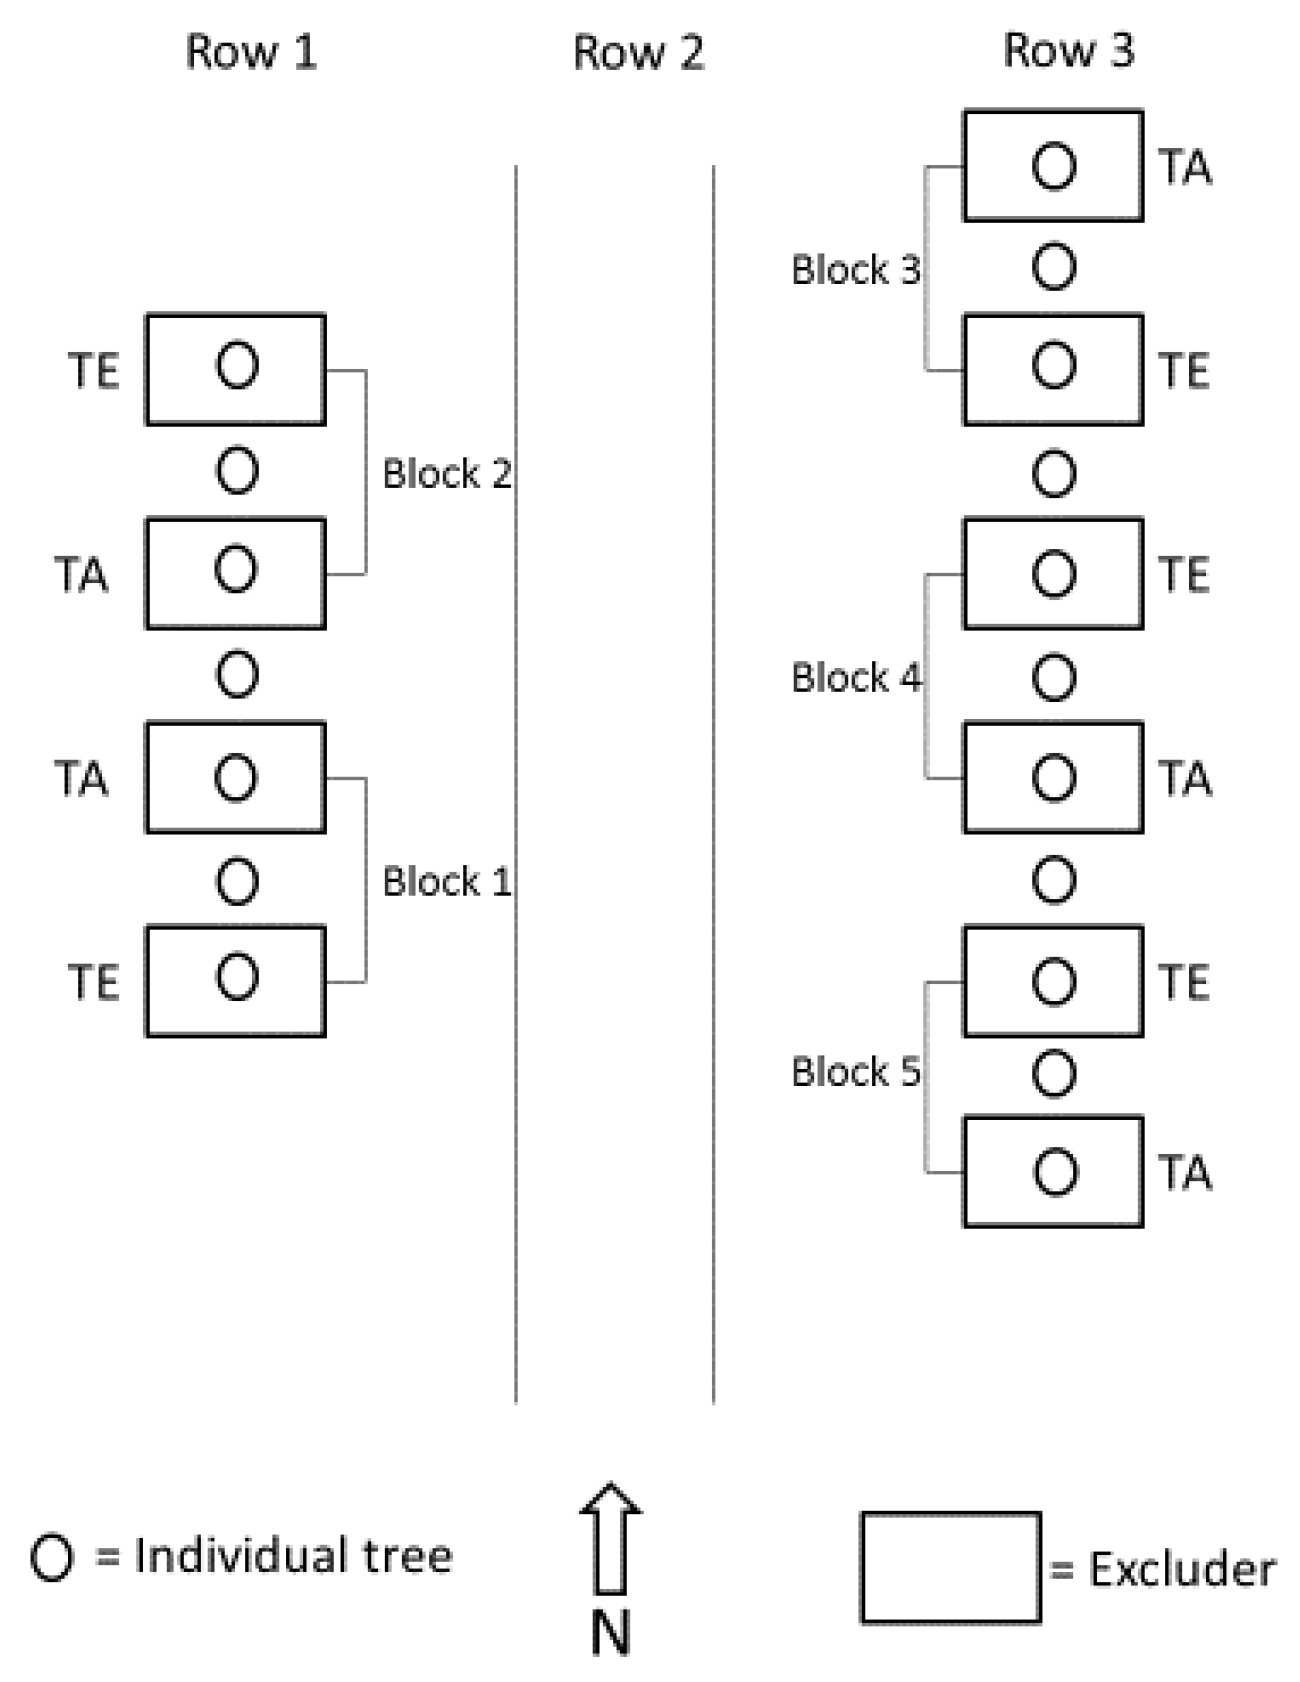
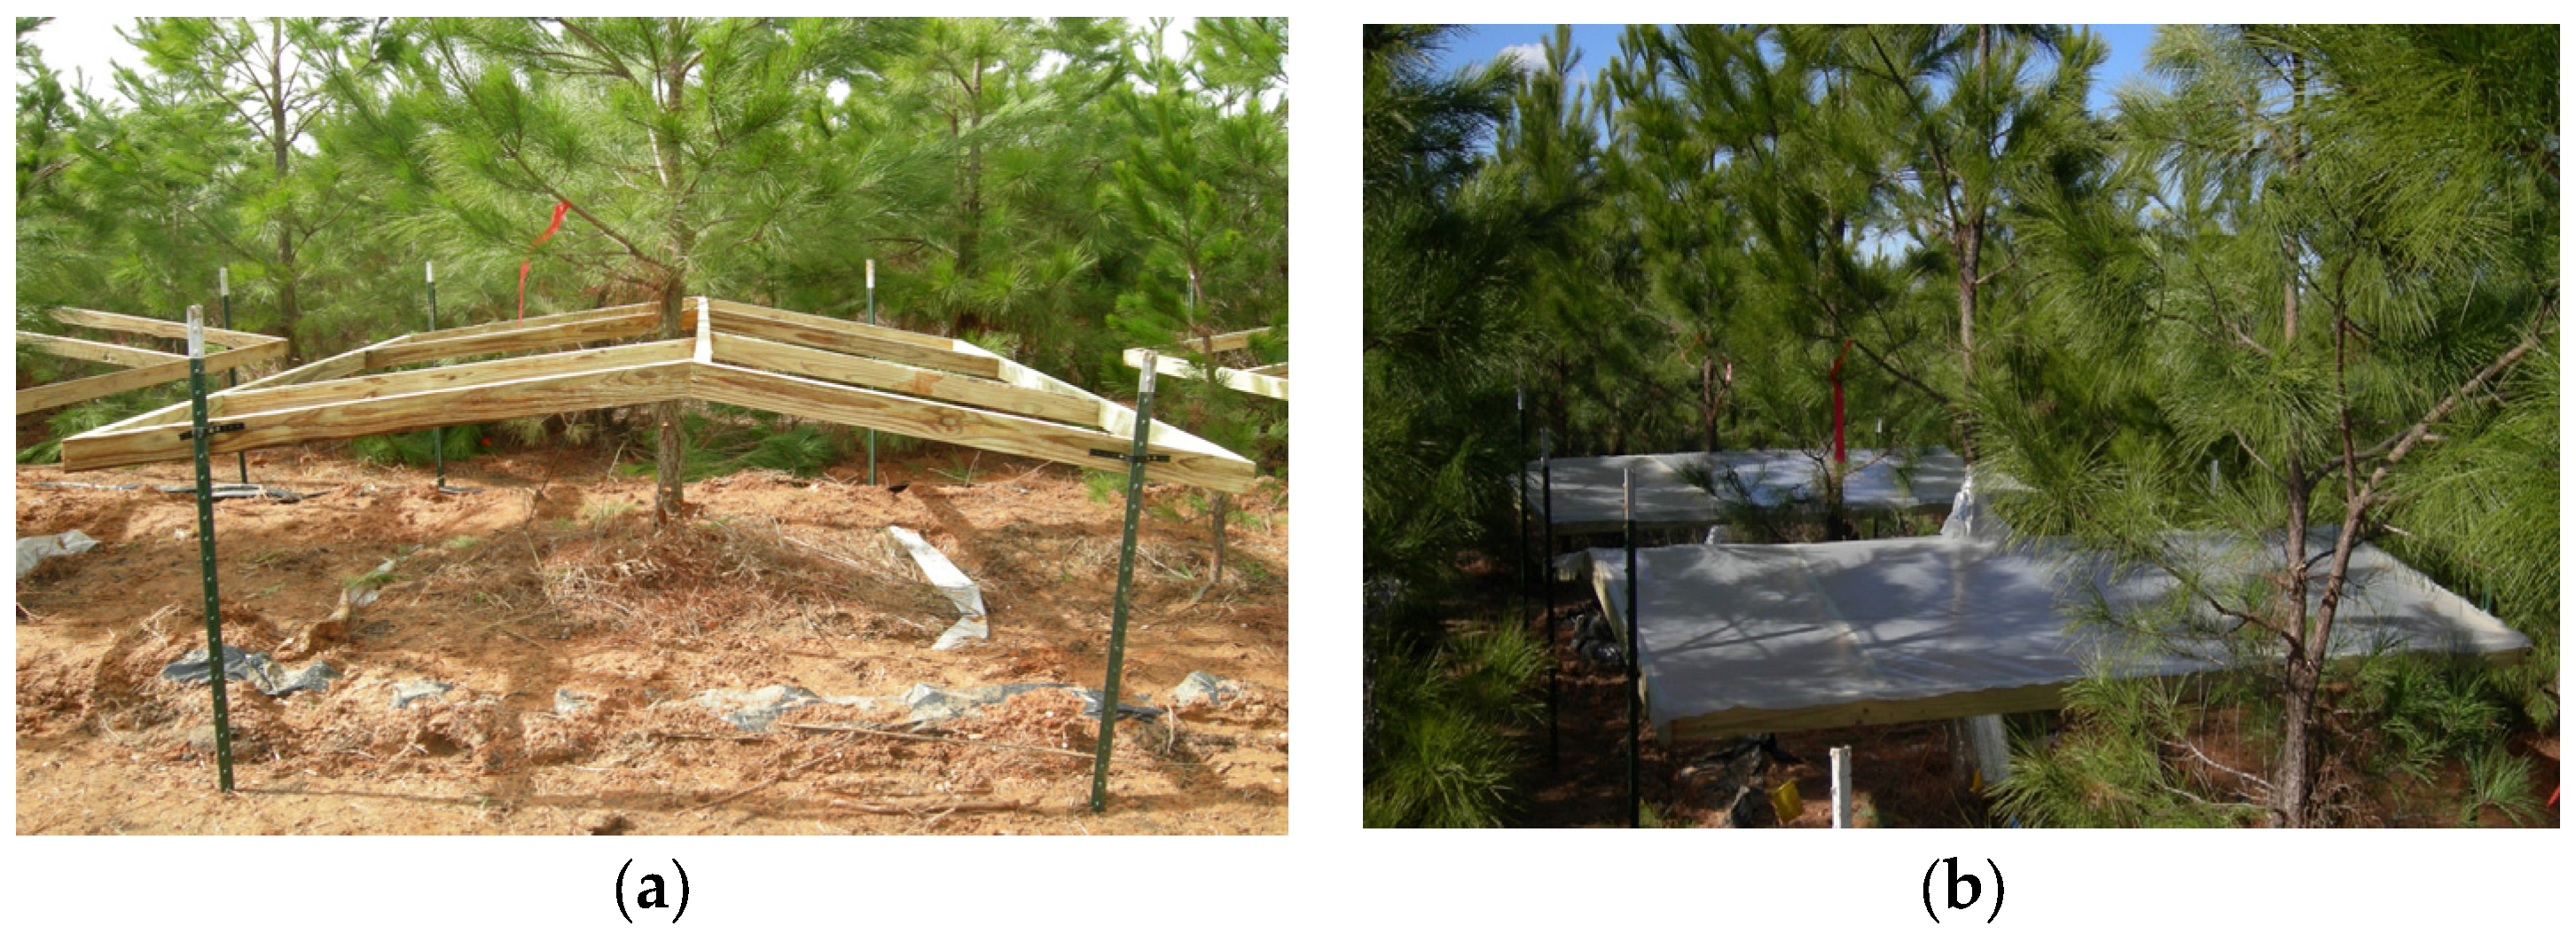
2.2. Experimental Design
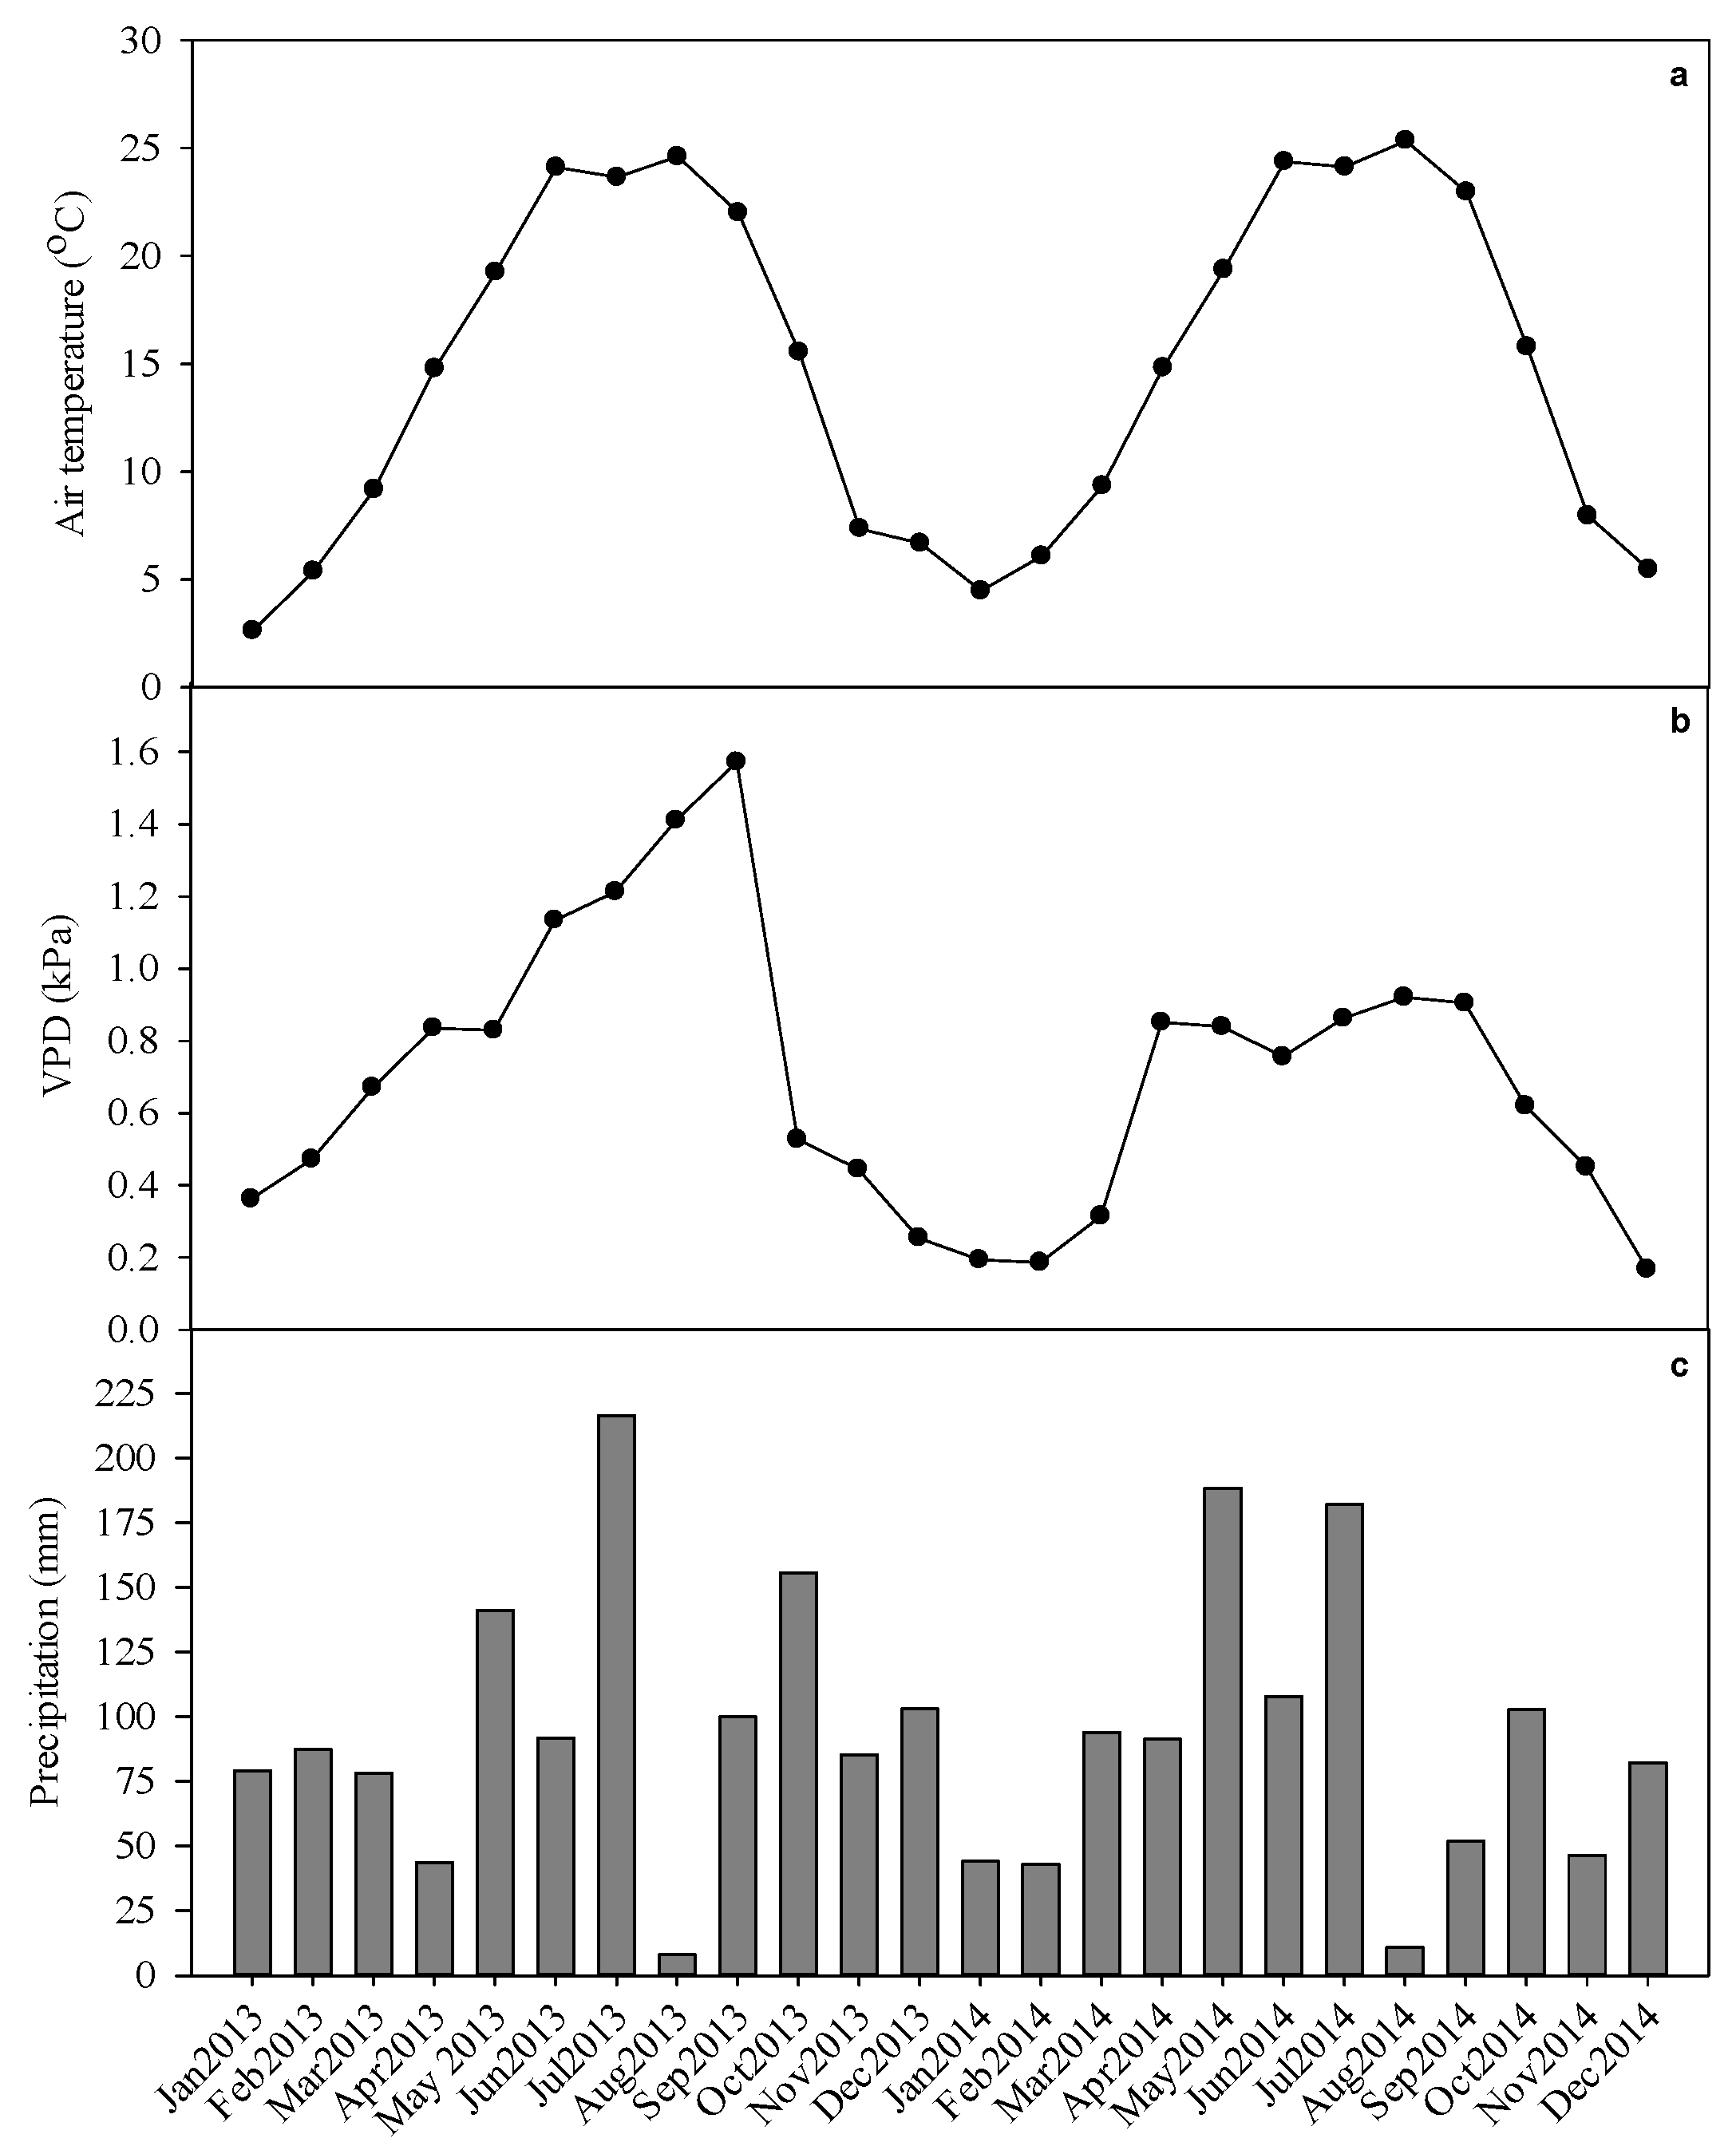
2.3. Environmental Variables
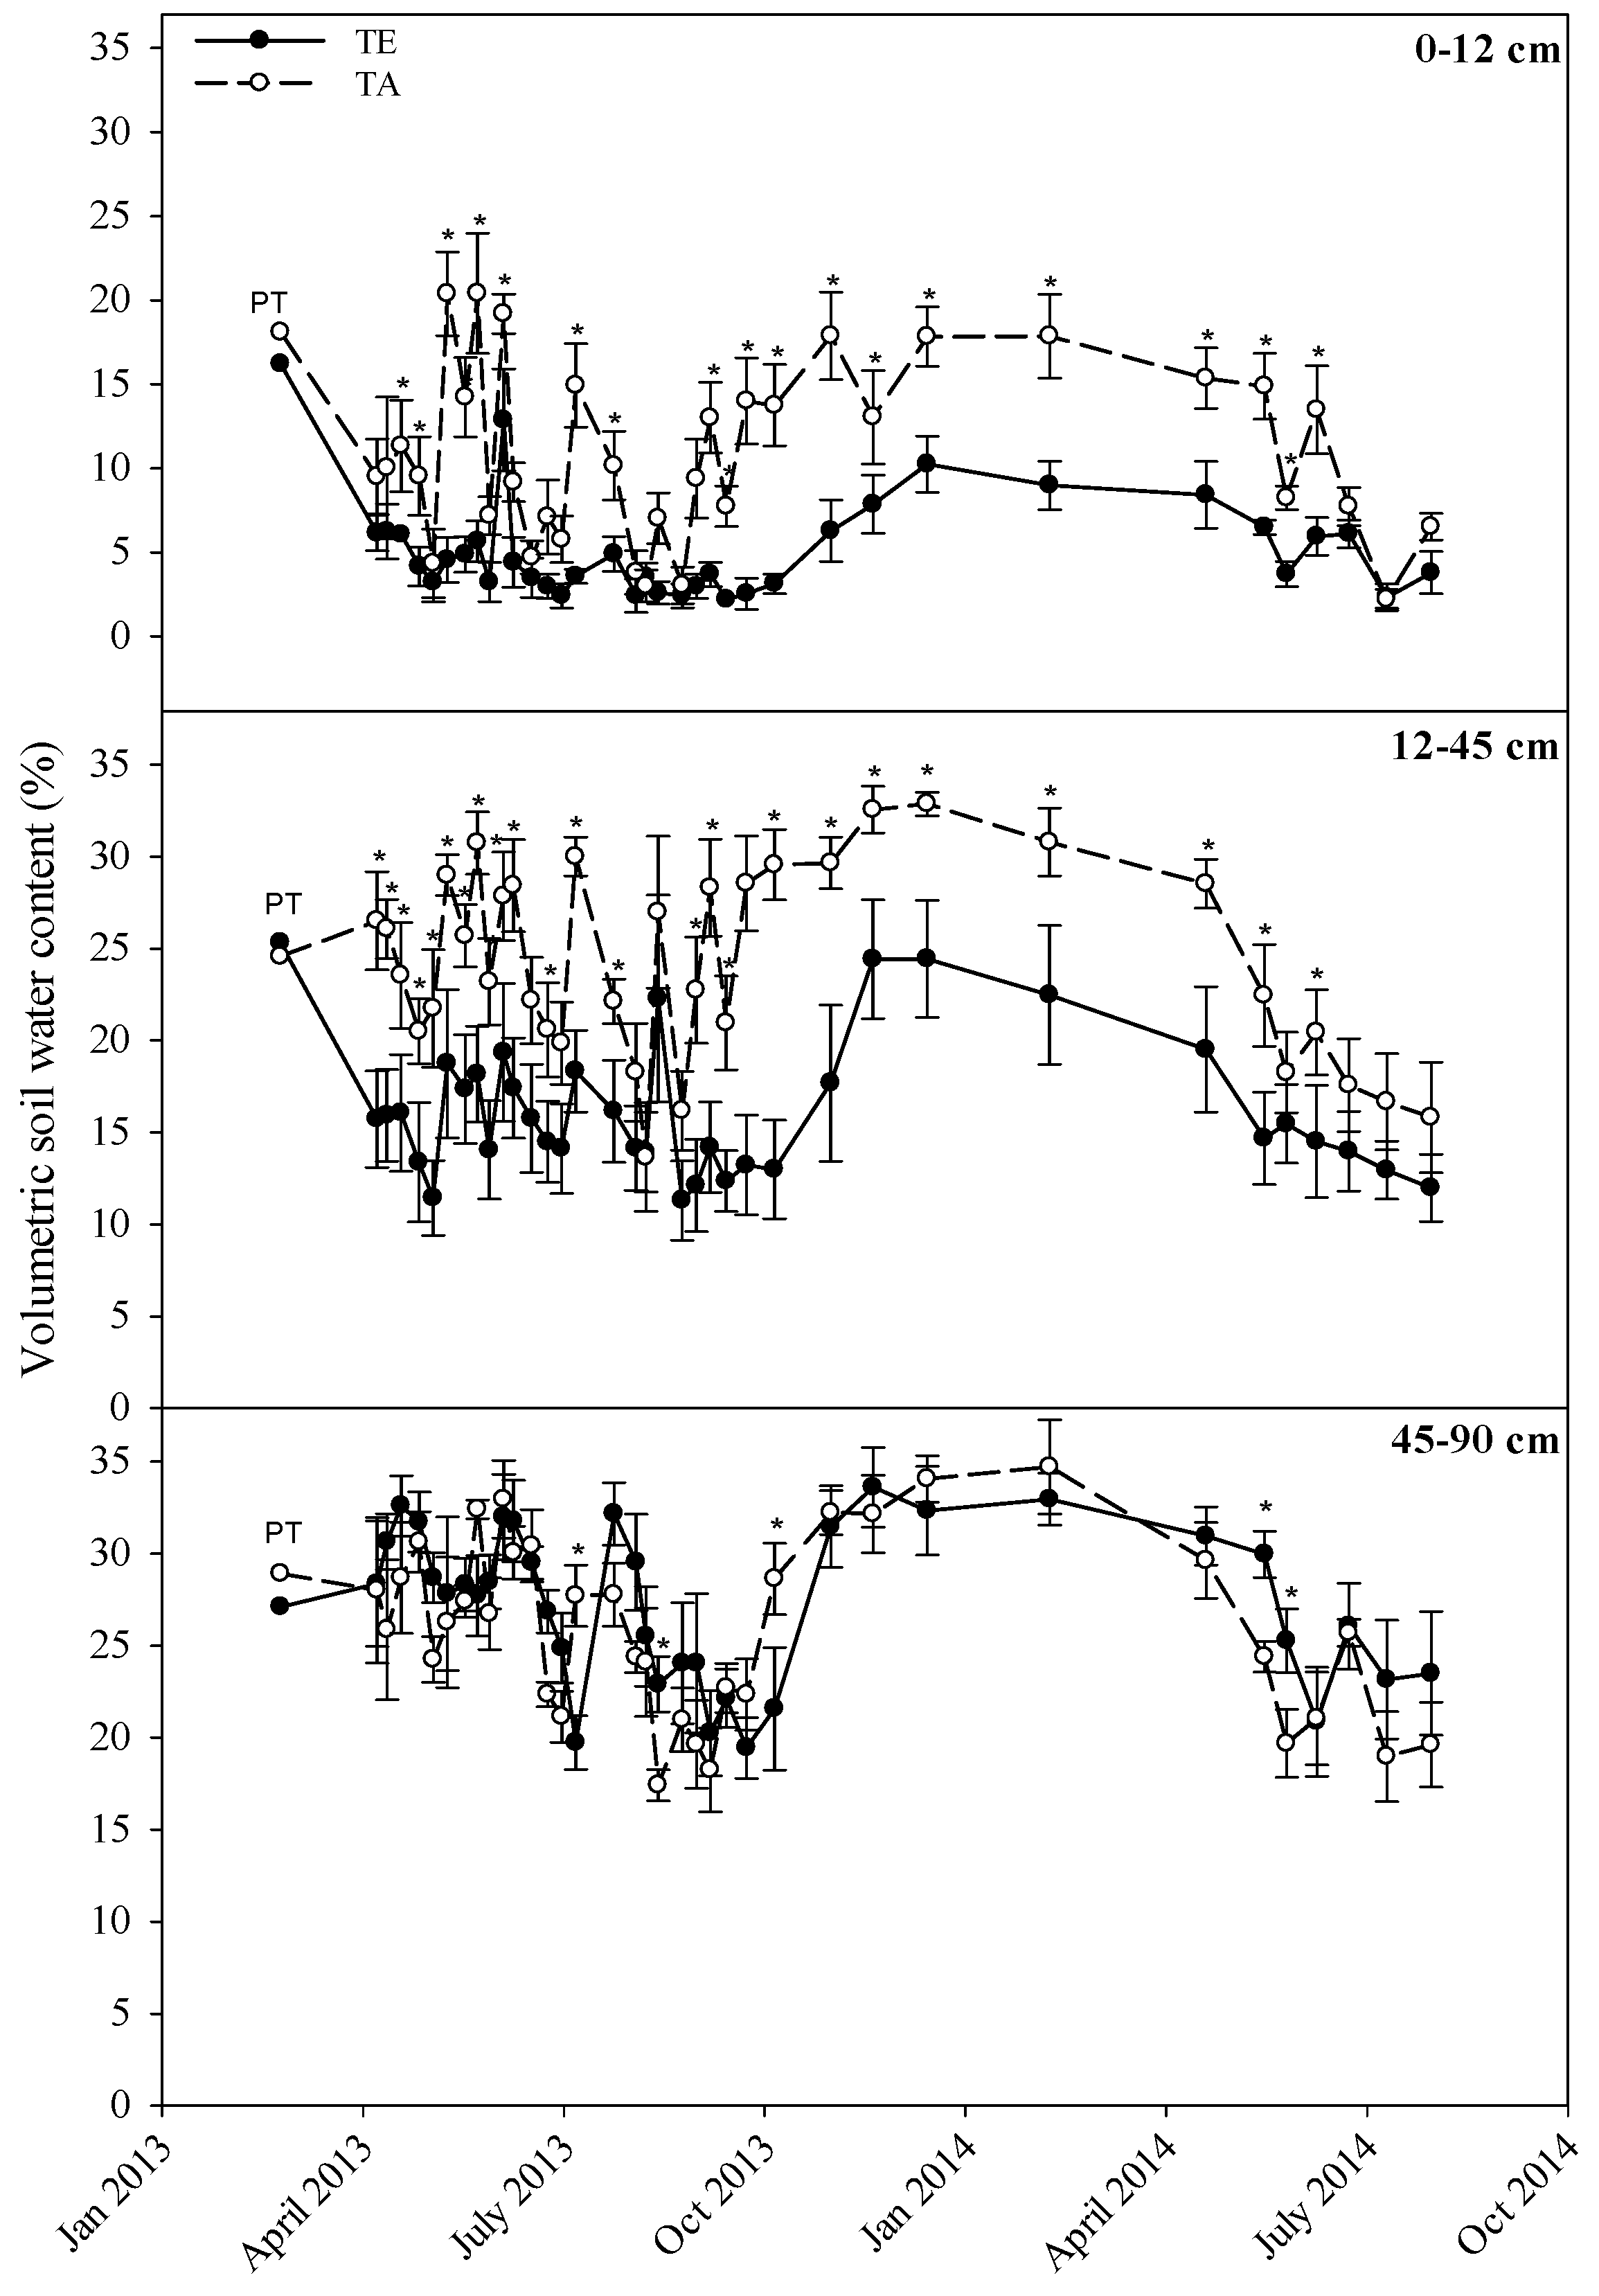
2.4. Volumetric Soil Water Content
2.5. Physiology
2.6. Peak Foliage Mass
2.7. Growth
2.8. Water Use
2.9. Statistical Analysis
3. Results
3.1. Environmental Variables
3.2. Volumetric Soil Water Content
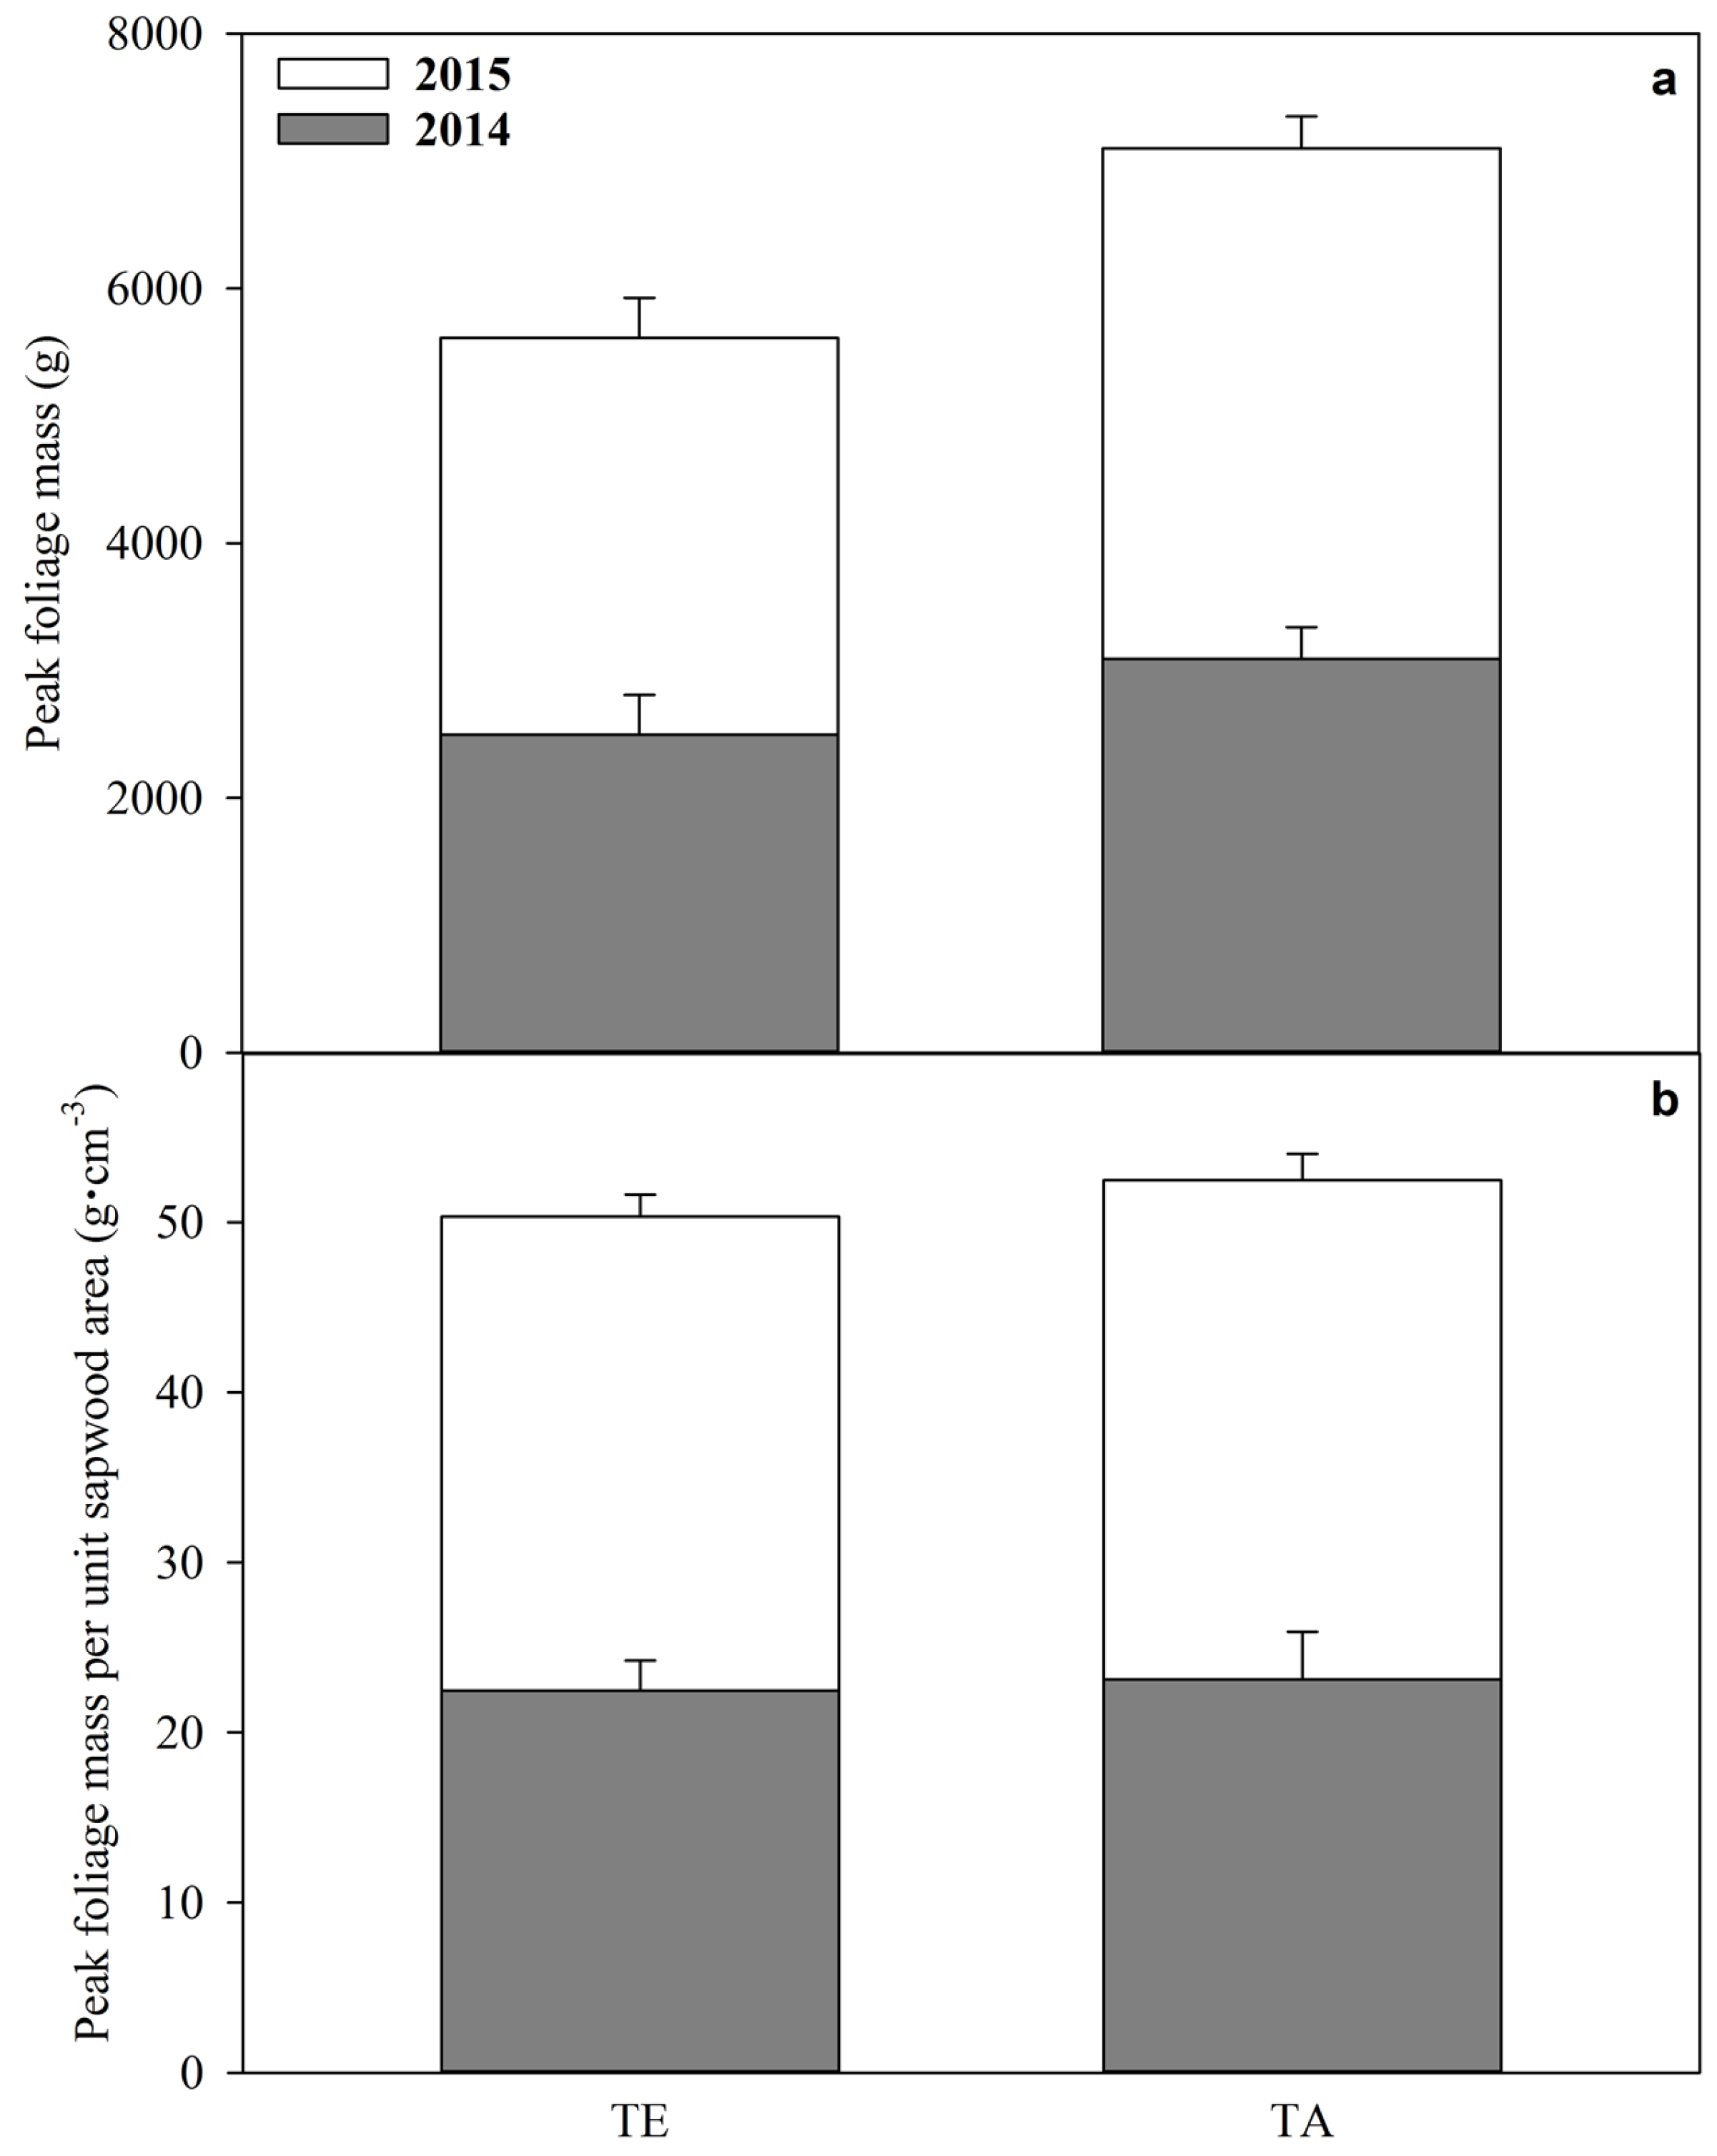
3.3. Peak Foliage Mass
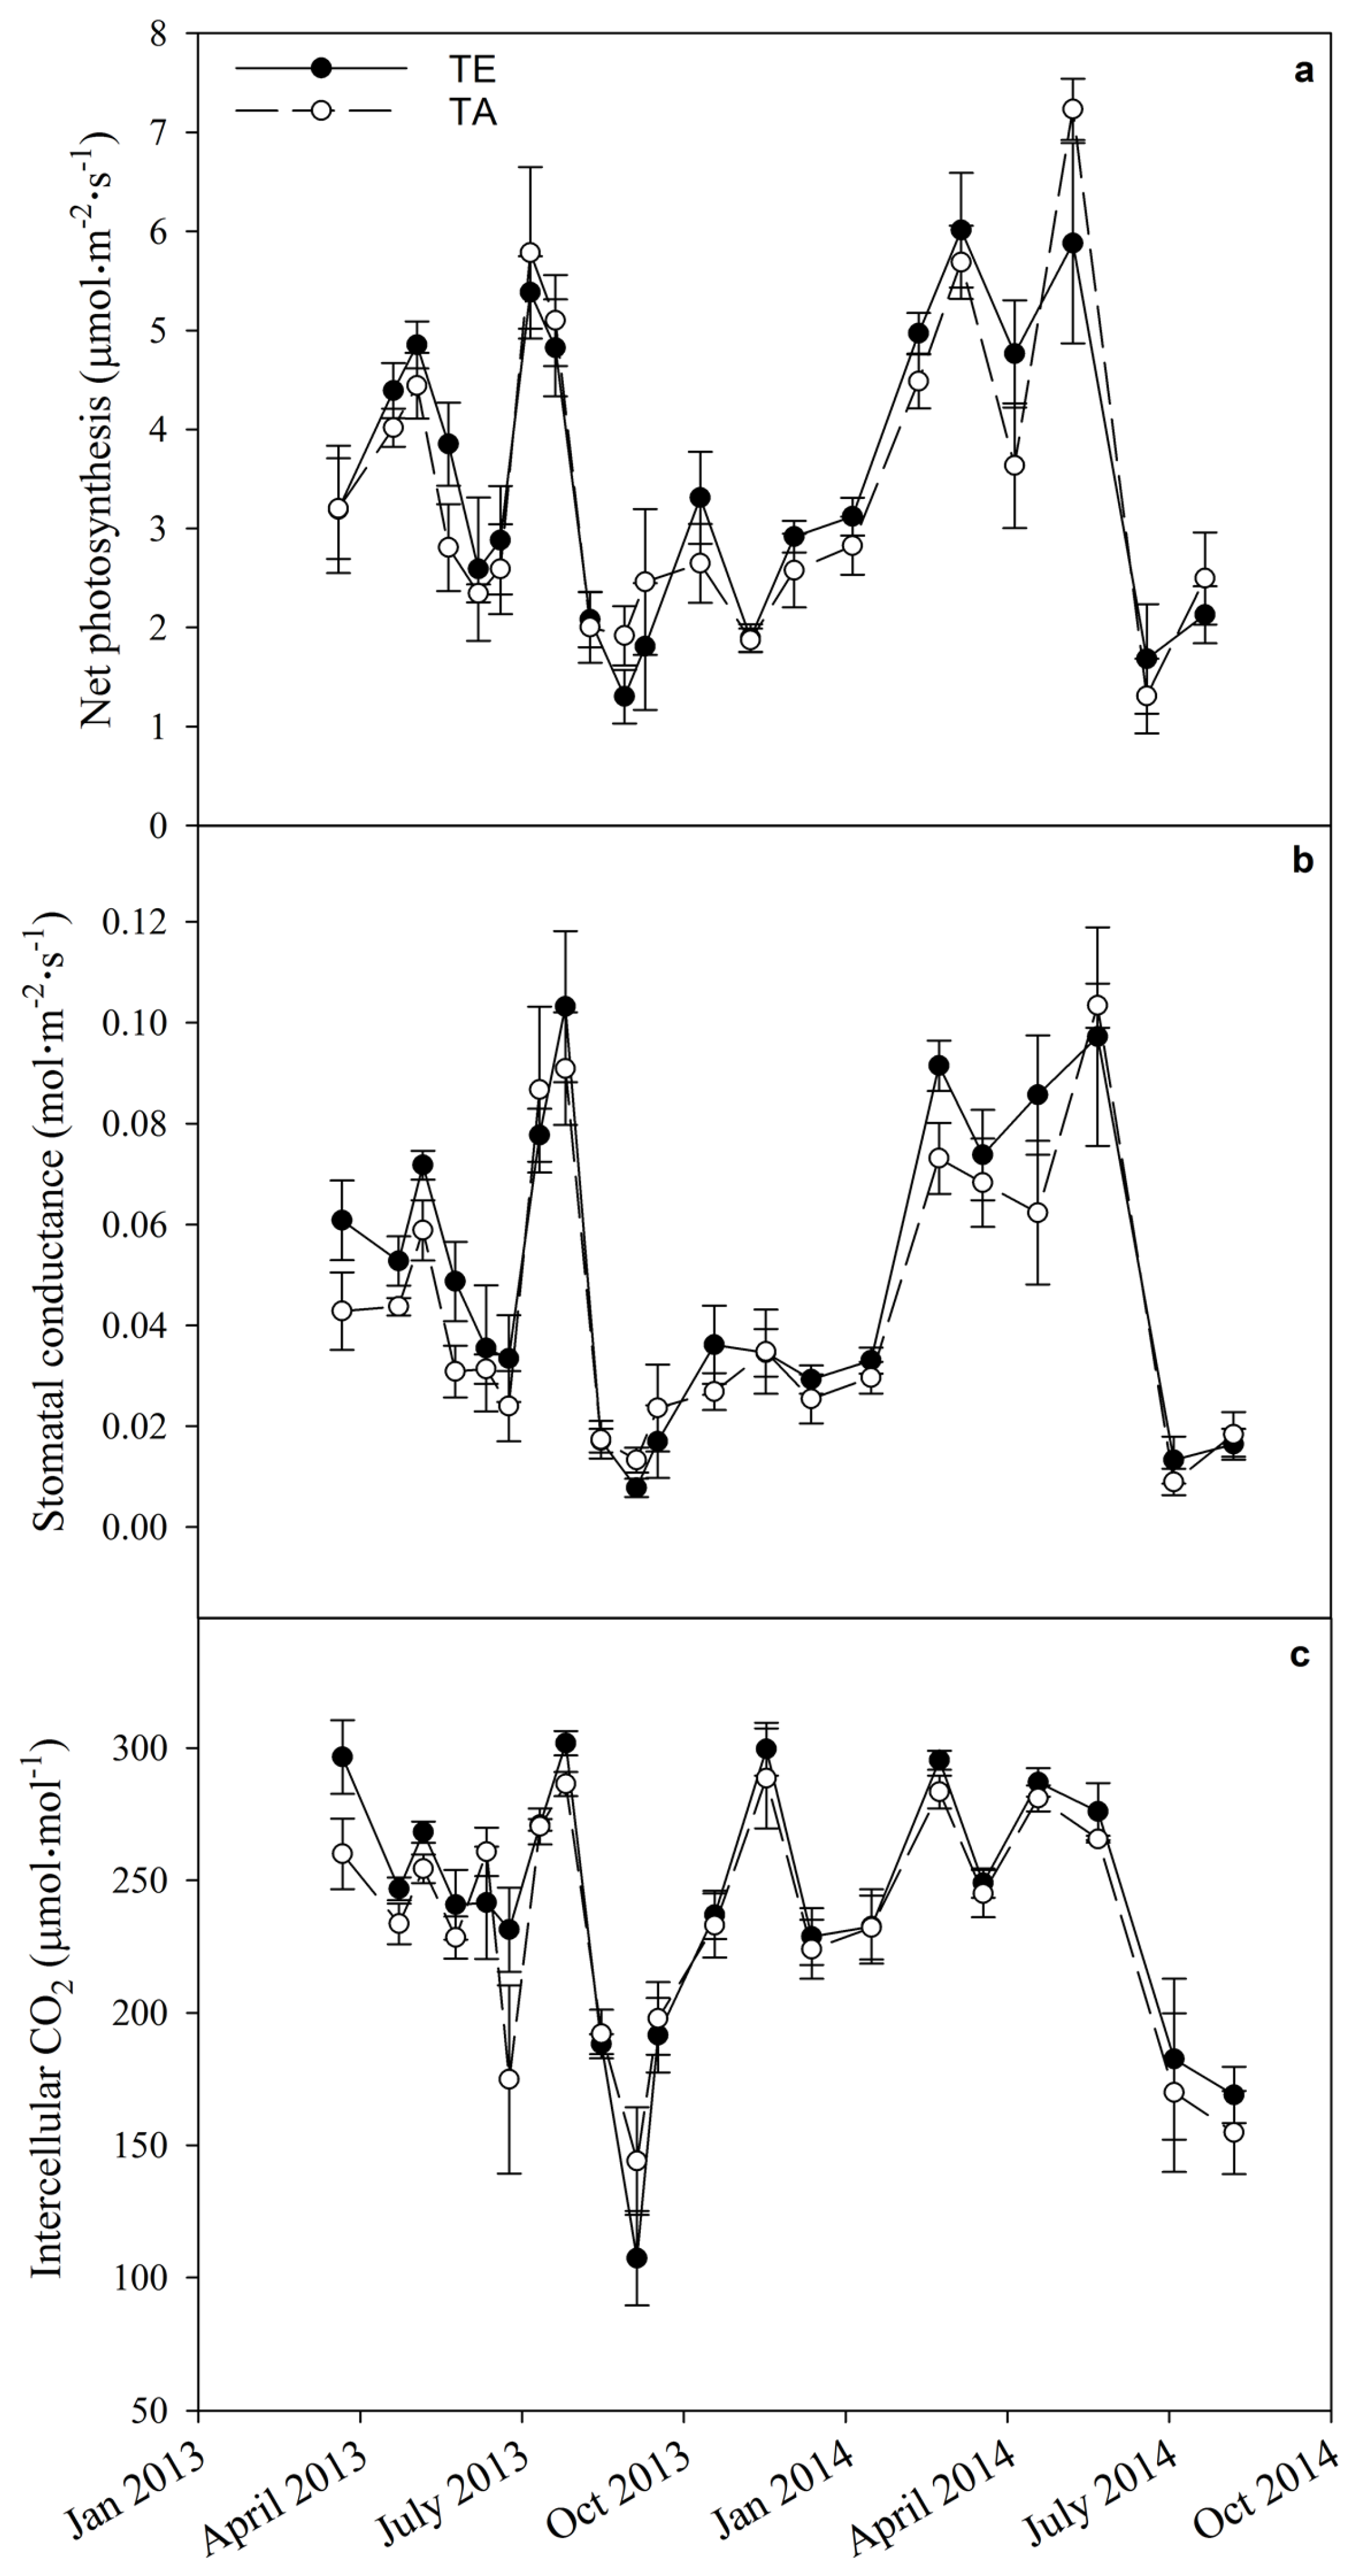
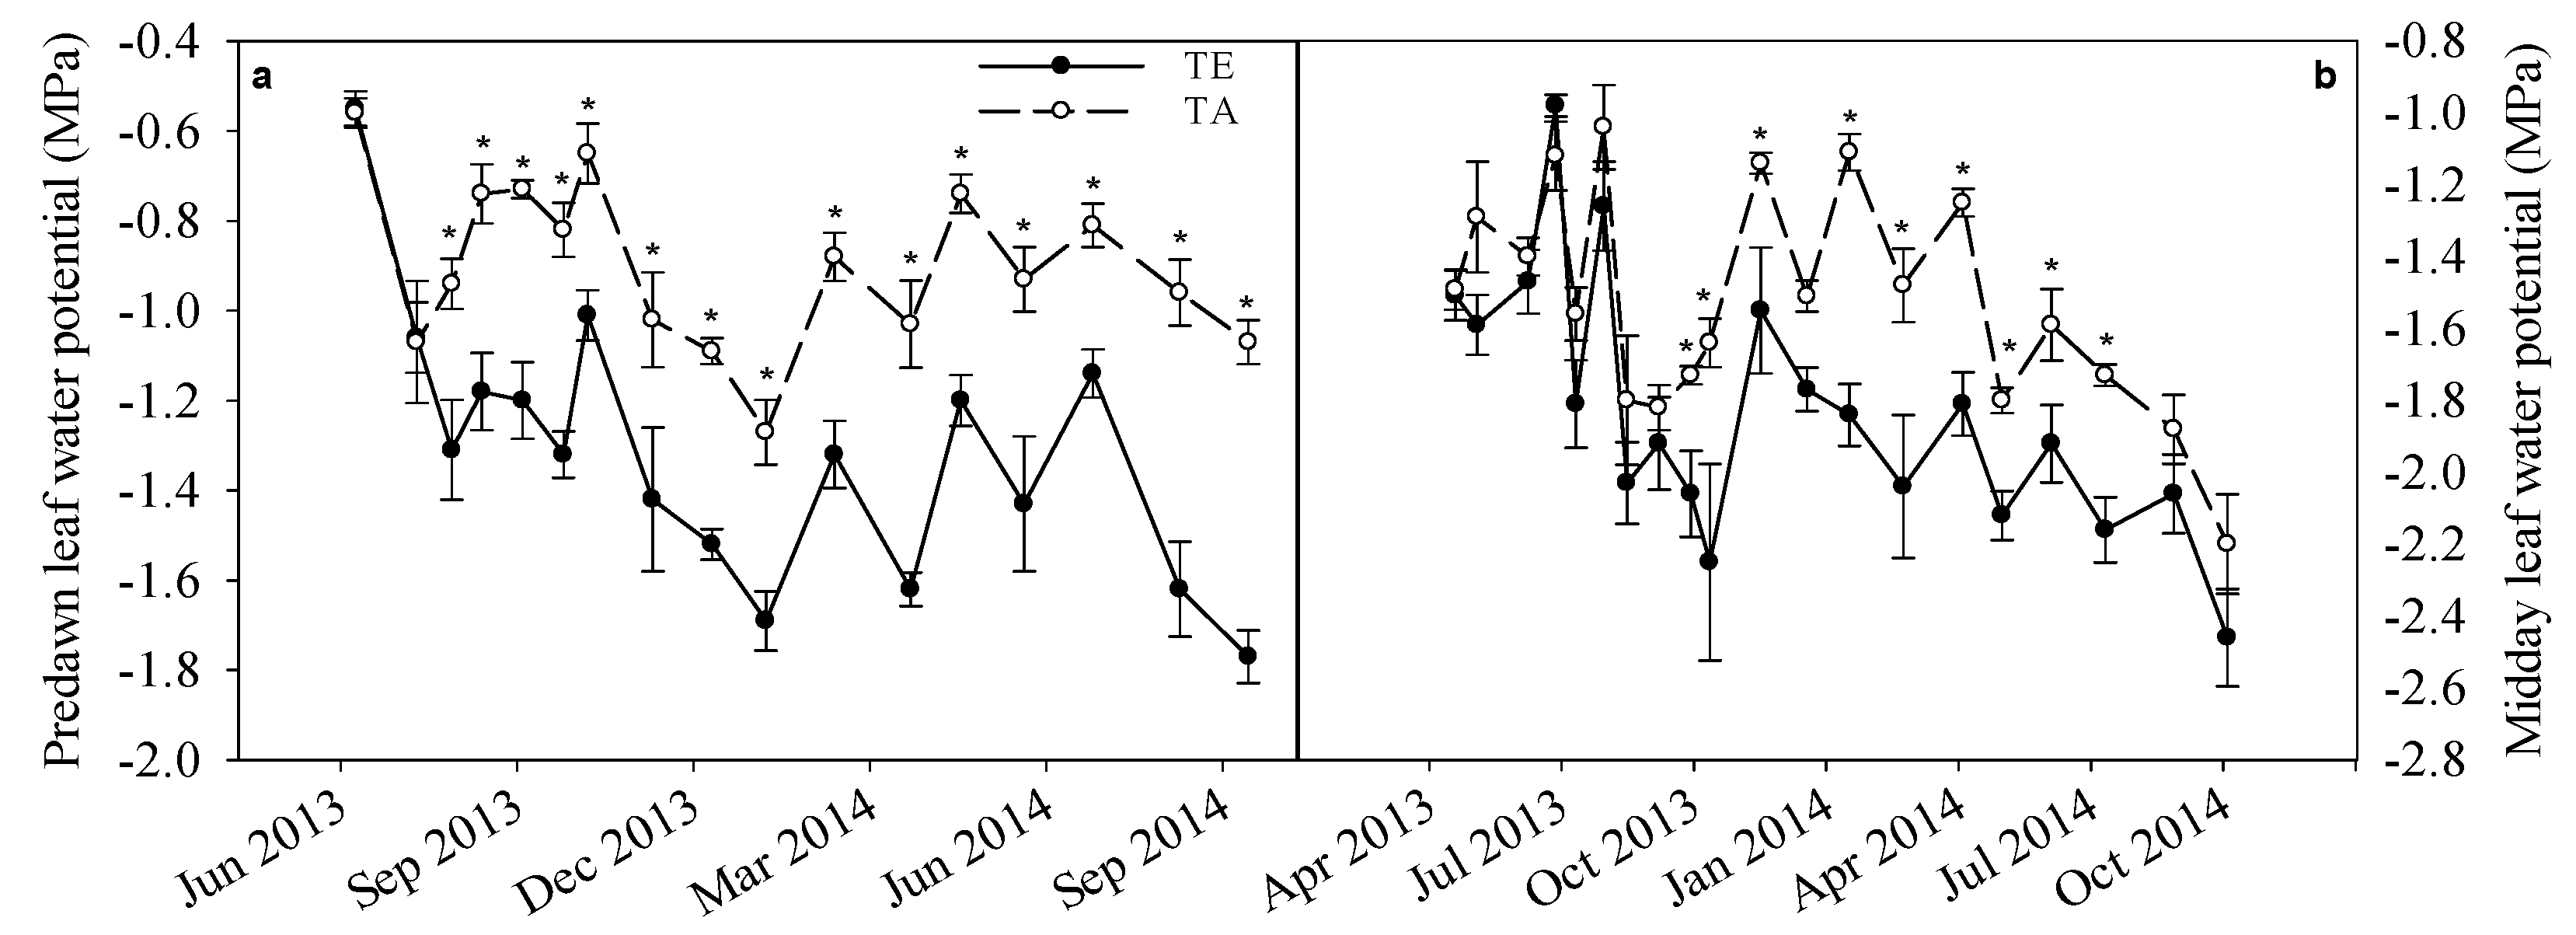
3.4. Physiology
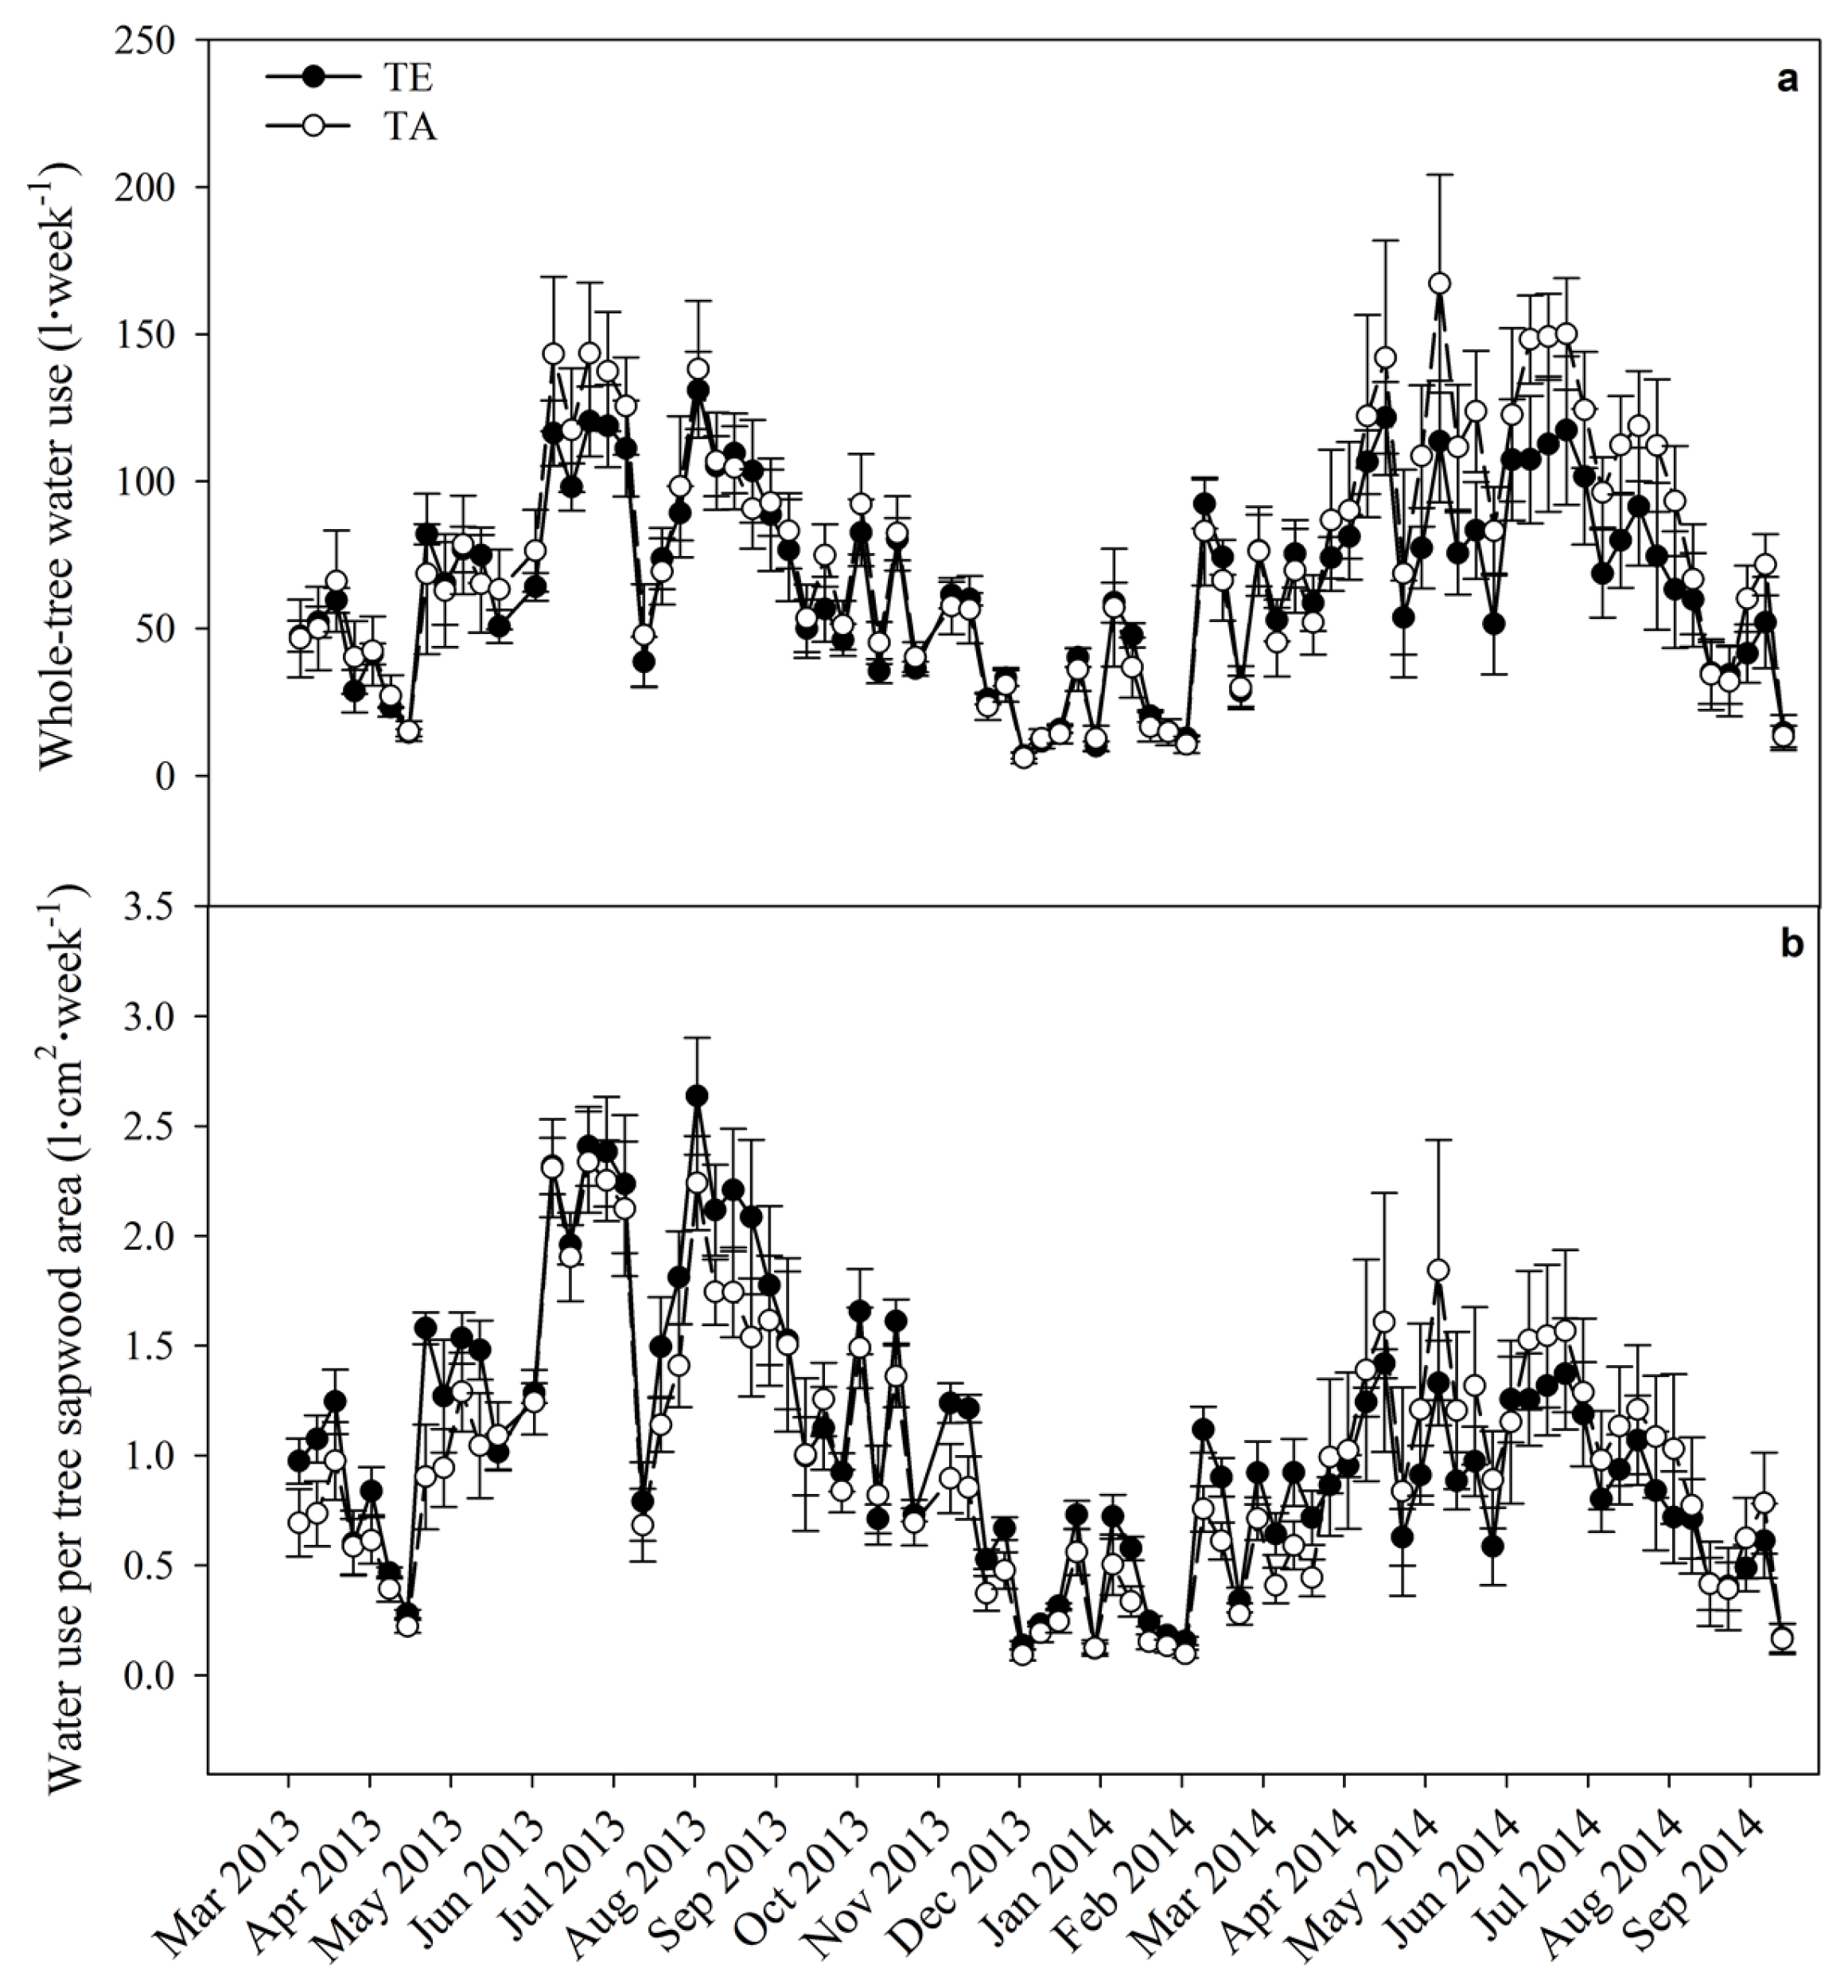
3.5. Water Use
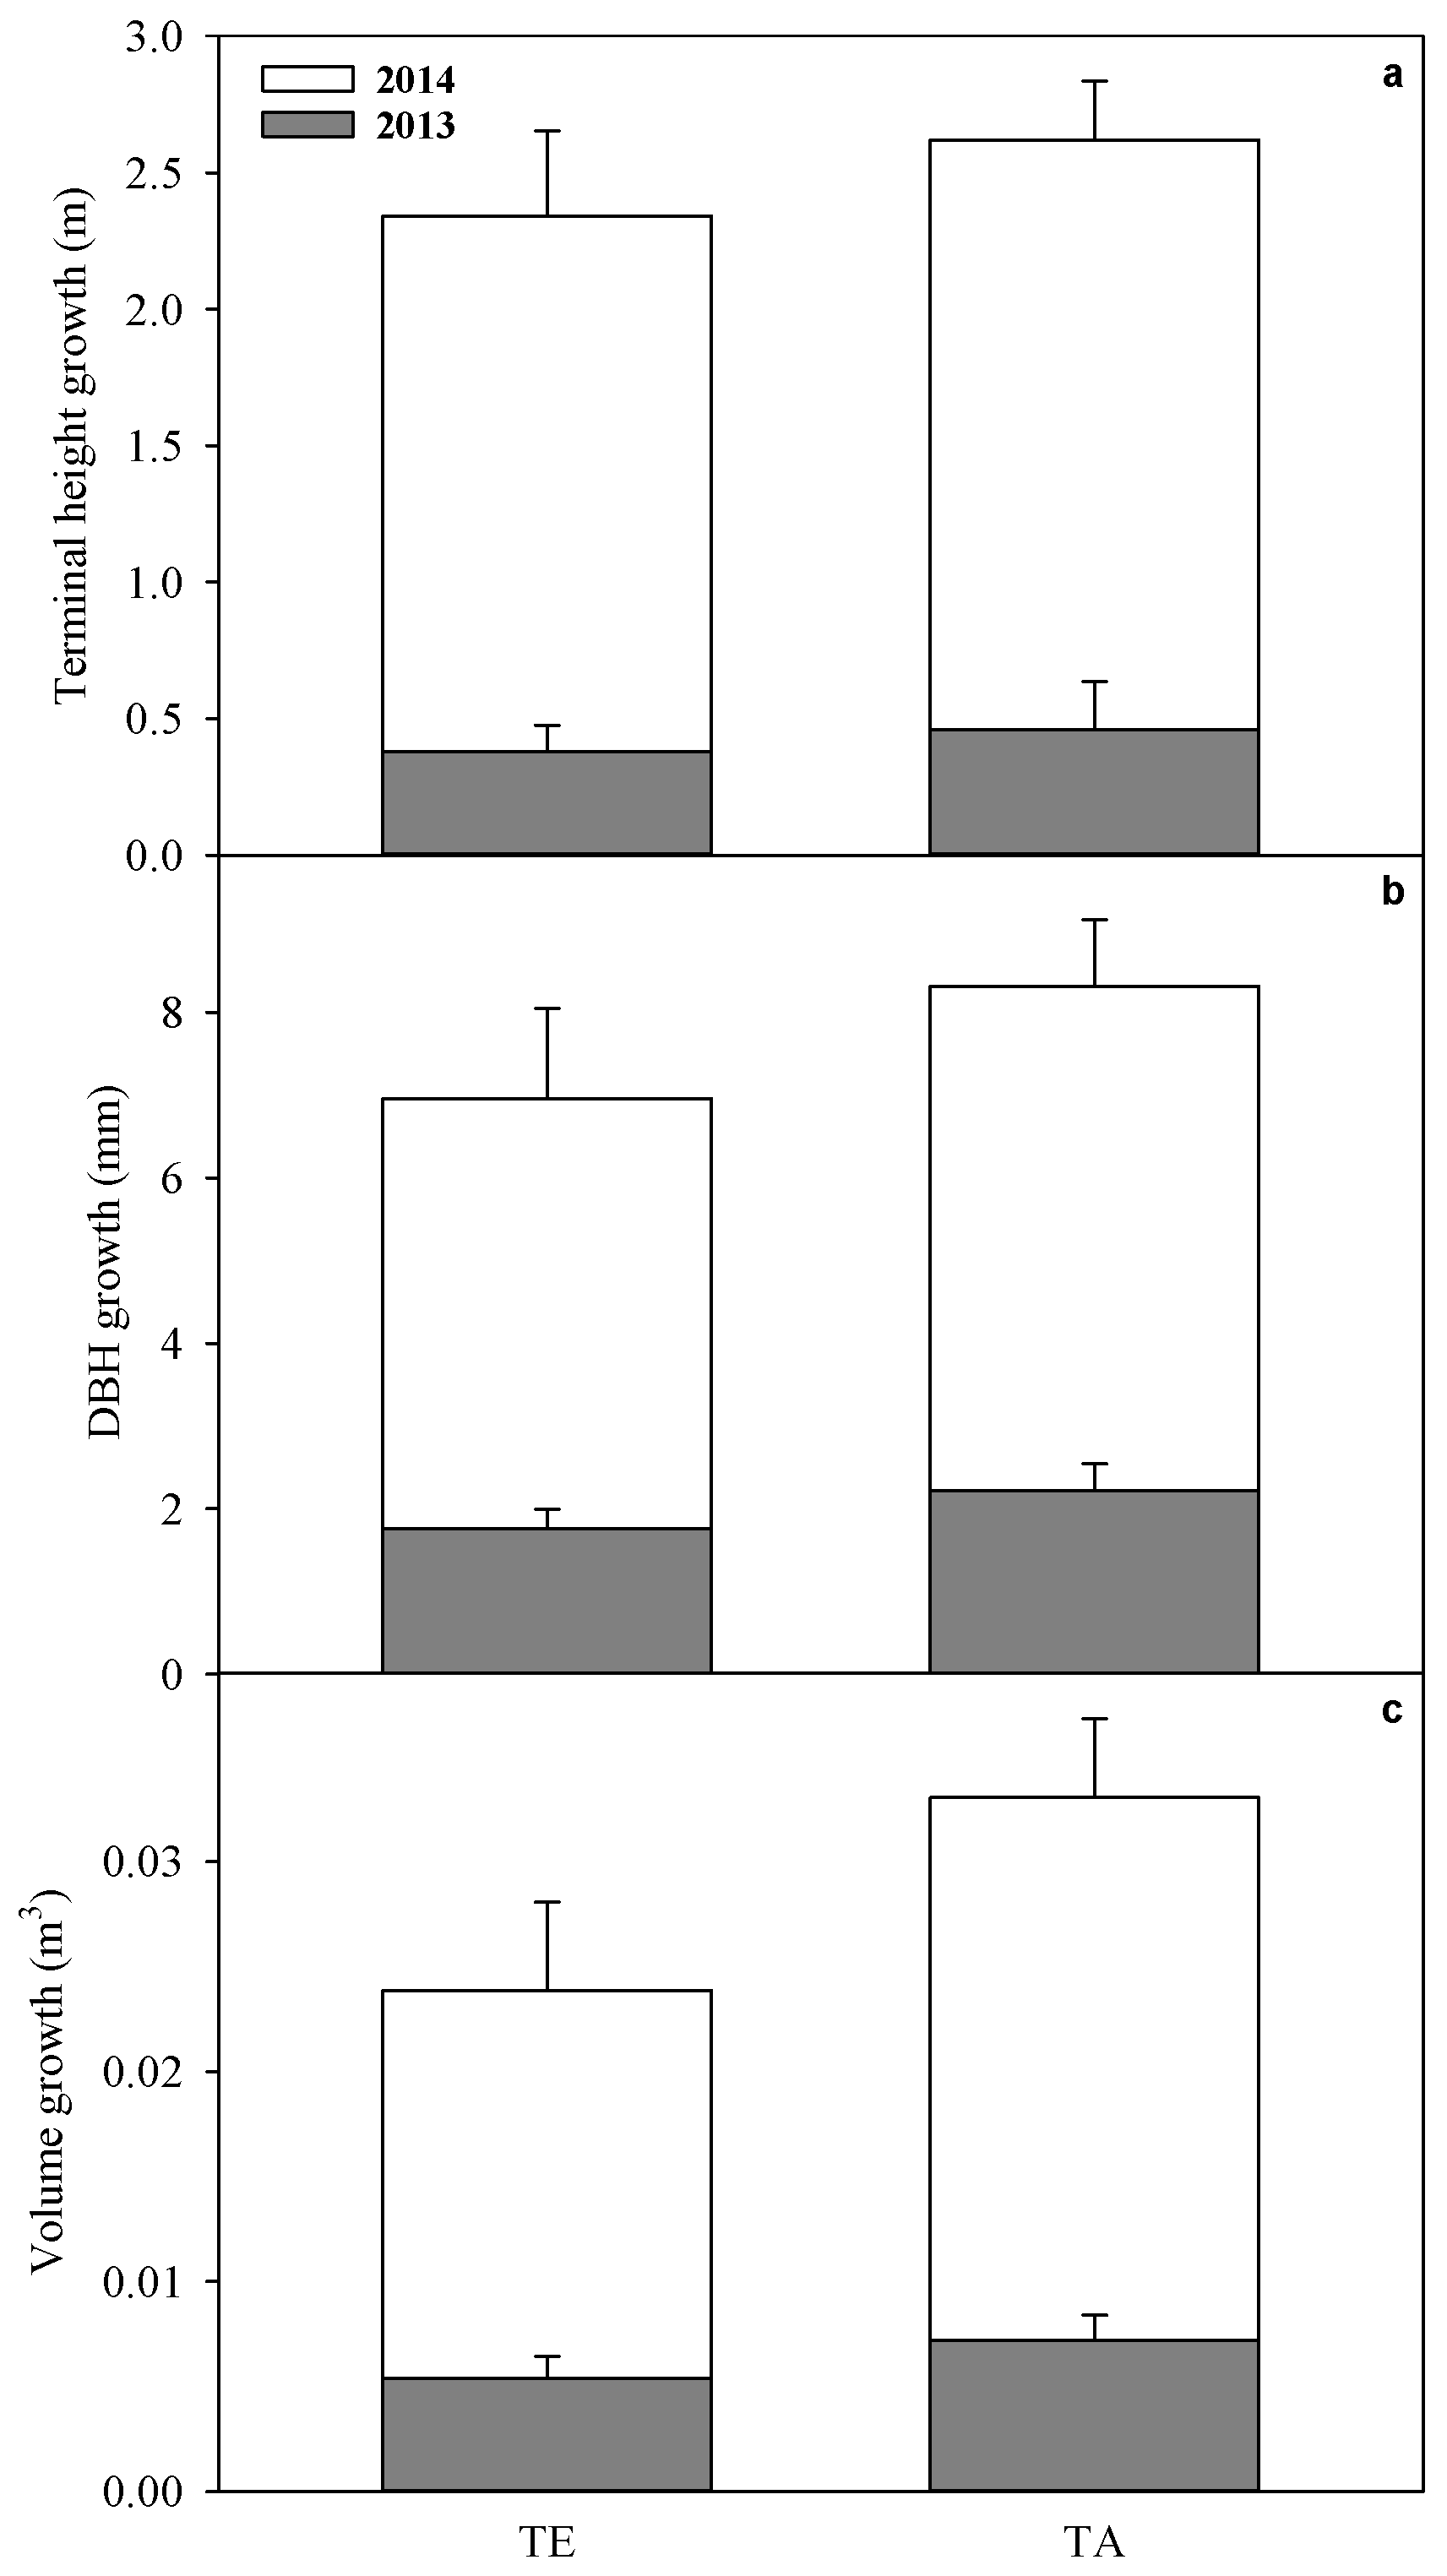
3.6. Growth
4. Discussion
5. Conclusions
Acknowledgments
Author Contributions
Conflicts of Interest
References
- Wear, D.N.; Greis, J.G. The Southern Forest Futures Project: Summary Report; USDA Forest Service Southern Research Station: Asheville, NC, USA, 2012.
- Oswalt, S.N.; Smith, W.B.; Miles, P.D.; Pugh, S.A. Forest Resources of the United States, 2012: A Technical Document Supporting the Forest Service 2015 Update of the RPA Assessment; U.S. Department of Agriculture, Forest Service, Washington Office: Washington, DC, USA, 2014.
- Collins, M.; Knutti, R.; Arblaster, J.; Dufresne, J.-L.; Fichefet, T.; Friedlingstein, P.; Gao, X.; Gutowski, W.J.; Johns, T.; Krinner, G.; et al. Long-term climate change: Projections, commitments and irreversibility. In Climate Change 2013: The Physical Science Basis. Contribution of Working Group I to the Fifth Assessment Report of the Intergovernmental Panel on Climate Change; Stocker, T.F., Qin, D., Plattner, G.-K., Tignor, M., Allen, S.K., Boschung, J., Nauels, A., Xia, Y., Bex, V., Midgley, P.M., Eds.; Cambridge University Press: Cambridge, UK; New York, NY, USA, 2013; pp. 1039–1106. [Google Scholar]
- Walsh, J.; Wuebbles, D.; Hayhoe, K.; Kossin, J.; Kunkel, K.; Stephens, G.; Thorne, P.; Vose, R.; Wehner, M.; Willis, J.; et al. Chapter 2: Our changing climate. In Climate Change Impacts in the United States: The Third National Climate Assessment; Melillo, J.M., Richmond, T.C., Yohe, G.W., Eds.; U.S. Global Change Research Program: Washington, DC, USA, 2014; pp. 19–67. [Google Scholar]
- Breshears, D.D.; Adams, H.D.; Eamus, D.; McDowell, N.G.; Law, D.J.; Will, R.E.; Williams, A.P.; Zou, C.B. The critical amplifying role of increasing atmospheric moisture demand on tree mortality associated with regional die off. Front. Plant Sci. 2013, 4, 266. [Google Scholar] [CrossRef] [PubMed]
- Will, R.E.; Wilson, S.M.; Zou, C.B.; Hennessey, T.C. Increased VPD due to higher temperature leads to greater transpiration and faster mortality during drought for tree seedlings common to the forest-grassland ecotone. New Phytol. 2013, 200, 366–374. [Google Scholar] [CrossRef] [PubMed]
- Seager, R.; Hooks, A.; Williams, A.P.; Cook, B.; Nakamura, J. Climatology, variability, and trends in the U.S. vapor pressure deficit, and important fire-related meteorological quantity. J. Appl. Meteorol. Climatol. 2015, 54, 1121–1141. [Google Scholar] [CrossRef]
- Kramer, P.J.; Boyer, J.S. Water Relations of Plants and Soils; Academic Press: London, UK, 1995; pp. 344–374. [Google Scholar]
- Chaves, M.M.; Maroco, J.P.; Pereira, J. Understanding plant response to drought-from genes to the whole plant. Funct. Plant Biol. 2003, 30, 239–264. [Google Scholar] [CrossRef]
- McDowell, N.; Pockman, W.T.; Allen, C.D.; Breshears, D.D.; Cobb, N.; Kolb, T.; Plaut, J.; Sperry, J.; West, A.; Williams, D.G.; et al. Mechanisms of plant survival and mortality during drought: Why do some plants survive while others succumb to drought? New Phytol. 2008, 178, 719–739. [Google Scholar] [CrossRef] [PubMed]
- Fensham, R.J.; Fairfax, R.J.; Ward, D.P. Drought-induced tree death in savanna. Glob. Chang. Biol. 2009, 15, 380–387. [Google Scholar] [CrossRef]
- Allen, C.D.; Macalady, A.K.; Chenchouni, H.; Bachelet, D.; McDowell, N.; Vennetier, M.; Kitzberger, T.; Rigling, A.; Breshears, D.D.; Hogg, E.H.; et al. A global overview of drought and heat-induced tree mortality reveals emerging climate change risks for forests. For. Ecol. Manag. 2010, 259, 660–684. [Google Scholar] [CrossRef]
- Anderegg, W.R.L.; Berry, J.A.; Smith, D.D.; Sperry, J.S.; Anderegg, L.D.L.; Field, C.B. The roles of hydraulic and carbon stress in a widespread climate-induced forest die-off. Proc. Natl. Acad. Sci. USA 2012, 109, 233–237. [Google Scholar] [CrossRef] [PubMed]
- Chaves, M.M. Effects of water deficits on carbon assimilation. J. Exp. Bot. 1991, 42, 1–16. [Google Scholar] [CrossRef]
- Teskey, R.O.; Fites, J.A.; Samuelson, L.J.; Bongarten, B.C. Stomatal and nonstomatal limitations to net photosynthesis in Pinus taeda L. under different environmental conditions. Tree Physiol. 1986, 2, 131–142. [Google Scholar] [CrossRef] [PubMed]
- Mencuccini, M.; Grace, J. Climate influences the leaf area/sapwood area ratio in Scots pine. Tree Physiol. 1994, 15, 1–10. [Google Scholar] [CrossRef]
- Hennessey, T.C.; Dougherty, P.M.; Cregg, B.M.; Wittwer, R.F. Annual variation in needle fall of a loblolly pine stand in relation to climate and stand density. For. Ecol. Manag. 1992, 51, 329–338. [Google Scholar] [CrossRef]
- Hubbard, R.M.; Ryan, M.G.; Stiller, V.; Sperry, J.S. Stomatal conductance and photosynthesis vary linearly with plant hydraulic conductance in ponderosa pine. Plant Cell Environ. 2001, 24, 113–121. [Google Scholar] [CrossRef]
- Whitehead, D.; Beadle, C.L. Physiology regulation of productivity and water use in Eucalyptus: A review. For. Ecol. Manag. 2004, 193, 113–140. [Google Scholar] [CrossRef]
- Pallardy, S.G.; Rhoads, J.L. Drought effects leaf abscission and leaf production in Populus clones. In Proceedings of the 11th Central Hardwood Forest Conference, Columbia, MO, USA, 23–26 March 1997; Pallardy, S.G., Cecich, R.A., Garrett, H.G., Johnson, P.S., Eds.; U.S. Department of Agriculture, Forest Service, North Central Forest Experiment Station: St. Paul, MN, USA, 1997; pp. 373–383. [Google Scholar]
- Allen, C.D.; Breshears, D.D. Drought-induced shift of a forest woodland ecotone: Rapid landscape response to climate variation. Proc. Natl. Acad. Sci. USA 1998, 95, 14839–14842. [Google Scholar] [CrossRef] [PubMed]
- Allen, C.D.; Breshears, D.D. Climate-Induced Forest Dieback as an Emergent Global Phenomenon; Eos, Transitions American Geophysical Union: San Jose, CA, USA, 2007; Volume 88, pp. 504–505. [Google Scholar]
- Dobbertin, M.; Wermelinger, B.; Bigler, C.; Bürgi, M.; Carron, M.; Forster, B.; Gimmi, U.; Rigling, A. Linking increasing drought stress to scots pine mortality and bark beetle infestations. Sci. World J. 2007, 7, 231–239. [Google Scholar] [CrossRef] [PubMed]
- Adams, H.D.; Guardiola-Claramonte, M.; Barron-Gafford, G.A.; Villegas, J.C.; Breshears, D.D.; Zou, C.B.; Troch, P.A.; Huxman, T.E. Temperature sensitivity of drought-induced tree mortality portends increased regional die-off under global-change-type drought. Proc. Natl. Acad. Sci. USA 2009, 106, 7063–7066. [Google Scholar] [CrossRef] [PubMed]
- Galvez, D.A.; Landhäusser, S.M.; Tyree, M.T. Root carbon reserve dynamics in aspen seedlings: Does simulated drought induce reserve limitation? Tree Physiol. 2011, 31, 250–257. [Google Scholar] [CrossRef] [PubMed]
- Plaut, J.; Wadsworth, W.D.; Pangle, R.; Yepez, E.A.; McDowell, N.G.; Pockman, W.T. Reduced transpiration response to precipitation pulses precedes mortality in a piῆon-juniper woodland subject to prolonged drought. New Phytol. 2013, 200, 375–387. [Google Scholar] [CrossRef] [PubMed]
- Pangle, R.E.; Limousin, J.M.; Plaut, J.A.; Yepez, E.A.; Hudson, P.J.; Boutz, A.L.; Gehres, N.; Pockman, W.T.; McDowell, N.G. Prolonged experimental drought reduces plant hydraulic conductance and transpiration and increases mortality in a piῆon-juniper woodland. Ecol. Evol. 2015, 5, 1618–1638. [Google Scholar] [CrossRef] [PubMed]
- Adams, H.D.; Kolb, T.E. Tree growth response to drought and temperature along an elevation gradient on a mountain landscape. J. Biogeogr. 2005, 32, 1629–1640. [Google Scholar] [CrossRef]
- Bréda, N.; Huc, R.; Granier, A.; Dreyer, E. Temperate forest trees and stands under severe drought: A review of ecophysiological responses, adaptation processes and long-term consequences. Ann. For. Sci. 2006, 63, 525–544. [Google Scholar] [CrossRef]
- Attia, Z.; Domec, J.-C.; Oren, R.; Way, D.A.; Moshelion, M. Growth and physiological responses of isohydric and anisohydric poplars to drought. J. Exp. Bot. 2015, 66, 4373–4381. [Google Scholar] [CrossRef] [PubMed]
- Perry, M.A.; Mitchell, R.J.; Zutter, B.R.; Glover, G.R.; Gjerstad, D.H. Seasonal variation in competitive effect on water stress and pine responses. Can. J. For. Res. 1994, 24, 1440–1449. [Google Scholar] [CrossRef]
- Groninger, J.W.; Seiler, J.R.; Zedaker, S.M.; Berrang, P.C. Effects of CO2 concentration and water availability on growth and gas exchange in greenhouse-grown miniature stands of loblolly pine and red maple. Funct. Ecol. 1996, 10, 708–716. [Google Scholar] [CrossRef]
- Barnes, A.D. Effects of phenology, water availability and seed source on loblolly pine biomass partitioning and transpiration. Tree Physiol. 2002, 22, 733–740. [Google Scholar] [CrossRef] [PubMed]
- Cregg, B.M.; Dougherty, P.M.; Hennessey, T.C. Growth and wood quality of young loblolly pine trees in relation to stand density and climatic factors. Can. J. For. Res. 1988, 18, 851–858. [Google Scholar] [CrossRef]
- Ford, C.R.; Goranson, C.E.; Mitchell, R.J.; Will, R.E.; Teskey, R.O. Modeling canopy transpiration using time series analysis: A case study illustrating the effect of soil moisture deficit on Pinus taeda. Agric. For. Meteorol. 2005, 130, 163–175. [Google Scholar] [CrossRef]
- Domec, J.-C.; Noormets, A.; King, J.S.; Sun, G.; McNulty, S.G.; Gavazzi, M.J.; Boggs, J.L.; Treasure, E.A. Decoupling the influence of leaf and root hydraulic conductances on stomatal conductance and its sensitivity to vapour pressure deficit as soil dries in a drained loblolly pine plantation. Plant Cell Environ. 2009, 32, 980–991. [Google Scholar] [CrossRef] [PubMed]
- Tang, Z.; Sword Sayer, M.A.; Chambers, J.L.; Barnett, J.P. Interactive effects of fertilization and througfall exclusion on the physiological responses and whole-tree carbon uptake of mature loblolly pine. Can. J. Bot. 2004, 82, 850–861. [Google Scholar] [CrossRef]
- Samuelson, L.J.; Pell, C.J.; Stokes, T.A.; Bartkowiak, S.M.; Akers, M.K.; Kane, M.; Markewitz, D.; McGuire, M.A.; Teskey, R.O. Two-year throughfall and fertilization effects on leaf physiology and growth of loblolly pine in the Georgia Piedmont. For. Ecol. Manag. 2014, 330, 29–37. [Google Scholar] [CrossRef]
- Bartkowiak, S.M.; Samuelson, L.J.; McGuire, M.A.; Teskey, R.O. Fertilization increases sensitivity of canopy stomatal conductance and transpiration to throughfall reduction in an 8-year-old loblolly pine plantation. For. Ecol. Manag. 2015, 354, 87–96. [Google Scholar] [CrossRef]
- Ward, E.J.; Domec, J.-C.; Laviner, M.A.; Fox, T.R.; Sun, G.; McNulty, S.; King, J.; Noormets, A. Fertilization intensifies drought stress: Water use and stomatal conductance of Pinus taeda in a midrotation fertilization and throughfall reduction experiment. For. Ecol. Manag. 2015, 355, 72–82. [Google Scholar] [CrossRef]
- Maggard, A.O.; Will, R.E.; Wilson, D.S.; Meek, C.R.; Vogel, J.G. Fertilization reduced stomatal conductance but not photosynthesis of Pinus taeda which compensated for lower water availability in regards to growth. For. Ecol. Manag. 2016. Accepted. [Google Scholar]
- Rahman, M.S.; Messina, M.G.; Newton, R.J. Performance of loblolly pine (Pinus taeda L.) seedlings and micropropagated plantlets on an east Texas site II. Water relations. For. Ecol. Manag. 2003, 178, 257–270. [Google Scholar] [CrossRef]
- Natural Resources Conservation Service, United States Department of Agriculture. Official Soil Series Descriptions and Series Classification. Available online: http://soilseries.sc.egov.usda.gov (accessed on 24 July 2016).
- The Oklahoma Mesonet. Daily Data Retrieval. Available online: http://mesonet.org/index.php/weather/daily (accessed on 24 July 2016).
- Allen, R.G.; Pereira, L.S.; Raes, D.; Smith, M. Crop Evapotranspiration—Guidelines for Computing Crop Water Requirements—FAO Irrigation and Drainage Paper 56; Food and Agriculture Organization (FAO) of the United Nations: Rome, Italy, 1998. [Google Scholar]
- Burkhart, H.D. Cubic-foot volume of loblolly pine to any merchantable top limit. South. J. Appl. For. 1977, 1, 7–9. [Google Scholar]
- Granier, A. Une nouvelle methode pour la mesure du flux de seve brute dans le tronc des arbes. Ann. For. Sci. 1985, 42, 193–200. [Google Scholar] [CrossRef]
- Tateishi, M.; Kumagai, T.Ä.; Utsumi, Y.; Umebayashi, T.; Shiiba, Y.; Inoue, K.; Kaji, K.; Cho, K.; Otsuki, K. Spatial variations in xylem sap flux density in evergreen oak trees with radial-porous wood: Comparisons with anatomical observations. Trees Struct. Funct. 2008, 22, 23–30. [Google Scholar] [CrossRef]
- Ward, E.J.; Oren, R.; Bell, D.M.; Clark, J.S.; McCarthy, H.R.; Kim, H.-S.; Domec, J.-C. The effects of elevated CO2 and nitrogen fertilization on stomatal conductance estimated from 11 years of scaled sap flux measurements at Duke FACE. Tree Physiol. 2013, 33, 135–151. [Google Scholar] [CrossRef] [PubMed]
- Granier, A. Evaluation of transpiration in a Douglas-fir stand by means of sap flow measurements. Tree Physiol. 1987, 3, 309–320. [Google Scholar] [CrossRef] [PubMed]
- Schultz, R.P. Loblolly Pine: The Ecology and Culture of Loblolly Pine (Pinus taeda L.); U.S. Department of Agriculture, Forest Service, Washington Office: Washington, DC, USA, 1997.
- Hacke, U.G.; Sperry, J.S.; Ewers, B.E.; Ellsworth, D.S.; Schäfer, K.V.R.; Oren, R. Influence of soil porosity on water use in Pinus taeda. Oecologia 2000, 124, 495–505. [Google Scholar] [CrossRef]
- Harris, W.F.; Kinerson, R.S.; Edwards, N.T. Comparison of below-ground biomass of natural deciduous forests and loblolly pine plantations. Pedobiologia 1977, 17, 369–381. [Google Scholar]
- Brewer, C.W.; Linnartz, N.E. Soil moisture utilization by mature loblolly pine stands in the Coastal Plain of southeastern Louisiana. In Proceedings of the Soil Moisture Site Productivity Symposium, Myrtle Beach, SC, USA, 1–3 November 1977; Balmer, W.E., Ed.; USDA Forest Service, Southeastern Area, State and Private Forestry, 1978; pp. 296–306. [Google Scholar]
- Box, B.H. A Study of Root Extension and Biomass in a Six-Year-Old Pine Plantation in Southeast Louisiana. Ph.D. Thesis, Duke University, School of Forest Resources, Durham, NC, USA, 1967. [Google Scholar]
- Will, R.E.; Fox, T.; Akers, M.; Domec, J.-C.; González-Benecke, C.; Jokela, E.J.; Kane, M.; Laviner, M.A.; Lokuta, G.; Markewitz, D.; et al. A range-wide experiment to investigate nutrient and soil moisture interactions in loblolly pine plantations. Forests 2015, 6, 2014–2028. [Google Scholar] [CrossRef]
- Kramer, P.J. Water Relations of Plants; Academic Press: New York, NY, USA, 1983. [Google Scholar]
- Sade, N.; Gebremedhin, A.; Moshelion, M. Risk-taking plants: Anisohydric behavior as a stress-resistance trait. Plant Signal Behav. 2012, 7, 767–770. [Google Scholar] [CrossRef] [PubMed]
- Moshelion, M.; Halperin, O.; Wallach, R.; Oren, R.; Way, D.A. Role of aquaporins in determining transpiration and photosynthesis in waterstressed plants: Crop water-use efficiency, growth and yield. Plant Cell Environ. 2015, 38, 1785–1793. [Google Scholar] [CrossRef] [PubMed]
- Hebert, M.T.; Jack, S.B. Leaf area index and site water balance of loblolly pine (Pinus taeda L.) across a precipitation gradient in East Texas. For. Ecol. Manag. 1998, 105, 273–282. [Google Scholar] [CrossRef]
- Maggard, A.O. Response of Mid-Rotation Loblolly Pine (Pinus taeda L.) to Fertilization and Reduced Water Availability in Southeastern Oklahoma. Ph.D. Thesis, Oklahoma State University, Stillwater, OK, USA, May 2016. [Google Scholar]
- Green, T.H.; Mitchell, R.J. Effects of nitrogen on the response of loblolly pine to water stress. I. Photosynthesis and stomatal conductance. New Phytol. 1992, 122, 627–633. [Google Scholar] [CrossRef]
- Grassi, G.; Manani, F. Stomatal, mesophyll conductance and biochemical limitations to photosynthesis as affected by drought and leaf ontogeny in ash and oak trees. Plant Cell Environ. 2005, 28, 834–849. [Google Scholar] [CrossRef]
- Ni, B.-R.; Pallardy, S.G. Stomatal and nonstomatal limitations to net photosynthesis in seedlings of woody angiosperms. Plant Physiol. 1992, 99, 1502–1508. [Google Scholar] [CrossRef] [PubMed]
- Sun, G.; Alstad, K.; Chen, J.; Chen, S.; Ford, C.R.; Lin, G.; Liu, C.; Lu, N.; McNulty, S.G.; Miao, H.; et al. A general predictive model for estimating monthly ecosystem evapotranspiration. Ecohydrology 2011, 4, 245–255. [Google Scholar] [CrossRef]
- Albaugh, T.J.; Allen, H.L.; Daugherty, P.M.; Kress, L.W.; King, J.S. Leaf area and above-and below-ground growth responses of loblolly pine to nutrient and water additions. For. Sci. 1998, 44, 317–327. [Google Scholar]
- Jokela, E.J.; Dougherty, P.M.; Martin, T.A. Production dynamics of intensively managed loblolly pine stands in the southern United States: A synthesis of seven longterm experiments. For. Ecol. Manag. 2004, 192, 117–130. [Google Scholar] [CrossRef]
- Carlson, W.C.; Harrington, C.A.; Farnum, P.; Hallgren, S.W. Effects of root severing treatments on loblolly pine. Can. J. For. 1988, 18, 1376–1385. [Google Scholar] [CrossRef]


| VWC 0–12 cm | VWC 12–45 cm | VWC 45–90 cm | |
|---|---|---|---|
| Date | <0.0001 | <0.0001 | <0.0001 |
| TE | <0.0001 | <0.0001 | 0.07 |
| Date × TE | <0.0001 | <0.0001 | 0.01 |
| Peak Foliage Mass | Peak Foliage Mass Per Sapwood Area | ΨL | δ13C | N | Height | DBH | Volume | |
|---|---|---|---|---|---|---|---|---|
| Year | 0.004 | 0.004 | <0.0001 | <0.0001 | 0.01 | 0.0001 | 0.005 | <0.0001 |
| TE | 0.047 | 0.60 | <0.0001 | 0.34 | 0.64 | 0.49 | 0.28 | 0.13 |
| Year × TE | 0.50 | 0.81 | 0.02 | 0.72 | 0.17 | 0.91 | 0.72 | 0.28 |
| Pnet | gs | Ci | Predawn ΨL | Midday ΨL | WU | WUSA | |
|---|---|---|---|---|---|---|---|
| Date | <0.0001 | <0.0001 | <0.0001 | <0.0001 | <0.0001 | <0.0001 | <0.0001 |
| TE | 0.64 | 0.09 | 0.12 | <0.0001 | <0.0001 | 0.22 | 0.45 |
| Date × TE | 0.17 | 0.24 | 0.78 | 0.0002 | 0.04 | 0.99 | 0.85 |
© 2016 by the authors; licensee MDPI, Basel, Switzerland. This article is an open access article distributed under the terms and conditions of the Creative Commons Attribution (CC-BY) license (http://creativecommons.org/licenses/by/4.0/).
Share and Cite
Maggard, A.; Will, R.; Wilson, D.; Meek, C. Response of Mid-Rotation Loblolly Pine (Pinus taeda L.) Physiology and Productivity to Sustained, Moderate Drought on the Western Edge of the Range. Forests 2016, 7, 203. https://doi.org/10.3390/f7090203
Maggard A, Will R, Wilson D, Meek C. Response of Mid-Rotation Loblolly Pine (Pinus taeda L.) Physiology and Productivity to Sustained, Moderate Drought on the Western Edge of the Range. Forests. 2016; 7(9):203. https://doi.org/10.3390/f7090203
Chicago/Turabian StyleMaggard, Adam, Rodney Will, Duncan Wilson, and Cassandra Meek. 2016. "Response of Mid-Rotation Loblolly Pine (Pinus taeda L.) Physiology and Productivity to Sustained, Moderate Drought on the Western Edge of the Range" Forests 7, no. 9: 203. https://doi.org/10.3390/f7090203