
Phosphorus in Preferential Flow Pathways of Forest Soils in Germany


Institute of Soil Science and Site Ecology, TU Dresden, Pienner Str. 19, 01737 Tharandt, Germany
*
Author to whom correspondence should be addressed.
Forests 2017, 8(1), 19; https://doi.org/10.3390/f8010019
Submission received: 31 August 2016
/
Revised: 9 December 2016
/
Accepted: 23 December 2016
/
Published: 30 December 2016
(This article belongs to the Special Issue Nutrient Cycling and Plant Nutrition in Forest Ecosystems)
Abstract
:The transport of nutrients in forest soils predominantly occurs along preferential flow pathways (PFP). This study investigated the composition of phosphorus (P) forms in PFPs and soil matrix in several temperate beech forests with contrasting soil P contents in Germany. The PFPs were visualized using dye tracer experiments. Stained and unstained soil was sampled from three profile cuts per plot and analyzed for P fractions. The results show that labile P concentrations were highest in the O-layer and had the same range of values at all sites (240–320 mg·kg−1), although total P (TP) differed considerably (530–2330 mg·kg−1). The ratio of labile P to TP was significantly lower in the P-rich soil compared to the medium and P-poor soils. By contrast, the ratio of moderately labile P to TP was highest at the P-rich site. The shifts in P fractions with soil depth were generally gradual in the P-rich soil, but more abrupt at the others. The contents of labile and moderately labile P clearly differed in PFPs compared to soil matrix, but not statistically significant. The studied soils are characterized by high stone contents with low potential for P sorption. However, indications were found that labile organically bound P accumulates in PFPs such as biopores.
1. Introduction
Phosphorus (P) in forest soils is distributed highly variably, both between and within soil types, with respect to contents, speciation, availability, and sources of P [1]. Soils contain various P forms, generally differentiated in organically bound (Po) and inorganic (Pi) P. Organic P occurs as orthophosphate monoesters (e.g., inositols, mononucleotides, sugar phosphates), orthophosphate diesters (phospholipids, teichoic acids, nucleic acids, and their degradation products), and phosphonates. Inorganic P is bound in minerals (e.g., apatite) and is present in dissolved form as ortho-, pyro-, and/or polyphosphates [2,3]. The total content and stock of soil P varies from very low (<100 mg·kg−1 and <10 g·m−2) to P-rich (>3000 mg·kg−1 and >1000 g·m−2), and the mineral P supply and P speciation is strongly dependent on the parent material and pedogenesis [4,5]. Whereas P supply from the mineral phase is the main source of available P in P-rich soils, P availability for plants in P-poor soils is considerably influenced by P speciation [4]. These differences in P supply drive P fluxes in the systems and determine the dominating strategy of ecosystem nutrition [6]. Besides those internal factors, external environmental and anthropogenic impacts (as forest management, N deposition, etc.) substantially influence the distribution of P and nutrient cycling in temperate forest soils [7,8,9,10].
The predominant transport pathway for nutrients in forest soils is along preferential flow pathways (PFP), bypassing large parts of the soil matrix [11,12,13]. An established method to investigate PFPs and their role in water and nutrient transport are tracer experiments [14,15,16,17]. Previous tracer studies indicated that PFPs in forest soils can be stable for decades, resulting in differences in biological and chemical parameters between PFPs and the soil matrix, particularly when preferential flow along root channels dominates the flow system [12,18]. Accumulation in stable flow paths has been found in previous studies for radionuclides, SOC, N [15,18], and also for C, Ca, Mg, and Fe [12]. Backnäs et al. [19] investigated P fractions in PFPs as compared to the soil matrix in a Podzol under forest in Southern Lapland, Finland. The results indicated that the leaching of P through PFPs occurred primarily along stone surfaces, where PFPs are larger than PFPs related to coarse grains or roots. Thus, P sorption may be limited due to potentially faster water flow, weaker lateral mass exchange and less sorption interaction than in smaller PFPs [20]. By contrast, P accumulation might occur in small preferential pores with decelerated water flow and longer contact time between the solution and inner pore surfaces [19]. As a result, such PFPs with high potential to accumulate P increase the likelihood for elevated P concentrations in export fluxes [21]. However, there are very few data available regarding P accumulation and transport in forest soils. Therefore, this study investigated the composition of P forms in PFPs and the soil matrix in four temperate forest ecosystems in Germany. Furthermore, the influence of different initial conditions regarding the content of total and available P at the sites on the distribution of P forms in the soil profiles and in PFPs was examined. The correlation between P fractions and chemical parameters was tested to identify the most important factors influencing the occurrence of P fractions in the investigated soils.
2. Materials and Methods
2.1. Site Description
Field experiments and sampling were conducted at four beech dominated forests (F. sylvatica L.) across Germany with similar stand age (110–120 years). The four study sites Lüss (LUE), Vessertal (VES), Mitterfels (MIT), and Bad Brückenau (BBR) are core sites of the German DFG Priority Program SPP 1685 which aims at testing the overall hypothesis that the P-depletion of soils drives forest ecosystems from P acquiring systems (efficient mobilization of P from the mineral phase) to P recycling systems (highly efficient cycling of P) [6]. Further, all sites are long-term monitoring sites in Germany and part of the EU-ICP Forests Level II Program (International Co-operative Programme on the Assessment and Monitoring of Air Pollution Effects on Forests). The sites were selected with regard to their considerable different availability of mineral P following the sequence BBR > MIT > VES > LUE. The BBR site was defined as P-rich site, LUE as P-poor site, and MIT and VES as medium P-supplied sites. Three sites (VES, MIT, and BBR) are located in the low mountain ranges, whereas LUE is in the lowlands. The sites differ in parent material, soil type, and climate (Table 1). Soil properties are summarized in Table 2. For better comparisons, the soil horizons were aggregated for each site considering their physical and chemical properties to: O—organic layer, A—topsoil horizon, B—subsoil horizon, C—lower subsoil horizon containing weathered parent material.
2.2. Field Experiments
At each study site a test plot of 1 m² was established at a minimum distance of 2 m from any trees. On the first day, the plots were irrigated with 30 L of tracer-water solution containing 3 g·L−1 of Brilliant Blue FCF (within 1 hour) to activate rapid flow paths (PFPs) in the soils. Brilliant Blue dye was used due to its good visibility, retardation behavior in soil, and its non-toxicity to the environment [16,17]. After the dye tracer irrigation, the plots were sprinkled with 2 L of water to wash off the dye residues from the organic layer [19], and then covered overnight with a tarpaulin to exclude disturbances (e.g., rainfall). The irrigated plots were excavated on the following day by successively preparing five horizontal profile cuts per plot (at 20, 35, 50, 65, and 80 cm from the plot border) down to 1 m depth and 1 m width (see Figure 1). Stained (flow region) and unstained (non-flow region) soil was sampled respectively from the three inner cuts at 35, 50, and 65 cm from all morphological horizons. The amounts of soil material per sample varied because the thickness of soil horizons and stained/unstained parts per horizon differed considerably. The samples were sieved (<2 mm), dried at 40 °C, and then stored in plastic bottles until analysis. For the analysis of C, N, and total P the samples were finely grounded.
2.3. Chemical Analyses
The P fractions in stained and unstained soil samples were analyzed using the Hedley fractionation method [22,23]. This method uses increasingly strong extractants to determine P forms with differing availability for plants. All samples were extracted with a replicate. Additionally, certified reference soil material from the Wageningen Evaluating Programs for Analytical Laboratories, International Soil-analytical Exchange (WEPAL-ISE 865 and 884) and blanks were treated equally to the samples for quality control of the extraction procedure.
In the fractionation procedure, a subsample of 0.5 g soil was first shaken in distilled water containing an anion exchange resin (Dowex 22, 16–50 mesh, Sigma-Aldrich, Taufkirchen, Germany) in netting bags (PP-405/230-41, Bückmann, Mönchengladbach, Germany) [24]. The following extractants applied were: 0.5 M sodium bicarbonate (NaHCO3-P), 0.1 M sodium hydroxide (NaOH-i), 1 M hydrochloric acid (HCldil-P), hot concentrated 3.5 M hydrochloric acid (HClconc-P), and finally nitric acid digestion of the residual P fraction (residual P). After each extraction step, the amount of inorganic P in the extract solution was measured using the method of Murphy and Riley [25] and O’Halloran and Cade-Menun [26]. For the determination of total P (TP) in NaHCO3, NaOH, and HClconc, the extracts were oxidized in an autoclave using ammonium persulfate. Organically bound P (Po) was calculated as the difference between TP and Pi [23]. The P concentrations in all extracts were measured colorimetrically with a spectrophotometer (UV-mini 1240, Shimadzu Deutschland GmbH, Duisburg, Germany). For a detailed description of the procedure applied here see Tiessen and Moir [23].
According to the concept of Hedley fractionation, the different P fractions represent (1) surface-adsorbed readily available P, (2) strongly-bonded or adsorbed moderate available P, and (3) very strongly-bonded or inaccessible mineral P with very low availability [22,23,27]. Therefore, the analyzed P fractions were classified for further data analyses as labile P (resin-Pi + NaHCO3-Pi,o), moderately labile P (NaOH-Pi,o + HCldil-Pi), and stable P (HClconc-Pi,o + residual-P) (cf. [28]). The initial TP content of all samples was determined using the same method as the residual P fraction, by digestion with concentrated nitric acid and measurement with ICP-OES (CIROS, SPECTRO Analytical Instruments GmbH, Kleve, Germany). Total C and N contents were measured after dry combustion of grounded samples with a CN analyzer (Vario EL III Elementar GmbH, Hanau, Germany). The soils contained no inorganic C, thus soil organic C (SOC) equals total C. The concentrations of C in PFPs were not corrected for any C added as part of the Brilliant Blue dye. The C content of the dye is 56%, and the amount of total added C in the experiments was 50 g C m−2. Bundt et al. [15] conducted comparable experiments with a dye-derived addition of 75 g C m−2 and found a resulting increase of C with a maximum of 2.5 % SOC in in PFPs in 0–9 cm depth, and a maximum of 3.5 % SOC in PFPs in 50–100 cm depth. In the current study, less dye was applied to the plots, and thus the change in C content in PFPs is expected to be very low. Amorphous metal sesquioxides (Alox, Feox, Mnox) and Pox were determined by extraction with acid 0.2 M ammonium oxalate (100 mL added to a subsample of 2 g). Dithionite-extractable (Fedi, Aldi, Mndi) was analyzed with 50 mL Na-citrate-dithionite in a subsample of 0.5 g (modified after Holmgren, 1967). The measurement of element contents in the extracts was conducted with ICP-OES.
2.4. Statistical Analysis
The statistical significance of differences between P contents of different chemical fractions in flow pathways and matrix were tested using the R software package (version R i386 3.1.0, R Foundation for Statistical Computing 2014, Vienna, Austria). Given that most of the data sets exhibited non-normal distributions (tested by Shapiro-Wilk test and q-q-plot), the non-parametric Wilcoxon rank-sum test was used to statistically compare mean values. The statistical tests were conducted pair-wise including all data of the four sites, and at horizon level due to the hierarchical structure of the data (profiles, cuts, horizons). For correlations between chemical parameters and P fractions, the Spearman’s rho correlation coefficients were calculated and tested for significance.
3. Results and Discussion
The soil P fractions classified as labile, moderately labile, and stable P for PFP and soil matrix samples are shown in Figure 2. The values represent mean values for the three vertical cuts per profile. For the forest floor (O-layer), it was not possible to distinguish between stained and unstained material, due to the homogeneous distribution of the dye tracer from the irrigation. At the sites VES and MIT, the tracer did not reach the C horizon. Thus, the presented results contain no soil matrix data for the O-layer and no PFP data for the lower subsoil.
The TP values differed at the four study sites in their contents (45–2700 mg·kg−1) and distribution within the soil profiles (Figure 2, TP = total bar length). Whereas TP at the P-poor site (LUE) was clearly highest in the O-layer and strongly reduced in the mineral soil, the P-rich soil (BBR) showed the lowest values in the O-layer and had a slight increase in the subsoil. However, the amount of TP in all horizons at the P-rich site was much higher compared to the other sites, and was more or less equally distributed through the profile. The summarized P fractions were compared to the initial TP contents in order to determine the recovery rate of the analytical method. Considering all samples, the TP recovery was very high, with a correlation coefficient of 0.98.
3.1. Labile P Fractions
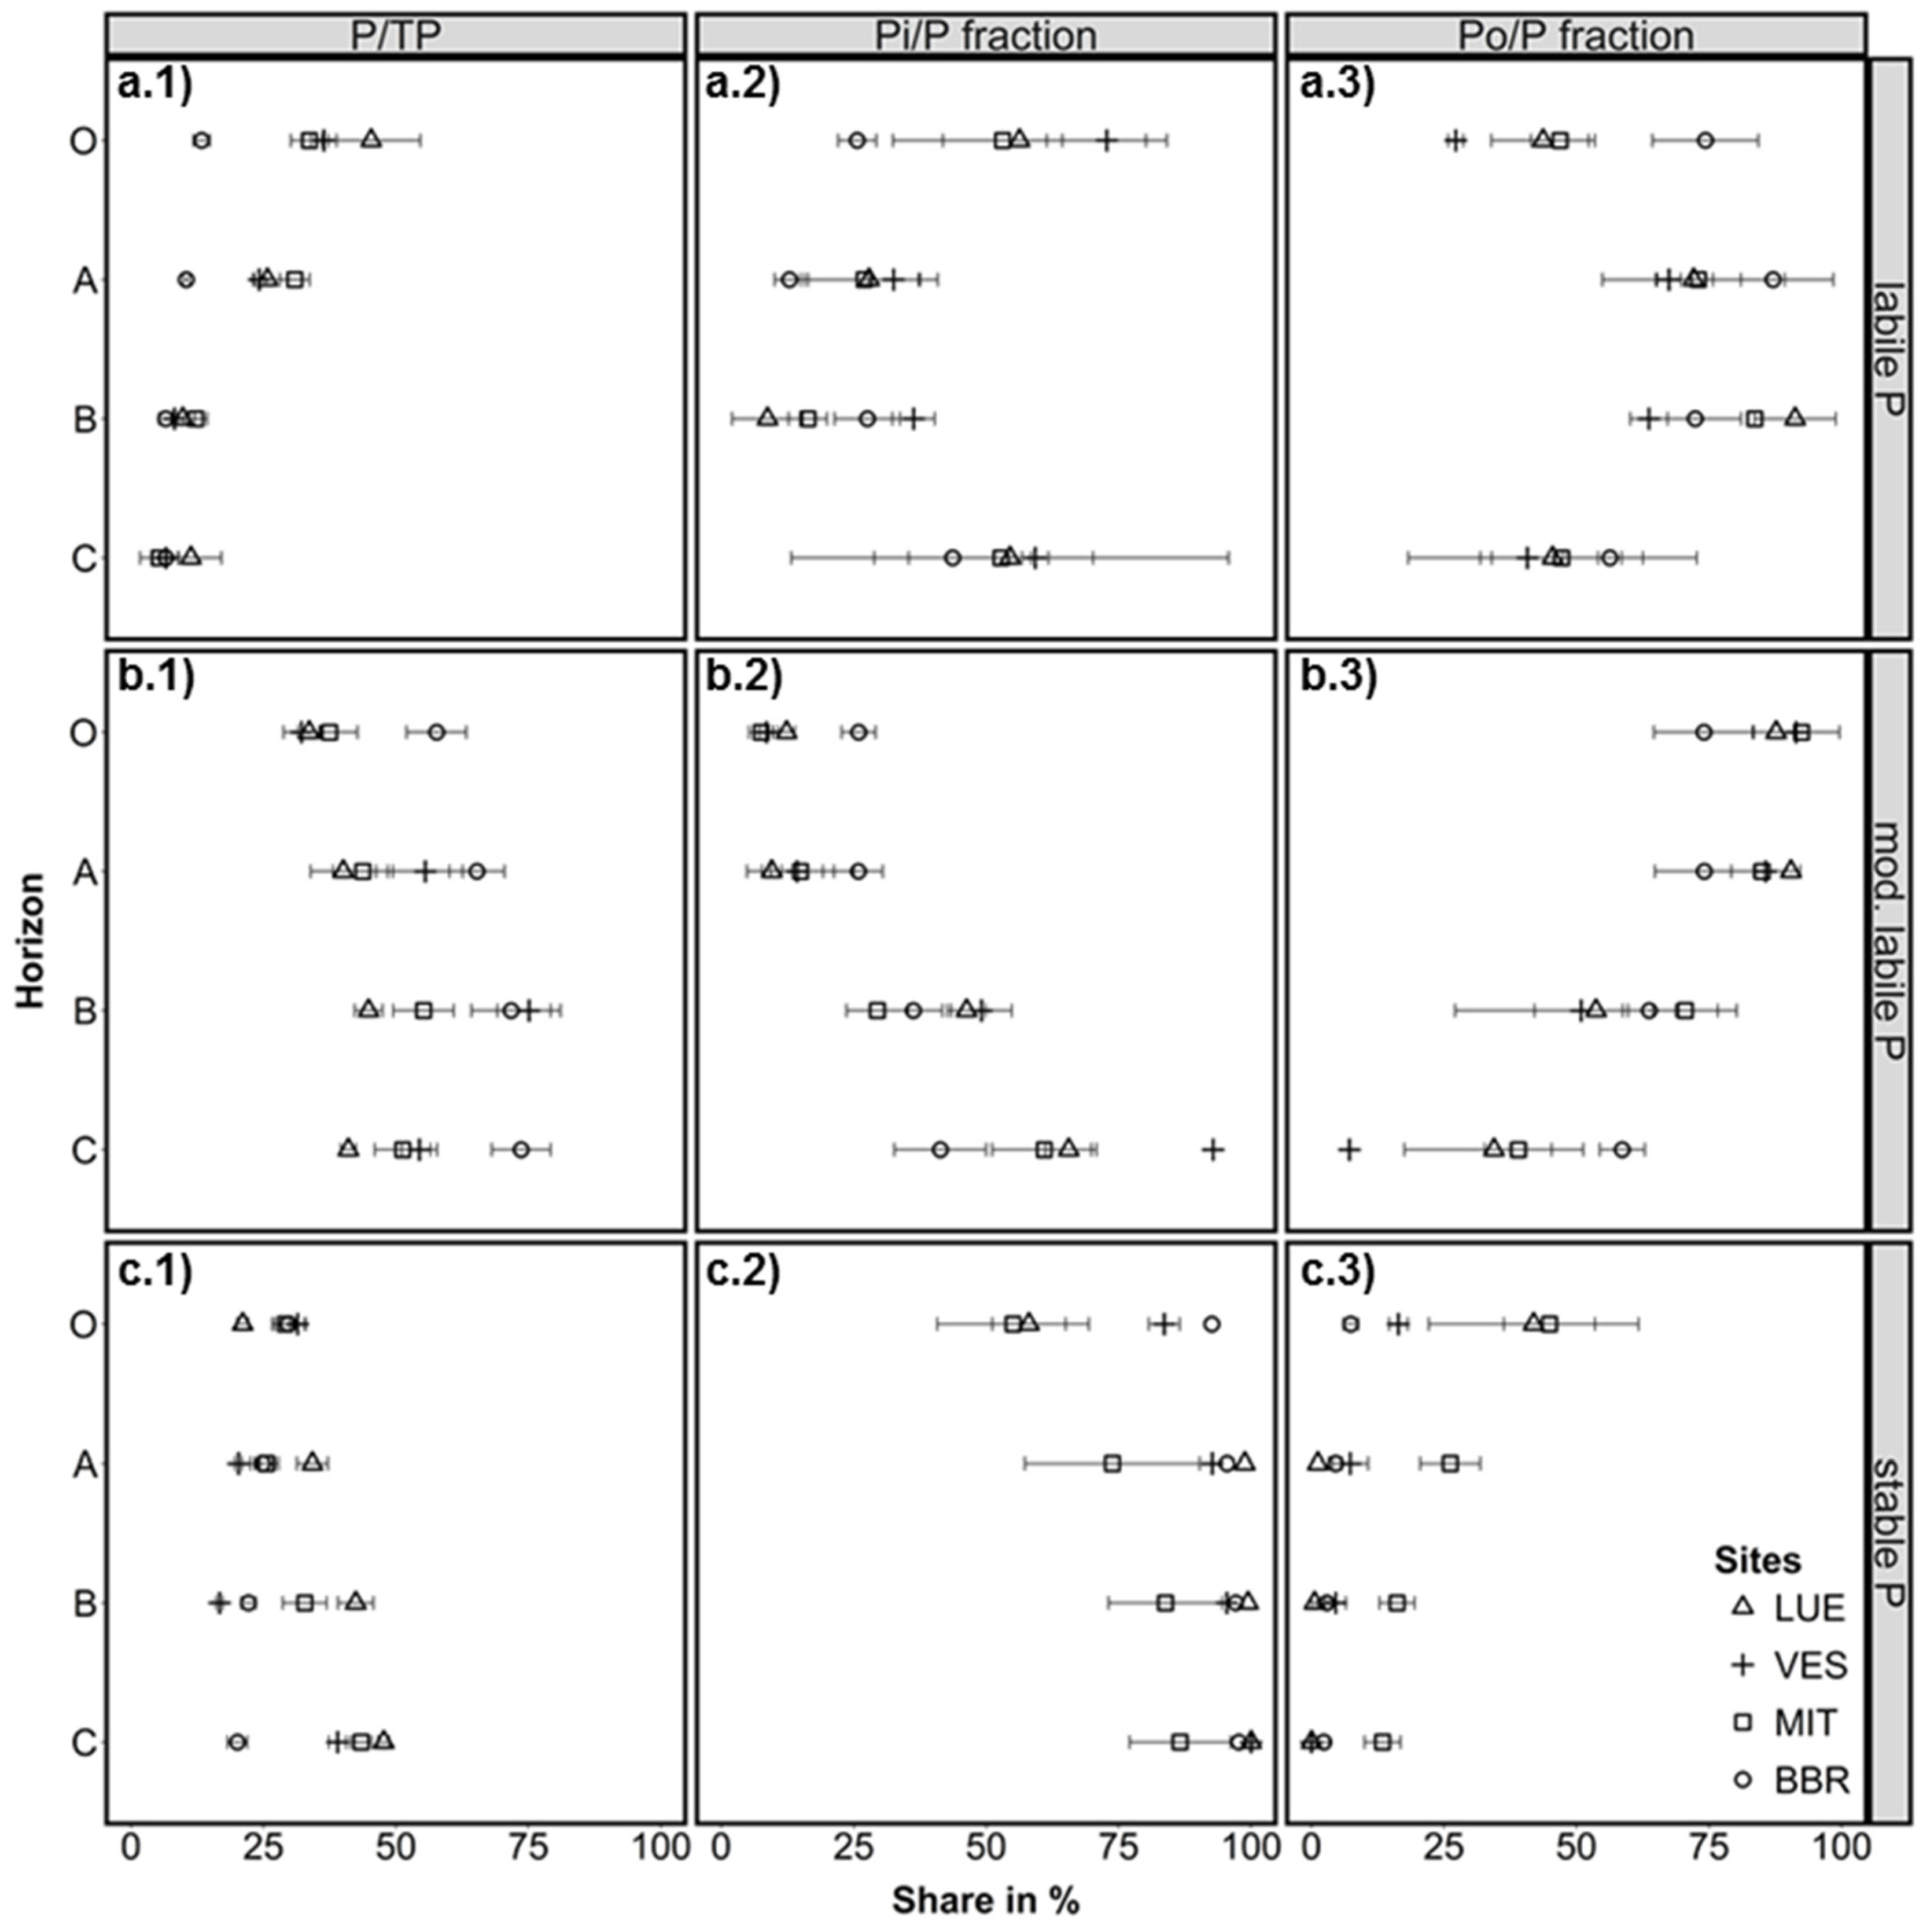
Despite the large difference in TP between the sites, labile P (here defined as resin-Pi + NaHCO3-Pi,o) was in the same range of values, at least for the medium P-supplied (VES, MIT), and the P-rich (BBR) sites. In the O-layer, the P-poor site (LUE) also had comparable values for labile P as the other sites. The share of labile P to TP in the O-layer was highest at the P-poor site (45 %), slightly lower at the medium sites (36 % and 33 %), and lowest in the P-rich site (14 %) (Figure 3a.1). There was a steep decrease in the ratio labile P to TP with soil depth at the P-poor to medium sites; and a more gradual decrease with depth at the P-rich site.
Organically bound P dominated the labile P pool in the A and B horizon for all sites, and also in the O-layer for BBR. At VES, 27% of labile P in the O-layer consisted of Po, while MIT and LUE had approximately equal amounts of Pi and Po (Figure 3a.2,a.3). Thus, most of the easily plant-available Pi was located in the O-layers at the medium and P-poor sites, whereas labile P was clearly dominated by Po at the P-richest site. This finding was unexpected, as very low P supply from the mineral phase is assumed to enhance tight P recycling in forest ecosystems [6] (and therefore the fast uptake of Pi) which would result in a higher share of Po at the P-poor site. In a recent study conducted at the same P-rich and P-poor study sites, Bünemann et al. [29] found that biological/biochemical processes were the dominant control of Pi availability in the low-P-sorbing sandy soil of the P-poor site. By contrast organic P mineralization was negligible when compared to the high Pi availability at the P-rich study site, which has a high-P-sorbing soil and very high TP content. Further, the high contents of amorphous and crystalline sesquioxides at the P-rich site (Table 2) may act as a sink for labile Pi, when it is adsorbed onto those surfaces and precipitated (depending on pH) (cf. [30,31]).
The differences in labile P between PFP and soil matrix were marginal considering the sum of Pi and Po of this pool (Figure 2), but the ratio of Pi to Po differed. Thus, the medium P-supplied site showed clearly higher contents of labile Pi and less labile Po in PFPs compared to soil matrix. By contrast, labile Po was significantly higher in PFPs of the P-rich site. However, the variation of results for labile Pi and Po was quite high between the three profile cuts within the soil plot (see error bars in Figure 3), which indicates that conclusions from the results have to be drawn carefully.
3.2. Moderately Labile P Fractions
The sum of moderately labile P forms (NaOH-Pi,o + HCldil-Pi) was the dominant fraction in mineral soil at the P-rich sites (Figure 2 and Figure 3). At the P-poor site, this pool was equal or slightly lower than the stable P pool. At all sites, moderately labile P was predominantly organically bound in the O-layer and topsoil. In the subsoil, the ratio of Pi to Po shifted towards Pi (Figure 3b.2,b.3). The shifts with depth were relatively gradual in the P-rich soil, but were more abrupt at the medium and P-poor sites.
The NaOH-extracted P represents the moderately available P forms related to Al, Fe, and humic substances. In acidic forest soils on silicate parent material, NaOH-P was observed to be involved in Pi adsorption (mainly to Al-oxyhydroxides) as well as Po adsorption (to Fe-oxyhydroxides or Al-saturated soil organic matter) [4]. The share of HCldil-extractable P (apatite-bound) was very small for most samples, which indicates highly weathered soils [32]. In the P-rich soil, HCldil-P was found to be in the range of 150–300 mg·kg−1, which confirms that the supply with mineral P is still high at this site. These results are in line with findings of Prietzel et al. [4] who identified apatite-P in this P-rich soil using P K-edge X-ray absorption near-edge structure (XANES) spectroscopy.
The sum of moderately labile P showed a variable distribution between PFP and soil matrix (Figure 2). In the topsoils, the P-poor to medium sites (LUE and VES) had slightly higher contents of this pool in PFPs, whereas clearly higher contents in soil matrix were observed at the medium to P-rich sites (MIT and BBR). Here, both higher Pi as well as higher Po values contributed to the increased pool contents. For the subsoils, slightly higher contents of moderately labile P in PFPs as compared to soil matrix were detected at all sites which was mainly caused by higher Po contents, especially at the P-rich site. For the P-poor site, the differences are hardly interpretable because the chemical analyses of the very low P concentrations led to high data uncertainty.
3.3. Stable P Fractions
Stable P in the soils (HClconc-Pi,o + residual-P) followed the sequence of decreasing initial TP in the order of: BBR > MIT > VES > LUE, and was characterized by low contents of Po compared to Pi in all soils (Figure 2). Elevated Po portions in the O-layer were observed at the P-poor site and at the medium site MIT (Figure 3c.3), which indicates the presence of P associated with very stable organic compounds. However, the ratio of stable P to TP in the O-layer was comparable at all sites with around 30 % of TP at the P-rich to medium sites, and slightly lower at the P-poor site with 21 %. The depth distribution of this relation showed a slight decrease with depth in the P-rich soil, but an increase in the medium P-supplied soils and particularly increased in the P-poor soil. Here, almost 50 % of the P in the subsoil is stable bound and not available for plants, which is in line with the assumption of decreasing availability of mineral-bound P from the P-rich site to the P-poor site.
The contents of stable P in PFPs and soil matrix were on the same level. Only for the P-rich soil, slightly higher values in PFPs were observed.
The distribution of P fractions revealed for the P-rich site comparable labile P concentrations as for the other sites, but a clearly lower ratio of labile P to TP, and much more Po than Pi in this pool. Considering the assumption of negligible Po mineralization [29], it can be assumed that the P-rich soil has enough labile P available from mineral sources and has no need for increased Po mineralization. Po therefore remains stable, but Pi is consumed and reduced thus relative to the amount of labile Po. This may also explain the higher ratio of moderately labile P to TP at the P-rich site compared to the other sites. In this pool, P is moderately bound to inorganic and organic compound, and can be acquired if necessary.
3.4. Factors Affecting the Distribution of P Fractions in the Soil Profiles
The statistical test of correlations between parameters included in the first step all data from the four study sites and covered a wide range of values of chemical soil properties. The results confirmed a close relationship between labile P and the contents of soil organic C and total N, which is in accordance with previous studies [4,30,33,34] (for the correlation matrix and scatter plots see Table S1 of the supplementary material). This correlation is stronger for labile Po (N: R2 = 0.98, C: R2 = 0.97) than for labile Pi (N: R2 = 0.94, C: R2 = 0.93). Also in agreement with previous studies [30,34], the easily available resin-P was strongly correlated with NaHCO3-Pi (R2 = 0.79) and NaHCO3-Po (R2 = 0.75) indicating the contribution of inorganic as well as organic labile P fractions to the resin-Pi pool.
Moderately labile P was strongly related to sesquioxides (Al, Fe, Mn). In this fraction, Pi showed close correlations to Alox, Aldi, Mnox, Mndi, and had slightly lower correlations with Feox and Fedi. Moderately labile Pi was also positively correlated with pH, but negatively correlated to the C/N ratio. By contrast, the strongest correlation of Po in this fraction was found with Fe-oxyhydroxides, and to a lesser extent with Al- and Mn-oxyhydroxides. This strong contribution of Fe compounds to Po adsorption, but the adsorption of mainly Pi to Al-oxyhydroxides, is in line with the study of Prietzel et al. [4] for acidic forest soils.
For stable P, a close correlation of Pi with Fe, Al, and Mn compounds was identified, whereas Po was strongly related to C and N. This shows that Po is occluded in stable organic compounds or particulate organic matter.
To indicate the dominant processes influencing the distribution of Pi and Po in soils, the ratio C to Po was calculated (Table 3). Low C/Po values (<200) indicate the net mineralization of P, whereas high ratios (>300) are indicative for immobilization as result of microbial Pi utilization during decomposition of organic matter [35,36]. When comparing the test sites with considerable differences in soil P contents, the C to Po ratio was highest at the P-poor site and lowest at the P-rich site. The strong reduction of C/Po with depth at all sites can be attributed to the sharp decrease of organic C compared to P. In the O-layers, C/Po was > 300 at the P-poor and medium sites, which indicates P immobilization (incorporation into biomass). C/Po-values between 200 and 300, which occurred in the O-layer of the P-rich site, indicate a stable rate of cycling between Pi and Po [35]. These findings support the hypothesis of intense P recycling at P-poor sites [6] leading to P depletion and high C to Po ratios. The C/Po ratio also differed considerably between PFP and soil matrix samples at all site with mostly clearly higher values in PFPs (Table 3). For the P-rich site, the difference between PFP and matrix was more pronounced in the topsoil and diminished with soil depth. In the P-poor soil, the contrasting behavior was observed: the difference increased with depth indicating stronger Po depletion in the subsoil PFPs.
For all chemical parameters, the differences between PFP and the soil matrix were tested statistically (for test results see Table S2 of the supplementary material). The most statistical differences were found for the P-rich site. Significantly higher values in PFPs occurred here for C, labile Po, and C to TP ratio with p < 0.01, and for N, stable Po and stable Pi with p < 0.05. For the other sites, almost no statistically significant differences of P fractions and other parameters were identified. At the P-poor site, the ratio C to TP and the C content were statistically higher in the PFPs (p < 0.05). At the medium sites, the content of metals differed substantially, with high contents of Feox, Mnox, Aldi and Mndi in PFPs, but lower values of Fedi compared to matrix samples. However, these statistical tests included all data per site and have to be considered carefully due to the hierarchical structure of the data. For the same tests at the horizon level per site, the data sets were much smaller (three samples for PFP and matrix respectively) and revealed no significant differences between PFP and matrix for all parameters (Table S3). In previous studies, Hagedorn and Bundt [18] suggested that PFPs in forest soils can be stable for decades, resulting in biological and chemical gradients between PFPs and soil matrix [15]. Bogner et al. [12] confirmed this hypothesis for PFPs along root channels and found an enrichment of C, N, Ca, Mg, and Fe in PFPs compared to the soil matrix. Such an accumulation in PFPs was also documented for different P fractions in flow pathways along stones by Backnäs et al. [19]. Our study sites are characterized by very high stone contents, resulting in very heterogeneous conditions for water and solute flow. PFPs were therefore located mostly along stone surfaces with low potential for P sorption [19], and preferential flow occurred less in root channels or other biopores where P accumulation would be expected to be more prevalent. Single biopores could be identified and sampled separately, which contained decayed root material. Indications were found in these biopores of an accumulation of labile organically bound P (Po), but could not be statistically confirmed. With respect to the distribution of subsurface flow pathways at hillslopes (midrange mountain sites), it has been shown that a predominant surface-near lateral flow does not support chemical gradients between PFPs and soil matrix. Thus, non-significant results in the statistical test are a result of specific site conditions, spatial soil heterogeneity, and analytical uncertainties with regard to very low P concentrations at the P-poor site.
Nevertheless, several factors affecting the distribution of P within the tested soils became apparent. The results showed that the labile Pi,o pool and stable Po were strongly related to C and N, whereas moderately labile Pi,o as well as stable Pi correlated with metal-oxides and -oxyhydroxides (Al, Fe, Mn). At the medium to P-rich sites, where higher contents of sesquioxide in topsoil matrix compared to PFPs were observed, moderately labile Pi and Po also was clearly higher in soil matrix. The higher Po contents of this moderately labile pool in subsoil PFPs could be related to Feox accumulated in the flow pathways.
4. Conclusions
As expected, considerable differences were found for the four study sites in both the P contents and the distribution of P fractions within the soil profiles. Despite these large differences, the labile P contents in the O-layers were in the same range of values at all sites. At the site with very low supply of P from the mineral phase, the predominant portion of labile P was available in the O-layer, but was greatly reduced in the mineral soil. This indicates that for this site intense P recycling happens in the O-layer, which is also supported by a high C to Po ratio in this layer. By contrast, labile P was available throughout the whole profile at the P-rich site. Here, the supply of plant-available P seems to be sufficient enough that there is no need for tight P recycling, and may therefore explain the very low share of labile P to TP, when compared to the P-poor site. The contents of labile and moderately labile P clearly differed in PFPs compared to soil matrix, and indicate that labile organically bound P (Po) accumulates in PFPs with a high content of organic matter. However, these results could not be proved statistically at the tested sites. Therefore, more sites particularly for soils with a higher proportion of preferential flow through biopores should be studied to verify the indications.
Supplementary Materials
The following are available online at www.mdpi.com/1999-4907/8/1/19/s1, Table S1: Correlation matrix with Spearman’s rho coefficients to test the correlation between chemical soil parameters (dataset: n = 123, includes data of four forest soils in Germany), Table S2: Results (p-values) of the non-parametric Wilcoxon rank-sum test for differences between PFPs and soil matrix samples (pair-wise test for all data per site), Table S3. Results (p-values) of the non-parametric Wilcoxon rank-sum test for differences between PFPs and soil matrix samples (pair-wise test at horizon level per sites).
Acknowledgments
We thank Gisela Ciesielski and Manuela Unger for technical support in the laboratory. Furthermore, our thanks go to Maximilian Kirsten, Jianhong Liang, Peer Appelfelder, and Nils Heide for their assistance in the field and laboratory works. Finally, we thank Dan Hawtree for helpful comments and linguistic help. This work was funded within the framework of Priority Program SPP 1685 “Ecosystem Nutrition: Forest Strategies for Limited Phosphorus Resources” by the German Research Foundation (DFG), grant No. JU 2940/1-1. We further acknowledge support by the Open Access Publication Funds of the TU Dresden.
Author Contributions
D.J. designed and performed the field experiments, and did the data analyses; all authors wrote the manuscript.
Conflicts of Interest
The authors declare no conflict of interest.
References
- Bol, R.; Julich, D.; Brödlin, D.; Siemens, J.; Kaiser, K.; Dippold, M.A.; Spielvogel, S.; Zilla, T.; Mewes, D.; von Blanckenburg, F.; et al. Dissolved and colloidal phosphorus fluxes in forest ecosystems—An almost blind spot in ecosystem research. J. Plant Nutr. Soil Sci. 2016, 179, 425–438. [Google Scholar] [CrossRef] [Green Version]
- Newman, R.H.; Tate, K.R. Soil phosphorus characterisation by 31p nuclear magnetic resonance. Commun. Soil Sci. Plant Anal. 1980, 11, 835–842. [Google Scholar] [CrossRef]
- Cade-Menun, B.; Liu, C.W. Solution phosphorus-31 nuclear magnetic resonance spectroscopy of soils from 2005 to 2013: A review of sample preparation and experimental parameters. Soil Sci. Soc. Am. J. 2014, 78, 19. [Google Scholar] [CrossRef]
- Prietzel, J.; Klysubun, W.; Werner, F. Speciation of phosphorus in temperate zone forest soils as assessed by combined wet-chemical fractionation and XANES spectroscopy. J. Plant Nutr. Soil Sci. 2016, 179, 168–185. [Google Scholar] [CrossRef]
- Walker, T.W.; Syers, J.K. The fate of phosphorus during pedogenesis. Geoderma 1976, 15, 1–19. [Google Scholar] [CrossRef]
- Lang, F.; Bauhus, J.; Frossard, E.; George, E.; Kaiser, K.; Kaupenjohann, M.; Krüger, J.; Matzner, E.; Polle, A.; Prietzel, J.; et al. Phosphorus in forest ecosystems: New insights from an ecosystem nutrition perspective. J. Plant Nutr. Soil Sci. 2016, 179, 129–135. [Google Scholar] [CrossRef]
- Prietzel, J.; Kaiser, K. De-eutrophication of a nitrogen-saturated Scots pine forest by prescribed litter-raking. J. Plant Nutr. Soil Sci. 2005, 168, 461–471. [Google Scholar] [CrossRef]
- Neary, D.G.; Ice, G.G.; Jackson, C.R. Linkages between forest soils and water quality and quantity. For. Ecol. Manag. 2009, 258, 2269–2281. [Google Scholar] [CrossRef]
- Van Miegrot, H.; Johnson, D.W. Feedbacks and synergism among biogeochemistry, basic ecology, and forest soil science. Forest Ecol. Manag. 2009, 258, 2214–2223. [Google Scholar] [CrossRef]
- Santos, R.M.B.; Sanches Fernandes, L.F.; Pereira, M.G.; Cortes, R.M.V.; Pacheco, F.A.L. A framework model for investigating the export of phosphorus to surface waters in forested watersheds: Implications to management. Sci. Total Environ. 2015, 536, 295–305. [Google Scholar] [CrossRef] [PubMed]
- Uchida, T.; Tromp-van Meerveld, I.; McDonnell, J.J. The role of lateral pipe flow in hillslope runoff response: An intercomparison of non-linear hillslope response. J. Hydrol. 2005, 311, 117–133. [Google Scholar] [CrossRef]
- Bogner, C.; Borken, W.; Huwe, B. Impact of preferential flow on soil chemistry of a podzol. Geoderma 2012, 175, 37–46. [Google Scholar] [CrossRef]
- Van der Heijden, G.; Legout, A.; Pollier, B.; Bréchet, C.; Ranger, J.; Dambrine, E. Tracing and modeling preferential flow in a forest soil—Potential impact on nutrient leaching. Geoderma 2013, 195–196, 12–22. [Google Scholar] [CrossRef]
- Van Verseveld, W.J.; McDonnell, J.J.; Lajtha, K. The role of hillslope hydrology in controlling nutrient loss. J. Hydrol. 2009, 367, 177–187. [Google Scholar] [CrossRef]
- Bundt, M.; Jäggi, M.; Blaser, P.; Siegwolf, R.; Hagedorn, F. Carbon and nitrogen dynamics in preferential flow paths and matrix of a forest soil. Soil Sci. Soc. Am. J. 2001, 65, 1529–1538. [Google Scholar] [CrossRef]
- Flury, M.; Flühler, H. Brilliant Blue FCF as a dye tracer for solute transport studies—A toxicological overview. J. Environ. Qual. 1994, 23, 1108–1112. [Google Scholar] [CrossRef]
- Weiler, M.; Flühler, H. Inferring flow types from dye patterns in macroporous soils. Geoderma 2004, 120, 137–153. [Google Scholar] [CrossRef]
- Hagedorn, F.; Bundt, M. The age of preferential flow paths. Geoderma 2002, 108, 119–132. [Google Scholar] [CrossRef]
- Backnäs, S.; Laine-Kaulio, H.; Kløve, B. Phosphorus forms and related soil chemistry in preferential flowpaths and the soil matrix of a forested podzolic till soil profile. Geoderma 2012, 189, 50–64. [Google Scholar] [CrossRef]
- Jarvis, N.J. A review of non-equilibrium water flow and solute transport in soil macropores: principles, controlling factors and consequences for water quality. Eur. J. Soil Sci. 2007, 58, 523–546. [Google Scholar] [CrossRef]
- Jensen, M.B. Subsurface transport of phosphorus in relation to its mobilization and immobilization in structured soil (steady state flow experiments). Acta Agric. Scand. Sect. B-Soil Plant Sci. 1998, 48, 11–17. [Google Scholar]
- Hedley, M.J.; Stewart, J.W.B.; Chauhan, B.S. Changes in inorganic and organic soil phosphorus fractions induced by cultivation practices and by laboratory incubations. Soil Sci. Soc. Am. J. 1982, 46, 970. [Google Scholar] [CrossRef]
- Tiessen, H.; Moir, J.O. Characterization of Available P by Sequential Extraction. In Soil Sampling and Methods of Analysis; Carter, M.R., Gregorich, E.G., Eds.; Canadian Society of Soil Science: Boca Raton, FL, USA, 2008; Chapter 25; pp. 293–306. [Google Scholar]
- Sibbesen, E. A simple ion-exchange resin procedure for extracting plant-available elements from soil. Plant Soil 1977, 46, 665–669. [Google Scholar] [CrossRef]
- Murphy, J.; Riley, J.P. A modified single solution method for the determination of phosphate in natural waters. Anal. Chim. Acta 1962, 27, 31–36. [Google Scholar] [CrossRef]
- O’Halloran, I.P.; Cade-Menun, B.J. Total and Organic Phosphorus. In Soil Sampling and Methods of Analysis; Carter, M.R., Gregorich, E.G., Eds.; Canadian Society of Soil Science: Boca Raton, FL, USA, 2008; pp. 265–291. [Google Scholar]
- Crews, T.E.; Brookes, P.C. Changes in soil phosphorus forms through time in perennial versus annual agroecosystems. Agric. Ecosyst. Environ. 2014, 184, 168–181. [Google Scholar] [CrossRef]
- Negassa, W.; Leinweber, P. How does the Hedley sequential phosphorus fractionation reflect impacts of land use and management on soil phosphorus: A review. J. Plant Nutr. Soil Sci. 2009, 172, 305–325. [Google Scholar] [CrossRef]
- Bünemann, E.K.; Augstburger, S.; Frossard, E. Dominance of either physicochemical or biological phosphorus cycling processes in temperate forest soils of contrasting phosphate availability. Soil Biol. Biochem. 2016, 101, 85–95. [Google Scholar] [CrossRef]
- Tiessen, H.; Stewart, J.W.B.; Cole, C.V. Pathways of phosphorus transformations in soils of differing pedogenesis. Soil Sci. Soc. Am. J. 1984, 48, 853. [Google Scholar] [CrossRef]
- Renneson, M.; Dufey, J.; Legrain, X.; Genot, V.; Bock, L.; Colinet, G. Relationships between the P status of surface and deep horizons of agricultural soils under various cropping systems and for different soil types: A case study in Belgium. Soil Use Manag. 2013, 29, 103–113. [Google Scholar] [CrossRef]
- Hashimoto, Y.; Watanabe, Y. Combined applications of chemical fractionation, solution 31P-NMR and P K-edge XANES to determine phosphorus speciation in soils formed on serpentine landscapes. Geoderma 2014, 230, 143–150. [Google Scholar] [CrossRef]
- Frizano, J.; Johnson, A.H.; Vann, D.R.; Scatena, F.N. Soil phosphorus fractionation during forest development on landslide scars in the Luquillo Mountains, Puerto Rico. Biotropica 2002, 34, 17–26. [Google Scholar] [CrossRef]
- Thomas, S.M.; Johnson, A.H.; Frizano, J.; Vann, D.R.; Zarin, D.J.; Joshi, A. Phosphorus fractions in montane forest soils of the Cordillera de Piuchué, Chile: Biogeochemical implications. Plant Soil 1999, 211, 139–148. [Google Scholar] [CrossRef]
- McDowell, R.W.; Stewart, I. The phosphorus composition of contrasting soils in pastoral, native and forest management in Otago, New Zealand: Sequential extraction and 31P NMR. Geoderma 2006, 130, 176–189. [Google Scholar] [CrossRef]
- Stutter, M.I.; Shand, C.A.; George, T.S.; Blackwell, M.S.A.; Dixon, L.; Bol, R.; MacKay, R.L.; Richardson, A.E.; Condron, L.M.; Haygarth, P.M. Land use and soil factors affecting accumulation of phosphorus species in temperate soils. Geoderma 2015, 257, 29–39. [Google Scholar] [CrossRef]
Figure 1.
Scheme of tracer experiments (A): Dye application at the soil surface (1 m²), covering overnight, and excavation of five vertical (1 m²) profile cuts (example on the right (B)). The black framed enlargement shows staining of flow pathways along roots and stone surfaces.
Figure 1.
Scheme of tracer experiments (A): Dye application at the soil surface (1 m²), covering overnight, and excavation of five vertical (1 m²) profile cuts (example on the right (B)). The black framed enlargement shows staining of flow pathways along roots and stone surfaces.
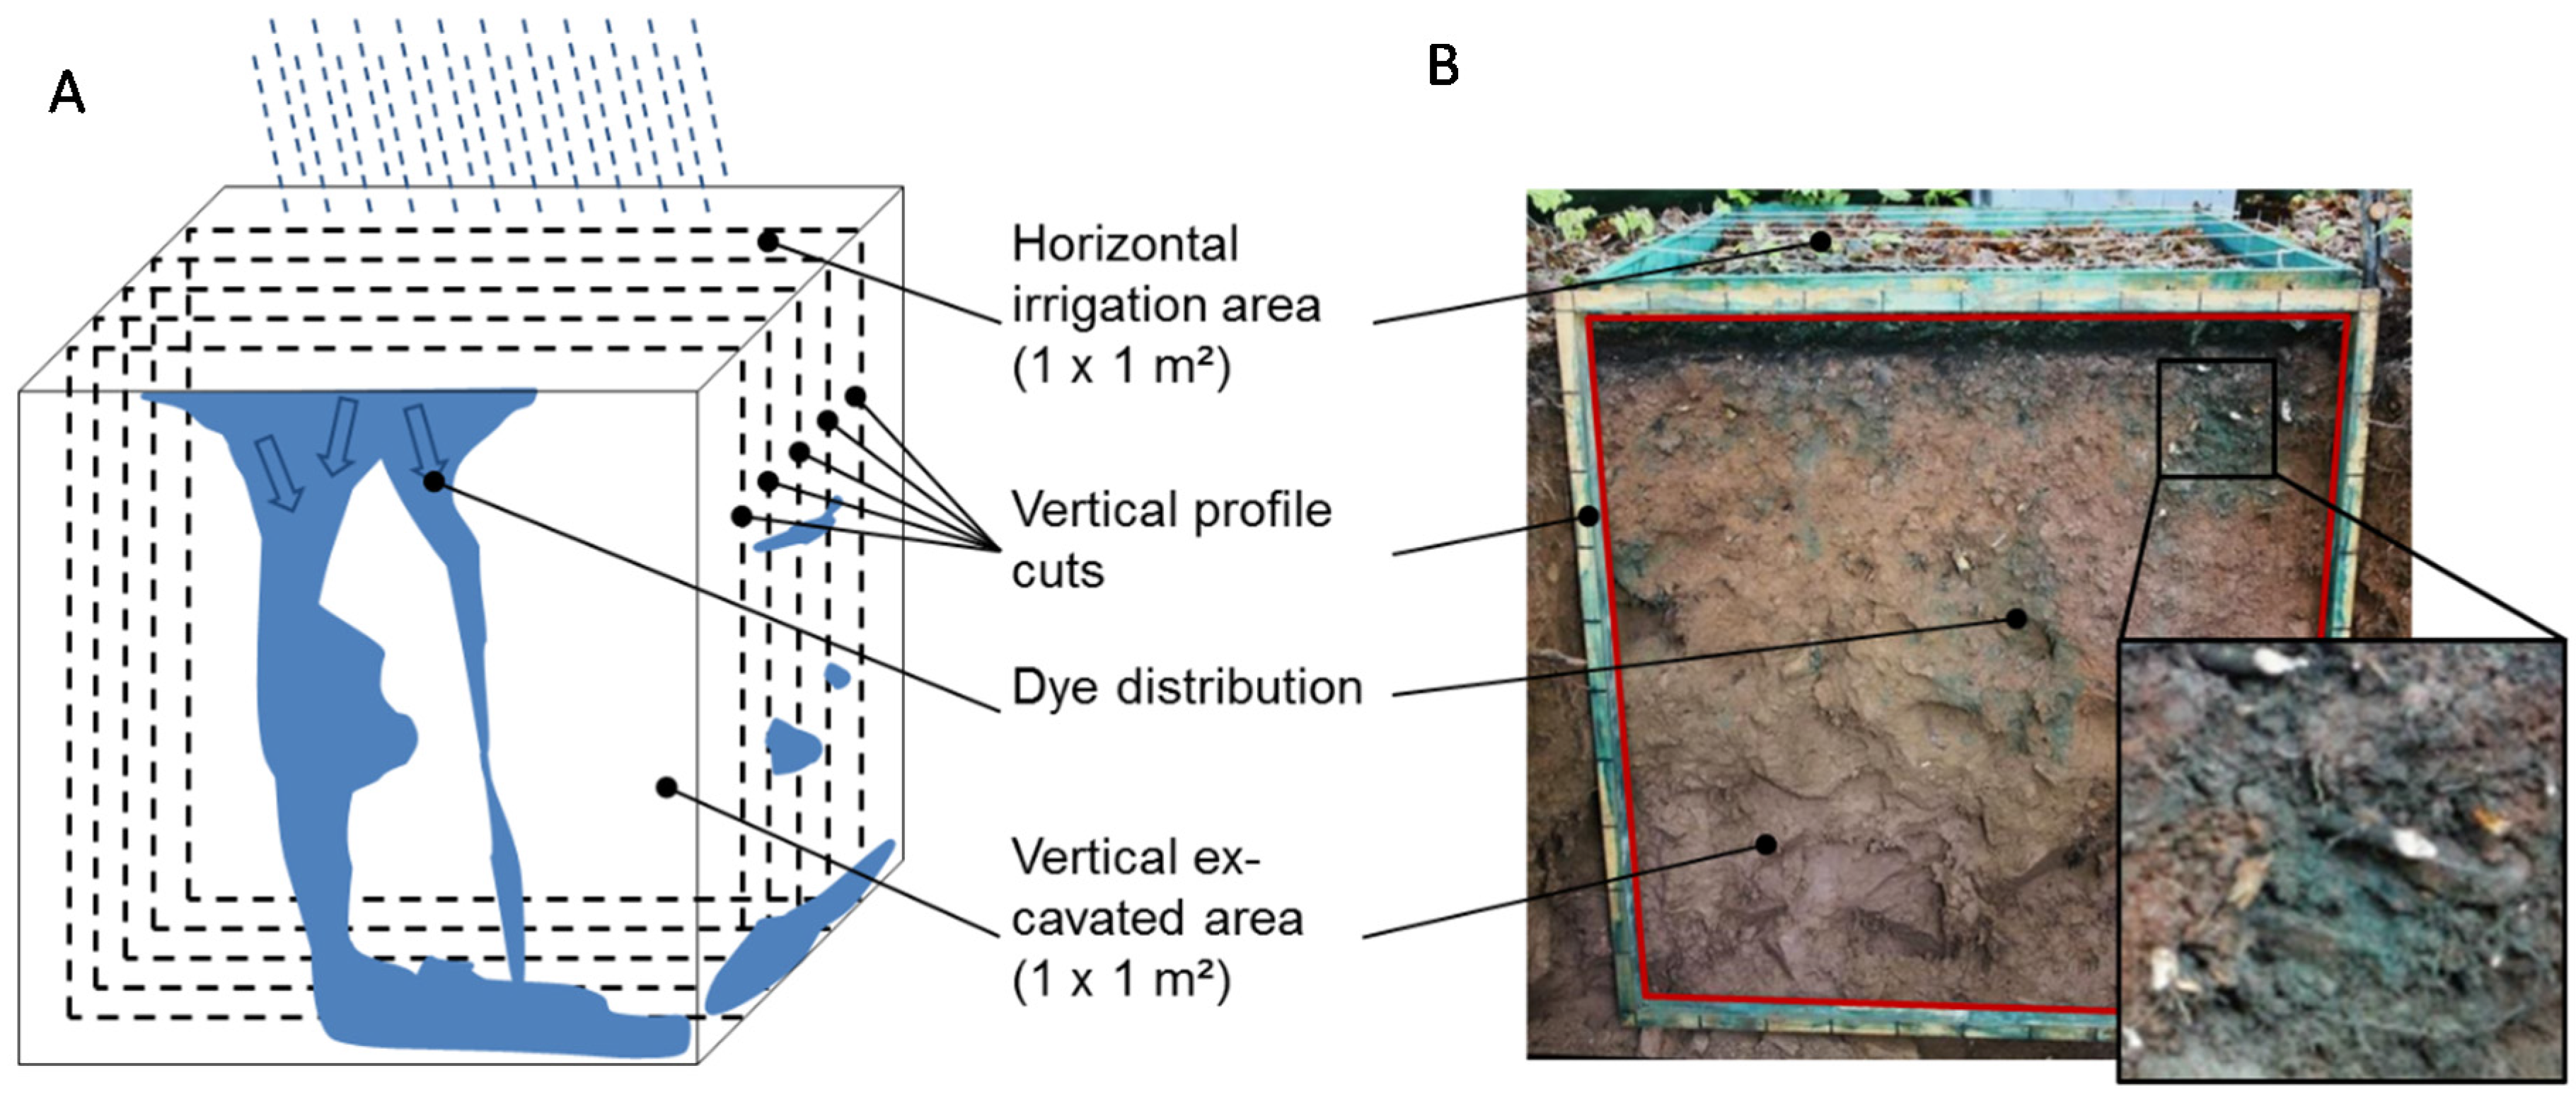
Figure 2.
Phosphorus fractions summarized as labile (resin-Pi + NaHCO3-Pi,o), moderately labile (NaOH-Pi,o + HCldil-Pi), and stable P (HClconc-Pi,o + residual-P) for PFP (preferential flow pathways) and MA (soil matrix) samples; n.d., no data available; study sites in the sequence P-poor to P-rich are: LUE, Lüss, Lower Saxony; VES, Vessertal, Thuringian Forest; MIT, Mitterfels, Bavarian Forest; BBR, Bad Brückenau, Bavarian Rhön Mountains.
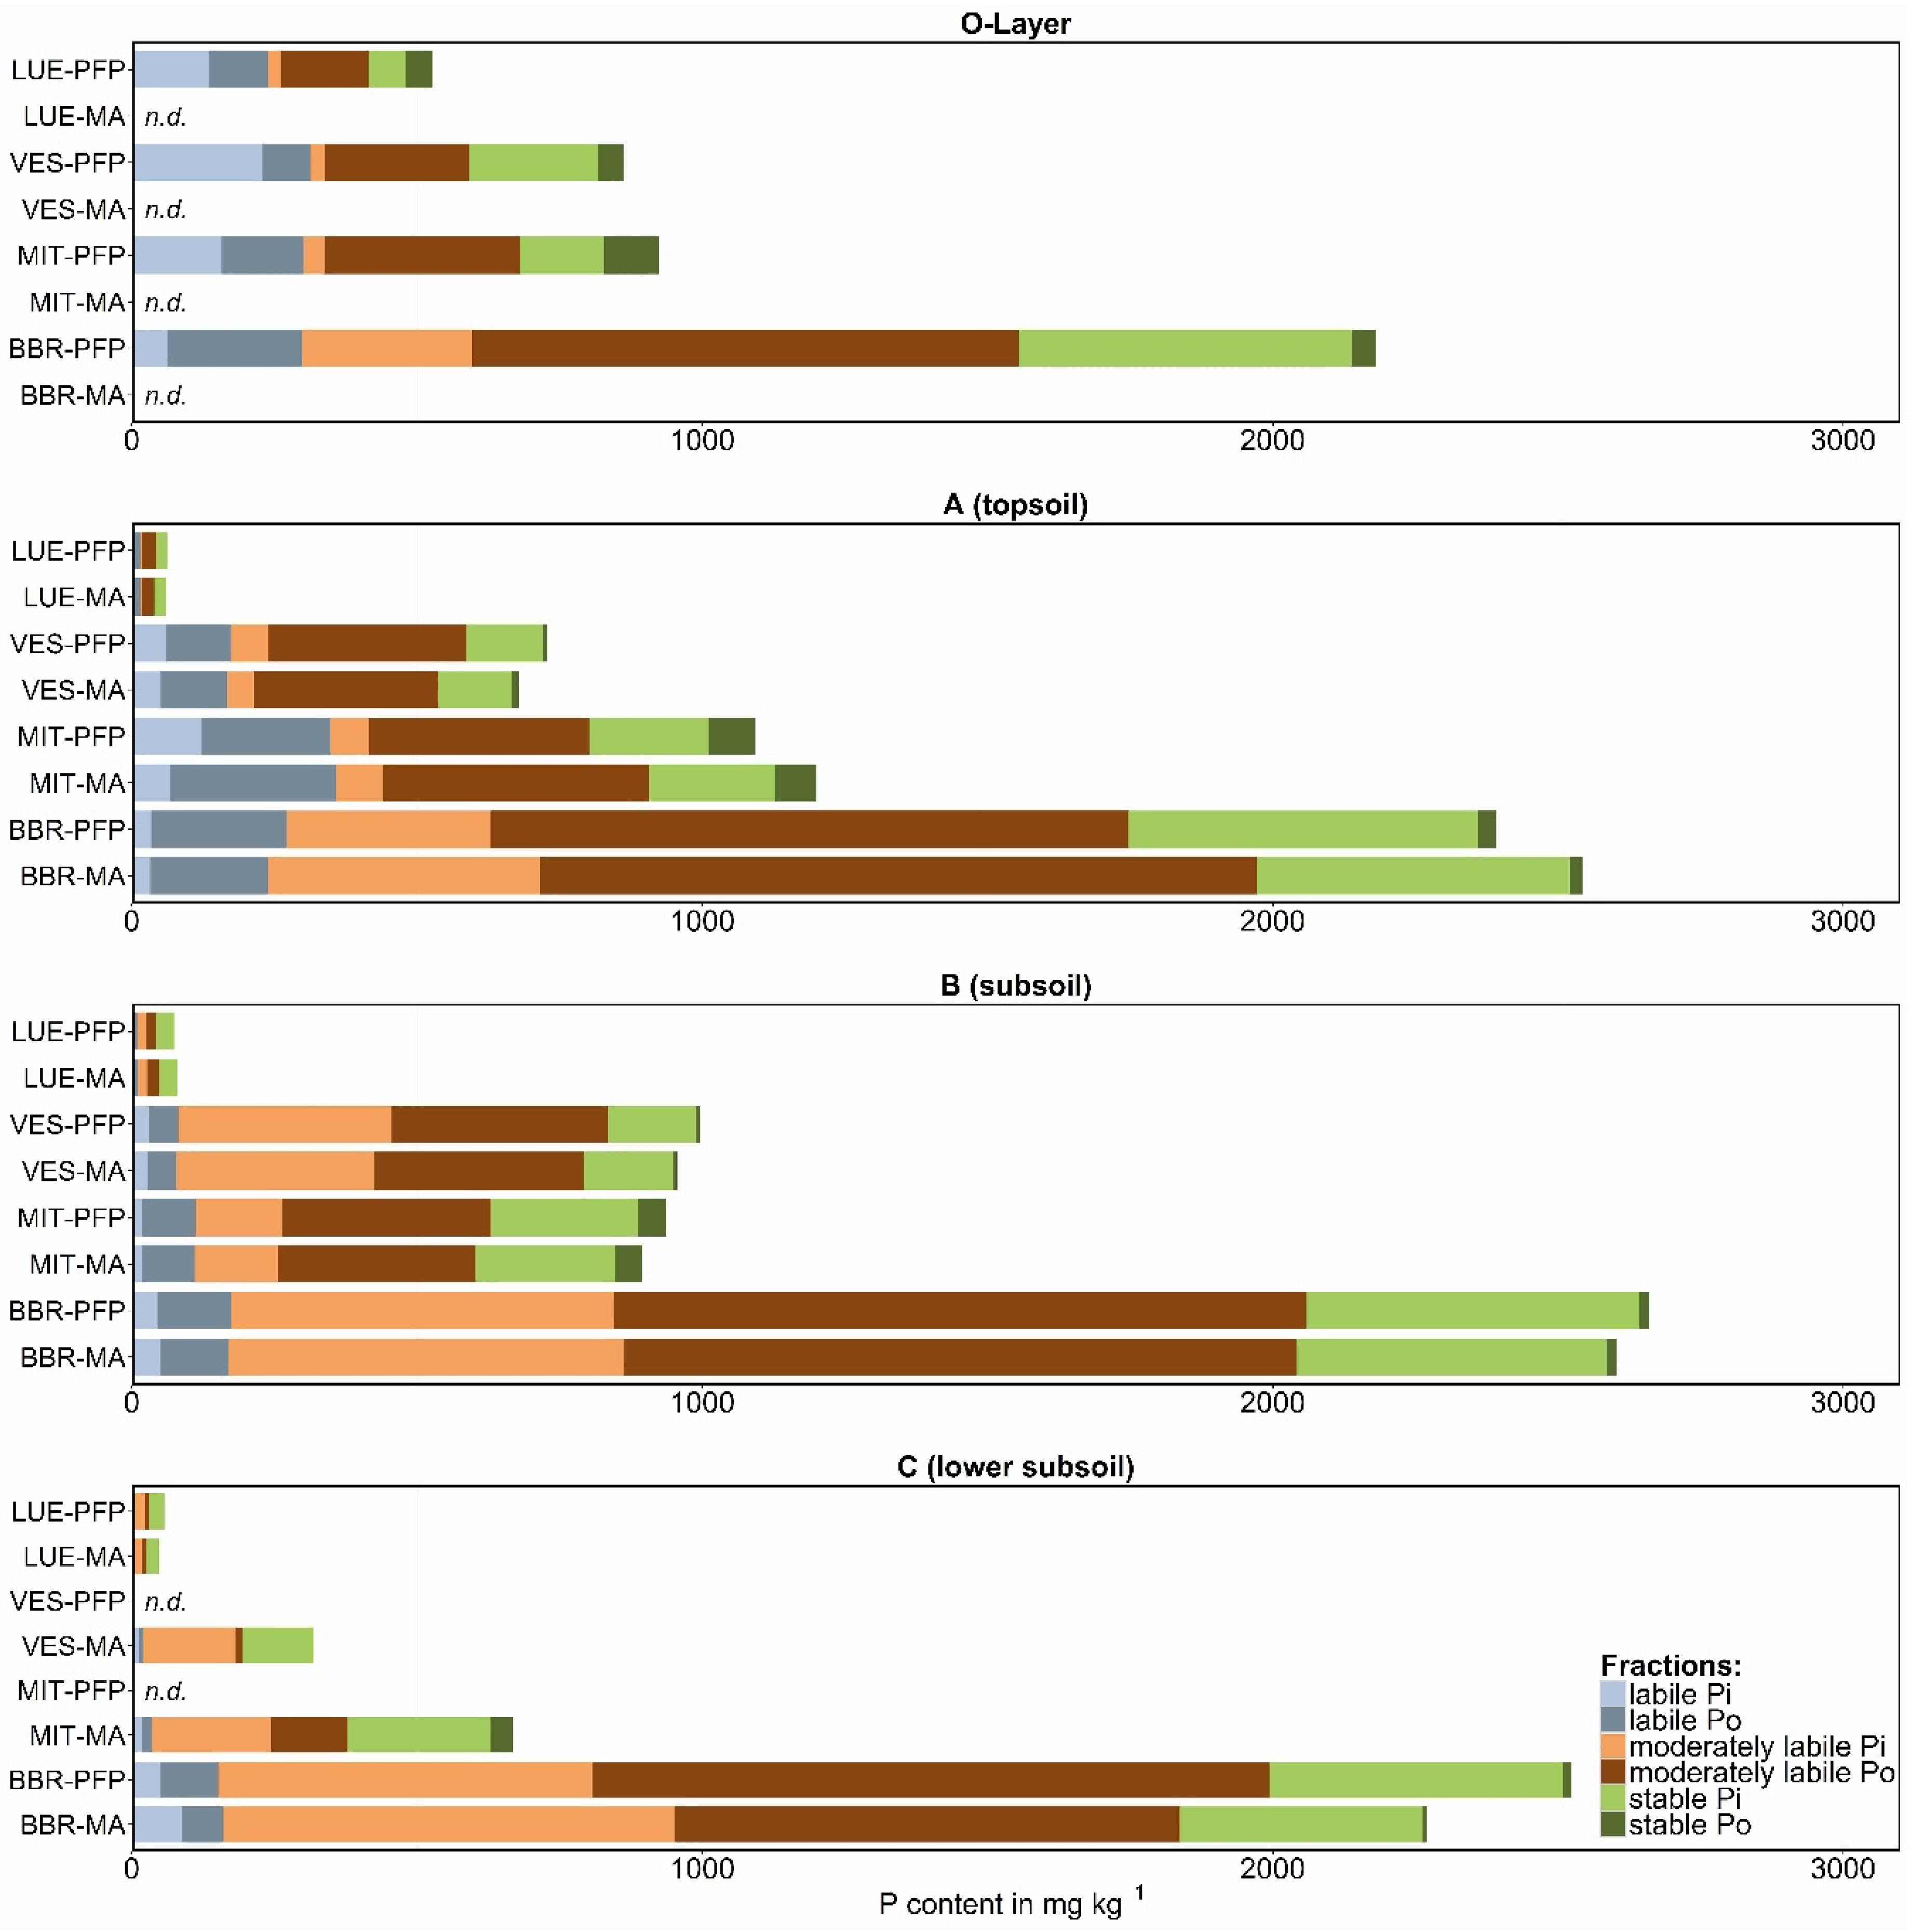
Figure 3.
Share of a.1) the labile (resin-Pi + NaHCO3-Pi,o), b.1) moderately labile (NaOH-Pi,o + HCldil-Pi), and c.1) stable (HClconc-Pi,o + residual-P) fractions on total P (TP) in organic layer (O) and soil (A, B, C horizons). Share of inorganic P (a.2: labile Pi, b.2: moderately labile Pi, c.2: stable Pi) and organically bound P (a.3: labile Po, b.3: moderately labile Po, c.3: stable Po) on the particular pools. Error bars: standard deviation of three samples (profile cuts). Study sites in the sequence P-poor to P-rich are: LUE, Lüss, Lower Saxony; VES, Vessertal, Thuringian Forest; MIT, Mitterfels, Bavarian Forest; and BBR, Bad Brückenau, Bavarian Rhön Mountains.

| LUE | VES | MIT | BBR | |
|---|---|---|---|---|
| Location | 52°50′32′′ N 10°16′06′′ E | 50°36′26′′ N 10°46′20′′ E | 48°58′35′′ N 12°52′49′′ E | 50°21′38′′ N 9°55′71′′ E |
| Elevation (m a.s.l.) | 115 | 810 | 1023 | 809 |
| MAT (°C) | 8.0 | 5.5 | 4.5 | 5.8 |
| MAP (mm) | 779 | 1200 | 1229 | 1031 |
| Parent material | Pleistocene sands | Trachyandesite | Gneiss | Basalt |
| Soil type (WRB *) | Dystric skeletic Cambisol | Hyperdystric skeletic folic Cambisol | Hyperdystric skeletic chromic Cambisol | Hyperdystric folic Cambisol |
LUE: Lüss (Lower Saxony); VES, Vessertal (Thuringian Forest); MIT, Mitterfels (Bavarian Forest); BBR, Bad Brückenau (Bavarian Rhön Mountains); MAT, Mean annual temperature; MAP, Mean annual precipitation; * World Reference Base for Soil Resources 2014, World Soil Resources Reports 106, FAO, Rome, Italy.
| Study Site/ | Depth | Texture | pH | C | N | Alox | Aldi | Feox | Fedi | Pox | TP |
|---|---|---|---|---|---|---|---|---|---|---|---|
| Horizon | (cm) | (CaCl2) | (%) | (%) | (g·kg−1) | ||||||
| Lüss (LUE) | |||||||||||
| O | 9 to 0 | 2.8 | 36.63 | 1.59 | 0.73 | 0.79 | 0.87 | 1.30 | 0.15 | 0.49 | |
| A | 0 to −12 | Loamy sand | 3.0 | 1.69 | 0.07 | 0.18 | 0.37 | 0.29 | 2.17 | <0.04 | 0.06 |
| B | −12 to −52 | Loamy sand | 3.7 | 0.90 | 0.04 | 1.04 | 1.00 | 1.40 | 3.21 | <0.04 | 0.08 |
| C | −52 to −100 | Sand | 4.3 | 0.12 | 0.01 | 0.50 | 0.41 | 0.15 | 1.01 | <0.04 | 0.04 |
| Vessertal (VES) | |||||||||||
| O | 4 to 0 | 3.4 | 32.17 | 1.72 | 4.11 | 1.20 | 1.28 | 1.75 | 0.30 | 0.86 | |
| A | 0 to −3 | Sandy loam | 3.0 | 7.49 | 0.45 | 2.75 | 1.68 | 3.14 | 7.46 | 0.53 | 0.70 |
| B | −3 to −65 | Sandy loam | 4.1 | 3.03 | 0.20 | 9.44 | 7.40 | 5.13 | 9.23 | 0.83 | 0.98 |
| C | −65 to −100 | Loamy sand | 4.1 | 0.37 | 0.03 | 4.64 | 2.83 | 0.59 | 5.55 | 0.16 | 0.32 |
| Mitterfels (MIT) | |||||||||||
| O | 4 to 0 | 3.5 | 44.12 | 2.19 | 0.95 | 0.87 | 1.28 | 1.45 | 0.34 | 0.88 | |
| A | 0 to −4 | Silt loam | 3.0 | 35.50 | 2.05 | 3.32 | 3.83 | 3.58 | 4.97 | 0.47 | 1.14 |
| B | −4 to −80 | Silt loam | 3.9 | 5.45 | 0.34 | 6.26 | 5.62 | 8.05 | 12.17 | 0.53 | 0.91 |
| C | −80 to −100 | Loamy sand | 4.3 | 1.09 | 0.09 | 5.73 | 4.63 | 3.61 | 10.89 | 0.35 | 0.66 |
| Bad Brückenau (BBR) | |||||||||||
| O | 3 to 0 | 4.6 | 27.33 | 1.68 | 5.53 | 5.51 | 15.27 | 21.85 | 1.29 | 2.24 | |
| A | 0 to −7 | Silty clay | 4.2 | 17.57 | 1.28 | 7.77 | 8.30 | 21.15 | 31.52 | 1.51 | 2.45 |
| B | −7 to −30 | Silt clay loam | 4.3 | 7.45 | 0.54 | 10.58 | 10.83 | 24.46 | 35.41 | 1.84 | 2.62 |
| C | −30 to −65 | Loam | 4.5 | 4.60 | 0.34 | 10.70 | 9.57 | 18.87 | 25.92 | 1.63 | 2.39 |
Horizon: O—organic layer, A—topsoil horizon, B—subsoil horizon, C—lower subsoil horizon containing weathered parent material. Values for C and N are total contents (for C this equals organic C); Alox, Feox, and Pox—ammonium oxalate-extractable contents; Aldi and Fedi—dithionite-extractable contents; TP—total P contents.
Table 3.
Ratios of organic C to sum of organic P (Po) at four beech forest study sites in Germany for PFP (preferential flow pathways), Ma (soil matrix), and RC (root channel-PFP) samples.
| C/Po | LUE | VES | MIT | BBR | ||||
|---|---|---|---|---|---|---|---|---|
| Horizon | PFP | Ma | PFP | Ma | PFP | Ma | PFP | Ma |
| O | 1143 | 840 | 910 | 223 | ||||
| A | 512 | 494 | 155 | 174 | 593 | 371 | 139 | 97 |
| B | 356 | 274 | 89 | 66 | 101 | 93 | 58 | 51 |
| C | 204 | 88 | 170 | 59 | 42 | 43 | ||
Horizon: O—organic layer; A—topsoil horizon; B—subsoil horizon; C—lower subsoil horizon containing weathered parent material. Study sites in the sequence P-poor to P-rich are: LUE—Lüss, Lower Saxony; VES—Vessertal, Thuringian Forest; MIT—Mitterfels, Bavarian Forest; and BBR—Bad Brückenau, Bavarian Rhön Mountains.
© 2016 by the authors; licensee MDPI, Basel, Switzerland. This article is an open access article distributed under the terms and conditions of the Creative Commons Attribution (CC-BY) license (http://creativecommons.org/licenses/by/4.0/).
Share and Cite
MDPI and ACS Style
Julich, D.; Julich, S.; Feger, K.-H. Phosphorus in Preferential Flow Pathways of Forest Soils in Germany. Forests 2017, 8, 19. https://doi.org/10.3390/f8010019
AMA Style
Julich D, Julich S, Feger K-H. Phosphorus in Preferential Flow Pathways of Forest Soils in Germany. Forests. 2017; 8(1):19. https://doi.org/10.3390/f8010019
Chicago/Turabian StyleJulich, Dorit, Stefan Julich, and Karl-Heinz Feger. 2017. "Phosphorus in Preferential Flow Pathways of Forest Soils in Germany" Forests 8, no. 1: 19. https://doi.org/10.3390/f8010019
Note that from the first issue of 2016, this journal uses article numbers instead of page numbers. See further details here.