Article

Influence of Forest Harvest on Nitrate Concentration in Temperate Streams—A Meta-Analysis

by
Anne-Christine Mupepele
*,† and
Carsten F. Dormann
Biometry and Environmental System Analysis, University of Freiburg, 79106 Freiburg, Germany
*
Author to whom correspondence should be addressed.
Current address: Tennenbacherstr. 4, 79106 Freiburg, Germany
Forests 2017, 8(1), 5; https://doi.org/10.3390/f8010005
Submission received: 18 October 2016 / Revised: 15 December 2016 / Accepted: 16 December 2016 / Published: 22 December 2016

Abstract

:
Forest harvest alters natural nutrient cycles, which is reflected in stream water run-off from harvested catchments. Nitrate is an essential nutrient for plant growth, but increased concentrations in rivers, lakes, and oceans have contributed to eutrophication and anoxic conditions. Based on a literature review, we assessed the impact of three different harvest methods—clearcut, patchcut, and selective harvest—on nitrate concentrations in temperate forest streams. In a meta-analysis, the influence of harvest methods and additional environmental variables was analysed. Nitrate concentrations are significantly influenced by harvest methods, forest composition, site altitude, and time passed after the harvesting. The remaining unexplained between-site variability is small compared to the between-site variability explained by the model, indicating the model’s validity. The effect of forest harvest is most pronounced in coniferous and deciduous forests, where clearcuts and patchcuts result in high nitrate run-off three to five years after harvest. Mixed forest plots can compensate for clearcut and patchcut, and do not show a significantly increased nitrate concentration after harvest. Selective harvest at low intensities succeeded in maintaining nitrate levels similar to control or pre-harvest levels in coniferous and mixed forests, and showed a positive but not significant trend in deciduous forests. Coniferous and deciduous monocultures clearly face the problem that nitrate wash-out cannot be minimized by reducing clearcut to patchcut harvest, whereas mixed forests are more suitable to diminish nitrate wash-out in both clearcut and patchcut.

1. Introduction

Stream water quality is influenced by the surrounding landscape, with minerals and salts from the soil leaching into the water [1]. Nitrogen in particular plays a major role in the eutrophication of rivers and lakes and anoxia in coastal oceans [2,3]. It is the main component of agricultural fertilizers, and the increased use of fertilizers is strongly related to an increase in nitrate leaching into nearby rivers [4,5]. Regulations such as the EU Water Framework Directive and the US Clean Water Act attempt to protect water quality and ensure a good status of surface water and groundwater [6,7,8,9]. Compared to agricultural areas, water draining from forested watersheds has lower nitrate concentrations [10,11,12]. Nevertheless, forest harvest can result in an increased run-off and nutrient loss [13,14,15]. Streamside management zones can reduce nutrient loss [9,16,17], whereas clearcut leads to an increased stream-nitrate concentration, which has been documented in several study sites (e.g., Plynlimon in the UK, Hubbard Brook and Coweeta Experimental Forests in the USA [18,19,20]). The duration of nitrate run-off and the long-term consequences have received less attention, and so far there has been no endeavour to systematically synthesize forest harvest effects on stream nitrate concentration and their long-term consequences [13,21,22]). Furthermore, forest harvest practices beyond clearcutting—but which are of increasing importance, especially in Central Europe—are less well investigated [13]. In the light of increasing demand for bioenergy and the increased pressure on harvest, forest management is likely to change in the near future [23].
Nitrate concentrations in streams are potentially influenced by the type of forest harvest and other environmental variables accounting for forest management, temporal changes, and site-specific characteristics [24]. Leaves from deciduous forests have another decomposition rate than needles from conifers, and may influence the nitrate leaching from soils to streams [25,26]. N deposition can change absolute values for nitrate output in streams [27], but may have no impact on the difference between harvested and non-harvested control sites adjacent to each other. We hypothesized that nitrate patterns follow a temporal trend, and differences between harvested and control sites are largest in the year following the intervention. In a meta-analysis of the effects of forest harvesting on stream nitrate concentrations, we quantitatively synthesize knowledge gained in individual studies to extract patterns, independent from individual features of research sites, as well as highlighting research gaps to encourage future efforts. Our objective was to find out whether different forest harvest types (clearcut, patchcut, and selective harvest) influence the nitrate concentrations in streams in comparison to unharvested control sites. We further investigated whether other environmental variables could predict differences in nitrate concentrations between harvested and control sites.

2. Methods

2.1. Literature Search and Data Extraction

A scoping literature search according to the Collaboration for Environmental Evidence [28] evaluated relevant search terms, and resulted in a Web of Science search on 25 March 2015 at the University of Freiburg with the topic search terms: (‘water quality’ OR nitrogen OR nitrate OR nitrite OR ‘nonpoint source pollution’ OR ‘nonpoint-source pollution’) AND (stream* OR river*) AND *forest* AND (manage* OR liming OR clear-cut* OR clearcut* OR logging OR harvest* OR deforestation OR thinning OR selective) NOT (*tropic* OR boreal OR mangrove OR South*Asia OR Africa* OR Brazil* OR Marine). Articles with agricultur* in the title were excluded with the option NOT agricultur* in ‘Title’. Excluding articles with agriculture in the title was necessary to avoid hitting a large amount of literature comparing run-off from agricultural fields and forest, which was beyond the scope of this study.
Box 1. Inclusion criteria.
-
The site was situated in a temperate region, defined according to the nemoral zonobiom in Walter and Breckle [29], covering Central and Eastern Europe, the United Kingdom, large parts of Eastern North America, and smaller parts in Western North America. It equally covers New Zealand, Korea, and Eastern China.
-
At least half of the catchment had to be covered by the treated forest to minimize the risk of being influenced by a second unmeasured change in the catchment.
-
Forest management needed to be clearly described. Forest should be a main subject in the abstract, so that we could assume that the management is described in detail in the main text.
-
Water quality had to be measured in streams or rivers. No soil or lake water quality was considered.
-
Nitrogen was given in the form of nitrate or nitrate-nitrogen as response variable to forest management. Studies were excluded if the abstract contained no hint that water chemistry was measured.
-
The study design needed to provide a control, and was either a control–impact or a before–after experimental design.
Title and abstract of the articles were screened according to a set of inclusion criteria (Box 1). Two assessors screened a subset of first 100 and then another 500 studies, and differences in their assessment were discussed. From then on, studies were screened by one of the two assessors. Articles that went into full-text reading were checked for additional inclusion criteria:
-
Forest harvest could be classed into one of the following categories: clearcut, selective harvest, or patchcut.
-
Time of nitrate measurement was given in relation to the forest harvest (e.g., measured in the first year after clearcut).
Data were extracted from publications that met the inclusion criteria. Data from long-term research sites happened to be used several times in different publications. Special care was taken to include these duplicated data only once. Annual mean nitrate concentration, standard deviation, and sample size were extracted from text, tables, and figures for all harvested and control sites. If no control site was available, before-harvest values were taken as comparison. Aside from before–after control–impact (BACI) studies, which have a preharvest calibration phase [12,30], we also included 16 before–after and 13 control–impact studies, as their results did not systematically differ from the 23 BACI studies. WebPlotDigitizer was used to extract data points from figures [31]. Nitrogen-nitrate was converted to N O 3 - in μ g/L. Two studies [32,33] did not provide enough data to extract the annual standard deviation, and we estimated standard deviation according to Bracken [34] and Lajeunesse [35], considering the relationship between effect size and variance in all other studies.
Environmental variables were recorded to explain variability in the effect sizes and account for site-to-site differences. In total, nine variables were extracted from every study: harvest year, time after harvest (years after harvest intervention), catchment size of the harvested watershed (ha), mean annual temperature ( C), annual precipitation (mm/annum), altitude (m a.s.l.), and three components of forest management: forest harvest, forest age (years), and forest composition (Table 1). Forest composition was classified as coniferous, mixed, and deciduous stands. Coniferous stands were covered at least 90% with coniferous trees, and deciduous stands had less than 10% coniferous trees.
Forest harvest was categorized as clearcut, patchcut, or selective harvest. Clearcut was defined as tree removal of at least 90% of the forest. Patchcut meant the removal trees in patches of variable sizes, and we further distinguished patchcut into two different intensities: high intensity (meaning that at least 45% of all trees were removed in patches) and low intensity (including forests with less than 45% of forest removal). Selective harvest implies harvesting of individual trees selected according to different criteria (e.g., shelterwood forestry), and we equally distinguished into high intensity with at least 45% of trees removed and low intensity reflecting less than 45% tree removal (classification adapted from [26]).

2.2. Statistical Analysis

All statistical analyses were conducted in R [36], using packages nlme [37] and metafor [38]. To investigate changes in nitrate concentration, the standardized mean difference Hedges’ d and the corresponding variance were used to compute effect sizes [39]. H e d g e s d = X t ¯ - X c ¯ S pooled · J ; where X t is the nitrate concentration in the harvested and X c the concentration in the control forest or before the harvest intervention (Table S1); S pooled is the within-study variance, and J a correction factor for small sample size.
Effect sizes were used in a meta-analysis to quantify and test the relationship between forest harvest, temporal trends, and other environmental predictors which cannot be accomplished by a narrative review. The meta-analysis was realized in the form of an additive mixed model (Equation (1)) to assess the influence of nine environmental predictors on the effect size reflecting changes in nitrate concentrations. Subsequent model selection was based on the F-statistic, and parameters were estimated with maximum likelihood. We assumed that the time after intervention influences the effect size, but not necessarily linearly, and eventually gets back to pre-harvest level after a certain time. Splines on the “time after harvest” allowed flexible functions of time to be fit . Most sites were measured over several years after the forest harvest, resulting in several non-independent effect sizes. The model included the non-independence of effect sizes, taken in subsequent years on the same site, in the form of a temporal autocorrelation structure with time lag one [40] and nested in a random effect for sites.
y i = β 0 + β 1 x 1 i + β 2 x 2 i + β 3 x 3 i + f ( t i ) + γ 0 j + γ 1 j · t i + ϵ i ; for ϵ i N ( 0 , Ω )
where y i are effects sizes per site and year, x i are environmental variables, f ( t i ) represents the regression spline on the time after harvest, γ 0 j & γ 1 j are random intercept and random slope for time in the j-th study, and Ω is the variance–covariance matrix fitting a continuous time AR(1) structure [41]. Subgroup analysis was done for each harvest type and forest composition ([42] [S2]) .

2.2.1. Between-Site Variability

In linear regressions, we are usually interested in how much of the variance is explained by the model, mainly computed as R2, a ratio of explained to total variance. In a meta-analysis, the total variance is partitioned into between-study variability—also called heterogeneity—and within-study variability. The between-study variability T 2 is given by the variance of the random effect in linear-mixed models. In our meta-analysis, there are several sites per study, and we are actually interested in the between-site variability. The between-site variability of the effect sizes may have changed over the years. We expected a lower variability after a few years due to a diminishing management effect. Models with random slope on “time after harvest” nested in sites were used and performance compared to models with random intercept on sites using the Akaike Information Criterion (AIC).
We further included predictors in our model that explained part of the between-site variability resulting in an estimated between-site variability of T total 2 = T explained 2 + T unexplained 2 . Total between-site variability ( T total 2 ) was estimated as the variance of the random effect of a model without predictors, and unexplained between-site variability ( T unexplained 2 ) was given by the variance of the random effect of the model with predictors ([42], p. 200).
In meta-analysis, I2 is the proportion of the between-site variance to the total variance [43,44]. In meta-regression, part of the between-site variance is explained by predictors. Of main interest is the contribution of the unexplained between-site variability to the total unexplained variance, which is the unexplained between-site variability plus within-site variance. Thus, we calculated I unexpl 2 = T unexplained 2 ( T unexplained 2 + S 2 ) ; S 2 is the estimated within-site variance according to Nakagawa and Santos [45]. In addition, the between-site variance changed over the years (random slope on time after harvest), and we were therefore interested in the annual ratio of unexplained between-site variability and total unexplained variance (S2).

2.2.2. Study Weights

Meta-analysis has been criticized for its “garbage in, garbage out” problem; i.e., combining weak studies and carrying over fundamental errors of primary studies to the meta-analysis [42]. Studies are commonly weighted according to their inverse variance, with the assumption that the study variance was known. Study variance alone may not reflect reliability of results and sufficiently down-weigh unreliable studies. To avoid giving a strong weight to poor-quality studies, we decreased the weight of weak studies by multiplying the variance of each site with the level of evidence of the study. Levels of evidence were assessed by combining study design and study quality criteria to derive the reliability of underlying study results (sensu [46]). We investigate the consequences of this approach below.

2.2.3. Publication Bias

Publication bias occurs because not all results are published, particularly non-significant results may remain in the drawer [45,47,48]. Egger’s regression test detects publication bias, which is reflected in an asymmetric distribution of effect sizes [49]. As the distribution of effect sizes may be explained by covariates, a modified version of the Egger’s regression test was used, testing the weighted normalized residuals from the additive mixed model against their standard error [45,50].

3. Results

3.1. Data Extraction and Description

The literature search resulted in 2180 publications in Web of Science. Title and abstract screening by two assessors agreed in 74 of the first 100 studies, and after discussing the divergences, the level of agreement could be increased to 82% for the next 500 studies. Title and abstract screening resulted in 216 studies that were retained for full-text reading. Full-text reading resulted in 21 peer-reviewed papers and 3 raw-data sets. References of papers led to one additional study. The extracted 52 paired-watershed sites were measured over several years, resulting in 348 effects sizes (one effect size per year per site, Table S1).
Most of the 25 studies were conducted in the United States (15), followed by Japan (4), the UK (3), and one study each in Germany, Ireland, and New Zealand. They cover time series up to 40 years, and there was one study that measured the impact of forest harvest in the 53rd and 54th year after harvest [51]. Most data are available for the first ten years after harvest (Figure 1).

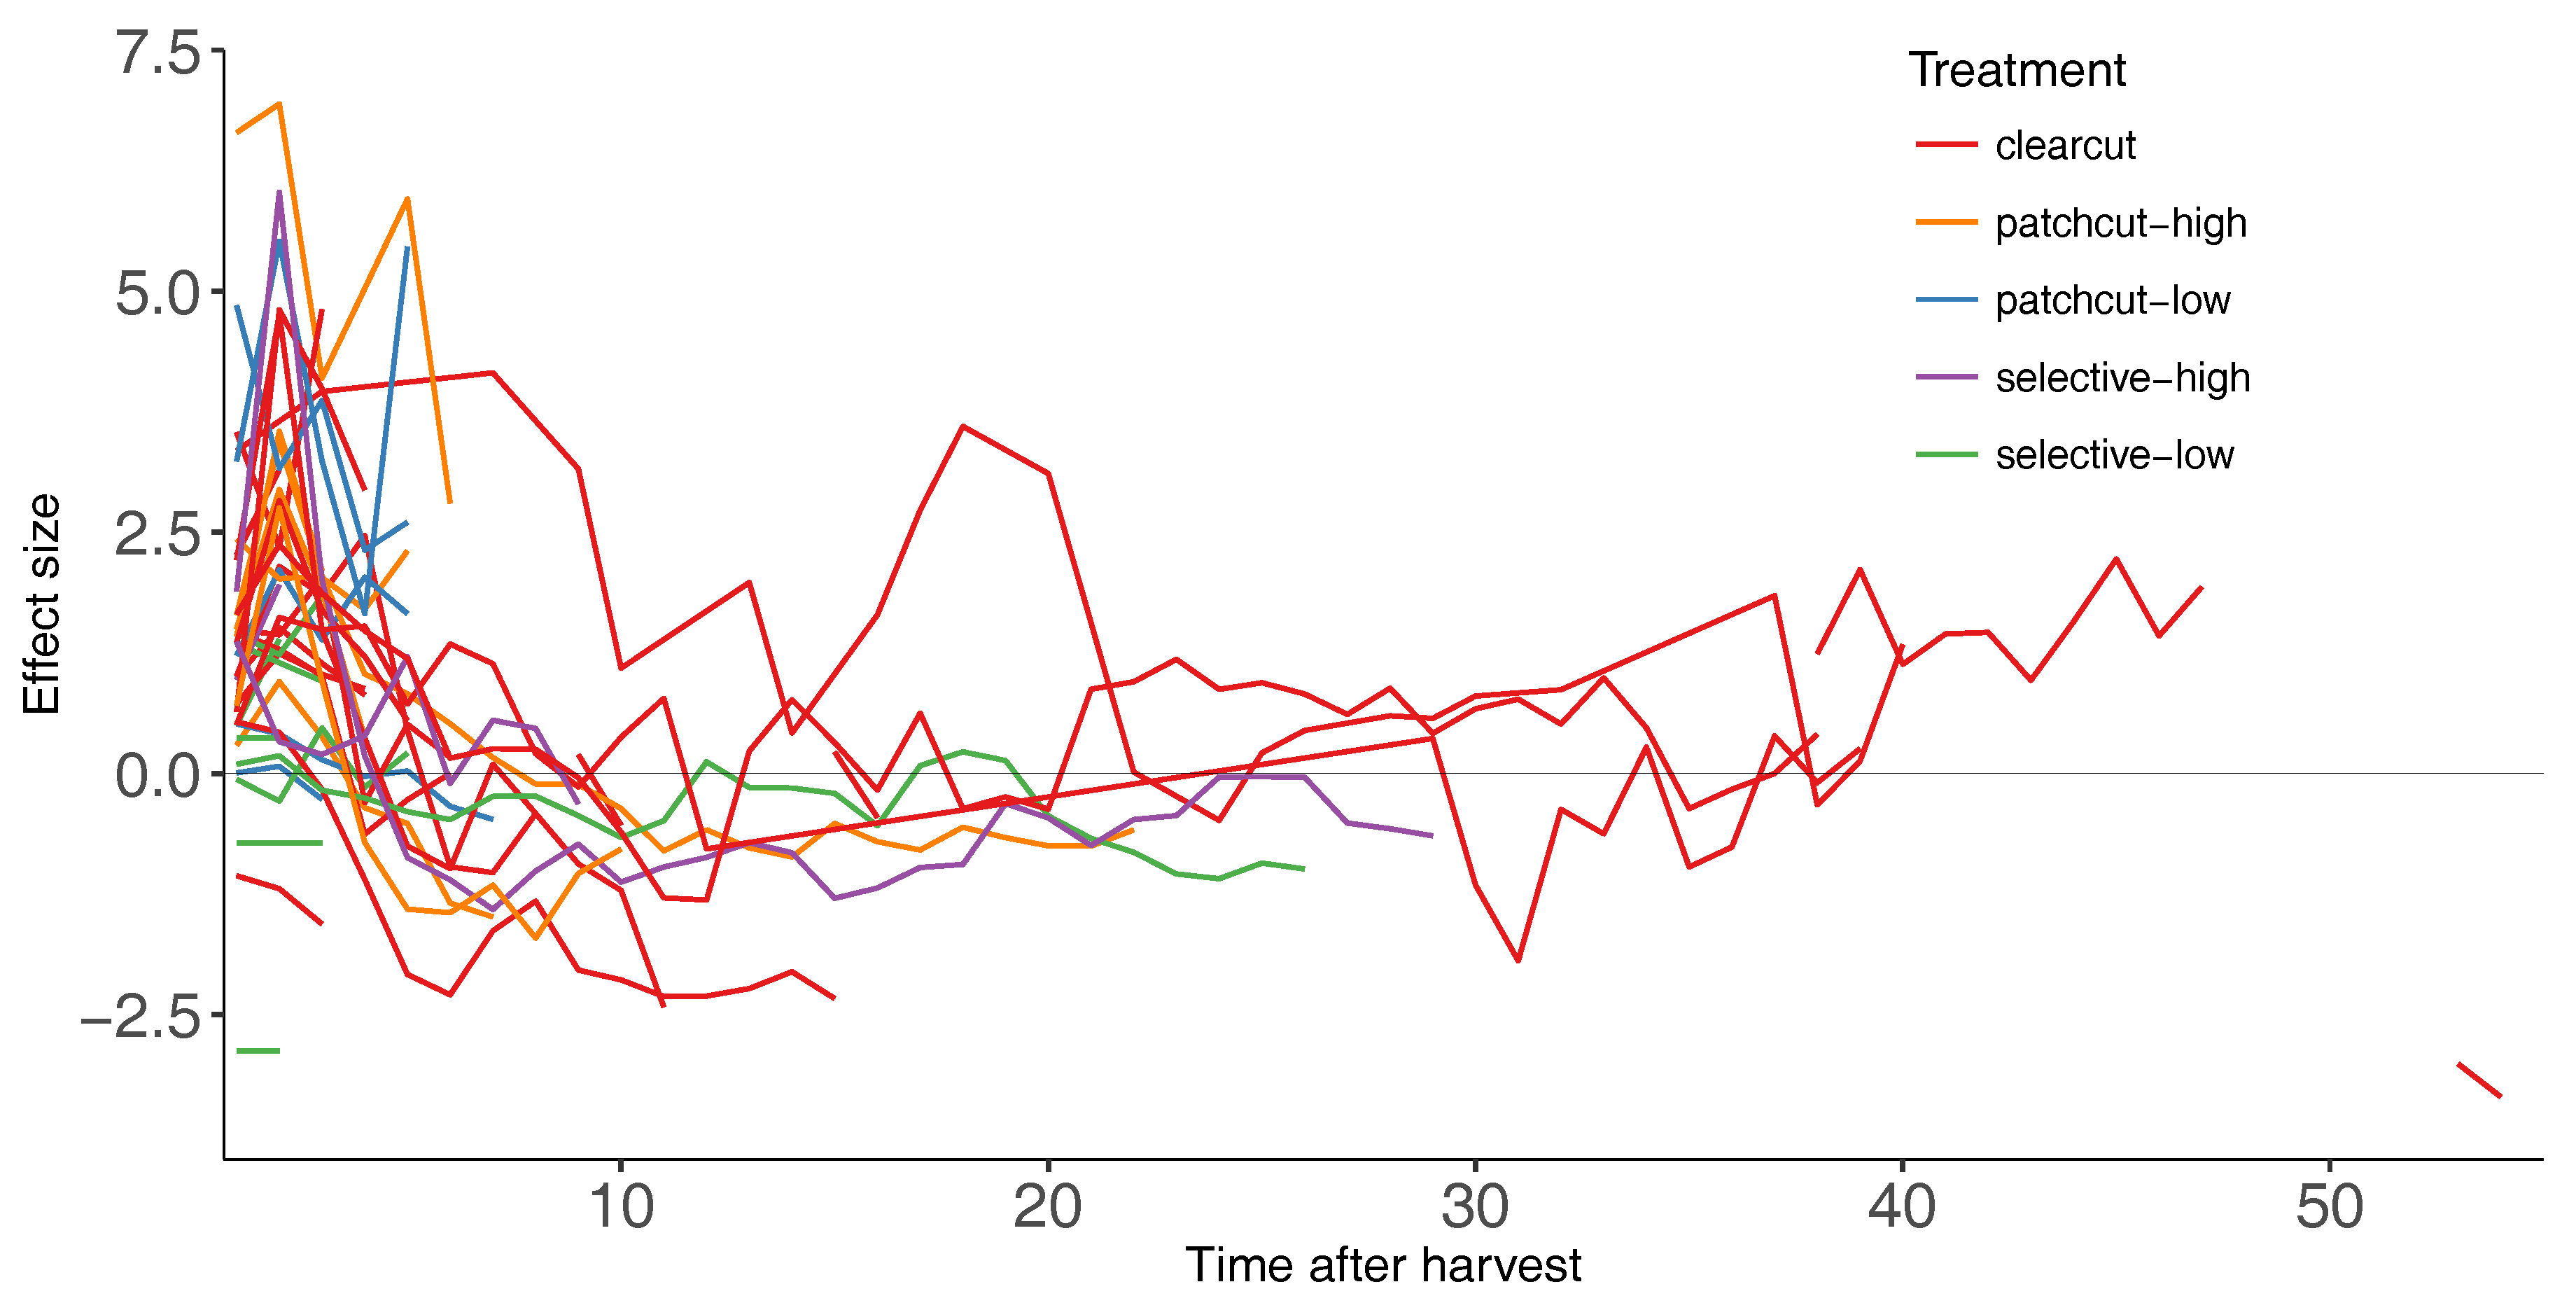
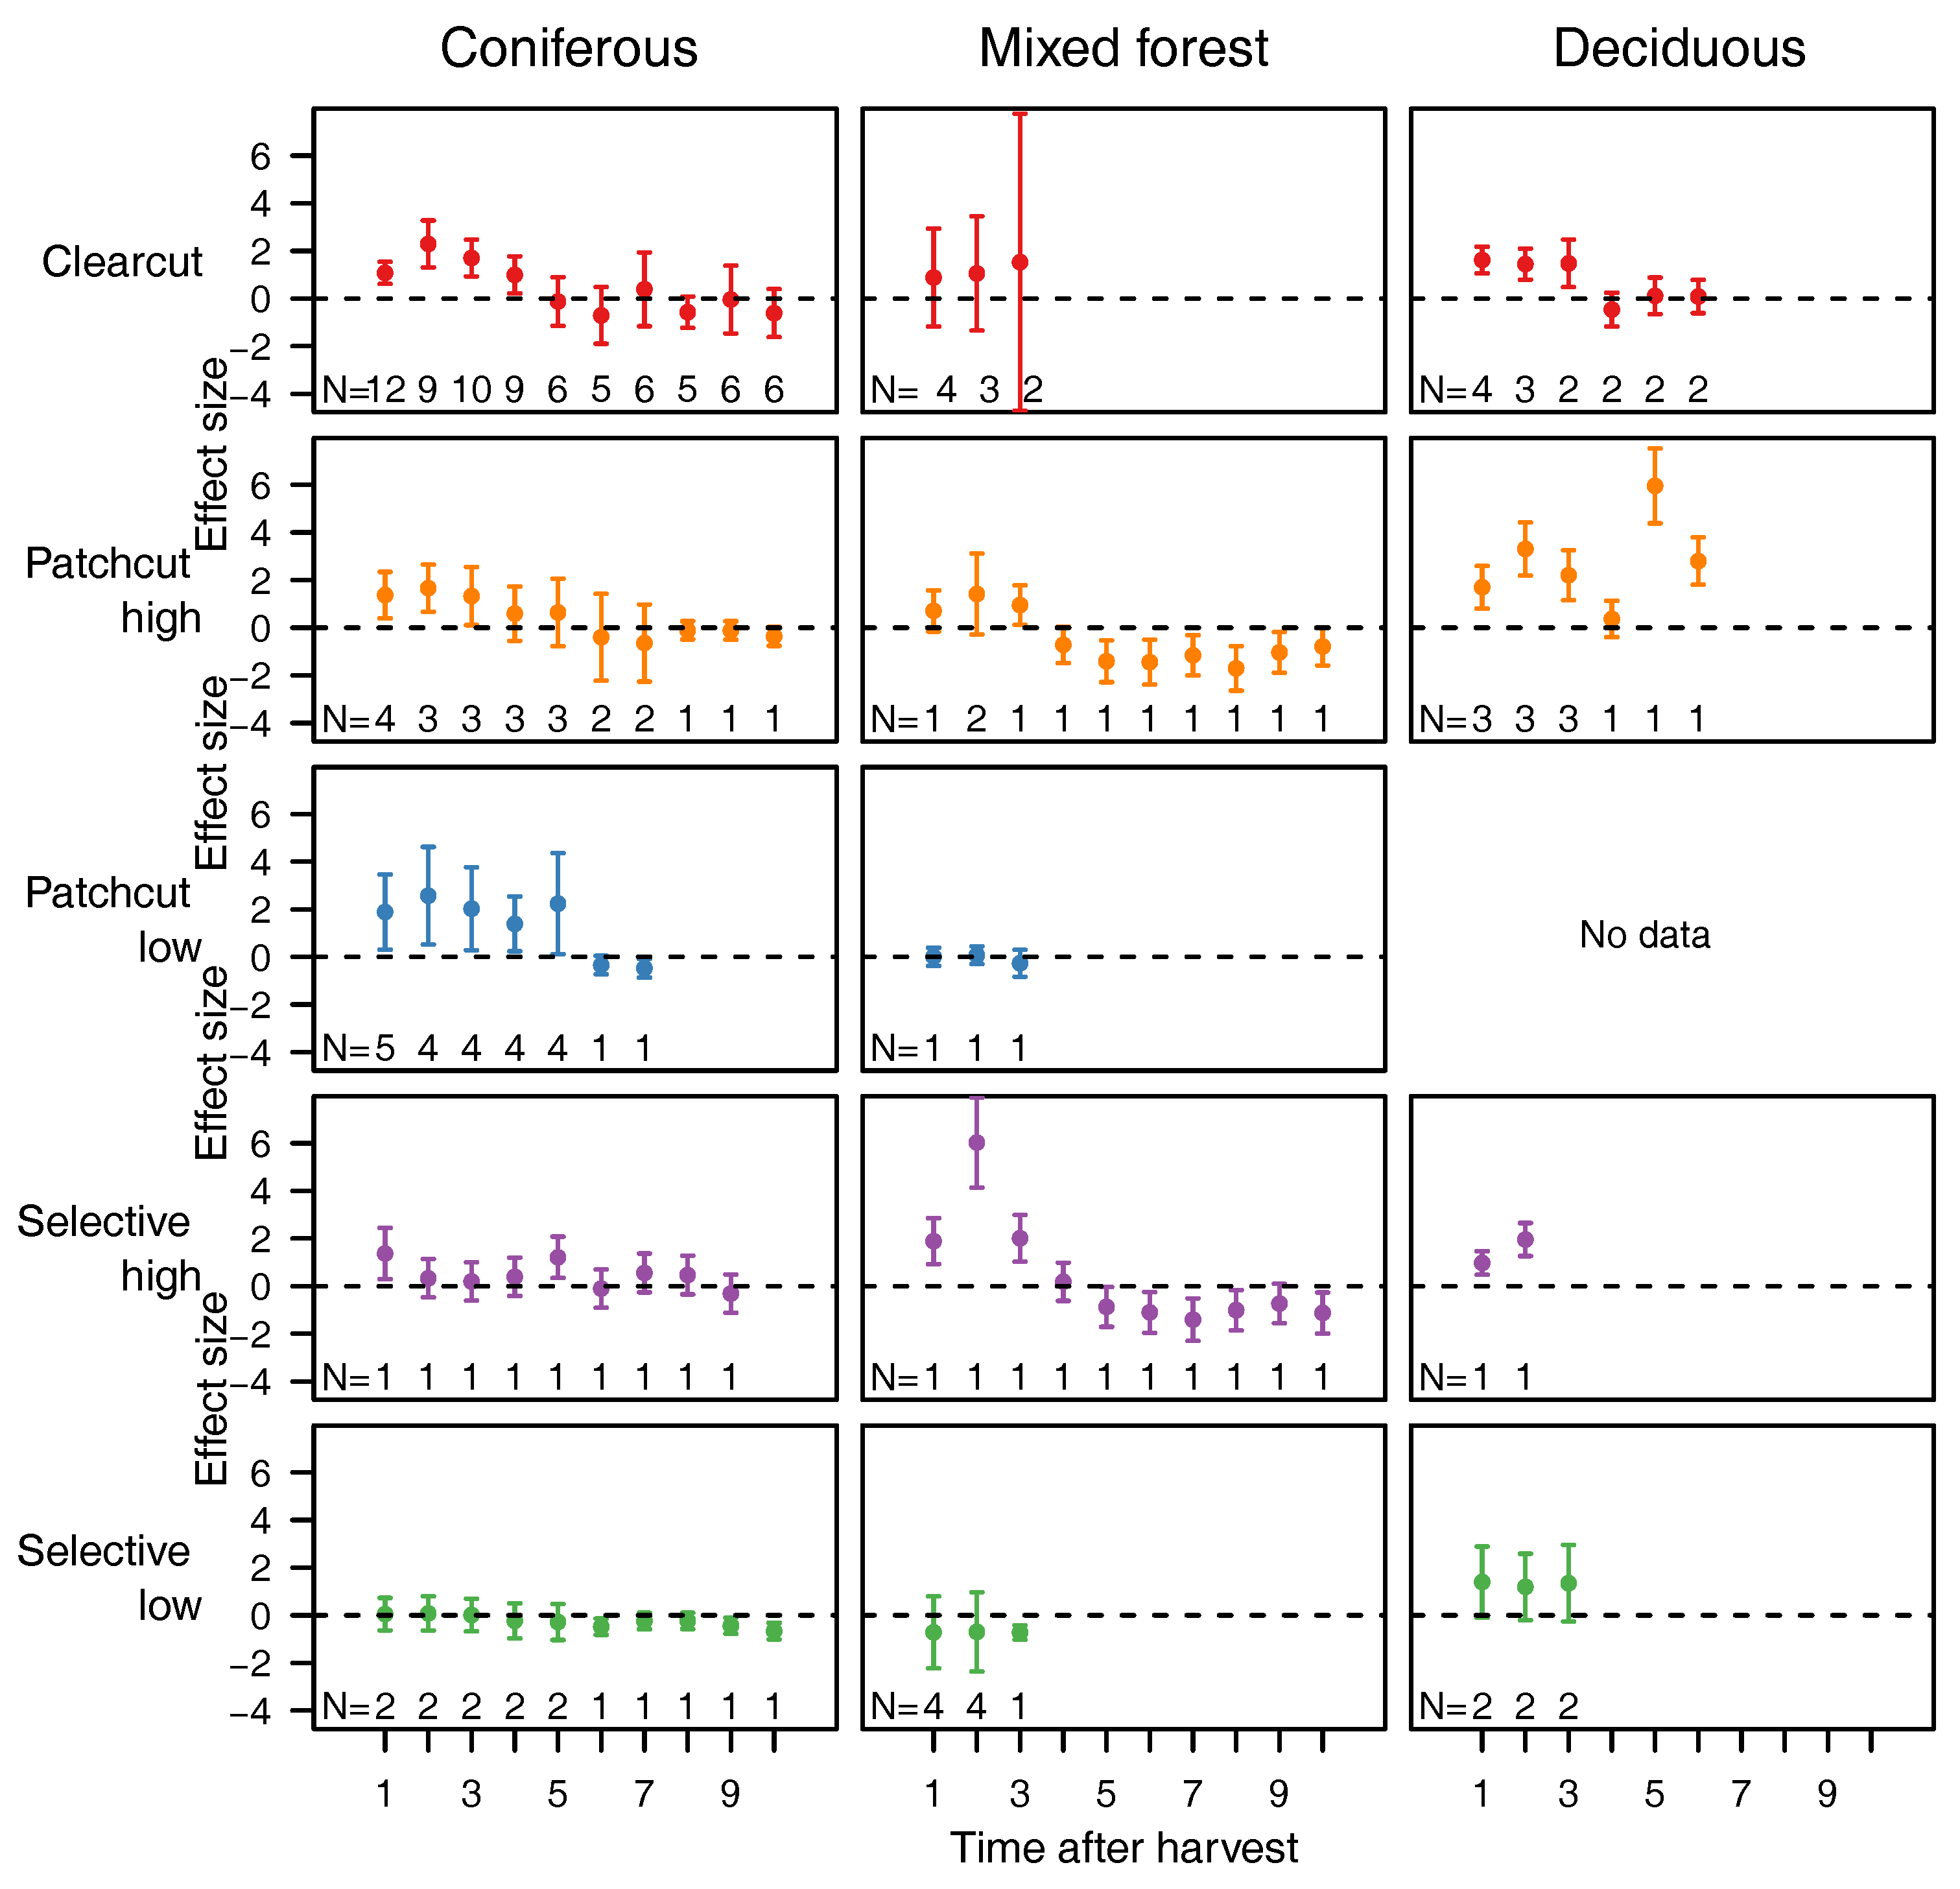
3.2. Assessing the Influence of Forest Harvest on Nitrate Concentrations

Nitrate concentrations in streams are potentially influenced by forest harvest and other environmental variables accounting for forest management, temporal changes, and site-specific characteristics (Table 1).
An additive mixed effects model with a regression spline on “time after harvest” [58] was used to assess the influence of environmental variables on stream nitrate. Model selection resulted in four predictors (Table 2).
In the first three to five years, clearcut and patchcut significantly increased nitrate concentration in coniferous and deciduous forests (Figure 2). Selective harvest at high intensity was significantly increased in the first year after intervention in coniferous forests and in deciduous forests. Mixed forests were influenced by selective harvest at high intensity, and did not significantly differ under all other forest regimes. Selective harvest at low intensity did not alter nitrate concentration, but showed a positive trend in deciduous forests. In some treatments and sites, we found a trend for overcompensation: in mixed forests with high intensities of patchcut and selective harvest and in clearcut and patchcut coniferous forests, the concentration of nitrate drops below the concentration of control streams after four to five years.

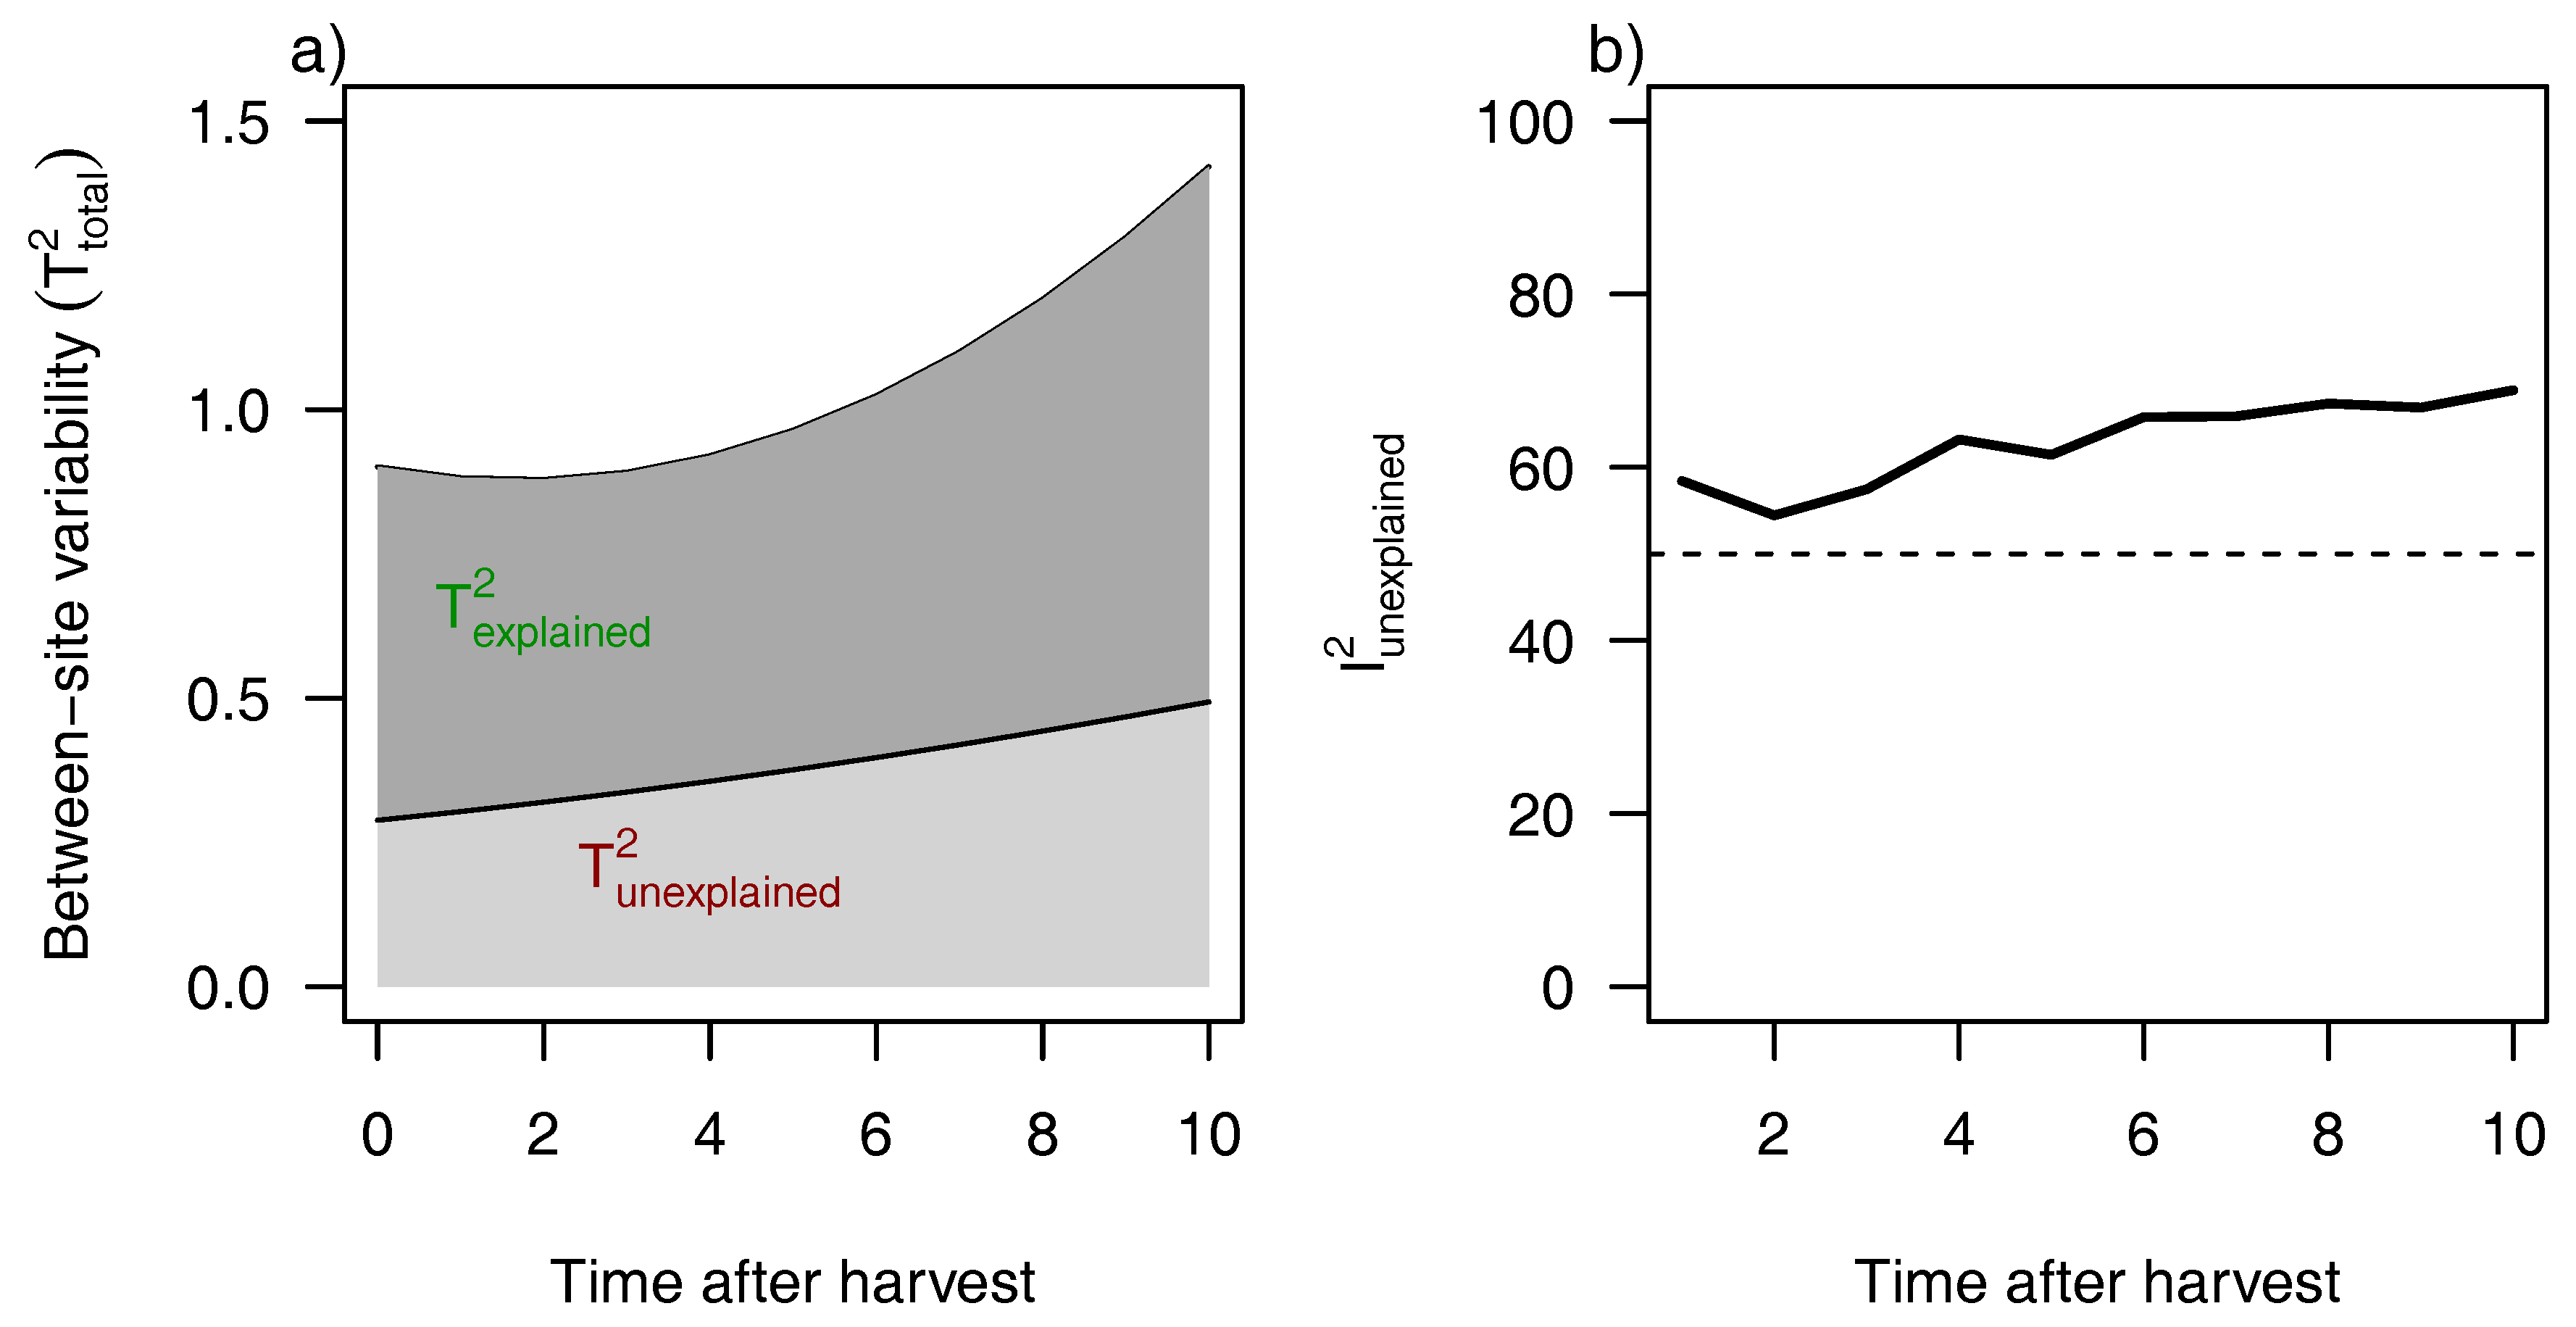
3.3. Between-Site Variability

Models with random slopes on the time after harvest nested in sites attained a better model fit (AIC = 1758) than random intercept models (AIC = 2603; likelihood ratio 837.6; p < 0.001). The unexplained between-site variability was small compared to the explained between-site variability (Figure 3a). The ratio of unexplained heterogeneity toward unaccounted variability indicates that between-site variability makes up the largest proportion in the unexplained variance (Figure 3b), with an increasing trend. The increasing trend is related to the increasing unexplained between-site variability with close-to-unchanged within-site variability ( S 2 , between 0.21 and 0.27).

3.4. Study Weights and Evidence Assessments

Re-weighting studies by their level of evidence led to no change in model selection, and the magnitude of the effect changes only slightly without any different interpretation. The level-of-evidence score was significantly positively correlated with variance ( r = 0.17 ,   t = 3.12 ,   p = 0.02 ). Low variability in the level-of-evidence score (from 3.2 to 4, see also S2) resulted in a low correlation coefficient ( r = 0.17 ) that was still significantly different from zero, indicating that studies penalized by their higher variances also scored less well on the level-of-evidence scale. Down-weighting of studies providing weak evidence did not influence our results.

3.5. Publication Bias

The distribution of the standard error against normalized residuals was symmetrically distributed around zero (S2), and Egger’s regression test was not significant (t-statistic = 0.18, p= 0.86). There is thus no evidence of a publication bias.

4. Discussion

The present meta-analysis shows that forest harvesting practices influence nitrate concentration in temperate streams with elevated concentrations three to five years after harvest.
The influence of harvest on stream nitrate was mediated by forest type. Coniferous and deciduous forests induced a similar nitrate pattern, in contrast to mixed forests. Although differences in soil-water nitrate concentrations in deciduous and coniferous forests are known—such as higher N deposition in coniferous and higher topsoil N storage of nitrogen in deciduous forests [13,25,59,60,61]—they are not reflected in the results of our meta-analysis. Mixed forests do not show an increase in stream nitrate concentration after clearcut and patchcut harvest. Higher species diversity—favoured by microhabitat diversity—may buffer effects of nitrate leaching and lead to a more stable ecosystem [62,63,64]. Nitrate levels in mixed forests dropped even below the pre-harvest level in patchcut and high-intensity selective-harvest forests. This may be caused by rapidly regrowing vegetation with high nitrogen demand [65].Although sample size for mixed forests was low, our analysis points towards the important role that mixed forests can play in minimizing nitrate efflux.
Clearcut and patchcut harvest increased nitrate concentration for the first three-to-five years before returning to control-site level in coniferous and deciduous stands, which is consistent with previous findings [12,25,66]. Clearcuts expose soils to sunlight and associated temperature increase, which can accelerate mineralization and nitrification [67]. Together with rain and no more interception loss, run-off and nutrient wash-out increase [13,68]. An additional source of nitrogen comes from decomposing logging residue releasing nutrients, and may equally increase nitrate leaching to adjacent streams [30]. Reduction of nitrate in leachate after a few years was found to be correlated with regrowing vegetation that took up nitrate [13,69]. In addition, topsoil may have by then lost most nutrients through wash-out [70].
Selective harvest management at low intensity did not alter nitrate concentration. Impact was small and only limited wash-out of nutrients took place [71]. Soil flora faced less severe changes in selective harvest than in clearcut areas. Its impact is probably smallest, due to not opening up larger areas of bare soil. Selective harvest plays an important role in today’s forestry practice recommendations [72,73,74,75,76], often aiming at close-to-nature forest management [77]. Selective harvest was represented only by a low number of samples in the meta-analysis, and future research on selective harvest intervention with various forest compositions is needed to verify the reliability of the findings.
The harvest year was included in the set of predictors as proxy for environmental context that may have changed over the years, such as atmospheric N deposition. Nitrogen compounds increased in natural systems through the N deposition derived from anthropogenic industrial nitrogen oxides, which was a major problem in the 1980s and decreased at the beginning of this century [25,78,79,80]. The time of harvest was not significant in the meta-analytical model, and based on the assumption that N deposition is correlated with year, changing deposition rates did not influence nitrate run-off from harvested forest streams in comparison to control sites. This result was consistent with results of a review by Campbell et al. [81].
Between-site differences were likely to be further mediated by soil composition [82,83,84]. N storage capacity and mineralization rate influence the amount of nitrogen retained in the soil [13,59]. The presence of ammonium and oxygen favour nitrification resulting in nitrate, as well as higher decomposition rates of organic material, favouring nitrate release [85,86]. Water and nitrate saturation of soils both contribute to the amount of nitrate washed out [87,88,89]. Due to a lack of data, it was not possible to include soil components in our meta-analysis.
Post-harvest management (such as burning and replanting) is known to influence nitrate concentration [90]. In almost half of the studies, information on post-harvest treatment was not available and could not be used as a predictor for differences between paired catchments. Leaving harvest residuals can increase nitrogen [13,22]. Most studies did not mention whether logging residue was left on site to avoid loss of nutrients from the system, but there was a tendency to leave logging residues (12 sites). Regrowing N fixing plants may also influence the nitrate output, although N fixing plants may as well profit from the high nitrate concentrations available in the soil after harvest and not necessarily fix more nitrogen from the air than they need themselves for regrowth [91]. In other forests where nitrogen-fixing plants such as alder—present in two studies of our meta-analysis [54,92]—were harvested, nitrate concentration even decreased compared to pre-harvest level [25], which may indicate that we underestimated the effect of harvest. We have accounted for these site-specific unknown circumstances by including a random effect for “site” in the meta-analysis.
Between-site variability reflects the differences of effect sizes between sites estimated by the meta-analytical model. We expected that harvest has a large impact on between-site variability in the first years, resulting in a high variability reflecting the differences in nitrate concentrations caused by the different harvest regimes. Contrary to our expectation, total between-site variability increased with time after harvest (Figure 3a). We interpret the increasing variability as idiosyncratic trajectories of regrowth in each site, making predictions for unobserved sites more difficult. We can still interpret the first years in comparison to the proportion that remained unexplained by the model. The part of unexplained variances equally increases over the years, but not to the same degree as the total variance. Forest composition, forest harvest, altitude, and the time after harvest explained parts of between-site variability in the model.
Combining weak studies can bias results, and we need to make sure to down-weigh weak studies in meta-analysis. Usually, studies are weighted according to their precision (i.e., the inverse of variance), assuming that studies with low variance contribute higher amounts of information to the analysis [48]. Study variance does not reflect quality shortcomings such as non-randomness or unrepresentative sampling. The evidence assessment tool of Mupepele et al. [46] accounts for study quality, and the resulting level of evidence was multiplied with study variance to down-weigh weak studies. This did not change the results in our meta-analysis, because levels of evidence were similar in all studies, and were positively correlated with variance. Furthermore, the random-effects model with relatively large between-site variability compared to within-site variance (Figure 3b) minimized the importance of weights ([93], p. 104). Nevertheless, quality shortcomings of individual studies in meta-analysis need to be revealed and incorporated in the analysis, although this did not influence the results in our study.

5. Conclusions

Nitrate leaching from harvested forests was generally low and below a harmful level for aquatic ecosystems [12,94,95]. Nevertheless, forest harvest influences stream nitrate concentration up to five years after harvesting, depending on harvest type and forest composition. Clearcut and patchcut lead to significantly increased nitrate concentrations in coniferous and deciduous forests, but not in mixed forests. Selective harvest has the lowest influence on nitrate concentration. A mixed forest and selective harvest at low intensity was the management option keeping nitrate concentrations in streams close to pre-harvest levels. While managed forests—even with occasional clearcuts—may still be beneficial compared to agriculture, effects should be considered on a landscape scale, avoiding high densities of several small equally-managed adjacent catchments draining to the same river.

Supplementary Materials

The following are available online at www.mdpi.com/1999-4907/8/1/5/s1. Table S1: Data. S2: R-Code used for the analysis.

Acknowledgments

We thank the participants of the German Forest Science Conference (FoWiTa) 2016 and their input during the discussion of this article. This work was supported by the 7th framework programme of the European Commission in the project OPERAs (grant number 308393, www.operas-project.eu).

Author Contributions

ACM collected the data. ACM and CFD did the analysis and wrote the manuscript.

Conflicts of Interest

The authors declare no conflict of interest.

References

  1. Gundersen, P.; Laurén, A.; Finér, L.; Ring, E.; Koivusalo, H.; Sætersdal, M.; Weslien, J.O.; Sigurdsson, B.D.; Högbom, L.; Laine, J.; et al. Environmental services provided from riparian forests in the nordic countries. Ambio 2010, 39, 555–566. [Google Scholar] [CrossRef] [PubMed]
  2. Diaz, R.; Rosenberg, R. Spreading dead zones and consequences for marine ecosystems. Science 2008, 321, 926–929. [Google Scholar] [CrossRef] [PubMed]
  3. Howarth, R.W. Coastal nitrogen pollution: A review of sources and trends globally and regionally. Harmful Algae 2008, 8, 14–20. [Google Scholar] [CrossRef]
  4. Mosier, A.; Syers, J.K.; Freney, J.R. Agriculture and the Nitrogen Cycle—Assessing the Impacts of Fertilizer Use on Food Production and the Environment; Island Press: Washington, DC, USA, 2004; p. 344. [Google Scholar]
  5. Sebilo, M.; Mayer, B.; Nicolardot, B.; Pinay, G.; Mariotti, A. Long-term fate of nitrate fertilizer in agricultural soils. Proc. Natl. Acad. Sci. USA 2013, 110, 18185–18189. [Google Scholar] [CrossRef] [PubMed]
  6. European Parliament. Directive 2000/60/EC of the European Parliament. Off. J. Eur. Communities 2000, 327, 1–72. [Google Scholar]
  7. Twery, M.J.; Hornbeck, J.W. Incorporating water goals into forest management decisions at a local level. For. Ecol. Manag. 2001, 143, 87–93. [Google Scholar] [CrossRef]
  8. Borja, Á.; Galparsoro, I.; Solaun, O.; Muxika, I.; Tello, E.M.; Uriarte, A.; Valencia, V. The European Water Framework Directive and the DPSIR, a methodological approach to assess the risk of failing to achieve good ecological status. Estuar. Coast. Shelf Sci. 2006, 66, 84–96. [Google Scholar] [CrossRef]
  9. Sweeney, B.W.; Newbold, J.D. Streamside forest buffer width needed to protect stream water quality, habitat, and organisms: A literature review. J. Am. Water Resour. Assoc. 2014, 50, 560–584. [Google Scholar] [CrossRef]
  10. Binkley, D. Patterns and Processes of Variation in Nitrogen and Phosphorus Concentrations in Forested Streams; Technical Report Tech. Bull. 838; Research Triangle Park, National Council for Air and Stream Improvement: Cary, NC, USA, 2001. [Google Scholar]
  11. Sun, G.; Riedel, M.; Jackson, R.; Kolka, R.; Amatya, D.; Shepard, J. Influences of management of Southern forests on water quantity and quality. In Southern Forest Science: Past, Present, and Future; USDA For. Serv., Gen. Tech. Rep: Asheville, NC, USA, 2004; Volume GTR SRS-75, pp. 195–234. [Google Scholar]
  12. Boggs, J.; Sun, G.; McNulty, S. Effects of timber harvest on water quantity and quality in small watersheds in the Piedmont of North Carolina. J. For. 2016, 114, 27–40. [Google Scholar] [CrossRef]
  13. Hegg, C.; Jeisy, M.; Waldner, P. Wald und Trinkwasser—Eine Literaturstudie; Technical Report; Eidg. Forschungsanstalt für Wald, Schnee und Landschaft: Birmensdorf, Switzerland, 2004. [Google Scholar]
  14. Keenan, R.J.; van Dijk, A.I. Planted forests and water. In Ecosystem Goods and Services from Plantation Forests; Bauhus, J., van der Meer, P., Kanninen, M., Eds.; Earthscan: London, UK, 2010; Chapter 4; pp. 77–95. [Google Scholar]
  15. Clarke, J.; Kelly-Quinn, M.; Blacklocke, S.; Bruen, M. The effect of forest windrowing on physico-chemical water quality in Ireland. Sci. Total Environ. 2015, 514, 155–169. [Google Scholar] [CrossRef] [PubMed]
  16. Mayer, P.M.; Reynolds, S.K.; McCutchen, M.D.; Canfield, T.J. Meta-analysis of nitrogen removal in riparian buffers. J. Environ. Qual. 2007, 36, 1172–1180. [Google Scholar] [CrossRef] [PubMed]
  17. Dosskey, M.G.; Vidon, P.; Gurwick, N.P.; Allan, C.J.; Duval, T.P.; Lowrance, R. The role of riparian vegetation in protecting and improving water qulity in streams. J. Am. Water Resour. Assoc. 2010, 46, 1–18. [Google Scholar] [CrossRef]
  18. Scott, N.A.; Likens, G.E.; Eaton, J.S.; Siccama, T.G. Trace metal loss following whole-tree harvest of a northeastern deciduous forest, U.S.A. Biogeochemistry 2001, 54, 197–217. [Google Scholar] [CrossRef]
  19. Worrall, F. Changes in stream nitrate concentrations due to land management practices, ecological succession, and climate: Developing a systems approach to integrated catchment response. Water Resour. Res. 2003, 39, 1–14. [Google Scholar] [CrossRef]
  20. Neal, C.; Reynolds, B.; Neal, M.; Wickham, H.; Hill, L.; Williams, B. The impact of conifer harvesting on stream water quality: the Afon Hafren, mid-Wales. Hydrol. Earth Syst. Sci. 2004, 8, 503–520. [Google Scholar] [CrossRef]
  21. Neal, C.; Reynolds, B.; Wilkinson, J.; Hill, T.; Neal, M.; Hill, S.; Harrow, M. The impacts of conifer harvesting on runoff water quality: A regional survey for Wales. Hydrol. Earth Syst. Sci. 1998, 2, 323–344. [Google Scholar] [CrossRef]
  22. Dissmeyer, G. Drinking Water from Forests and Grasslands; Technical Report; USDA Forest Service Southern Research Station: Asheville, NC, USA, 2000.
  23. Forsell, N.; Korosuo, A.; Havlík, P.; Valin, H.; Lauri, P.; Gusti, M.; Kindermann, G.; Obersteiner, M. Study on Impacts on Resource Efficiency of Future EU Demand For Bioenergy (ReceBio); Technical Report; Publications Office of the European Union: Luxembourg, 2016. [Google Scholar]
  24. Passeport, E.; Vidon, P.; Forshay, K.J.; Harris, L.; Kaushal, S.S.; Kellogg, D.Q.; Lazar, J.; Mayer, P.; Stander, E.K. Ecological engineering practices for the reduction of excess nitrogen in human-influenced landscapes: A guide for watershed managers. Environ. Manag. 2013, 51, 392–413. [Google Scholar] [CrossRef] [PubMed]
  25. Gundersen, P.; Schmidt, I.K.; Raulund-Rasmussen, K. Leaching of nitrate from temperate forests effects of air pollution and forest management. Environ. Rev. 2006, 14, 1–57. [Google Scholar] [CrossRef]
  26. Jerabkova, L.; Prescott, C.E.; Titus, B.D.; Hope, G.D.; Walters, M.B. A meta-analysis of the effects of clearcut and variable-retention harvesting on soil nitrogen fluxes in boreal and temperate forests. Can. J. For. Res. 2011, 41, 1852–1870. [Google Scholar] [CrossRef]
  27. Dise, N.; Wright, R. Nitrogen leaching from European forests in relation to nitrogen deposition. For. Ecol. Manag. 1995, 71, 153–161. [Google Scholar] [CrossRef]
  28. Collaboration for Environmental Evidence. Guidlines for Systematic Review and Evidence Synthesis in Environmental Management; Technical Report; Centre for Evidence-Based Conservation: Bangor, UK, 2013. [Google Scholar]
  29. Walter, H.; Breckle, S.W. Vegetation und Klimazonen; Ulmer: Stuttgart, Germany, 1999. [Google Scholar]
  30. Swank, W.T.; Vose, J.M.; Elliott, K.J. Long-term hydrologic and water quality responses following commercial clearcutting of mixed hardwoods on a southern Appalachian catchment. For. Ecol. Manag. 2001, 143, 163–178. [Google Scholar] [CrossRef]
  31. Rohatgi, A. WebPlotDigitizer, 3.10 ed.; WebPlotDigitizer: Austin, TX, USA, 2016; Available online: http://arohatgi.info/ (accessed on 1 September 2015).
  32. Reynolds, B.; Stevens, P.A.; Hughes, S.; Parkinson, J.A.; Weatherley, N.S. Stream chemistry impacts of conifer harvesting in Welsh catchments. Water Air Soil Pollut. 1995, 79, 147–170. [Google Scholar] [CrossRef]
  33. Arthur, M.A.; Coltharp, G.B.; Brown, D.L. Effects of best management practices on forest streamwater quality in eastern Kentucky. J. Am. Water Resour. Assoc. 1998, 34, 481–495. [Google Scholar] [CrossRef]
  34. Bracken, M.B. Statistical methods fo analysis of effects of treatment in overviews of randomized trials. In Effective Care of the Newborn Infant; Sinclair, J.C., Bracken, M.B., Eds.; Oxford University Press: Oxford, UK, 1992; pp. 13–20. [Google Scholar]
  35. Lajeunesse, M.J. Recovering Missing or Partial Data from Studies: A Survey of Conversions and Imputations for Meta-analysis. In Handbook of Meta-Analysis in Ecology and Evolution; Koricheva, J., Gurevitch, J., Mengersen, K., Eds.; Princeton University Press: Princeton, NJ, USA, 2013; pp. 195–206. [Google Scholar]
  36. R Core Team. R: A Language and Environment for Statistical Computing; R Foundation for Statistical Computing: Vienna, Austria, 2016. [Google Scholar]
  37. Pinheiro, J.; Bates, D.; DebRoy, S.; Sarkar, D.; R Core Team. nlme: Linear and Nonlinear Mixed Effects Models; R package version 3.1-128; R Foundation for Statistical Computing: Vienna, Austria, 2016. [Google Scholar]
  38. Viechtbauer, W. Conducting Meta-Analyses in R with the metafor Package. J. Stat. Softw. 2010, 36, 1–48. [Google Scholar] [CrossRef]
  39. Rosenberg, M.S.; Rothstein, H.R.; Gurevitch, J. Effect Sizes: Conventional Choices and Calculations. In Handbook of Meta-Analysis in Ecology and Evolution; Koricheva, J., Gurevitch, J., Mengersen, K., Eds.; Princeton University Press: Oxford, UK, 2013; pp. 61–85. [Google Scholar]
  40. Bolker, B. Linear and generalized linear mixed models. In Ecological Statistics: Contemporary Theory and Application; Fox, G.A., Negrete-Yankelevich, S., Sosa, V.J., Eds.; Oxford University Press: Oxford, UK, 2015; Chapter 13; pp. 309–333. [Google Scholar]
  41. Pinheiro, J.C.; Bates, D.M. Mixed-Effects Models in S and S-PLUS; Springer: New York, NY, USA, 2000. [Google Scholar]
  42. Borenstein, M.; Hedges, L.V.; Higgins, J.P.T.; Rothstein, H.R. Introduction to Meta-Analysis; John Wiley & Sons: New York, NY, USA, 2009; p. 450. [Google Scholar]
  43. Higgins, J.P.T.; Thompson, S.G.; Deeks, J.J.; Altman, D.G. Measuring inconsistency in meta-analyses. Br. Med. J. 2003, 327, 557–560. [Google Scholar] [CrossRef] [PubMed] [Green Version]
  44. Gurevitch, J.; Nakagawa, S. Research synthesis methods in ecology. In Ecological Statistics: Contemporary Theory and Application; Princeton University Press: Princeton, NJ, USA; Oxford, UK, 2015; Chapter 9. [Google Scholar]
  45. Nakagawa, S.; Santos, E.S.A. Methodological issues and advances in biological meta-analysis. Evolut. Ecol. 2012, 26, 1253–1274. [Google Scholar] [CrossRef]
  46. Mupepele, A.C.; Walsh, J.C.; Sutherland, W.J.; Dormann, C.F. An evidence assessment tool for ecosystem services and conservation studies. Ecol. Appl. 2016, 26, 1295–1301. [Google Scholar] [CrossRef] [PubMed]
  47. Rosenthal, R. The file drawer problem and tolerance for null results. Psychol. Bull. 1979, 86, 638–641. [Google Scholar] [CrossRef]
  48. Koricheva, J.; Gurevitch, J.; Mengersen, K. (Eds.) Handbook of Meta-Analysis in Ecology and Evolution; Princeton University Press: Princeton, NJ, USA, 2013; p. 498.
  49. Egger, M.; Davey Smith, G.; Schneider, M.; Minder, C. Bias in meta-analysis detected by a simple, graphical test. BMJ Clin. Res. 1997, 315, 629. [Google Scholar] [CrossRef]
  50. Gerstner, K.; Dormann, C.F.; Stein, A.; Manceur, A.M.; Seppelt, R. Effects of land use on plant diversity—A global meta-analysis. J. Appl. Ecol. 2014, 51, 1690–1700. [Google Scholar] [CrossRef]
  51. Silsbee, D.G.; Larson, G.L. A comparison of streams in logged and unlogged areas of Great Smoky Mountains National Park. Hydrobiologia 1983, 102, 99–111. [Google Scholar] [CrossRef]
  52. Clinton, B.D. Stream water responses to timber harvest: Riparian buffer width effectiveness. For. Ecol. Manag. 2011, 261, 979–988. [Google Scholar] [CrossRef]
  53. Siemion, J.; Burns, D.A.; Murdoch, P.S.; Germain, R.H. The relation of harvesting intensity to changes in soil, soil water, and stream chemistry in a northern hardwood forest, Catskill Mountains, USA. For. Ecol. Manag. 2011, 261, 1510–1519. [Google Scholar] [CrossRef]
  54. Meininger, W.S. The iNfluence of Contemporary Forest Management on Stream Nutrient Concentrations in an Industrialized Forest in the Oregon Cascades. Ph.D. Thesis, Oregon State University, Corvallis, OR, USA, 2011. [Google Scholar]
  55. Neal, C.; Reynolds, B.; Norris, D.; Kirchner, J.W.; Neal, M.; Rowland, P.; Wickham, H.; Harman, S.; Armstrong, L.; Sleep, D.; et al. Three decades of water quality measurements from the Upper Severn experimental catchments at Plynlimon, Wales: An openly accessible data resource for research, modelling, environmental management and education. Hydrol. Process. 2011, 25, 3818–3830. [Google Scholar] [CrossRef]
  56. Graynoth, E. Effects of logging on stream environments and faunas in Nelson. N. Z. J. Mar. Freshw. Res. 1979, 13, 79–109. [Google Scholar] [CrossRef]
  57. Cummins, T.; Farrell, E.P. Biogeochemical impacts of clearfelling and reforestation on blanket-peatland streams II. Major ions and dissolved organic carbon. For. Ecol. Manag. 2003, 180, 557–570. [Google Scholar] [CrossRef]
  58. Wood, S.N. Thin plate regression splines. J. R. Stat. Soc. Ser. B Stat. Methodol. 2003, 65, 95–114. [Google Scholar] [CrossRef]
  59. Rothe, A.; Kölling, C.; Moritz, K. Waldbewirtschaftung und Grundwasserschutz—Der aktuelle Kenntnisstand. AFZ Der Wald 1998, 53, 291–295. [Google Scholar]
  60. Meesenburg, H.; Horváth, B.; Meiwes, K.J. Stoffhaushalt von Waldökosystemen NW-Deutschlands unter hoher Stickstoffbelastung. Ber. Freibg. Forstl. Forsch. 2003, 49, 57–69. [Google Scholar]
  61. Puhlmann, H.; Von Wilpert, K. Silvicultural management options to preserve the seepage-water quality under forests - Case study Conventwald. Hydrol. Wasserbewirsch. 2009, 53, 96. [Google Scholar]
  62. Prescott, C.E. The influence of the forest canopy on nutrient cycling. Tree Physiol. 2002, 22, 1193–1200. [Google Scholar] [CrossRef] [PubMed]
  63. Tilman, D.; Reich, P.B.; Knops, J.M.H. Biodiversity and ecosystem stability in a decade-long grassland experiment. Nature 2006, 441, 629–632. [Google Scholar] [CrossRef] [PubMed]
  64. Lang, A.C.; von Oheimb, G.; Scherer-Lorenzen, M.; Yang, B.; Trogisch, S.; Bruelheide, H.; Ma, K.; Härdtle, W. Mixed afforestation of young subtropical trees promotes nitrogen acquisition and retention. J. Appl. Ecol. 2014, 51, 224–233. [Google Scholar] [CrossRef]
  65. Vitousek, P.M.; Howarth, R.W. Nitrogen limitation on land and in the sea: How can it occurs? Biogeochemistry 1991, 13, 87–115. [Google Scholar] [CrossRef]
  66. Kreutzweiser, D.P.; Hazlett, P.W.; Gunn, J.M. Logging impacts on the biogeochemistry of boreal forest soils and nutrient export to aquatic systems: A review. Environ. Rev. 2008, 16, 157–179. [Google Scholar] [CrossRef]
  67. Göttlein, A.; Baumgarten, M.; Huber, C.; Weis, W.; Papen, H.; Butterbach-Bahl, K.; Gasche, R. Femel- und Kahlhieb im Vergleich, Ökologie der Mischwaldbegründung in einem stickstoffbelasteten Fichtenbestand. LWF aktuell Magazin für Wald Wissenschaft und Praxis 2003, 41, 6–8. [Google Scholar]
  68. Wenger, W. Bedeutung des Waldes für die Trinkwassergewinnung. LWF aktuell Magazin für Wald Wissenschaft und Praxis 2002, 34, 3–8. [Google Scholar]
  69. Miller, H.G. The influence of stand development on nutrient demand, growth and allocation. Plant Soil 1995, 168–69, 225–232. [Google Scholar] [CrossRef]
  70. Kölling, C.; Neustifter, H. Stickstoffeintrag in Wälder und Nitratkonzentration im Sickerwasse—Ergebnisse aus dem Messnetz der Bayerischen Waldklimastationen. AFZ Der Wald 1997, 52, 1107–1110. [Google Scholar]
  71. Weis, W. Beeinflusst der Standort den Nitrataustrag? LWF aktuell Magazin für Wald Wissenschaft und Praxis 2002, 34, 21–24. [Google Scholar]
  72. Borchert, H. Veränderung des Waldes in Bayern in den letzten hundert Jahren. LWF Wissen 2002, 58, 2–50. [Google Scholar]
  73. Knoke, T.; Stimm, B.; Ammer, C.; Moog, M. Mixed forests reconsidered: A forest economics contribution on an ecological concept. For. Ecol. Manag. 2005, 213, 102–116. [Google Scholar] [CrossRef]
  74. Shepard, J.P. Water quality protection in bioenergy production: The US system of forestry Best Management Practices. Biomass Bioenergy 2006, 30, 378–384. [Google Scholar] [CrossRef]
  75. Bundesministerium für Ernährung, Landwirtschaft und Verbraucherschutz. Waldbericht der Bundesregierung; Technical Report; BMELV: Berlin, Germany, 2009. [Google Scholar]
  76. Kindler, E. Analyse zur erweiterten Nachhaltigkeitsberichterstattung deutscher Länderforstbetriebe. Appl. Agric. For. Res. 2015, 2, 131–144. [Google Scholar]
  77. BMELV. German Forests—Nature and Economic Factor; Technical Report; Bundesministerium für Ernährung, Landwirtschaft und Verbraucherschutz: Berlin, Germany, 2011. [Google Scholar]
  78. Galloway, J.N. Acid deposition: Perspectives in time and space. Water Air Soil Pollut. 1995, 85, 15–24. [Google Scholar] [CrossRef]
  79. Sucker, C.; Wilpert, K.V.; Puhlmann, H. Acidification reversal in low mountain range streams of Germany. Environ. Monit. Assess. 2011, 174, 65–89. [Google Scholar] [CrossRef] [PubMed]
  80. Paré, D.; Thiffault, E. Nutrient budgets in forests under increased biomass harvesting scenarios. Curr. For. Rep. 2016, 2, 81–91. [Google Scholar] [CrossRef]
  81. Campbell, J.L.; Hornbeck, J.W.; Mitchell, M.J.; Adams, M.B.; Castro, M.S.; Driscoll, C.T.; Kahl, J.S.; Kochenderfer, J.N.; Likens, G.E.; Lynch, J.A.; et al. Input-output budgets of inorganic nitrogen for 24 forest watersheds in the Northeastern United States: A review. Water Air Soil Pollut. 2004, 151, 373–396. [Google Scholar] [CrossRef]
  82. Vitousek, P.M. Nitrate losses from disturbed ecosystems. Science 1979, 204, 469–474. [Google Scholar] [CrossRef] [PubMed]
  83. Neary, D.G.; Ice, G.G.; Jackson, C.R. Linkages between forest soils and water quality and quantity. For. Ecol. Manag. 2009, 258, 2269–2281. [Google Scholar] [CrossRef]
  84. Sudduth, E.B.; Perakis, S.S.; Bernhardt, E.S. Nitrate in watersheds: Straight from soils to streams? J. Geophys. Res. Biogeosci. 2013, 118, 291–302. [Google Scholar] [CrossRef]
  85. Gisi, U. Bodenökologie; Thieme Verlag: Stuttgart, Germany, 1997; p. 350. [Google Scholar]
  86. Rüetschi, D.; Wülser, R. Die künstliche Grundwasseranreicherung der Wasserversorgung Basel; Technical Report; Annual Report of the Lake Constance-Rhine-Waterworks Association: Basel, Switzerland, 1999; pp. 71–84. [Google Scholar]
  87. Fenn, M.E.; Poth, M.A.; Aber, J.D.; Baron, J.S.; Bormann, B.T.; Johnson, D.W.; Lemly, A.D.; McNulty, S.G.; Ryan, D.F.; Stottlemyer, R. Nitrogen excess in North American ecosystems: Predisposing factors, ecosystem responses, and management strategies. Ecol. Appl. 1998, 8, 706–733. [Google Scholar] [CrossRef]
  88. Schleppi, P.; Waldner, P.; Hegg, C. Einfluss des Waldes auf Nitrat-Gehalte im Wasser. Bündner Wald 2003, 4, 27–30. [Google Scholar]
  89. Bredemeier, M.; Cohen, S.; Godbold, D.L.; Lode, E.; Pichler, V.; Schleppi, P. (Eds.) Forest Management and the Water Cycle—An Ecosytem-Based Approach; Springer: New York, NY, USA, 2011.
  90. Covington, W.; Sackett, S. Soil mineral nitrogen changes following prescribed burning in ponderosa pine. For. Ecol. Manag. 1992, 54, 175–191. [Google Scholar] [CrossRef]
  91. Ledgard, S.; Sprosen, M.; Penno, J.; Rajendram, G. Nitrogen fixation by white clover in pastures grazed by dairy cows: Temporal variation and effects of nitrogen fertilization. Plant Soil 2001, 229, 177–187. [Google Scholar] [CrossRef]
  92. Stednick, J.D. Long-term water quality changes following timber harvesting. In Hydrological and Biological Responses to Forest Practices; Stednick, J.D., Ed.; Springer: New York, NY, USA, 2008; Chapter 10; pp. 139–155. [Google Scholar]
  93. Mengersen, K.; Schmid, C.H.; Jennions, M.D.; Gurevitch, J. Statistical Models and Approaches to Inference. In Handbook of Meta-Analysis in Ecology and Evolution; Princeton University Press: Princeton, NJ, USA; Oxford, UK, 2013; Chapter 8; pp. 89–107. [Google Scholar]
  94. Binkley, D.; Burnham, H.; Lee Allen, H. Water quality impacts of forest fertilization with nitrogen and phosphorus. For. Ecol. Manag. 1999, 121, 191–213. [Google Scholar] [CrossRef]
  95. Boggs, J.; Sun, G.; Jones, D.; McNulty, S.G. Effect of soils on water quantity and quality in Piedmont forested headwater watersheds of North Carolina. J. Am. Water Resour. Assoc. 2013, 49, 132–150. [Google Scholar] [CrossRef]
Figure 1. Standardized mean difference of stream nitrate concentrations plotted against post-harvest time series. Colours reflect the different harvest types. Most long-term studies were clearcut treatments. Seven studies had records for more than fifteen years after harvest.
Forests 08 00005 g001
Figure 2. Subgroup analysis for every combination of forest harvest and forest composition. Summary effect sizes are plotted with confidence intervals against time for the first ten years. Number of studies entering the subgroup analysis is given by “N =” in each plot. Coniferous and deciduous forests show a significantly elevated nitrate concentration three to five years after clearcut and patchcut harvests, contrary to mixed forests. Selective harvest at low intensity does not significantly influence nitrate concentrations.
Forests 08 00005 g002
Figure 3. (a) Annual between-site variability is partitioned into explained and unexplained heterogeneity. While unexplained heterogeneity linearly increases over the years, heterogeneity explained by the meta-analytical model decreases in the first two years before it increases again after the fourth year. (b) Total unexplained variability consists of unexplained between-site and within-site variability. The ratio I unexpl 2 is larger than 50 (dotted line), which indicates that between-site variability is larger than within-site variability ( I unexpl 2 = T unexplained 2 / ( T unexplained 2 + S 2 ) ) .
Forests 08 00005 g003
Table 1. Environmental variables used as predictors in the additive mixed model before model selection.
Environmental VariableDescription
Harvest treatmentClearcut: 26 sites
Patchcut at high intensity: nine sites, and low intensity: six sites
Selective harvest at high intensity: three sites, and low intensity: eight sites.
Forest age20 to 100 years, with four exceptionally old sites of 450 and 600 years.
Forest compositionConiferous forests: 27 sites
Mixed forests: 14 sites
Deciduous forests: 11 sites
Time after harvestThe time of N O 3 - -measurements in relation to forest harvest ranged from 1 to 54 years. Forty-five effect sizes were from the first year after intervention, decreasing to 39 in the second and 33 in the third year. Two thirds of effect sizes were from the first 12 years.
Harvest yearEarliest harvest took place in 1926, but measurements on this site were taken only 50 years later [51]. First forest harvests with measurements directly after the intervention were from the 1960s. Most studies (15) investigated harvesting between 2000 and 2006. The last forest harvests investigated took place in 2006, and were published in 2011 [52,53,54,55]. The 10 sites harvested in the 1980s were those with the most long-term research, and provided 117 data points around 12 years of investigation after harvest.
Catchment sizeSites covering small catchments with less than 100 ha were most abundant (37). One catchment was as large as 2031 ha [56], and the remaining sites all ranged between 100 and 600 ha.
Mean annual temperatureRanged from 4.6 to 14 C , whereas most sites were between 5 to 13 C . Catskill, USA had the lowest mean temperature (4.6 to 5.2 C ). The warmest sites were in Hubbard Brook, USA and Japan with 14 C .
Annual precipitationRanged from 1156 mm/annum in Cloosh, Ireland, to 3333 mm/annum in the Hoh river valley, USA.
AltitudeThe lowest place was at 63 m a.s.l, the same catchment that obtained lowest precipitation in Cloosh, Ireland [57]. Great Smoky Mountains National, USA had the most elevated site (1162 m).
Table 2. F-test for the parameters of the selected model with temporal autocorrelation and a regression spline on time.
PredictorDegrees of FreedomF-Statisticp-Value
Time after harvest (spline)11.4611.07<0.001
Harvest treatment47.07<0.001
Forest composition28.82<0.001
Altitude125.32<0.001

