
Direct Measurement of Tree Height Provides Different Results on the Assessment of LiDAR Accuracy

 , ,
, ,
Abstract
:1. Introduction
2. Methods
2.1. Study Area
2.2. Sampling Design and Data Collection
2.2.1. Indirect Field-Based Survey (IND)
2.2.2. LiDAR Survey (ALS)
2.2.3. Direct Field-Based Survey (DIR)
2.3. Data Analysis
3. Results
4. Discussion
5. Conclusions
Acknowledgments
Author Contributions
Conflicts of Interest
References
- Koch, B.; Heyder, U.; Weinacker, H. Detection of individual tree crowns in airborne LiDAR data. Photogramm. Eng. Remote Sens. 2006, 72, 357–363. [Google Scholar] [CrossRef]
- Andersen, H.E.; Reutebuch, S.E.; McGaughey, R.J. A rigorous assessment of tree height measurements obtained using airborne LiDAR and conventional field methods. Can. J. Remote Sens. 2006, 32, 355–366. [Google Scholar] [CrossRef]
- Fieber, K.D.; Davenport, I.J.; Tanase, M.A.; Ferryman, J.M.; Gurney, R.J.; Becerra, V.M.; Walker, J.P.; Hacker, J.M. Validation of Canopy Height Profile methodology for small-footprint full-waveform airborne LiDAR data in a discontinuous canopy environment. ISPRS J. Photogramm. Remote Sens. 2015, 104, 144–157. [Google Scholar] [CrossRef] [Green Version]
- Næsset, E. Predicting forest stand characteristics with airborne scanning laser using a practical two-stage procedure and field data. Remote Sen. Environ. 2002, 80, 88–99. [Google Scholar] [CrossRef]
- Nilsson, M. Estimation of tree heights and stand volume using an airborne LiDAR system. Remote Sen. Environ. 1996, 56, 1–7. [Google Scholar] [CrossRef]
- Næsset, E. Estimating timber volume of forest stands using airborne laser scanner data. Remote Sens. Environ. 1997, 61, 246–253. [Google Scholar] [CrossRef]
- Magnussen, S.; Boudewyn, P. Derivations of stand heights from airborne laser scanner data with canopy-based quantile estimators. Can. J. For. Res. 1998, 28, 1016–1031. [Google Scholar] [CrossRef]
- Lefsky, M.A.; Cohen, W.B.; Acker, S.A.; Parker, G.G.; Spies, T.A.; Harding, D. LiDAR remote sensing of the canopy structure and biophysical properties of Douglas-fir western hemlock forests. Remote Sens. Environ. 1999, 70, 339–361. [Google Scholar] [CrossRef]
- Tompalski, P.; Coops, N.C.; White, J.C.; Wulder, M.A. Simulating the impacts of error in species and height upon tree volume derived from airborne laser scanning data. For. Ecol. Manag. 2014, 327, 167–177. [Google Scholar] [CrossRef]
- Persson, A.; Holmgren, J.; Söderman, U. Detecting and measuring individual trees using an airborne laser scanner. Photogramm. Eng. Remote Sens. 2002, 68, 925–932. [Google Scholar]
- Garbarino, M.; Lingua, E.; Weisberg, P.J.; Bottero, A.; Meloni, F.; Motta, R. Land-use history and topographic gradients as driving factors of subalpine Larix decidua forests. Landsc. Ecol. 2013, 28, 805–817. [Google Scholar] [CrossRef]
- Berger, F.; Dupire, S.; Monnet, J.-M.; Hainzer, E.; Stoehr, D.; Nemestóthy, N.; Sotier, B.; Lerch, T.; Maier, B.; Malin, H.; et al. Forest Logistic Planning Strategies. Good Practices for the Alpine Forests; TESAF e-Book: Padova, Italy, 2014; p. 111. [Google Scholar]
- Field-Map. IFER: Jilove, Czech Republic. Available online: http://www.fieldmap.cz (accessed on 25 May 2015).
- GeoXM 2005. Trimble Inc.: Sunnyvale, CA, USA. Available online: http://investor.trimble.com/releasedetail.cfm?releaseid=190963 (accessed on 15 July 2014).
- TruPulse. Laser Technology Inc.: Centennial, CO, USA. Available online: http://www.lasertech.com/TruPulse-Laser-Rangefinder.aspx (accessed on 25 May 2015).
- ARMOR. Technologies Inc.: Arlington, VA, USA. Available online: http://www.drs.com/products-and-services/armor-customer-support/DRS (accessed on 3 July 2015).
- Terrascan. Terrasolid LTD.: Helsinki, Finland. Available online: http://www.terrasolid.com/products/terrascanpage.php (accessed on 14 March 2014).
- LasTools. GmbH: Gilching, Germany. Available online: http://lastools.org/download/LAStools.ziprapidlasso (accessed on 10 February 2014).
- Vauhkonen, J.; Tokola, T.; Maltamo, M.; Packalén, P. Effects of pulse density on predicting characteristics of individual trees of Scandinavian commercial species using alpha shape metrics based on airborne laser scanning data. Can. J. Remote Sens. 2008, 34, S441–S459. [Google Scholar] [CrossRef]
- Hansen, E.H.; Gobakken, T.; Næsset, E. Effects of pulse density on digital terrain models and canopy metrics using airborne laser scanning in a tropical forest. Remote Sens. 2015, 7, 8453–8468. [Google Scholar] [CrossRef] [Green Version]
- Kandare, K.; Orka, H.O.; Chan, J.C.-W.; Dalponte, M. Effects of forest structure and airborne laser scanning point cloud density on 3D delineation of individual tree crowns. Eur. J. Remote Sens. 2016, 49, 337–359. [Google Scholar] [CrossRef]
- Hyyppä, H.J.; Hyyppä, J.M. Effects of stand size on the accuracy of remote sensing based forest inventory. IEEE Trans. Geosci. Remote Sens. 2001, 39, 2613–2621. [Google Scholar] [CrossRef]
- Sambugaro, M.; Colpi, C.; Marzano, R.; Pellegrini, M.; Pirotti, F.; Lingua, E. Utilizzo Del Telerilevamento Per l’Analisi Della Biodiversità Strutturale: Il Caso Studio Della Riserva Forestale di Clöise (Asiago, VI). In Proceedings of the 17th Conferenza Nazionale ASITA, Riva del Garda, Italy, 5–7 November 2013; pp. 1171–1178.
- St-Onge, B. Estimating individual tree heights of the boreal forest using airborne laser altimetry and digital videography. Int. Arch. Photogramm. Remote Sens. 1999, 32, 179–184. [Google Scholar]
- ArcGIS. ESRI: Redlands, CA, USA. Available online: http://www.esri.com/arcgis/products/arcgis-pro/Overview (accessed on 25 June 2015).
- Eysn, L.; Hollaus, M.; Lindberg, E.; Berger, F.; Monnet, J.-M.; Dalponte, M.; Kobal, M.; Pellegrini, M.; Lingua, E.; Mongus, D.; Pfeifer, N. A benchmark of LiDAR-based single tree detection methods using heterogeneous forest data from the Alpine space. Forests 2015, 6, 1721–1747. [Google Scholar] [CrossRef] [Green Version]
- Chevan, A.; Sutherland, M. Hierarchical partitioning. Am. Stat. 1991, 45, 90–96. [Google Scholar] [CrossRef]
- Walsh, C.; Mac Nally, R. Hier.Part: Hierarchical Partitioning. R Package Version 1.0–4. Available online: https://www.CRAN.R-project.org/package=hier.part (accessed on 20 May 2013).
- R Core Team. R: A Language and Environment for Statistical Computing; R Found. Stat. Comput.: Vienna, Austria, 2016. [Google Scholar]
- Wing, M.G.; Eklund, A.; Sessions, J. Applying LiDAR technology for tree measurements in burned landscapes. Int. J. Wildland Fire 2010, 19, 104–114. [Google Scholar] [CrossRef]
- Nelson, R.; Krabill, W.; Maclean, G. Estimating forest biomass and volume using airborne laser data. Remote Sens. Environ. 1988, 24, 247–267. [Google Scholar] [CrossRef]
- Hyyppä, J.M.; Hyyppä, H.J.; Leckie, D.; Gougeon, F.; Yu, X.; Maltamo, M. Review of methods of small-footprint airborne laser scanning for extracting forest inventory data in boreal forests. Int. J. Rem. Sens. 2008, 29, 1339–1366. [Google Scholar]
- Farid, A.; Goodrich, D.C.; Sorooshian, S. Using airborne LiDAR to discern age classes of cottonwood trees in a riparian area. West. J. Appl. For. 2006, 21, 149–158. [Google Scholar]
- Korpela, I.; Ørka, H.O.; Maltamo, M.; Tokola, T.; Hyyppä, J. Tree species classification using airborne LiDAR—Effects of stand and tree parameters, downsizing of training set, intensity normalization, and sensor type. Silva Fenn. 2010, 44, 319–339. [Google Scholar] [CrossRef]
- Yu, X.; Hyyppä, J.; Hyyppä, H.; Maltamo, M. Effects of flight altitude on tree height estimation using airborne laser scanning. In Proceedings of the International Conference NATSCAN Laser-Scanners for Forest and Landscape Assessment—Instruments, Processing Methods and Applications, Freiburg, Germany, 3–6 October 2004; pp. 96–101.
- Hess, C.; Bienert, A.; Härdtle, W.; Von Oheimb, G. Does Tree Architectural Complexity Influence the Accuracy of Wood Volume Estimates of Single Young Trees by Terrestrial Laser Scanning? Forests 2015, 6, 3847–3867. [Google Scholar] [CrossRef]
- Chave, J.; Andalo, C.; Brown, S.; Cairns, M.A.; Chambers, J.Q.; Eamus, D.; Fölster, H.; Fromard, F.; Higuchi, N.; Kira, T.; et al. Tree allometry and improved estimation of carbon stocks and balance in tropical forests. Oecologia 2005, 145, 87–99. [Google Scholar] [CrossRef] [PubMed]
- Jakubowski, M.K.; Guo, Q.; Kelly, M. Tradeoffs between LiDAR pulse density and forest measurement accuracy. Remote Sens. Environ. 2013, 130, 245–253. [Google Scholar] [CrossRef]
- Hyyppä, J.M.; Inkinen, M. Detecting and estimating attributes for single trees using laser scanner. Photogramm. J. Finl. 1999, 16, 27–42. [Google Scholar]
- Gaudin, S.; Richard, J.B. Comparaison des dendrometres VertexIII et TruPulse 200B pour la mesure de la hauteur totale des arbres. Rev. For. Fr. 2014, 66, 163–181. [Google Scholar]
- Larjavaara, M.; Muller-Landau, H.C. Measuring tree height: A quantitative comparison of two common field methods in a moist tropical forest. Methods Ecol. Evol. 2013, 4, 793–801. [Google Scholar] [CrossRef]
- Nelson, R.; Parker, G.; Hom, M. A portable airborne laser system for forest inventory. Photogramm. Eng. Remote Sens. 2003, 69, 267–273. [Google Scholar] [CrossRef]
- West, P.W. Tree and Forest Measurement, 2nd ed.; Springer: Berlin, Germany, 2009; p. 191. [Google Scholar]
- Brach, M.; Bielak, K.; Drozdowski, S. Measurements accuracy of selected laser rangefinders in the forest environment. Sylwan 2013, 157, 671–677. [Google Scholar]
- Tomaštik, J.; Tunák, D. Compass measurement—Still a suitable surveying method in specific conditions. Geod. Cartogr. 2015, 41, 31–40. [Google Scholar] [CrossRef]
- Lindgren, O. A Study of Circular Plot Sampling of Swedish Forest Compartments; Swedish University of Agriculture Science: Umea, Sweden, 1984. [Google Scholar]
- Holmgren, J.; Nilsson, M.; Olsson, H. Estimation of tree height and stem volume on plots using airborne laser scanning. For. Sci. 2003, 49, 419–428. [Google Scholar]
- Ferrarese, J.A. Characterizing Crown Structure of Three Interior Northwest Conifer Species Using Terrestrial Laser Scanning; University of Montana: Missoula, MT, USA, 2013. [Google Scholar]
- Maltamo, M.; Mustonen, K.; Hyyppä, J.; Pitkänen, J.; Yu, X. The accuracy of estimating individual tree variables with airborne laser scanning in a boreal nature reserve. Can. J. For. Res. 2004, 34, 1791–1801. [Google Scholar] [CrossRef]
- Salas, C.; Ene, L.; Gregoire, T.G.; Næsset, E.; Gobakken, T. Modelling tree diameter from airborne laser scanning derived variables: A comparison of spatial statistical models. Remote Sens. Environ. 2010, 114, 1277–1285. [Google Scholar] [CrossRef]


| Whole Plot | Plot 1 | Plot 2 | Plot 3 | Plot 4 |
|---|---|---|---|---|
| Slope (°) | 11 | 21 | 28 | 28 |
| Elevation (m a.s.l.) | 1588 | 1365 | 1364 | 1407 |
| Tree Density (tree/ha) | 477 | 772 | 716 | 883 |
| BA (m2/ha) | 40.40 | 37.77 | 42.79 | 37.58 |
| Vertical Structure | single layered | multilayered | multilayered | multilayered |
| Larix decidua (BA %) | 99 | 20 | 11 | 44 |
| Picea abies (BA %) | 1 | 65 | 42 | 26 |
| Pinus sylvestris (BA %) | 0 | 9 | 9 | 30 |
| Other Species (BA %) | 0 | 6 | 38 | 0 |
| Felled trees | ||||
| N | 47 | 18 | 16 | 19 |
| Tree Height Mean (m) | 28.61 | 19.64 | 18.69 | 17.17 |
| Tree Height Min (m) | 19.80 | 14.00 | 13.70 | 12.00 |
| Tree Height Max (m) | 34.90 | 25.50 | 25.50 | 23.00 |
| Tree Height SD (m) | 3.18 | 2.93 | 3.39 | 3.10 |
| DBH (cm) | 34.04 | 28.56 | 30.71 | 28.68 |
| BA (m2/ha) | 4.84 | 1.23 | 1.40 | 1.30 |
| Crown H (m) | 18.40 | 9.01 | 11.32 | 6.94 |
| Crown A (m2) | 8.87 | 11.84 | 13.06 | 10.13 |
| Species | ALS10 | ALS5 | ALS1 | |||
|---|---|---|---|---|---|---|
| N | % | N | % | N | % | |
| All | 100 | 100 | 73 | 73 | 56 | 56 |
| L. decidua | 48 | 100 | 35 | 73 | 27 | 56 |
| P. abies | 31 | 100 | 27 | 87 | 21 | 68 |
| P. sylvestris | 21 | 100 | 11 | 52 | 8 | 38 |
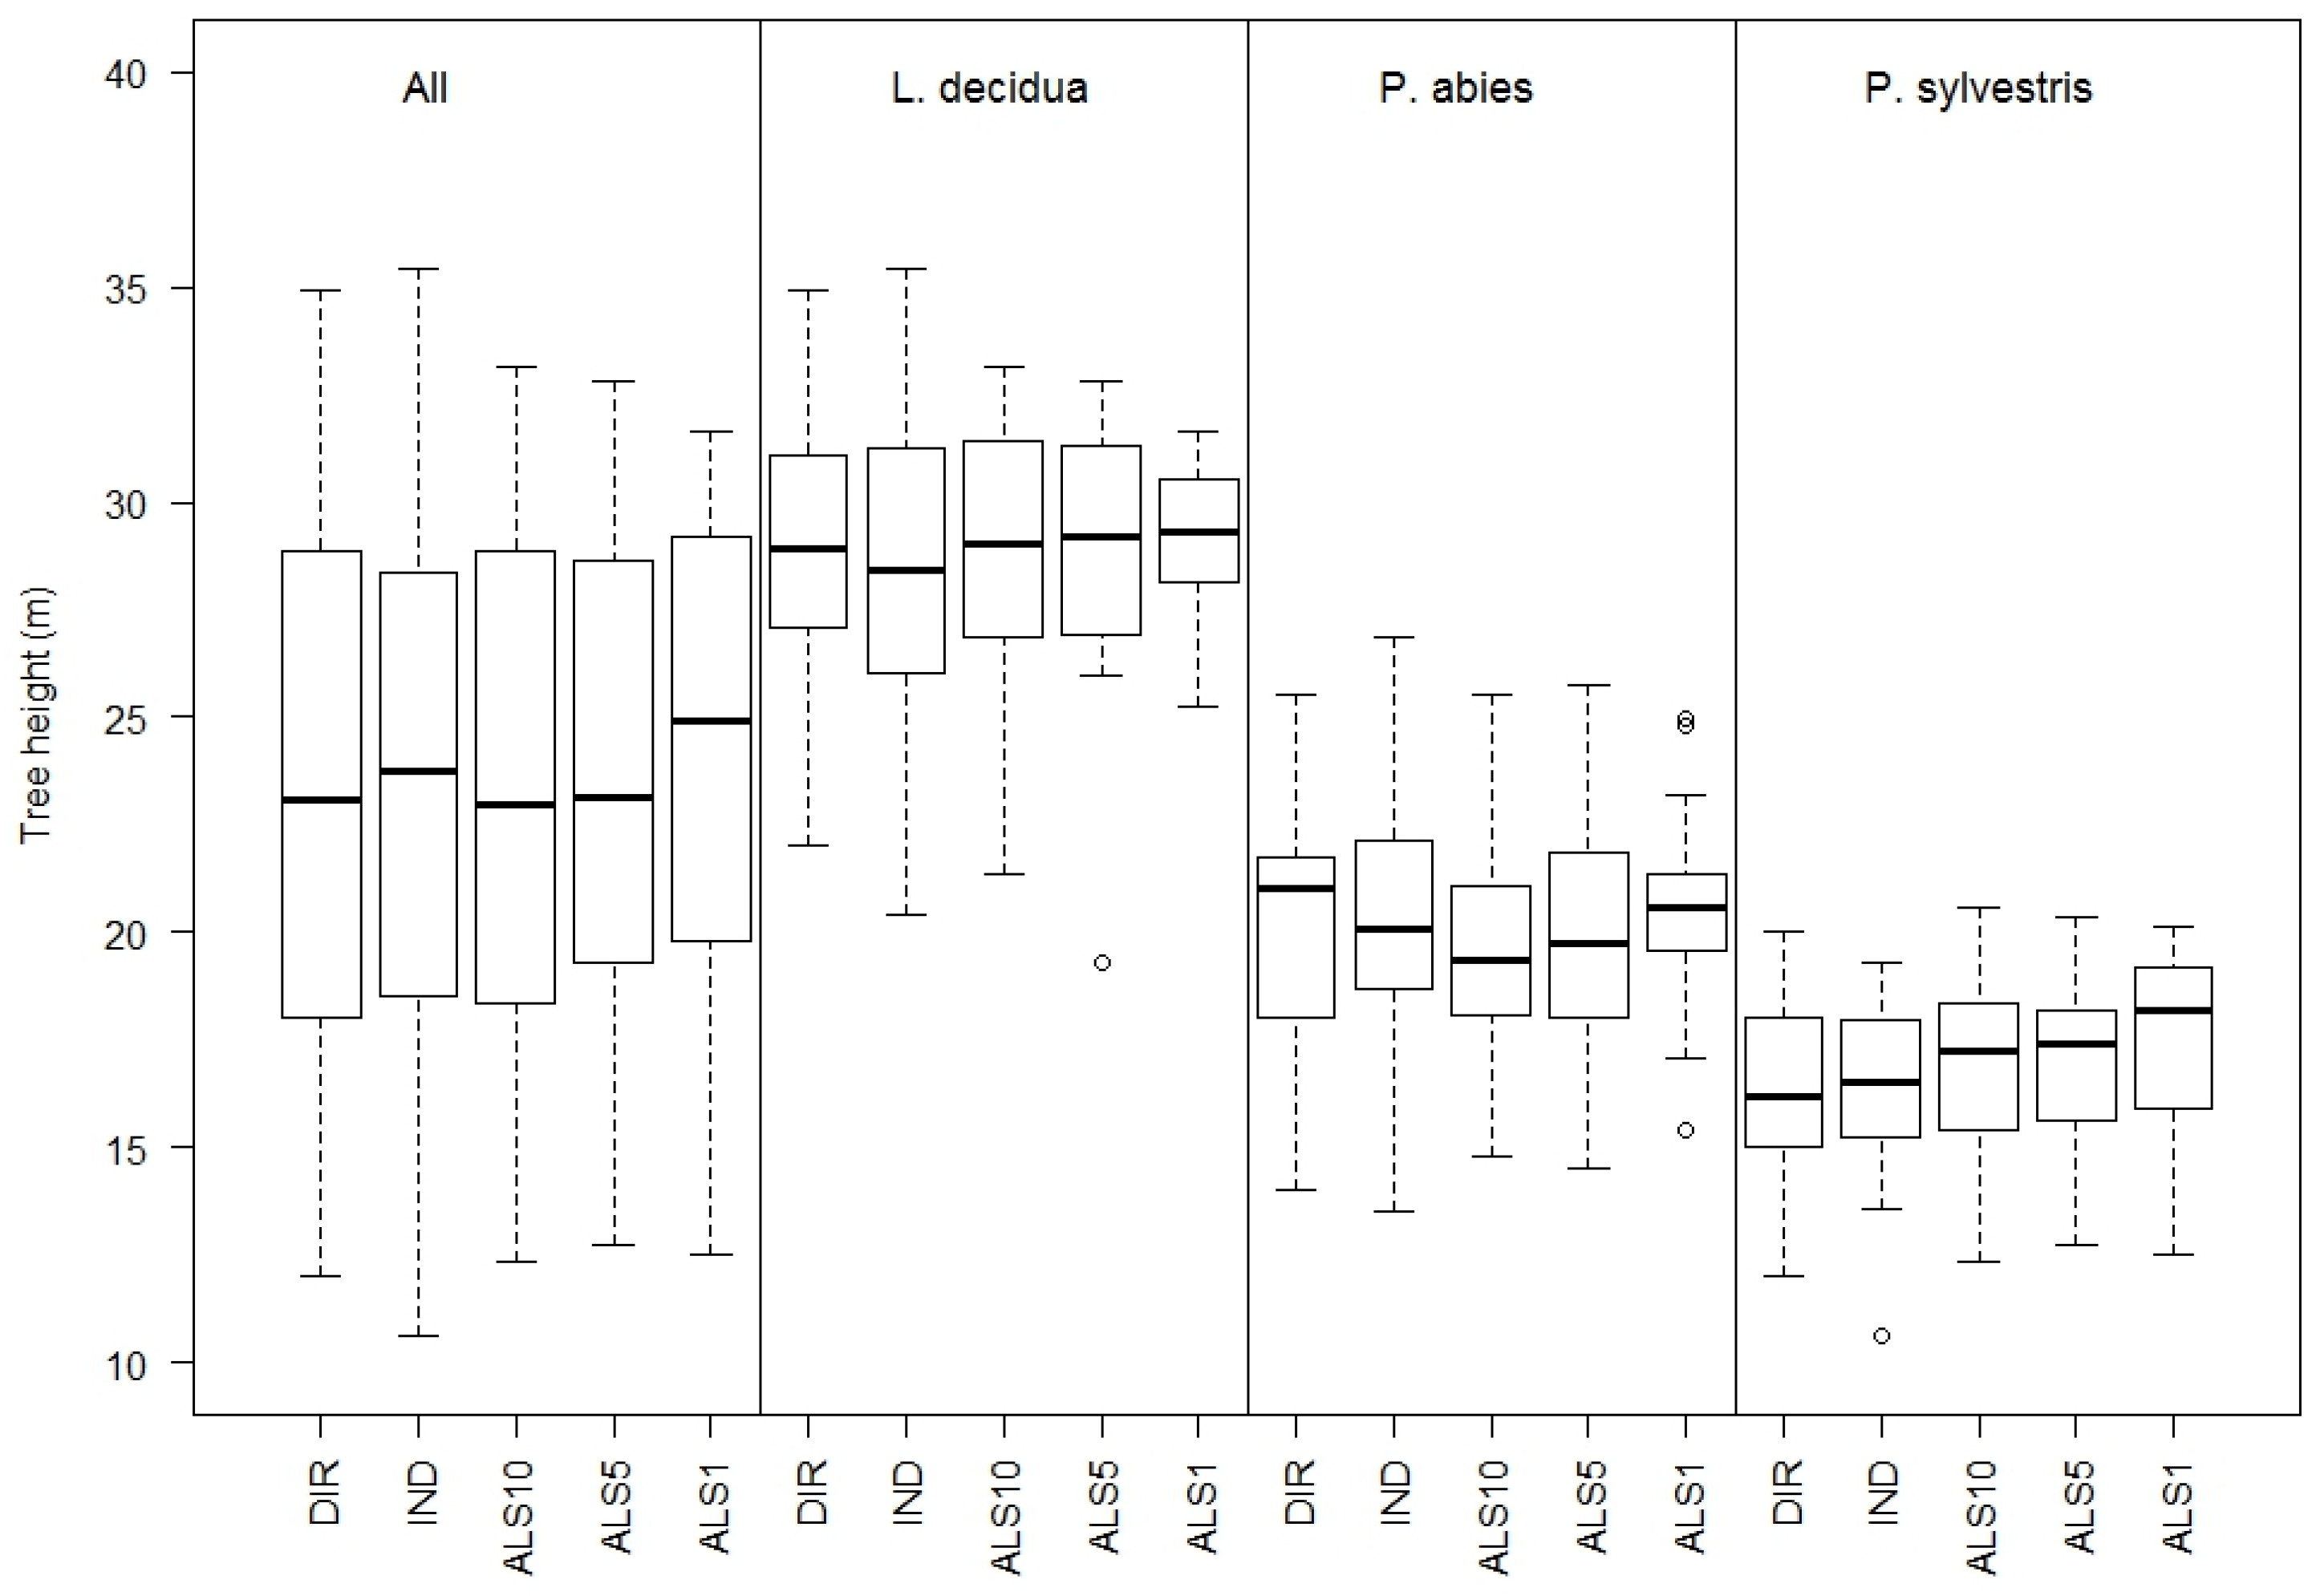
| Species | Metric | DIR | IND | ALS10 | ALS5 | ALS1 |
|---|---|---|---|---|---|---|
| All | N | 100 | 100 | 100 | 73 | 56 |
| Mean (m) | 23.51 | 23.44 | 23.51 | 23.77 | 24.14 | |
| SD (m) | 6.10 | 5.98 | 5.96 | 5.81 | 5.23 | |
| L. decidua | N | 48 | 48 | 48 | 35 | 27 |
| Mean (m) | 28.99 | 28.56 | 28.96 | 28.98 | 28.94 | |
| SD (m) | 2.82 | 3.44 | 2.77 | 2.80 | 1.88 | |
| P. abies | N | 31 | 31 | 31 | 27 | 21 |
| Mean (m) | 19.97 | 20.26 | 19.64 | 19.84 | 20.52 | |
| SD (m) | 2.97 | 3.05 | 2.69 | 2.92 | 2.28 | |
| P. sylvestris | N | 21 | 21 | 21 | 11 | 8 |
| Mean (m) | 16.21 | 16.41 | 16.79 | 16.86 | 17.40 | |
| SD (m) | 2.22 | 2.15 | 2.29 | 2.34 | 2.55 |
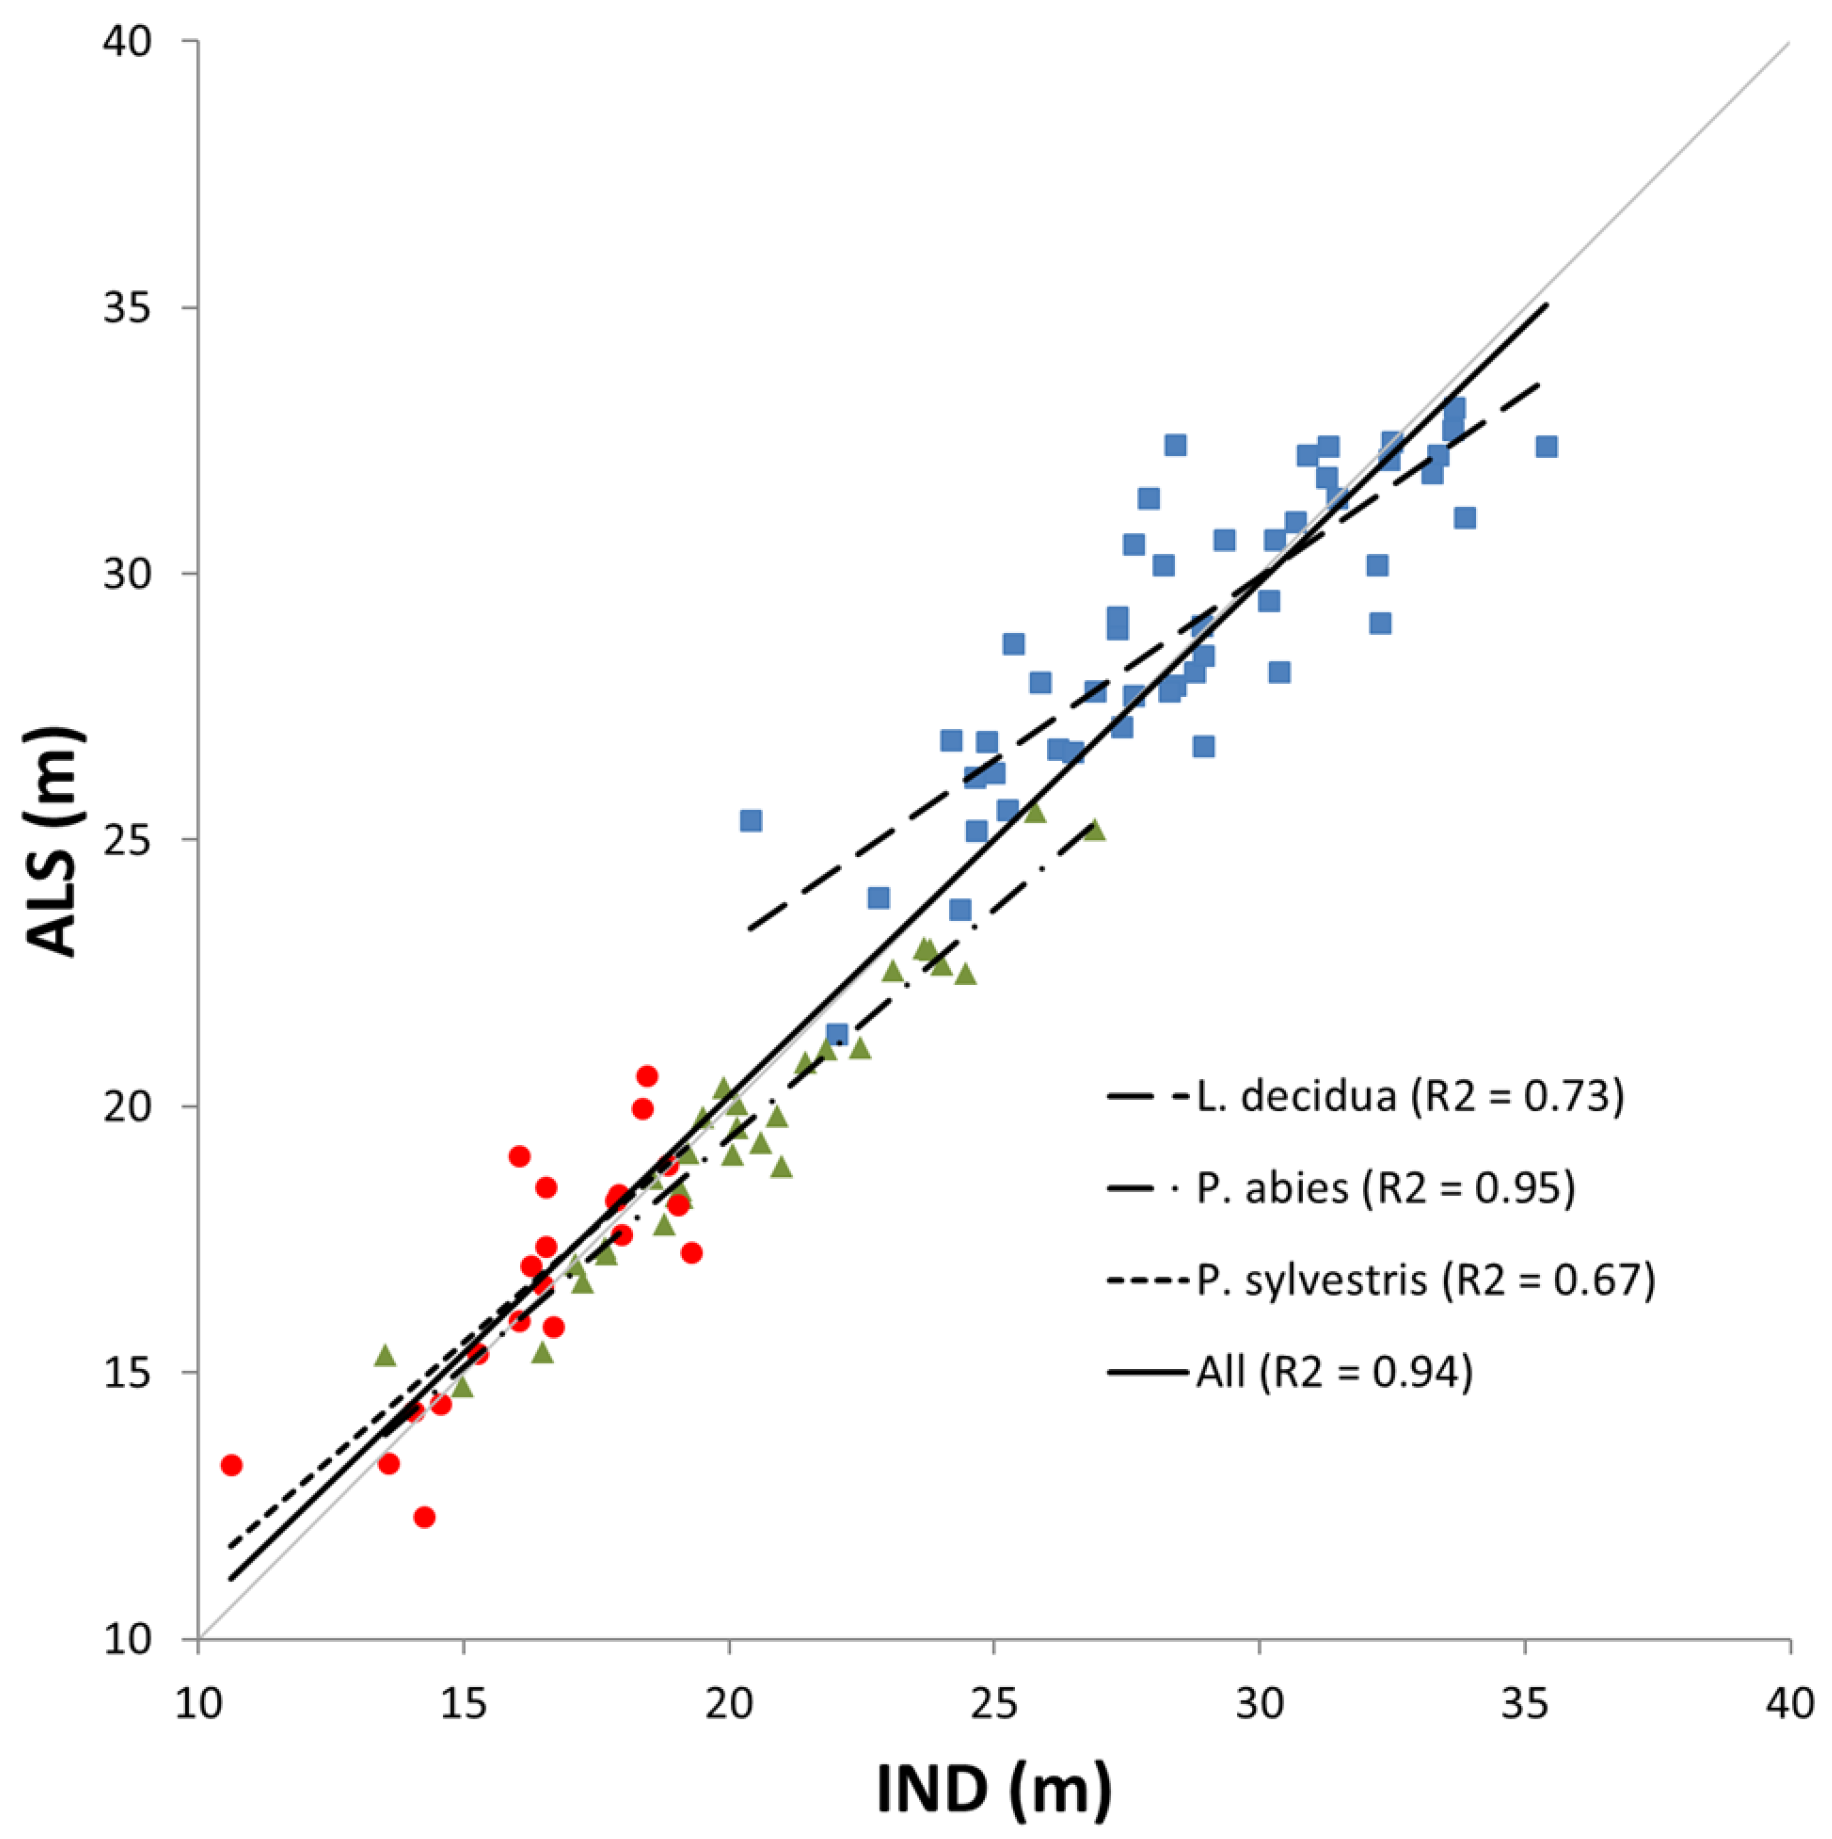
| Species | IND vs. ALS10 | IND vs. ALS5 | IND vs. ALS | |||
|---|---|---|---|---|---|---|
| MD | RMSE | MD | RMSE | MD | RMSE | |
| All | 0.08 | 1.00 | −0.31 | 1.16 | −0.10 | 1.41 |
| L. decidua | 0.39 | 1.42 | −0.13 | 1.51 | −0.22 | 1.18 |
| P. abies | −0.62 | 0.62 | −0.83 | 1.42 | −0.43 | 1.00 |
| P. sylvestris | 0.38 | 1.28 | 0.39 | 1.15 | 1.20 | 0.90 |
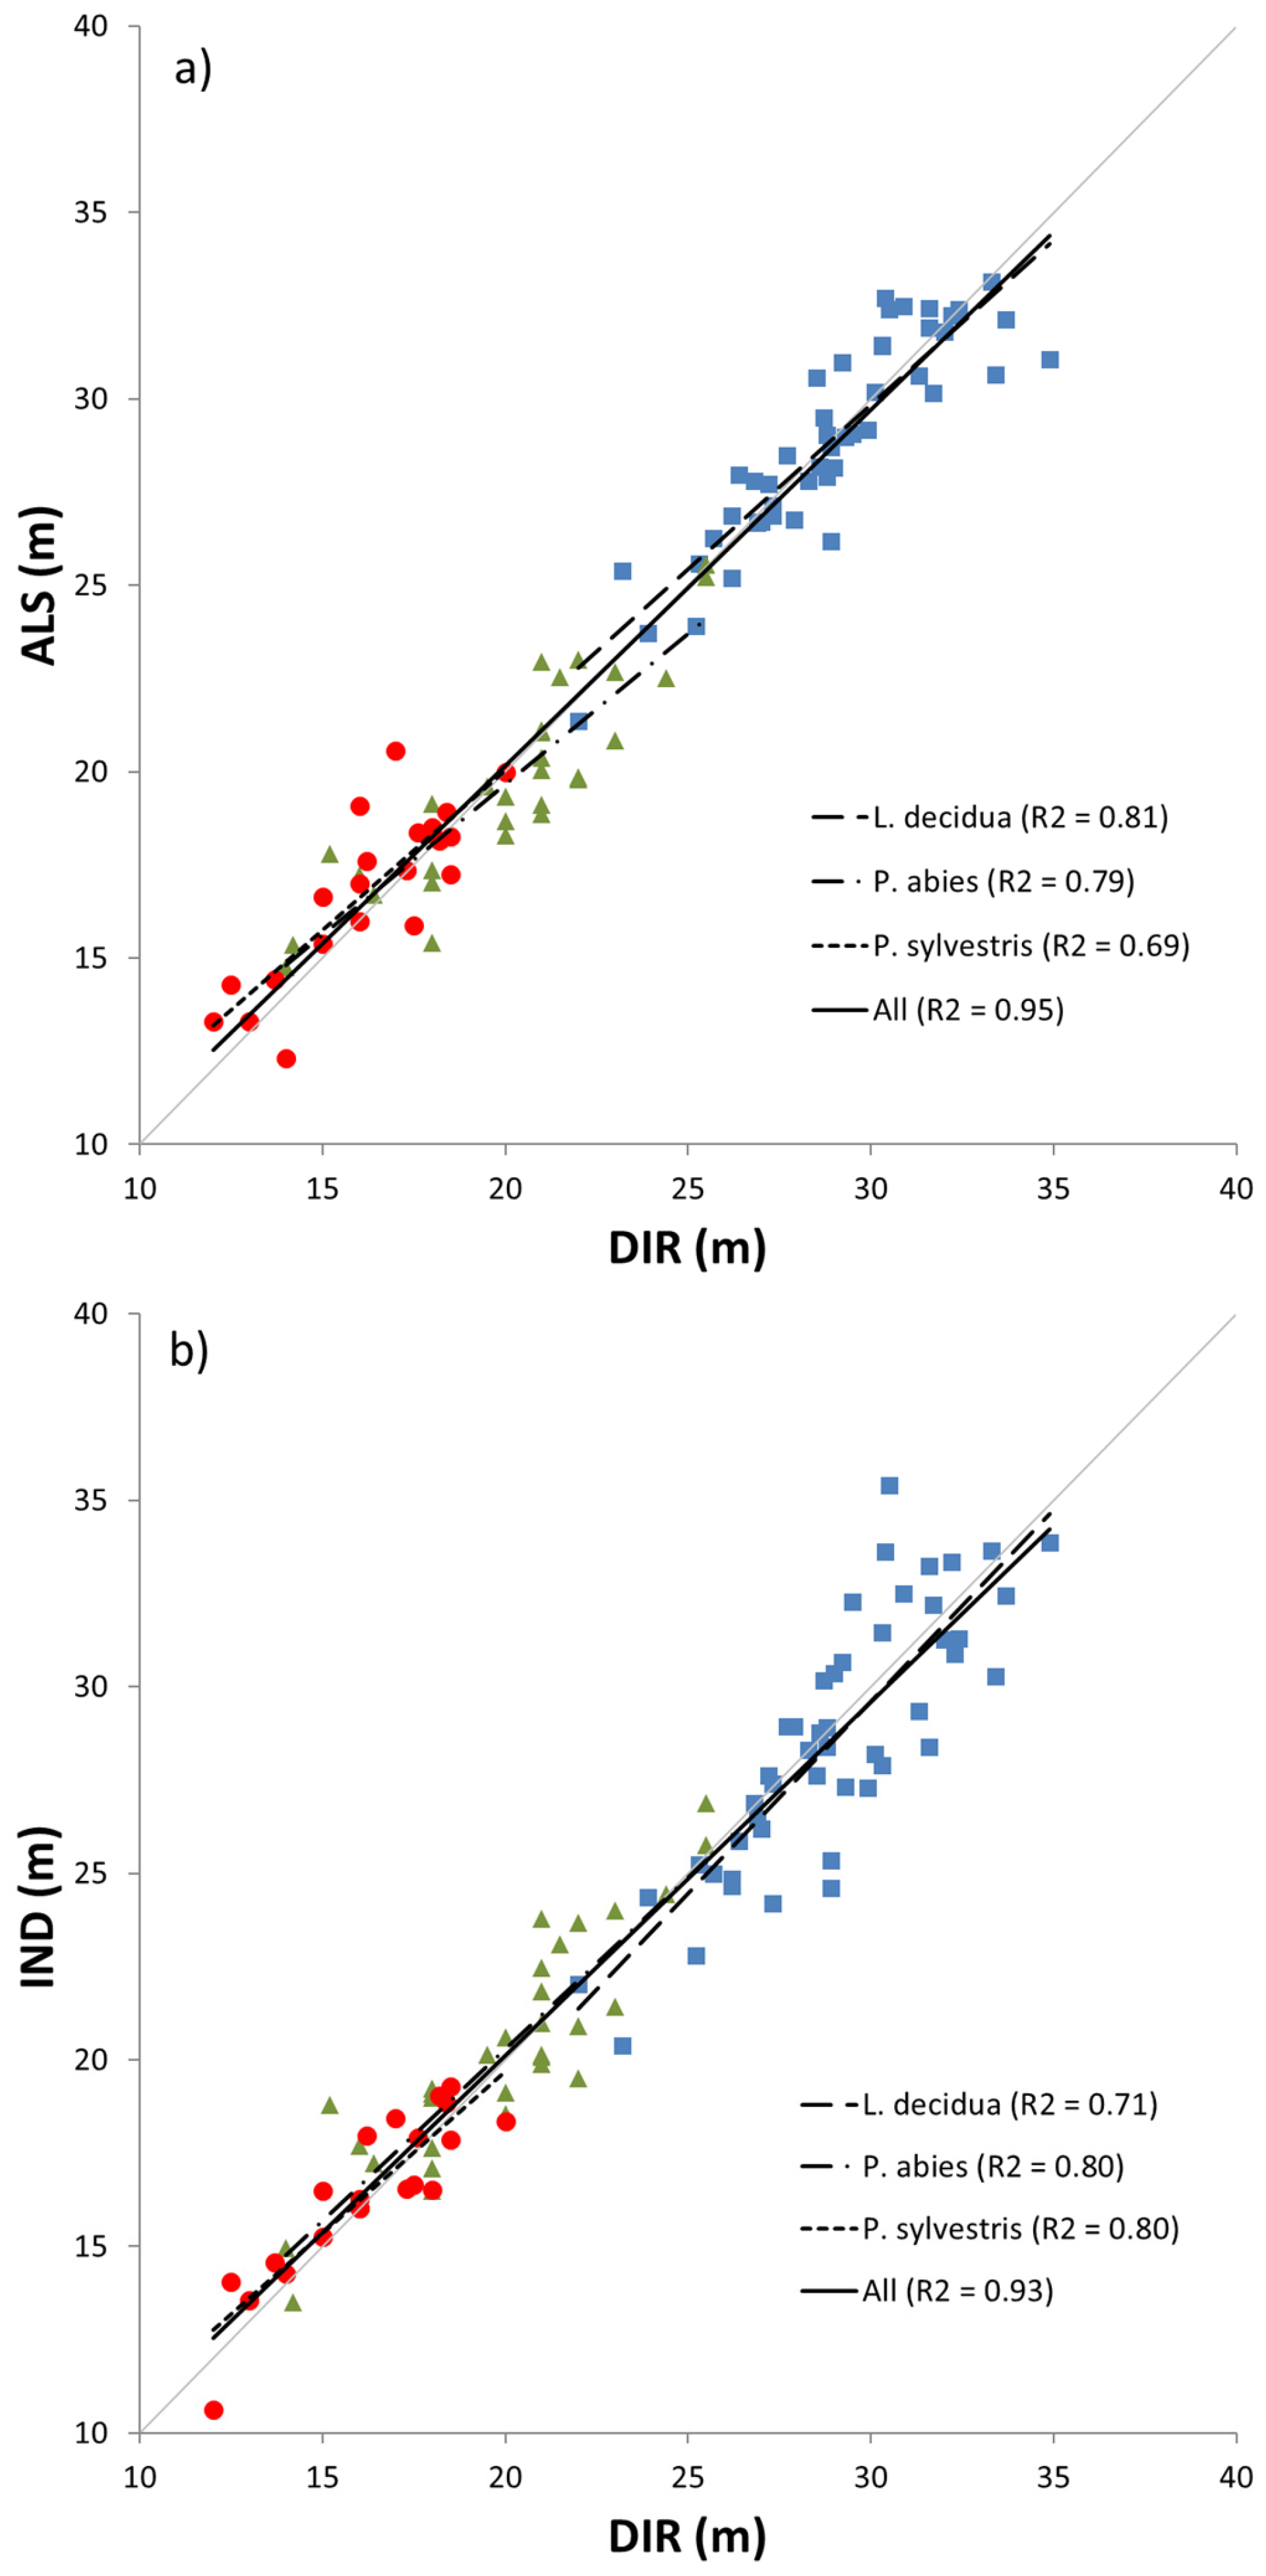
| Species | DIR vs. ALS10 | DIR vs. ALS5 | DIR vs. ALS1 | |||
|---|---|---|---|---|---|---|
| MD | RMSE | MD | RMSE | MD | RMSE | |
| All | 0.00 | 0.76 | −0.48 | 0.97 | −0.43 | 1.11 |
| L. decidua | −0.03 | 1.21 | −0.63 | 1.45 | −1.06 | 1.18 |
| P. abies | −0.33 | 1.21 | −0.74 | 1.83 | −0.17 | 1.28 |
| P. sylvestris | 0.58 | 1.25 | 0.60 | 1.24 | 1.05 | 1.26 |
© 2016 by the authors; licensee MDPI, Basel, Switzerland. This article is an open access article distributed under the terms and conditions of the Creative Commons Attribution (CC-BY) license (http://creativecommons.org/licenses/by/4.0/).
Share and Cite
Sibona, E.; Vitali, A.; Meloni, F.; Caffo, L.; Dotta, A.; Lingua, E.; Motta, R.; Garbarino, M. Direct Measurement of Tree Height Provides Different Results on the Assessment of LiDAR Accuracy. Forests 2017, 8, 7. https://doi.org/10.3390/f8010007
Sibona E, Vitali A, Meloni F, Caffo L, Dotta A, Lingua E, Motta R, Garbarino M. Direct Measurement of Tree Height Provides Different Results on the Assessment of LiDAR Accuracy. Forests. 2017; 8(1):7. https://doi.org/10.3390/f8010007
Chicago/Turabian StyleSibona, Emanuele, Alessandro Vitali, Fabio Meloni, Lucia Caffo, Alberto Dotta, Emanuele Lingua, Renzo Motta, and Matteo Garbarino. 2017. "Direct Measurement of Tree Height Provides Different Results on the Assessment of LiDAR Accuracy" Forests 8, no. 1: 7. https://doi.org/10.3390/f8010007