
Variability in Larch (Larix Decidua Mill.) Tree-Ring Growth Response to Climate in the Polish Carpathian Mountains

AGH University of Science and Technology, 30-059 Kraków, Poland
*
Author to whom correspondence should be addressed.
Forests 2017, 8(10), 354; https://doi.org/10.3390/f8100354
Submission received: 10 July 2017
/
Revised: 31 August 2017
/
Accepted: 14 September 2017
/
Published: 21 September 2017
(This article belongs to the Special Issue How Global Warming Affects Xylogenesis: Tree Responses and Consequences)
Abstract
:The climate–growth relationship of larch (Larix decidua Mill.) in the Polish Carpathian Mountains was studied. We explored the spatial variability of the common signal observed in larch tree-ring growth, distinguished regions with uniform tree-ring growth patterns (dendrochronological signal), and determined the climatic factors that are particularly important for the growth of larch in this area. Uniformity in the growth reaction across the analyzed area was found in the positive response to May temperatures (significant correlation values range from 0.21 to 0.48); this indicates that the warm beginning of the growing season is important for larch growth across the study area. The signal variability from west to east found in the principal components analysis (PCA) results and differences in climate response between analyzed sites suggest their relation to increasing influence of the continental climate to the east. However, the observed relationship is not stable and does not occur systematically. Although the climate–growth response of larch at lower elevations is highly variable, a positive influence of July precipitation and a negative influence of April precipitation, and previous May and July temperature can be observed. The growth of larch from the highest study sites (Tatra Mountains, above 950 m a.s.l.) is related to temperature. This is manifested by a strong positive correlation with temperature during late spring, early summer, and the end of the previous growing season, and a negative or no response to late spring/summer precipitation. No relation between the observed correlations and slope aspect was found.
1. Introduction
The climate is one of the most important factors that influence forest ecosystems, as its changes can greatly affect the growth of trees and thus forest productivity [1]. Mountainous areas are especially sensitive to changes in climate [2]. More knowledge about how forests respond to climate variability is needed to predict and assess the effect of future climate changes on mountain forest ecosystems [3]. It is also necessary to improve management strategies and adjust forestry practices accordingly [1,4,5]. In this context, tree-ring analysis is a valuable data source that provides information on the influence of past and recent climatic variations on tree growth as well as possible forest responses to predicted climate changes (see [6] for review).
Studies on the interaction between mountain forest ecosystems and climate are challenging due to very dynamic and variable environmental conditions. Climate–growth relationship analysis makes it possible to identify and assess the influence of the most growth-limiting climatic factors. Regional studies help to establish a better understanding of tree growth response to climatic conditions in mountainous areas. Taking into consideration factors such as altitude and slope aspect allow for the determination of local growth drivers. Full recognition of both regional and local factors requires dense observations in regional networks. Additionally, tree growth response is species dependent. Analysis of the climate–growth relationship makes it possible to identify and assess the influence of climatic factors that limit tree growth. Regional studies make it possible to understand tree growth response to climatic conditions in mountainous areas, while taking into consideration the other aforementioned factors that influence these responses locally (e.g., [7]).
European larch (Larix decidua Mill.) is considered one of the most valuable forest trees in Poland. Naturally, this montane and subalpine species grows in the Alps, Sudetes, Carpathians (mainly the Tatra Mountains), and in some smaller areas of Europe (e.g., the Holy Cross Mountains in Poland). It is a fast-growing tree [8,9] with high wood quality and high resistance to air pollution [10,11]. These features have made larch cultivation popular in Europe since the 16th century and in Poland since the start of the 19th century (for comparison, see [12]). As a result, the share of larch in Polish forests is currently largely a result of planting. This is also true of the Carpathians, where larch grows mainly as an admixture tree species, mostly with beech, fir, and spruce in the lower parts of this mountain range.
The Alps are the natural and largest continuous habitat of the European larch. Therefore, existing studies on the relationship between the growth of European larch and climate focus mainly on this region and high-altitude locations [13,14,15]. Detailed studies have been conducted on its climate response sensitivity over time (temporal climate signal stability) [16,17], and in terms of latitude [18] and age [19]. Sites across the Alps have been used in regional dendroclimatic studies [17,18,20,21]. Considered as a species with high dendrochronological potential (highly temperature sensitive [21]), larch from Alpine areas has been used in climatic reconstructions (e.g., [22,23,24,25,26]). Tree-ring studies on larch in other mountain areas of Europe are sparse. Local studies have been done in Karkonosze (Giant Mountains, [27]) as a part of an ongoing broader study in the Sudetes. Studies on the climate–growth relationship of larch in the Carpathian Mountains have so far been conducted only on a local scale, including a few locations in the outer [28] and central-western (Tatra Mountains; [29,30]) parts of this mountain range. Moreover, some locations in the Carpathian foothills have been examined [31,32,33,34,35]; they provided valuable information on the larch tree-ring growth dynamic and its growth response to climate. However, there is a lack of a broader regional study on larch in this area concerning spatial tree-ring growth signal variability or the influence of altitude and slope aspect on the climate–growth relationship. To assess European larch’s future growth response to changing climate in the Carpathians, a regional approach is needed. A denser data network of observations provides a better means of understanding changing larch growth conditions. The creation of new growth models and the validation of existing models are also needed.
Here we present the first regional study on larch in the Polish Carpathians. We analyzed the tree rings of larches growing at different altitudes and on slopes with various aspects in the foothills and higher parts of Polish Carpathian Mountains. We explored the spatial variability of the common signal observed in larch tree-ring growth and distinguished regions with a uniform climate signal. We determined the climatic factors particularly important for the growth of larch in this area and checked if and to what extent altitude and slope aspect affect the sensitivity of trees to climatic factors.
2. Materials and Methods
2.1. Study Area Characteristics and Site Locations
The study area was situated in the central and eastern parts of the Polish Carpathian Mountains. Sites were located in the three distinguishable parts of this range: The Outer Western Carpathians, the Central Western Carpathians, and the Outer Eastern Carpathians (Figure 1). Differences between these regions are reflected in the geological, geomorphological, geographical, climatological, and geobotanical divisions of this region [36,37,38]. However, the boundaries (especially between the Outer Western and Eastern Carpathians) can differ slightly depending on the division type (i.e., [36,38]). The Outer Carpathians is an area of foothills that widens to the east, with gentle hills rising to 400–500 m a.s.l. The innermost part of The Outer Carpathians is a medium-elevation mountain zone (the Beskids in the Western Carpathians and Bieszczady in the Eastern Carpathians) with mountain ranges that rarely exceed 1000 m a.s.l. [39]. Only the Tatra Mountains, a part of the Central Western Carpathians with ridges reaching elevations above 2000 m a.s.l., have the features of high mountain environments [40].
The climate of the Polish Carpathians is a mixture of climatic influences that act on three different levels. On a macroscale, from west to east, the ocean influence (characterized by smaller temperature amplitudes, early spring and summer, and short winter) is diminished by the growing influence of the continental climate (larger temperature amplitudes rising eastbound, long summer, long and cold winter). The second, mesoscale level, is the influence of the mountain climate, which rises to the south and is characterized by a decrease in altitude-dependent temperatures, shorter summers, longer winters (observed especially in the eastern part), and a possible luv/lee precipitation effect. Precipitation, whose annual totals range from 650 mm (northern part of the foothills) to more than 1000 mm (the inner, highest parts of the mountains), is usually higher in the western part of the area ([37], Figure 1). However, precipitation is strongly dependent on altitude and slope aspect (microscale level of influence).
Of the 35 study sites, 22 were located in mountainous areas and 13 were in the foothills zone (Figure 1). In the analysis, besides the new locations (18 sites), existing data from previous local studies on larch conducted by authors [33,34,35] were also used. The sampled trees grow at altitudes of 278 to 1287 m a.s.l., with almost a half of them in the range 400 to 600 m a.s.l. Only three locations were above 900 m a.s.l. in the Tatra Mountains (tp1–tp3), which is the highest part of the Carpathians. In the Polish part of the Tatra Mountains, there are only a few forest stands with larch more than 100 years old—all are protected by the Tatra National Park, therefore only three sites could be sampled in this area. In addition to their different altitudes, the study sites also varied in terms of slope aspect (Table 1). Sites with a north-facing component predominated; this reflects the general tendency in this area for larch to be present mostly on northern slopes (according to forest management). Tree stands with larches aged over 100 years were selected for the analysis. Trees grow in mixed stands (mainly with silver fir, Norway spruce, European beech, and sometimes Scots pine) of the mountain fresh forest type [42], usually on cambisols (Table 1).
2.2. Site Chronologies and Characteristics
In total, 604 trees were sampled using standard procedures: Cores were taken at breast height with a Pressler borer in a direction parallel to the slope. Two cores were collected from each tree, with the exception of sites br1, de1, de2 and my1, where one core per tree was taken. After preparation, all cores were measured using the LINTAB™ 6 tree-ring measurement system with TSAP-Win™ Professional software (4.69k, RINNTECH, Heidelberg, Germany). Tree-ring sequences from each site were compared visually in Quercus software (06.01, AGH-UST, Krakow, Poland) [43], correlated, and dated with COFECHA software (6.06, Tree-Ring Lab (TRL) and Columbia University, New York, NY, USA) [44]. Core series from the same tree were averaged. For trees showing the highest correlation to others within one site, site chronologies were then built and developed in ARSTAN software (ARS44h2 xp, Tree-Ring Lab (TRL) and Columbia University, New York, NY, USA) [45]. This procedure was performed in order to improve the intra-site common signal. Before standardization, data-adaptive power transformation was applied to stabilize variance and mitigate differences in variability between parts of the tree-ring series [46]. In dynamic environments, long systematic series of both underfitted and overfitted values are observed after the first detrending; therefore, the classic double detrending method was then applied (linear or negative exponential regression followed by a cubic smoothing spline with 50% frequency response cut-off equal to two-thirds of the series length [47]). A second detrending was applied to remove this phenomenon [48,49]. Chronologies were developed by averaging the individual series based on the biweight robust mean. For further analysis, the residual versions of site chronologies (with the effect of autocorrelation removed by autoregressive modelling) were used. High frequency variability is highlighted in this type of chronology; this makes it commonly used for climate–growth relationship studies [50]. Standard chronologies (developed after detrending, but without autocorrelation removing), especially from lower elevation sites, can be less sensitive to climate variations and show lower correlation with climatic variables (e.g., [51]). To characterize the residual site chronologies (Table 2), we calculated: mean sensitivity (MS, a measure of annual variability in a tree-ring series); first order autocorrelation (AC, a measure of the relation between growth in the previous and current year); mean inter-series correlation (mean Rbar, common variance between series); and Expressed Population Signal (EPS, the degree to which a developed chronology depicts the hypothetical chronology, based on an infinite number of trees). The use of mean sensitivity makes it possible to assess high-frequency variations in chronologies, whereas first order autocorrelation does the same for the persistence of tree-ring patterns [52]. The common variance and signal strength of each chronology can be assessed by values of mean Rbar and EPS [53]. These values were computed using a 30-year moving window with a 15-year overlap.
2.3. Climate Data
CRU TS v. 1.2 grid data (the average monthly air temperature and total monthly precipitation for the period 1901–2000 from a 10′ × 10′ grid network) were used [54] due to the lack of weather stations or stations with long-term data sets available for many of the analyzed sites (compare [55]). Their applicability was checked. Data covering the longest possible periods of time from the main eight weather stations in the analyzed area (Kraków-Balice, Tarnów, Zakopane, Kasprowy Wierch (data available since 1951), Nowy Sącz (since 1954), Rzeszow-Jasionka (since 1952), Krosno (temperature since 1961, precipitation since 1951), and Lesko (since 1954)) were compared with grid data from corresponding grid boxes. Data were compared for the maximum available overlapping period for gridded and weather station data. Unfortunately, no data covering the first half of the century were available. The mean Pearson correlation coefficients for temperature and precipitation were 0.986 and 0.876, respectively. The biggest difference between grid and weather station data was observed for Kasprowy Wierch (0.742 for precipitation) and Lesko (0.977 for temperature; [56]); this can be explained by the mean height of the grid box for this location (height amendment). Box-whisker plots for particular months were also compared. The size and value ranges in the boxes for each month were similar. Visible differences were found only for Kasprowy Wierch and Zakopane precipitation data. Outlier and extreme values were more often presented in weather station data. The difference in mean values between grid and weather station data (checked with t-Student test and ANOVA analysis) was statistically insignificant, with the exception of Kasprowy Wierch. Determination coefficients (R2) for linear regression models were also computed. Weather station data and grid data were chosen as dependent and independent datasets, respectively. The mean R2 value for temperature was 0.97 and for precipitation was 0.77. Using these regression models (without Kasprowy Wierch and Zakopane (precipitation)), a mean linear regression model for all weather stations was established. This helped to compute possible differences between grid and weather station data. The results of the performed analysis (high values of correlation coefficients, insignificant difference in mean value, except for Kasprowy Wierch precipitation data, and the high similarity seen on box-whisker plots) support the idea of using grid data in the presented study (for details see [56]).
2.4. Regional Patterns of Common Variation among Site Chronologies
Hierarchical agglomerative clustering (Ward’s method) was applied to distinguish regions with similar tree-ring patterns and to show differences and similarities between site chronologies in growth response to climate. A value of 1−r Pearson distance was used as a measure of similarity between the constructed chronologies. This analysis was performed for the common period 1922–2008. The common period starts from the year in which replication for every site chronology reached a minimum of five trees, thus ensuring sufficient signal strength (compare [18,30]).
To quantify factors causing the differences revealed by cluster analysis, principal component analysis was performed using a covariance matrix. This technique replaces the original p variables (here, indices of tree-ring chronology) with a smaller number (q) of derived variables (principal components) which are linear combinations of the original variables. Often, it is possible to retain most of the variability in the original variables, with q very much smaller than p [57]. Varimax rotation was applied to improve the interpretability of the results [58]; this involves scaling the loadings by dividing them by the corresponding communality, and then rotation, which maximizes this quantity. In this step, only the components that expressed at least 5% of the variability were used, as guided by other similar studies (e.g., [7,55]). To confirm the identification of factors, the first three principal components (PCs) were plotted against geographical position, altitude, and slope aspect.
2.5. Climate Influence on Tree-Ring Growth
In order to investigate the influence of climate on tree-ring growth, DENDROCLIM 2002 [59] was used to calculate the values of correlation coefficients between residual versions of particular site chronologies, average monthly temperatures, and monthly precipitation totals. Analysis was performed in the same common period (1922–2000).
To identify the climate variables most likely to have associations with tree-ring growth of larch from the analyzed area, the spatial replication criterion described in [60] was applied. In the presented study of 35 study sites, a climate variable meets spatial replication criterion if n ≥ 6 sites have significant correlations with the same sign. This value is obtained using a binomial distribution with n = 35, p = 0.05, and a cut-off probability of 0.997, determined by Bonferroni adjustment 0.003 (0.05/17) with 17 monthly variables for each climate characteristic. The results that met this criterion were analyzed to find the geographical, altitudinal, and slope aspect patterns.
3. Results
3.1. Chronologies Characteristics
Table 2 presents statistics for 35 site chronologies. The ages of the constructed chronologies range from 94 to 148 years, with one exception: the chronology from the highest site, tp1, which was much older (274 years). The mean values of first order autocorrelation computed on the raw tree-ring series range from 0.62 to 0.88; this indicates a strong relationship between tree-ring growth in the current and previous year. The values of mean sensitivity vary from 0.17 to 0.26. For 30 chronologies, they were equal or higher than 0.2; such values are usually considered as intermediate in terms of their applicability for dendroclimatological studies (compare [61]). The mean inter-series correlation values (mRbar) for indexed tree-ring series were relatively high (varied from 0.40 to 0.70). Neither a visible pattern nor a gradient related to altitude or slope aspect was found. The mean values of EPS varied from 0.87 to 0.97 and were higher than the frequently applied threshold of 0.85 [51].
3.2. Tree-Ring Growth and Its Spatial Variability, Influence of Altitude and Slope Aspect
Cluster analysis using the hierarchical agglomerative method distinguished four main groups of chronologies (clusters C1–C4, Figure 2). The first two clusters contain the chronologies from the most southeastern part of the analyzed area (with the exceptions of two sites (gr1 and sa2) that are situated farther to the west, Figure 1 and Figure 2). The group of sites located in the innermost and highest parts of this region is clearly separated (cluster C1); this is called Western Bieszczady (according to physical-geographical regionalization, [36]). The third cluster consists of chronologies from the Outer Western Carpathians (both foothills and mountainous locations (Figure 2)). The last, very distinct cluster contains chronologies from the highest region: the Tatra Mountains (Central Western Carpathians).
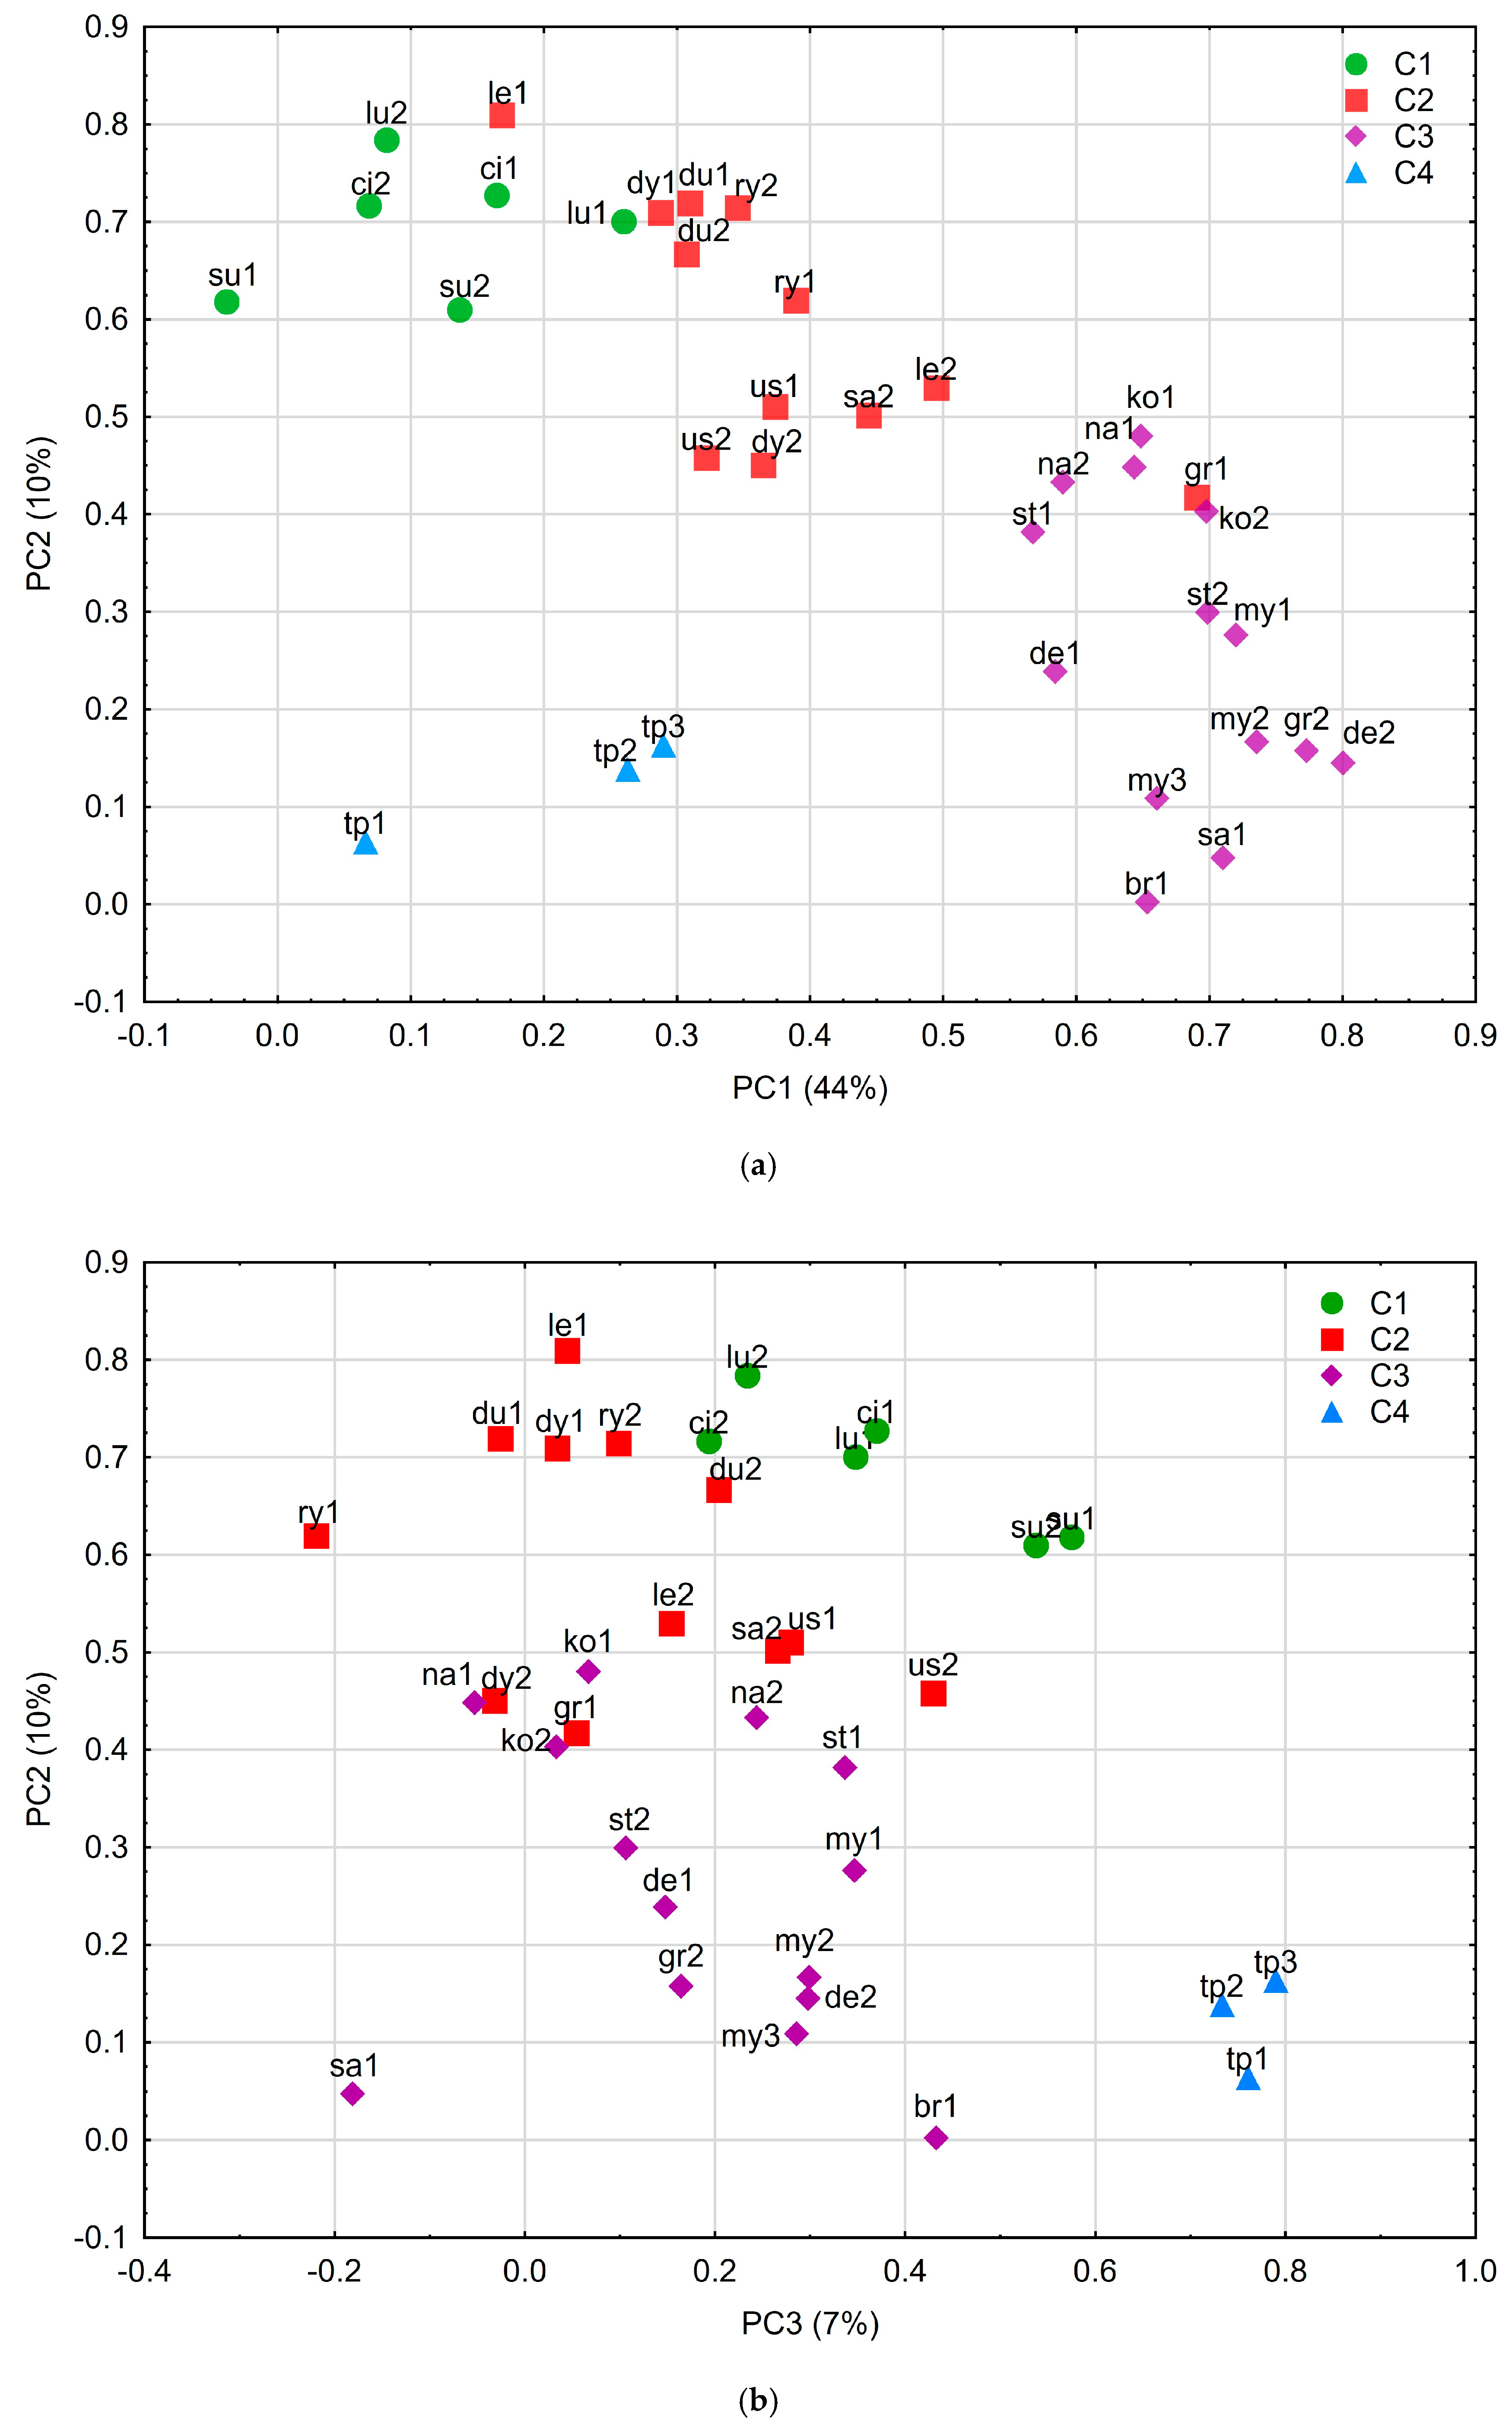
Principal component analysis was performed for deeper analysis of the observed clustering and understanding of the obtained division. The first principal component explained 44% of the variance, whereas PC2 and PC3 contribute 10% and 7%, respectively. Varimax rotation was performed for the first three PCs, taking into account other dendroecological studies (e.g., [7,55]) and the shape of the eigenvalues curve, with its flattening after PC3. The results of Varimax rotation are presented in Figure 3 and Figure 4; the former presents the share of the first three PCs attributed to each of the site chronologies. It can be observed that generally, when moving from west to east, the PC2 loading increases while the values of PC1 decrease. When distinguished clusters are considered, the aforementioned relation is even more visible. This could be a confirmation of the results of the cluster analysis (Figure 3b). The relationship between PC 1 and PC 2 observed for the Outer Carpathian sites (cluster C1, C2, and C3) is also shown in Figure 4, where the relation between particular PCs is presented. Tatra sites, where the third PC loading dominates (Figure 4b), are not part of this relation (see also Figure 4a). An increased PC3 is also observed in the highest sites of the Outer Eastern Carpathians (su1 and su2 from cluster C1), which suggests that PC3 is related to altitude.
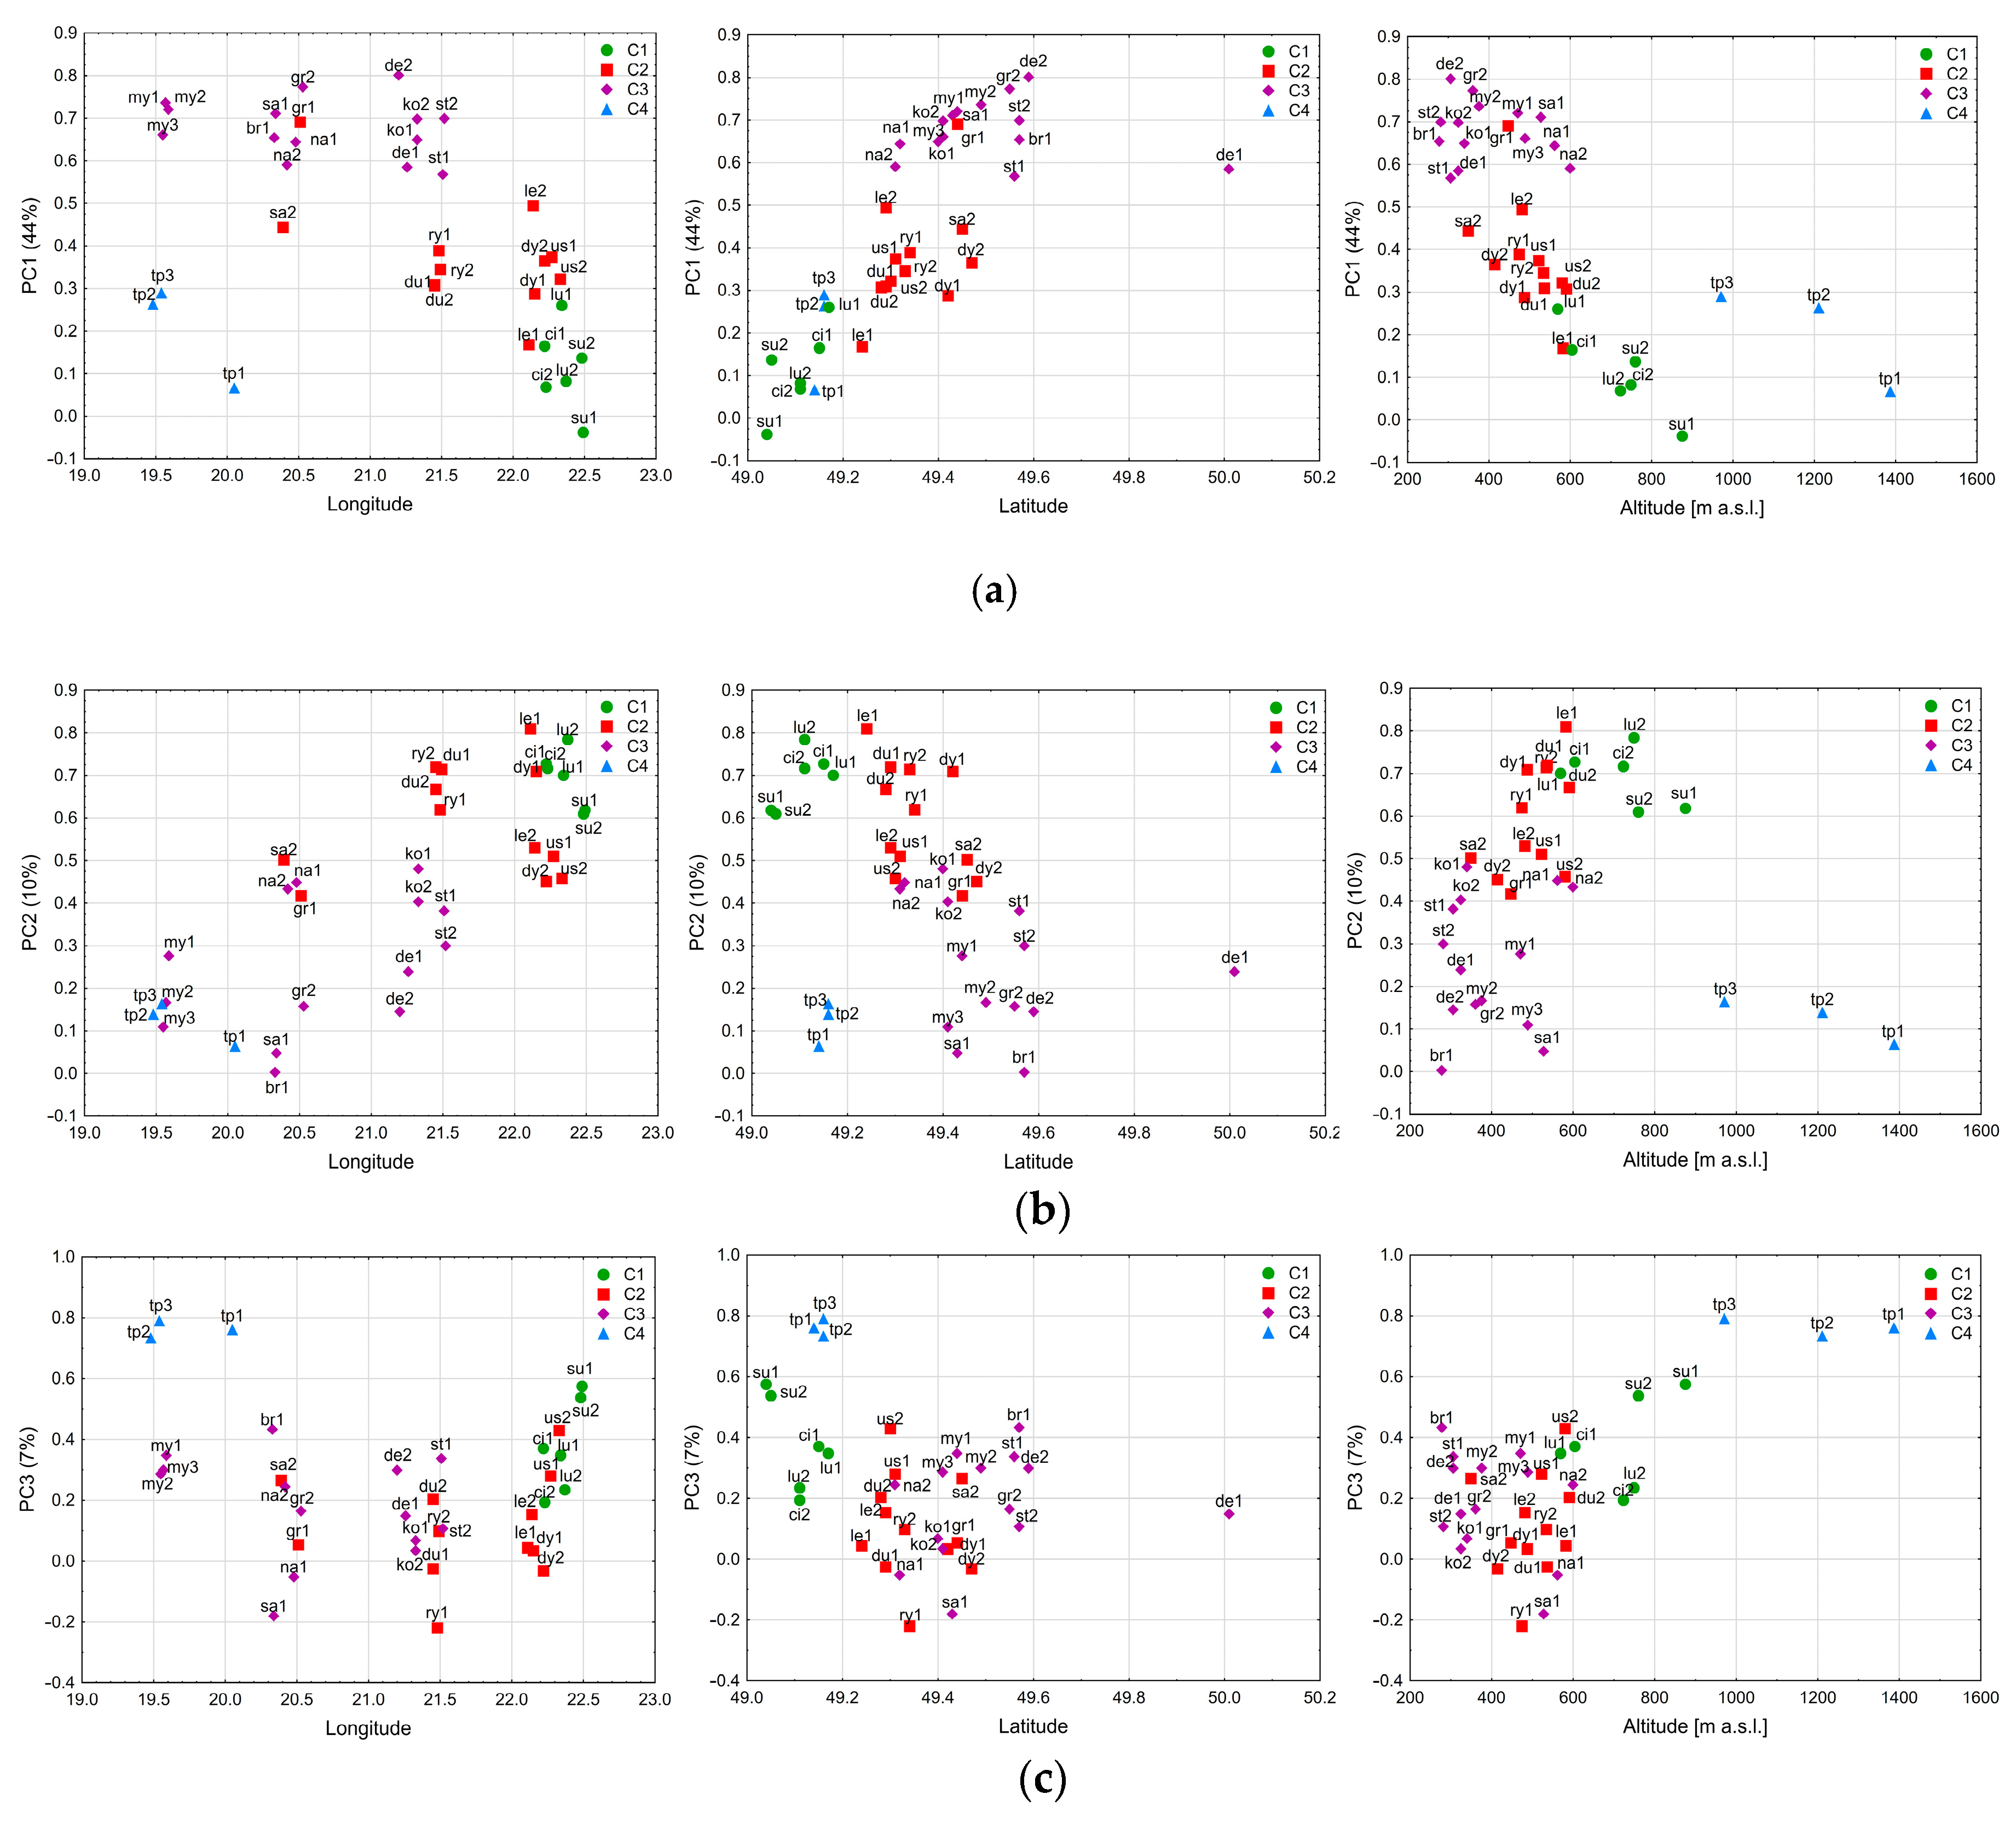
The results suggest that the obtained grouping, although locally modified by the influence of other site-related factors, is a mixed result of altitudinal and geographical site location. Figure 5 presents the first three PCs plotted against geographical position and altitude. A relationship between PC1, geographical position (mainly latitude), and altitude can be observed (Figure 5a). The influence of longitude on PC2 is also visible (Figure 5b). PC3 is exclusively related to site altitude (Figure 5c). The suggestion made in the previous paragraph seems confirmed: this relation is becoming clear for higher locations (Figure 5c). The results for slope aspects (not presented here) did not show any clear pattern.
3.3. Climate–Growth Relationship
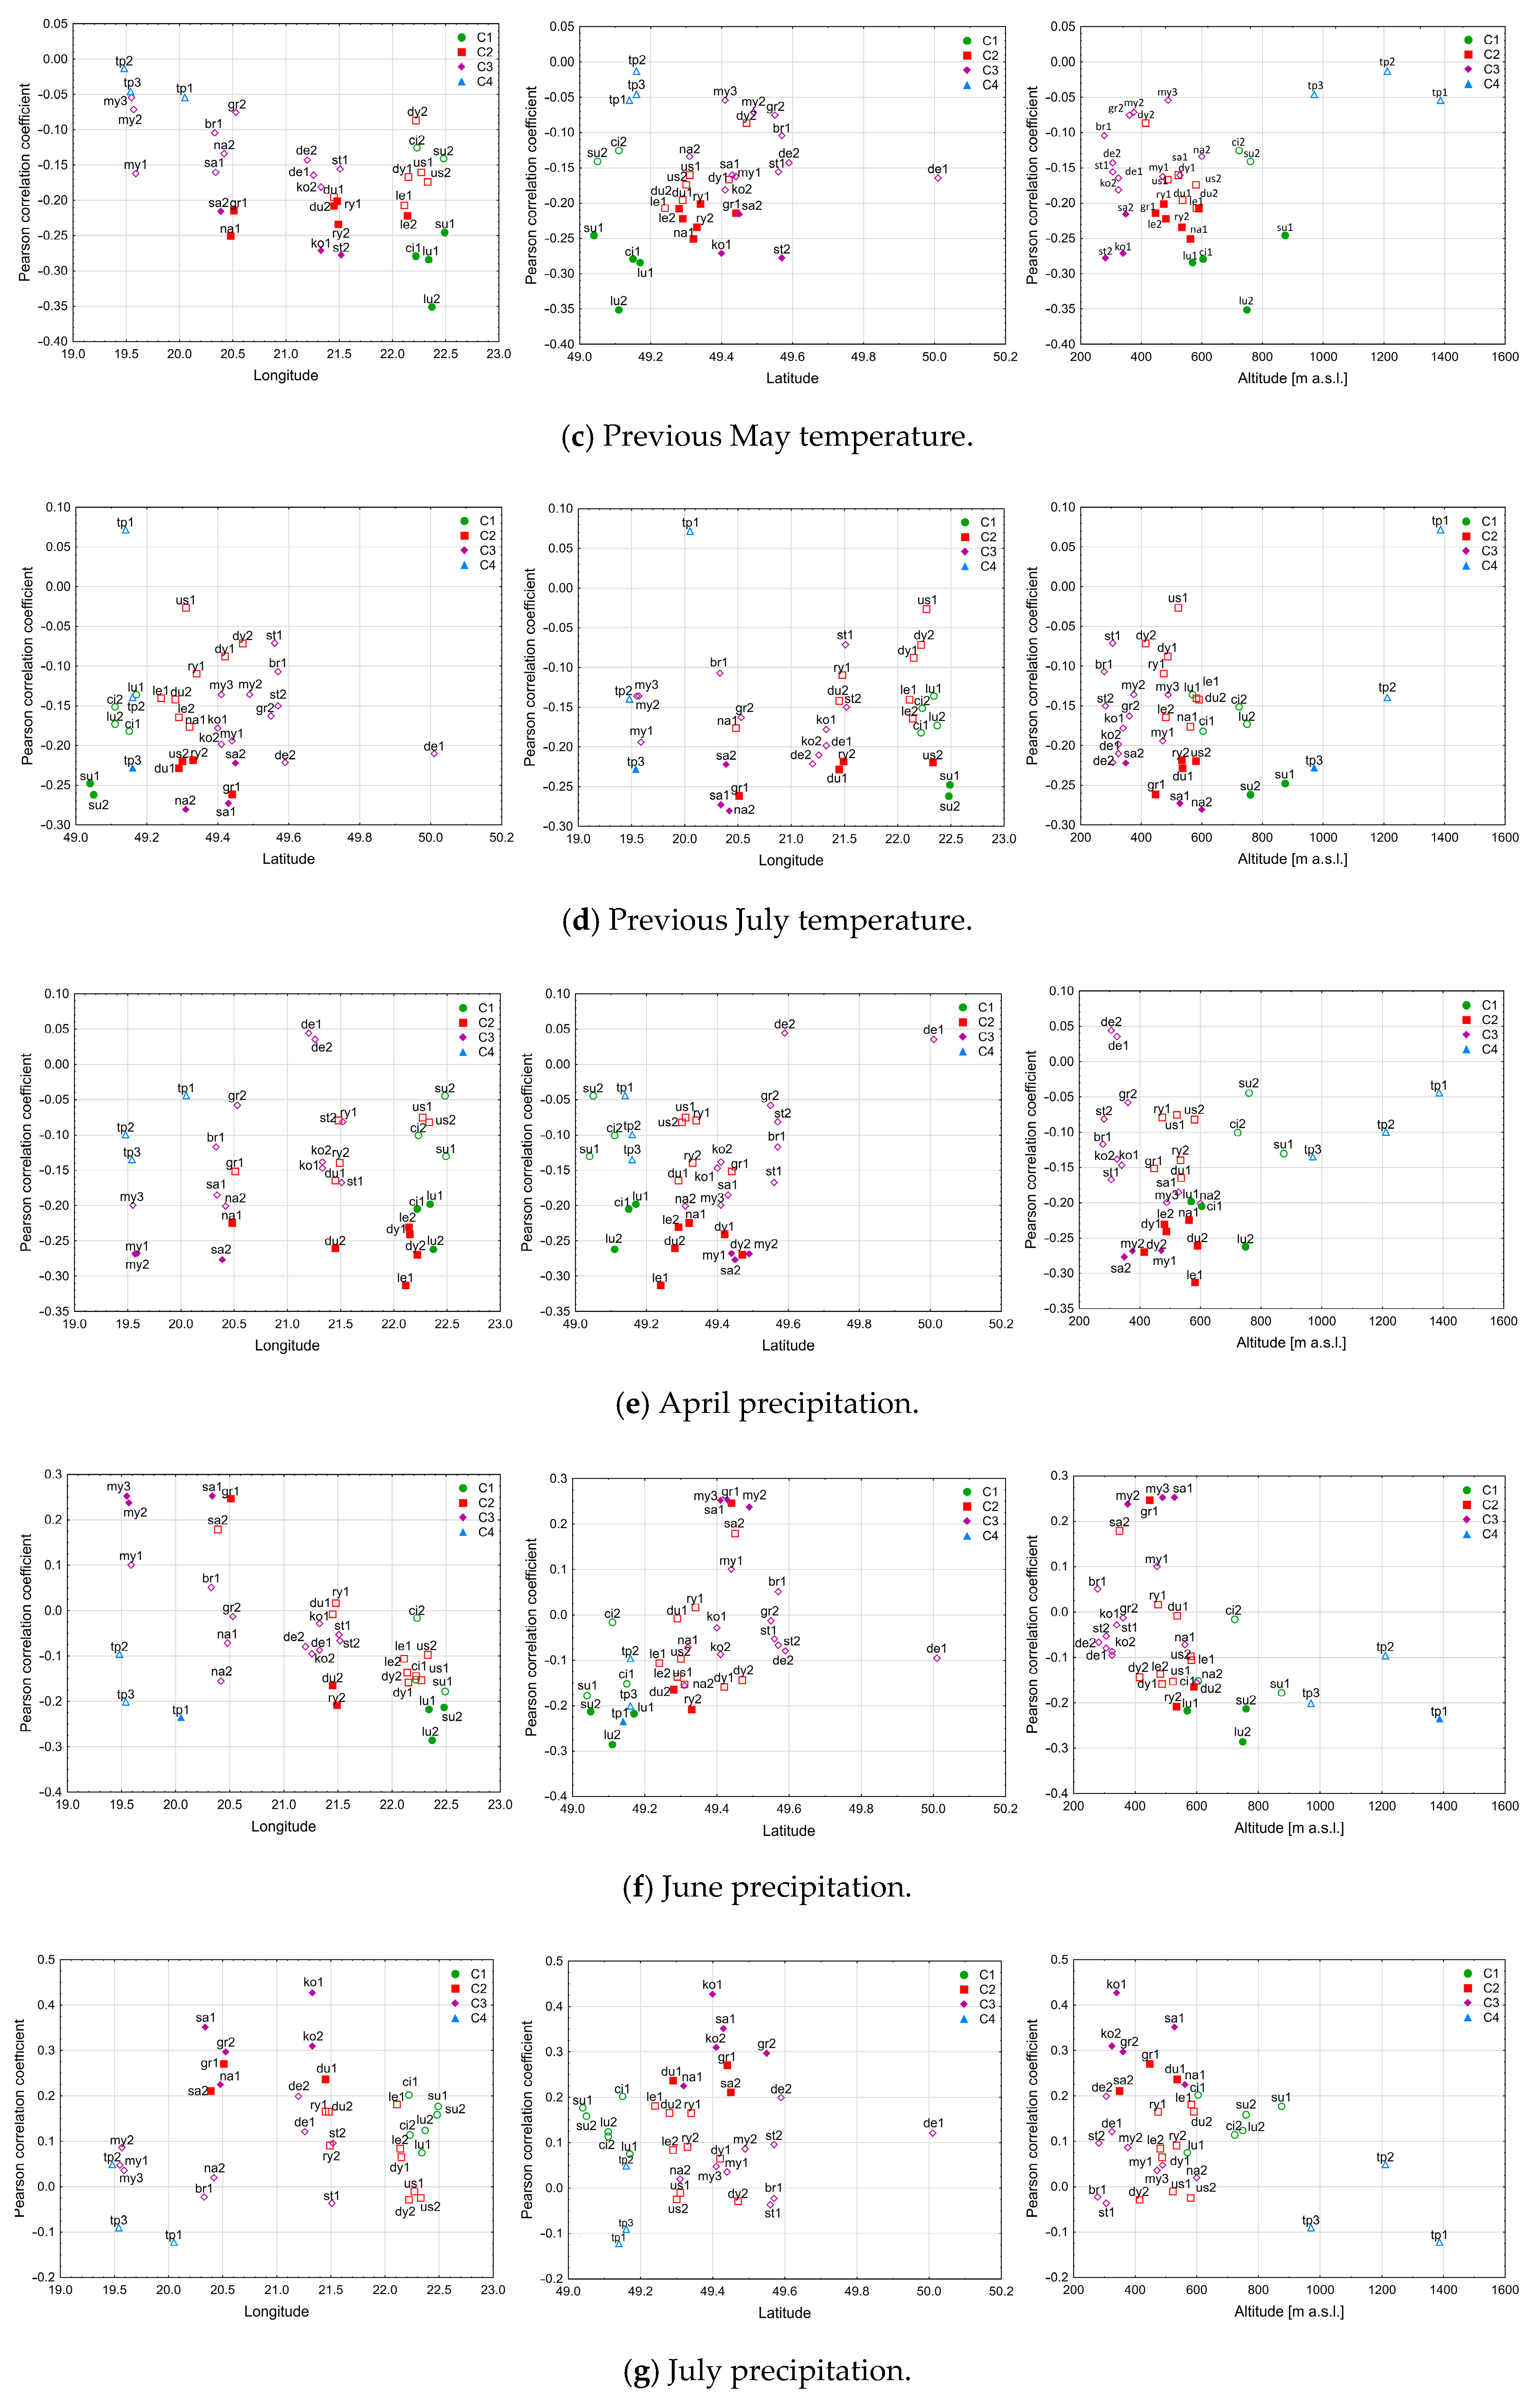
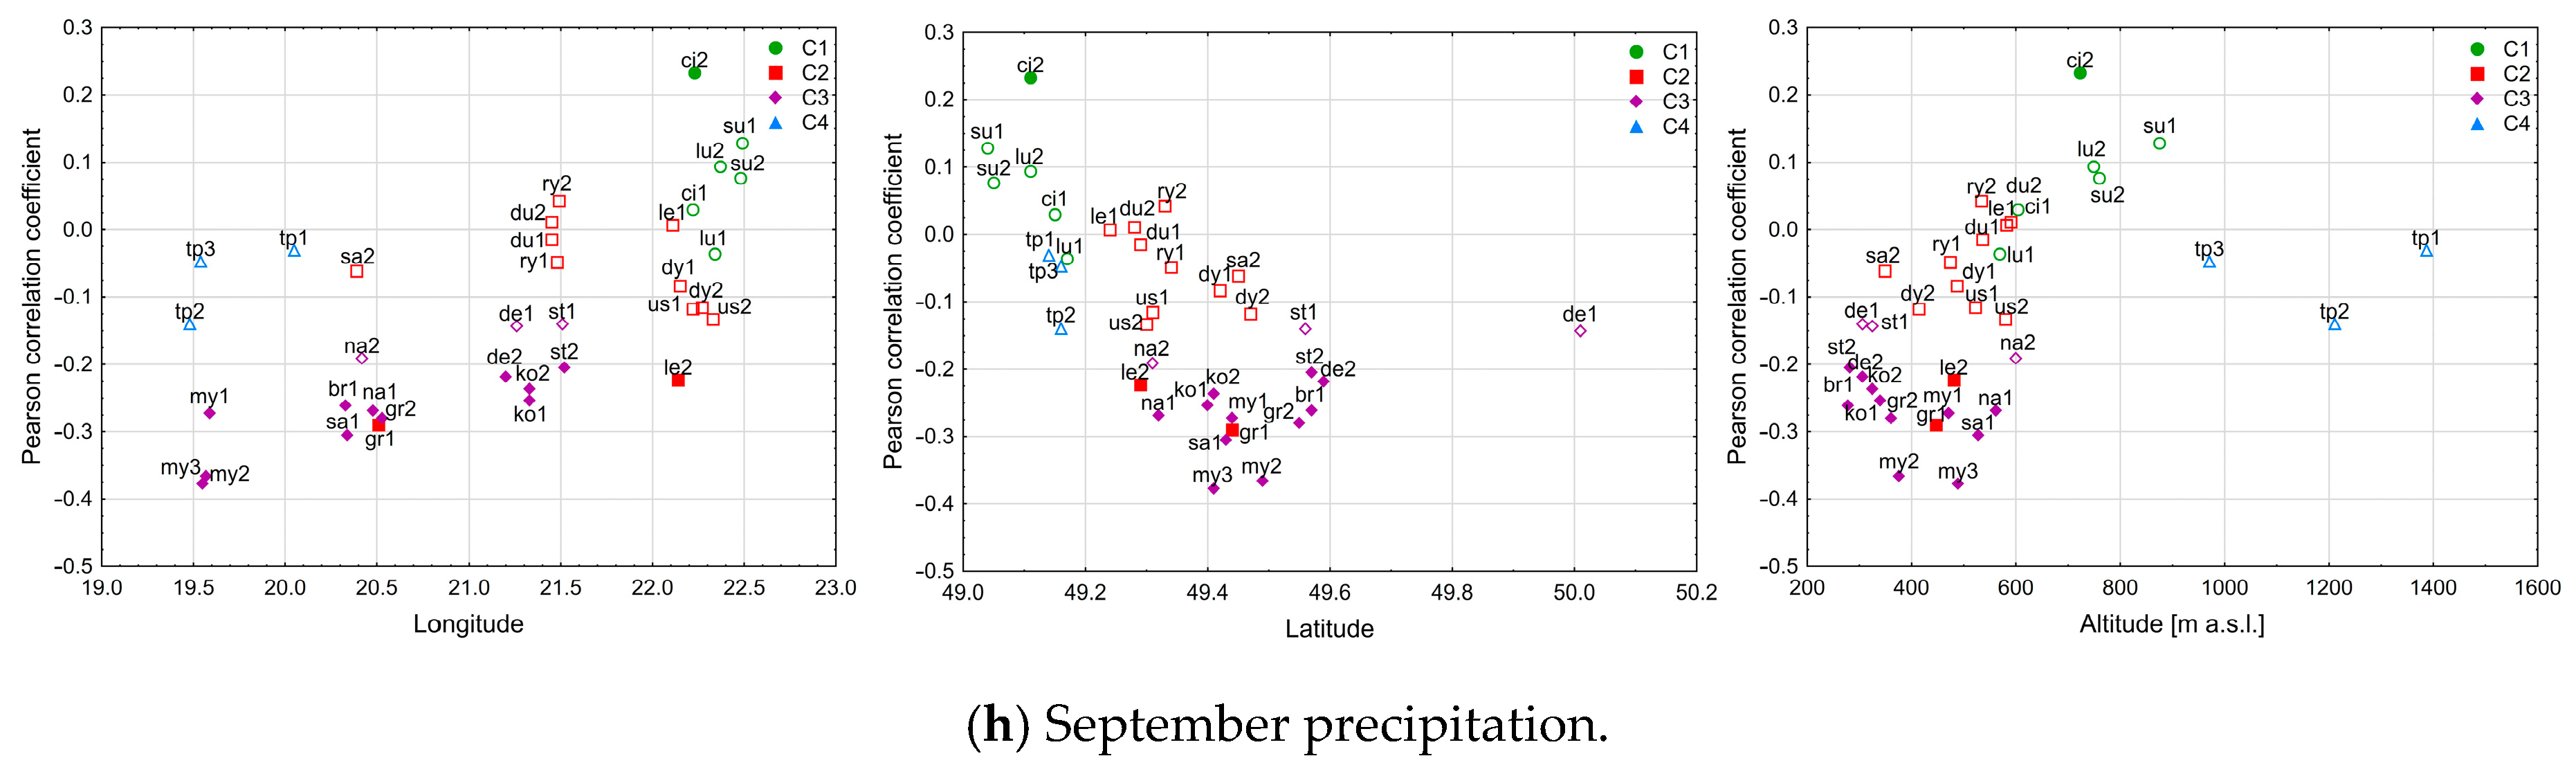
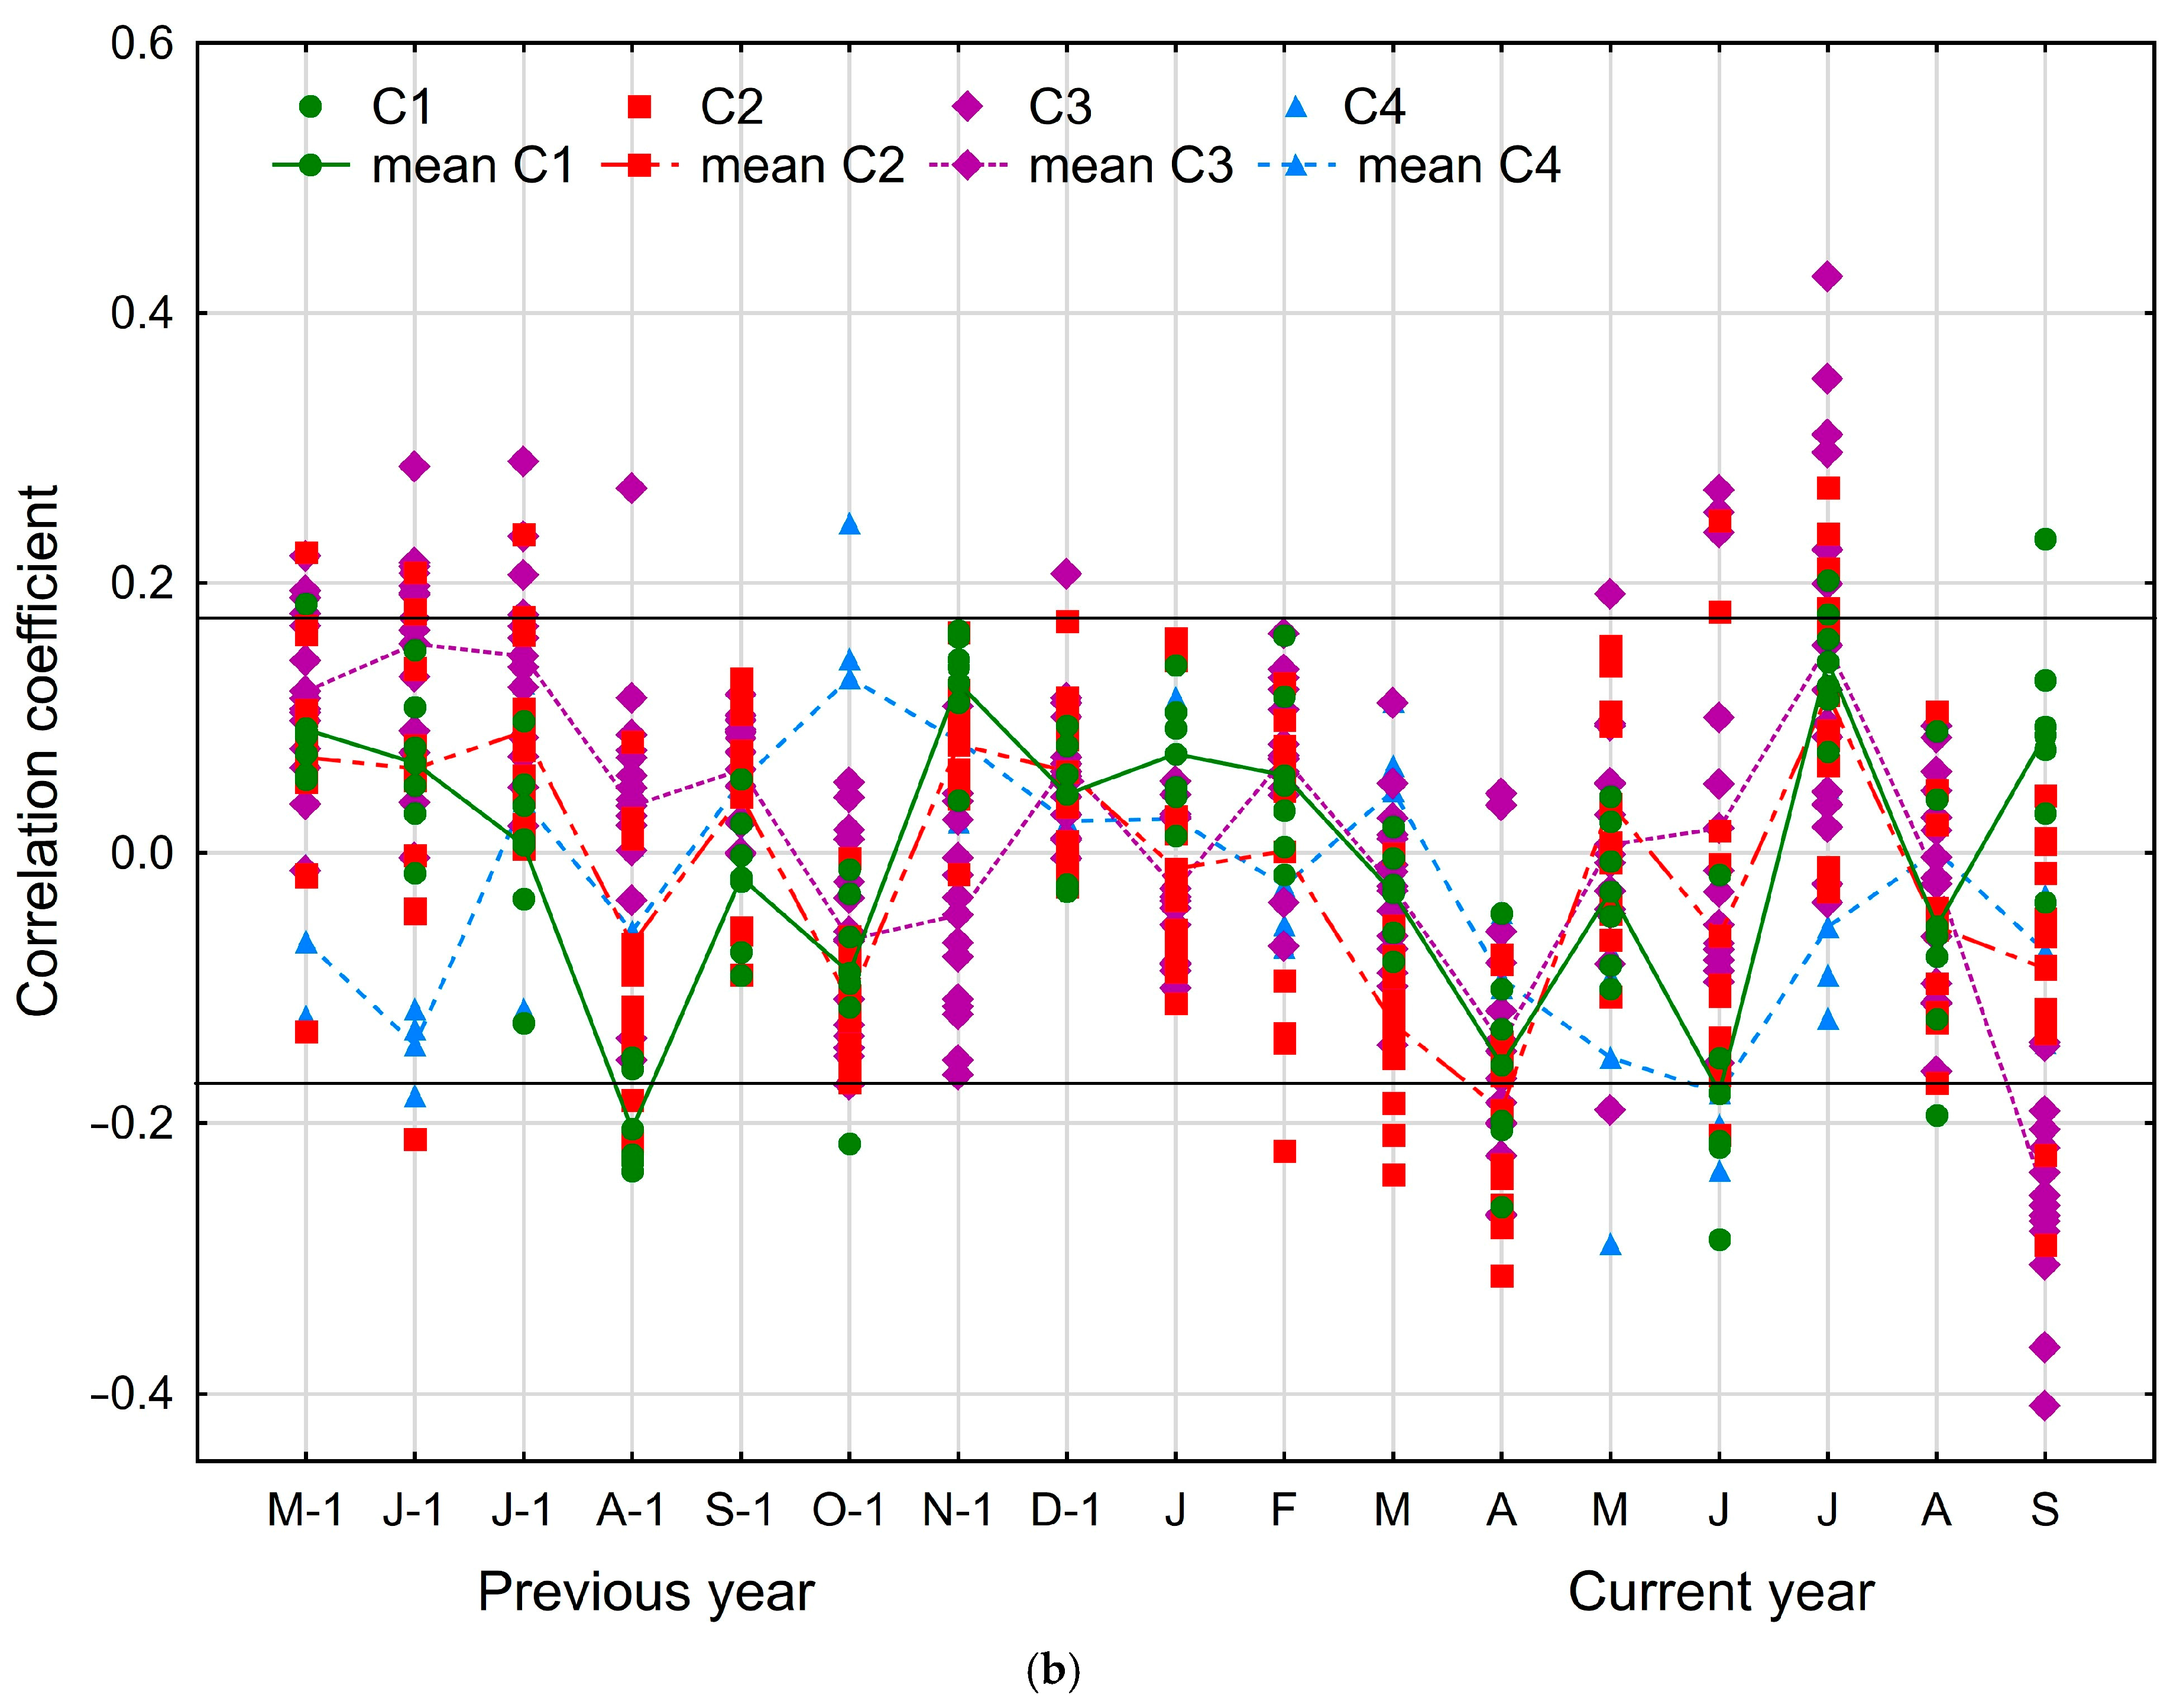
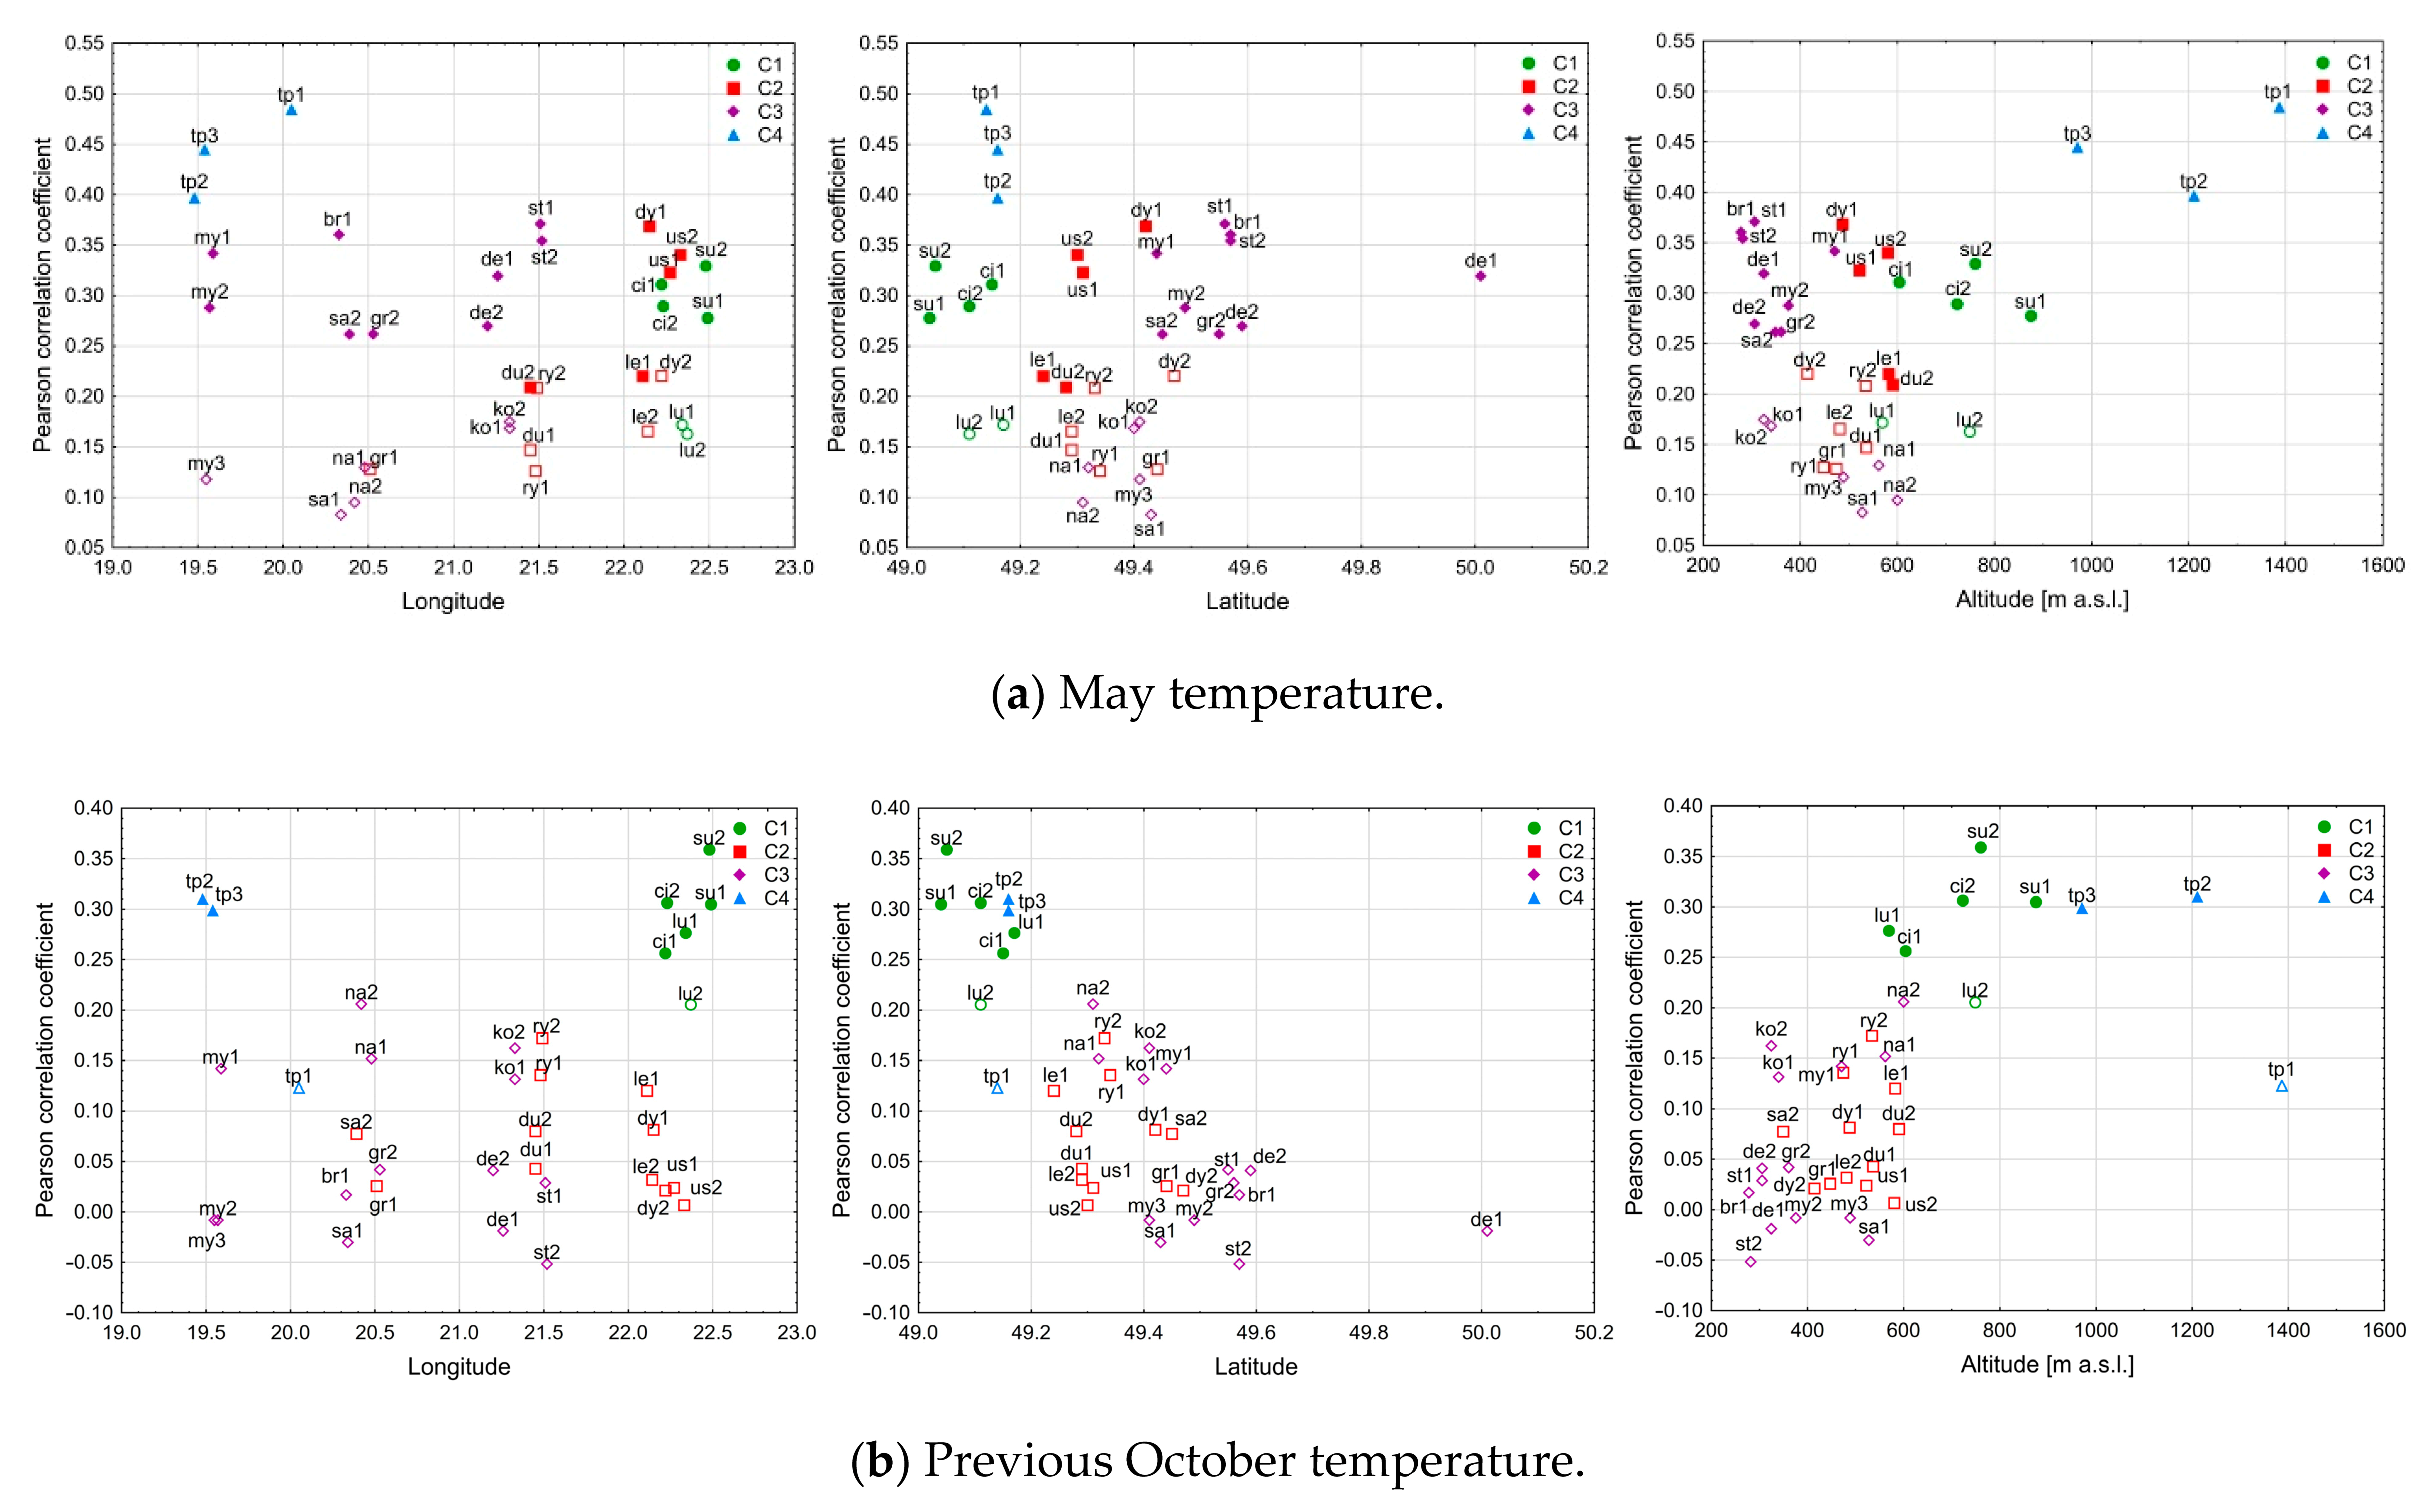
The results of the correlation between residual versions of particular site chronologies and climate variables are presented in Figure 6. The replication criterion described in Section 2.5 is met for the temperature of the previous May, July, October, the current May, and for precipitation of the current April, June, July, and September. Selected results were plotted against altitude/latitude/longitude; they are presented in Figure 7.
Results for temperatures show a positive correlation of tree-ring growth with the current May and the previous October. The positive correlation with May temperature all over the area is the most noticeable: significant correlation coefficients for the majority of sites (21 of 35) were obtained for this month (Figure 6a). The highest values were recorded for the high-altitude sites in the Tatra Mountains (Figure 7a). For the highest two of these sites, a positive, significant correlation also occurred for the month of June. A significant positive correlation with the previous October temperature was observed for the first (Western Bieszczady) and fourth (Tatra Mountains) clusters (Figure 6a). These clusters include the highest analyzed sites; this could suggest that the observed correlation is related to altitude (Figure 7b). However, the results show that the association with geographical position (mainly latitude) cannot be discounted (Figure 7b). For the highest analysed site (tp1), this correlation was much weaker and insignificant (Figure 7b).
A negative correlation between tree-ring growth and temperature was observed for the previous May and July (Figure 6a). For the previous May, significant values were obtained for clusters C1–C3 (13 sites, Figure 7c), which represents more than one third of the analysed sites. For the previous July, 10 statistically significant values were obtained. No clear pattern showing a relation between the obtained correlations and the spatial distribution or assigned cluster of the analyzed sites was found (Figure 7d).
The results obtained for precipitation are more complex across the studied area. A negative correlation between tree-ring growth and April precipitation was found, with significant values for 12 sites (Figure 6e). No clear pattern was found in the spatial distribution of these sites; however, no correlation was found for cluster 4 (Figure 6b and Figure 7e). The results observed for June depend on site location. Positive correlations were recorded for sites in the western part of the study area (with the exception of sites in the Tatra Mountains), whereas negative correlations characterize sites located farther to the east (Figure 7f). However, the number of sites with significant correlation values is low (four positive and six negative values). A generally positive correlation between larch growth and July precipitation can be seen; however, significant correlation values were obtained for only eight sites in clusters 2 and 3 (Figure 6b and Figure 7g). No clear relation to geographical position was found for July, but the precipitation in this month seems to be unimportant for sites in the Tatra Mountains (Figure 6b and Figure 7g). The negative correlation with September precipitation mainly concerns sites in the third cluster (significant correlation values were observed for 11 of 13 sites (Figure 6b and Figure 7h).
A possible relation between the observed correlations and slope aspect was also explored, but no clear pattern was found in this case. This suggests that slope aspect is not one of the main factors related to tree-ring growth in the study area; however, it could be a result of the relatively small amount of data used for comparison of different slopes. Most of the locations had a northern aspect, which is typical for this area (compare Section 2). More detailed studies on this subject are needed to confirm this.
4. Discussion
The presented study showed variations in the climatic signal observed in the tree rings of larches growing in the Polish Carpathians. The distinguished clusters reflect the general climate characteristics of the region (macroscale influence), which is strongly affected by the morphological diversity of this mountainous area (mesoscale influence, Figure 1). The Tatra Mountains region is clearly different from the others. The chronologies of larch in this region revealed big differences in their response to climatic factors compared to other areas (see Section 3.2 and Section 3.3); this is a result of the very different features of this high mountain region, especially the climate. For the rest of the area, which consists of mountains of medium elevation and the foothills zone, variability in the climatic signal from west to east can be observed, as shown by the results of PCA analysis (Figure 3 and Figure 4). Almost all these sites are in an area where the continental influence prevails (with the exceptions of sites my1, my2, and my3, which according to the climatic division shown in Figure 1 are on the border of the prevailing Atlantic influence). The given results suggest that the signal variability could be affected by the increasing importance of the influence of the continental climate to the east, but this transition is not clearly visible in the tree-ring growth response. This can be explained by the fact that the observed response variability is additionally affected by the increasing mountain climate influence to the south (mesoscale influence, compare Section 2, Figure 1). The combination of these two influences, which are affected to some degree by other site-related factors (microscale influences), results in the observed diversity of the climatic signal of larch in the area of medium elevation mountains and the foothills zone and is responsible for the observed clustering (C1–C3).
May temperature is the main climatic factor that limits larch growth in the Polish Carpathian Mountains. The positive influence of a warm May can be seen at low and high locations in both the foothills and mountains (Figure 6a and Figure 7a). Higher temperatures positively influence the onset of cambial activity in trees ([62,63,64]), which is high at the beginning of the growing season. The obtained correlation coefficients for lower sites (cluster C1–C3) are relatively low (<0.4); this is typical for medium elevation locations, where climate response is very complex [65]. The highest dependence on May temperature can be seen in sites in the Tatra Mountains, all of which are located much higher than the other analyzed sites (above 950 m a.s.l., Table 1). This was expected, because the temperature of the vegetation season is the main factor that restricts tree-ring growth at high altitudes ([6,21,65]).
The positive influence of temperature for the two highest study sites (tp1, tp2) continues until June. A similar relation to temperature was observed for four other previously analyzed locations from the Tatra Mountains ([29,30]). A positive influence of a warm late spring and early summer temperatures (May–July or June–July) on larch growth was also recorded across the Alps ([17,21]). At an elevation of 1350 m a.s.l., ring formation starts in mid-May, or later as altitude increases [62]. It could be conjectured that it starts earlier at lower elevations. For most of the study sites the positive response to temperature is usually restricted to May; a similar response has been observed for larch growing in the lowlands of central and northeast Poland [66] and Lithuania [67]. For some locations the positive influence of a warm April was also observed, similarly as observed for larch from Lithuania [67]. However, statistically significant correlation values were obtained for only four of the analyzed sites (st1, br1, lu1, and tp3, Figure 6a). Sometimes the positive response was related to both April and May temperatures (among the sites with significant values, it concerns st1, br1, and tp3). The difference between low and high elevation sites suggests its relation to elevation, as lower sites show response to April–May or only May temperature and the highest sites to May–June temperature, however, no clear relation to altitude was found (Figure 6a and Figure 7a). On the other hand, the earlier start of the growing season in some locations could also be a result of the non-uniform start and strength of the response of trees within sites (compare [68]).
It seems that a warm May positively influences tree-ring formation; however, it can negatively influence other processes that can indirectly reduce ring growth in the next growing season, in particular, the bud formation. This is manifested by the negative correlation with the previous May temperature that is observed in many sites (Figure 6a and Figure 7c). It is possible that high temperature negatively influences the initiation of the bud formation process, which starts in the spring of the year before ring formation (compare [69]). This can indirectly affect tree-ring growth by influencing the quality of the assimilation apparatus that will develop in the next year. The possible impact of the previous year’s climate on bud formation and tree-ring growth is discussed by Feliksik [28]. However, the aforementioned study concerns the positive effect of precipitation on bud formation in the previous spring (March–May period precipitation totals were analyzed). One of the features of the climate of the studied area is that cooler years are usually related to increased precipitation and high temperature can reflect droughts to some degree [70]; this could represent a link between the results of this study and the study of Feliksik [28]. A negative influence of temperature was also found for the previous July (Figure 6a), which is in agreement with other studies from Poland and Lithuania [66,67,71], where an adverse effect of the previous summer’s temperature was recorded. This effect could be related to water stress, temperature impact on respiration, bud initiation, and other processes that can reduce carbohydrate reserves [71].
Growth of larch in the highest studied locations is also related to the temperature at the end of the previous vegetation season: sites in the Tatra Mountains and Western Bieszczady reacted positively to the previous October’s temperatures. A positive correlation between conifer tree-ring growth and previous autumn temperatures is known from other studies of higher mountain locations in the Tatra Mountains [30,49] and Alps (e.g., [21]) and has been observed for high-latitude locations (e.g., [72]). For European larch, besides the Alps and Tatra Mountains (studies mentioned above), this relation has also been observed for higher sites in the Karkonosze Mountains [27] and larch stands outside of their natural range (central and northern Poland, [66]). Higher temperatures on short days enable proper bud formation and lignification of the leading shoot [73]; they also support carbon storage and, by preventing soils from freezing, prolong mycorrhizal root growth [74]. As a result, higher temperatures positively influence wood formation the following spring [30]. A warm end of the previous growing season seems important, especially for higher study sites with a harsher climate and, consequently, a shorter growing season (this concerns sites above 600 m a.s.l., Figure 7b). One possible reason could be related to the previously mentioned maturation process and the fact that conifer cuticles require either a long growing season or a warm summer to thicken (compare [74]). The positive influence of October temperature disappears for the highest study site (tp1). In the light of the previously mentioned studies from the Tatra Mountains and Alps, such a reaction is unusual and further research is necessary to explain it.
The study of Feliksik [28] of a few locations in the Polish Carpathians, in which no relation to temperature was found, indicated water-related larch growth. A positive correlation was found for current year/vegetation period precipitation totals. Similarly, in a study from an experimental plot in mid-east Poland [71], tree-ring growth of larch was mainly related to summer precipitation and was explained by the high water needs of larch (e.g., [75,76]. A positive influence of summer precipitation (mainly June–July, but sometimes also May) was recorded for sites in other regions of Poland located north of the study area [60,66,77] and Lithuania [67]. In the presented study, a mainly positive response to July precipitation is indicated; however, significant correlations were recorded only for some of the analyzed sites (Figure 6b). No clear relation to geographical position or altitude could be found (Figure 7g). It seems reasonable that no positive influence was observed for all sites in the Tatra Mountains, as summer precipitation is not usually a growth-limiting factor at high elevations of Central Europe due to its abundance [78]. The diversity of the results within the other clusters (much lower locations) could be caused by the influence of other site-related factors. As has been mentioned, non-uniform response of trees within a site should also be taken into consideration here (compare [68]). Relatively low values of correlation with precipitation could also be caused by the dynamic spatial variability of this climatic factor. Precipitation itself can affect results because it has a very local character and can significantly vary from one area to the next, especially in mountain areas (e.g., from valley to valley). This variability could be suppressed even more when gridded data are used. Results from our study and others indicate that water availability in early summer can positively influence radial growth of larch at lower elevations under certain local site conditions. However, a wet start of the vegetation season can negatively influence larch tree-ring growth at lower elevations; this is supported by the negative correlation with April precipitation observed for sites in the analyzed clusters C1–C3 (Figure 6b and Figure 7e). The fact that no relation was observed for the Tatra Mountains cluster could be explained by the aforementioned temperature-related larch growth at high altitudes.
In the context of the studies from other regions [66,67,71,77], interesting results were observed for June. The aforementioned positive precipitation effect—although weak—was recorded only in the western part of the study area. An adverse effect was observed for sites located in the eastern part and in the Tatra Mountains (Figure 7f). A transition to a negative response appears when moving to the east; however, it is also affected by the growing influence of the mountain climate to the south. A negative response was recorded for higher locations (mainly Western Bieszczady and the Tatra Mountains, Figure 7f), but the number of sites with significant correlation values is low. This negative response is typical of high elevation larch stands, as was observed in the Alps [16]. This could suggest that the reaction of the trees in higher sites of the study area is more similar to high elevation trees. However, this needs to be confirmed by increasing the number of sites at elevations above 600 m a.s.l. As it was mentioned before, larch mainly grows in the lower parts of the Polish Carpathians and finding older larches above this elevation is, unfortunately, difficult. Moreover, the described reaction of the Western Bieszczady sites could be a result of the combined effect of geographical and altitudinal position.
This change in response to climatic factors from west to east can be also observed for September precipitation (Figure 7h). This is surprising because it is widely accepted that the tree-ring growth of larch ends with minimal growth rate in September [69,71]. A negative influence of September precipitation was also observed by Wilczyński et al. [77] for a site beyond the Carpathians in southern Poland. This suggests that some factors can prolong the tree-ring growth season. In our study, the negative influence of the moist end of the growing season concerns sites of the second cluster (Figure 6b), with the highest correlations observed for the two sites (my2 and 3, Figure 7h) that are under the strongest ocean influence (Figure 1). Because the amount of precipitation is usually higher in the western part of the area [37], the obtained geographical pattern suggests that too much moisture in September has a negative impact on larch growth. This relation disappears to the east (this is more clear when Tatra Mountain sites are excluded, Figure 7h). Only for one of the eastern sites (ci2) is the correlation significant but positive. This could be explained by the southern aspect of this site, which makes it more sensitive to drought.
5. Conclusions
Larch growth response to climatic factors in the Polish Carpathians is highly variable. Uniformity of the reactions across the analyzed area was found in the positive growth response to May temperatures, thus indicating that a warm beginning of the growing season is critical for larch growth across the study area.
The recorded larch growth variability reflects the varied climate of this region, which is mainly constrained by two kinds of influence that overlap and mix. The transition from a more oceanic to a more continental influenced climate (macroscale influence) seems responsible for the larch signal variability from west to east in the results of PCA analysis; however, this transition is not clearly visible in the results of the climate–growth relationship analysis. This could be explained by the fact that the observed response variability is additionally affected by the second influence, which is related to the increasing strength of the mountainous climate, itself related to morphological changes and higher altitudes (mesoscale influence).
Although the climate–growth response of larch at lower elevations is highly variable, a positive influence of precipitation in early summer (July) is observed. This is similar to the response of larch in lowlands, where growth is water related. However, a wet start of the vegetation season (April), as well as previous May and July temperatures, can negatively influence larch tree-ring growth at lower elevations.
The growth of larch in the highest study sites in the inner part of the Carpathians with high mountain environment type (Tatra Mountains, above 950 m a.s.l.) is similar to the temperature-related growth of coniferous trees at high elevations in the Alps. This is manifested by a strong positive correlation with temperature during late spring, early summer, and the end of the previous growing season, and a negative or no response to late spring/summer precipitation. The altitudinal relevance of the climate–growth response and the possible change in response pattern at about 600 m a.s.l. is suggested by similarities found between the Tatra Mountains and the Western Bieszczady (sites above 600 m a.s.l.). However, the signal observed in trees from the latter region could also be influenced by the aforementioned west-east transition that is not visible in the Tatra Mountains, where tree-ring growth response is dominated by altitude. More studies on larch at these elevations in other parts of the Carpathians (e.g., western part) are needed to confirm this suggestion.
The presented results provide new information on the climate–growth response of larch in the Carpathians and prove its spatial variability. These studies increase the knowledge about the response of European larch to climatic factors, especially in medium-elevation mountains. However, more studies in other parts of the Carpathians are needed to understand regional variations in larch growth better. These studies can be used for more detailed analysis of the larch growth process as a function of climatic factors.
Acknowledgments
The study was supported by the National Science Centre, Poland (project No. 2014/13/B/ST10/02529). The authors would like to thank numerous persons from regional forest management teams in Krosno and Kraków, local forestry districts, and Tatra National Park, without whom this research would have been impossible. The authors would like to thank the two anonymous reviewers for their helpful and constructive comments that greatly improved the paper.
Author Contributions
Małgorzata Danek conceived the ideas, collected and processed the data, contributed to data analysis, and wrote the paper. Monika Chuchro contributed to data collection and performed the data analysis. Adam Walanus provided statistical expertise.
Conflicts of Interest
The authors declare no conflict of interest.
References
- Lindner, M.; Maroschek, M.; Netherer, S.; Kremer, A.; Barbati, A.; Garcia-Gonzalo, J.; Seidl, R.; Delzon, S.; Corona, P.; Kolström, M.; et al. Climate change impacts, adaptive capacity, and vulnerability of European forest ecosystems. For. Ecol. Manag. 2010, 259, 698–709. [Google Scholar] [CrossRef]
- Thuiller, W.; Lavorel, S.; Araújo, M.B.; Sykes, M.T.; Prentice, I.C. Climate change threats to plant diversity in Europe. Proc. Natl. Acad. Sci. USA 2005, 102, 8245–8250. [Google Scholar] [CrossRef] [PubMed]
- Kienast, F.; Wildi, O.; Brzeziecki, B. Potential impacts of climate change on species richness in mountain forests—An ecological risk assessment. Biol. Conserv. 1998, 83, 291–305. [Google Scholar] [CrossRef]
- Beniston, M. Climatic change in mountain regions: A review of possible impacts. Clim. Chang. 2003, 59, 5–31. [Google Scholar] [CrossRef]
- Sidor, C.G.; Popa, I.; Vlad, R.; Cherubini, P. Different tree-ring responses of Norway spruce to air temperature across an altitudinal gradient in the Eastern Carpathians (Romania). Trees 2015, 29, 985–997. [Google Scholar] [CrossRef]
- Tessier, L.; Guibal, F.; Schweingruber, F.H. Research strategies in dendroecology and dendroclimatology in mountain environments. Clim. Chang. 1997, 36, 499–517. [Google Scholar] [CrossRef]
- Peterson, D.W.; Peterson, D.L.; Ettl, G.J. Growth responses of subalpine fir to climatic variability in the Pacific Northwest. Can. J. For. Res. 2002, 32, 1503–1517. [Google Scholar] [CrossRef]
- Krzysik, F. Nauka o Drewnie; Wyd. Naukowe PWN: Warszawa, Poland, 1978. [Google Scholar]
- Einspahr, D.W.; Wyckoff, G.W.; Fiscus, M.H. Larch—A Fast-Growing Fiber Source for the Lake States and Northeast. J. For. 1984, 82, 104–106. [Google Scholar]
- Karolewski, P.; Białobok, S. Wpływ dwutlenku siarki, ozonu, mieszaniny tych gazów i fluorowodoru na uszkodzenie igieł modrzewia europejskiego. Arbor. Kórnickie 1979, 24, 297–305. [Google Scholar]
- Feliksik, E. Studies on sensitivity of the more important forest trees to industrial pollution. Zesz. Naukowe AR Kraków Leśni. 1991, 254, 353–391. [Google Scholar]
- Boratyński, A. Systematyka i geograficzne. In Modrzewie Larix Mill; Białobok, S., Ed.; PWN: Warszawa; Poznań, Poland, 1986; pp. 63–108. [Google Scholar]
- Serre, F. The dendroclimatological value of the European larch (Larix decidua Mill.) in the French Maritime Alps. Tree-Ring Bull. 1978, 38, 25–34. [Google Scholar]
- Levanič, T. Vpliv klime na debelinsko rast macesna (Larix decidua Mill.) na zgornij gozdni meji v jv Alpahe. Zb. Gozd. Lesar. 2006, 78, 29–55. [Google Scholar]
- Rolland, C.; Petitcolas, V.; Michalet, R. Changes in radial tree growth for Picea abies, Larix decidua, Pinus cembra and Pinus uncinata near the alpine timberline since 1750. Trees 1998, 13, 40–53. [Google Scholar] [CrossRef]
- Carrer, M.; Urbinati, C. Long-term change in the sensitivity of tree-ring growth to climate forcing in Larix decidua. New Phytol. 2006, 170, 861–872. [Google Scholar] [CrossRef] [PubMed]
- Büntgen, U.; Frank, D.; Wilson, R.; Carrer, M.; Urbinati, C.; Esper, J. Testing for tree-ring divergence in the European Alps. Glob. Chang. Biol. 2008, 14, 2443–2453. [Google Scholar] [CrossRef]
- Büntgen, U.; Frank, D.; Neuenschwander, T.; Esper, J. Fading temperature sensitivity of Alpine tree growth at its Mediterranean margin and associated effects on large-scale climate reconstructions. Clim. Chang. 2012, 114, 651–666. [Google Scholar] [CrossRef]
- Carrer, M.; Urbinati, C. Age-dependent tree-ring growth responses to climate in Larix decidua and Pinus cembra. Ecology 2004, 85, 730–740. [Google Scholar] [CrossRef]
- Rolland, C. Decreasing teleconnections with inter-site distance in monthly climatic data and tree-ring width networks in a mountiainous Alpine area. Theor. Appl. Clim. 2002, 71, 63–75. [Google Scholar] [CrossRef]
- Frank, D.; Esper, J. Characterization and climate response patterns of a high-elevation, multi-species tree-ring network in the European Alps. Dendrochronologia 2005, 22, 107–121. [Google Scholar] [CrossRef]
- Serre-Bachet, F. Middle ages temperature reconstructions in Europe, a focus on northeastern Italy. Clim. Chang. 1994, 26, 213–224. [Google Scholar] [CrossRef]
- Büntgen, U.; Esper, J.; David, C.; Frank, D.C.; Nicolussi, K.; Schmidhalter, M. A 1052-year tree-ring proxy for Alpine summer temperatures. Clim. Dyn. 2005, 25, 141–153. [Google Scholar] [CrossRef]
- Daux, V.; Edouard, J.L.; Masson-Delmotte, V.; Stievenard, M.; Hoffmann, G.; Pierre, M.; Mestre, O.; Danis, P.A.; Guibal, F. Can climate variations be inferred from tree-ring parameters and stable isotopes from Larix decidua? Juvenile effects, budmoth outbreaks, and divergence issue. Earth Planet. Sci. Lett. 2011, 309, 221–233. [Google Scholar] [CrossRef]
- Büntgen, U.; Tegel, W.; Nicolussi, K.; McCormick, M.; Frank, D.; Trouet, V.; Kaplan, J.O.; Herzig, F.; Heussner, K.U.; Wanner, H.; et al. 2500 Years of European Climate Variability and Human Susceptibility. Science 2011, 331, 578–582. [Google Scholar] [CrossRef]
- Coppola, A.; Leonelli, G.; Salvatore, M.C.; Pelfini, M.; Baroni, C. Tree-ring-based summer mean temperature variations in the Adamello-Presanella Group (Italian Central Alps), 1610–2008 AD. Clim. Past 2013, 9, 211–221. [Google Scholar] [CrossRef]
- Danek, M.; Chuchro, M. Climate signal in tree rings of larch (Larix decidua Mill.) from the Karkonosze Mountains. In Proceedings of the 9th Conference Geoecological Problems of the Karkonose/Karkonosze Mountains: Past, present and future of transboundary cooperation in research and management, Szklarska Poręba, Poland, 12–14 October 2016. [Google Scholar]
- Feliksik, E. Wpływ warunków klimatycznych na wielkość przyrostów radialnych modrzewia europejskiego (Larix decidua Mill.) występującego w Karpatach. Sylwan 1992, 136, 61–67. [Google Scholar]
- Ermich, K. Zależność przyrostu drzew w tatrach od wahań klimatycznych. Acta Soc. Bot. Pol. 1955, 24, 245–273. [Google Scholar]
- Büntgen, U.; Frank, D.C.; Kaczka, R.J.; Verstege, A.; Zwijacz-Kozica, T.; Esper, J. Growth responses to climate in a multi-species tree-ring network in the Western Carpathian Tatra Mountains, Poland and Slovakia. Tree Physiol. 2007, 27, 689–702. [Google Scholar] [CrossRef] [PubMed]
- Feliksik, E.; Wilczyński, S. Wpływ temperatury i opadów na przyrost roczny drewna świerka, sosny i modrzewia występujących w Leśnictwie Pierściec u podnóża Pogórza Wilamowickiego. Probl. Zagospod. Ziem Górskich 1998, 44, 77–85. [Google Scholar]
- Feliksik, E.; Wilczyński, S. Wpływ warunków termicznych i pluwialnych na przyrost roczny modrzewi (Larix decidua Mill.). Sylwan 1998, 152, 85–90. [Google Scholar]
- Danek, M. Wpływ warunków klimatycznych na szerokość przyrostów rocznych modrzewia (Larix decidua Mill.) rosnącego w północnej części województwa małopolskiego. Sylwan 2009, 153, 768–776. [Google Scholar]
- Danek, M.; Danek, T. Example of using alternative methods of data processing in dendroclimatological analysis of larch (Larix decidua Mill.) from southern Poland. Sylwan 2011, 155, 147–158. [Google Scholar]
- Danek, M.; Chuchro, M. Sygnał dendroklimatyczny w sekwencjach przyrostów rocznych modrzewia rosnącego we wschodniej części polskich Karpat. Stud. Mater. CEPL Rogowie 2016, 47, 35–42. [Google Scholar]
- Kondracki, J. Geografia Regionalna Polski; Wyd. Naukowe PWN: Warszawa, Poland, 2009. [Google Scholar]
- Okołowicz, W.; Martyn, D. Regiony klimatyczne. In Atlas Geograficzny Polski; Górski, H., Melnicka, P., Eds.; PPWK: Warszawa, Poland, 1984; p. 11. [Google Scholar]
- Matuszkiewicz, J.M. Geobotanical Regionalization of Poland (Regionalizacja Geobotaniczna Polski); IGiPZ PAN: Warszawa, Polska, 2008; Available online: http://www.igipz.pan.pl/Regiony-geobotaniczne-zgik.html (accessed on 2 March 2017).
- Kondracki, J. Karpaty; Wyd. Szkolne i Pedagogiczne: Warszawa, Poland, 1978; p. 273. [Google Scholar]
- Warszyńska, J. Karpaty Polskie. Przyroda, Człowiek, Działalność; Wyd. UJ: Kraków, Polska, 1996; p. 367. [Google Scholar]
- Izmiłow, B.; Kaszowski, L.; Krzemień, K.; Święchowicz, J. Rzeźba. In Karpaty Polskie: Przyroda, Człowiek, Działalność; Warszyńska, J., Ed.; Wyd. UJ: Kraków, Poland, 1996; p. 367. [Google Scholar]
- Matuszkiewicz, W. Fitosocjologiczne Podstawy Typologii Lasów Polski. Prace Inst. Badaw. Leśn. 1978, 558, 3–39. [Google Scholar]
- Walanus, A. Program Quercus; Instrukcja Obsługi; AGH-UST: Kraków, Poland, 2005. [Google Scholar]
- Holmes, R.L. User Manual for Program COFECHA; Laboratory of Tree-Ring Research, University of Arizona: Tucson, AZ, USA, 1999. [Google Scholar]
- Cook, E.R.; Holmes, R.L. User Manual for Program ARSTAN; Laboratory of Tree-Ring Research, University of Arizona: Tucson, AZ, USA, 1999. [Google Scholar]
- Cook, E.R.; Peters, K. Calculating unbiased tree-ring indices for the study of climatic and environmental change. Holocene 1997, 361–370. [Google Scholar] [CrossRef]
- Cook, E.R.; Peters, K. The smoothing spline: A new approach to standardizing forest interior tree-ring width series for dendroclimatic studies. Tree-Ring Bull. 1981, 41, 45–53. [Google Scholar]
- Cook, E.R. A Time Series Analysis Approach to Tree-Ring Standardization. Ph.D. Thesis, University of Arizona, Tucson, AZ, USA, 1985; p. 171. [Google Scholar]
- Holmes, R.L.; Adams, R.K.; Fritts, H.C. Tree-Ring Chronologies of Western North America: California, Eastern Oregon and Northern Great Basin with Procedures Used in the Chronology Development Work Including Users Manuals for the COFECHA and ARSTAN Computer Programs; Chronology Series VI; Laboratory of Tree-Ring Research, University of Arizona: Tucson, AZ, USA, 1986; p. 182. [Google Scholar]
- Fritts, H. Tree Rings and Climate; Academic Press: London, UK, 1976; p. 567. ISBN 978-0-12-268450-0. [Google Scholar]
- Savva, Y.; Oleksyn, J.; Reich, P.B.; Tjoelker, M.G.; Vaganov, E.A.; Modrzynski, J. Interannual growth response of Norway spruce to climate along an altitudinal gradient in the Tatra Mountains, Poland. Trees 2006, 20, 735–746. [Google Scholar] [CrossRef]
- Cook, E.R.; Kariukstis, L.A. Methods of Dendrochronology: Applications in the Environmental Sciences; Springer Science + Business Media: New York, NY, USA, 1990; p. 288. ISBN 978-90-481-4060-2. [Google Scholar]
- Wigley, T.M.L.; Briffa, K.R.; Jones, P.D. On the average value of correlated time series, with applications in dendroclimatology and hydrometeorology. J. Clim. Appl. Meteorol. 1984, 23, 201–213. [Google Scholar] [CrossRef]
- Mitchell, T.; Carter, T.R.; Jones, P.; Hulme, M. A comprehensive set of high-resolution grids of monthly climate for Europe and the globe: The observed record (1901–2000) and 16 scenarios (2001–2100). Tyndall Cent. Work. Pap. 2004, 55, 25. [Google Scholar]
- Carrer, M.; Nola, P.; Eduard, J.L.; Motta, R.; Urbinati, C. Regional variability of climate–growth relationships in Pinus cembra high elevation forests in the Alps. J. Ecol. 2007, 95, 1072–1083. [Google Scholar] [CrossRef]
- Chuchro, M.; Danek, M. Applicability of gridded climate data in tree-ring studies of larch from southern part of Poland. In Proceedings of the SGEM 2017: Water Resorces, Forest Ecosystem SGEM, Vienna, Austria, 27–30 November 2017; pp. 717–726. [Google Scholar]
- Jolliffe, I.T. Principal Component Analysis, 2nd ed.; Springer Series in Statistics; Springer: New York, NY, USA, 2002; ISBN 0-387-95442-2. [Google Scholar]
- Richman, M.B. Rotation of principal components. J. Climatol. 1986, 6, 293–335. [Google Scholar] [CrossRef]
- Biondi, F.; Waikul, K. DENDROCLIM 2002: A C++ program for statistical calibration of climate signals in tree-ring chronologies. Comput. Geosci. 2004, 30, 303–311. [Google Scholar] [CrossRef]
- LeBlanc, D.C.; Stahle, D.W. Radial growth responces of four oak species to climate in eastern and central North America. Can. J. For. Res. 2015, 45, 793–804. [Google Scholar] [CrossRef]
- Grissino-Mayer, H.D. Evaluating crossdating accuracy: A manual and tutorial for the computer program COFECHA. Tree Ring Res. 2001, 57, 205–221. [Google Scholar]
- Moser, L.; Fonti, P.; Büntgen, U.; Esper, J.; Luterbacher, J.; Franzen, J.; Frank, D. Timing and duration of European larch growing season along altitudinal gradients in the Swiss Alps. Tree Physiol. 2009, 30, 225–233. [Google Scholar] [CrossRef] [PubMed]
- Oribe, Y.; Kubo, T. Effect of heat on cambial reactivation during winter dormancy in evergreen and deciduous conifers. Tree Physiol. 1997, 17, 81–87. [Google Scholar] [CrossRef] [PubMed]
- Gričar, J.; Zupančič, M.; Čufar, K.; Koch, G.; Schmitt, U.; Oven, P. Effect of local heating and cooling on cambial activity and cell differentiation in the stem of Norway spruce (Picea abies). Ann. Bot. 2006, 97, 943–951. [Google Scholar] [CrossRef]
- Leal, S.; Melvin, T.M.; Grabner, M.; Wimmer, R.; Briffa, K.R. Tree ring-growth variability in the Austrian Alps: The influence of site, altitude, tree species and climate. Boreas 2007, 36, 426–440. [Google Scholar] [CrossRef]
- Koprowski, M. Long-term increase of March temperature has no negative impact on tree rings of European larch (Larix decidua) in lowland Poland. Trees 2012, 26, 1895–1903. [Google Scholar] [CrossRef]
- Vitas, A. A dendroclimatological Analysis of European Larch (Larix decidua Mill.) from Lithuania. Balt. For. 2015, 20, 65–72. [Google Scholar]
- Chuchro, M.; Danek, M. Intra-site variation in tree rings of larch (Larix Decidua Mill.) from polish carpathian mountains. In Proceedings of the SGEM 2017: Water Resorces, Forest Ecosystem SGEM, Vienna, Austria, 27–30 November 2017; pp. 877–884. [Google Scholar]
- Chałupka, W.; Kosiński, G. Fizjologia wzrostu i rozwoju. In Modrzewie Larix Mill.; Białobok, S., Ed.; PWN: Warsaw; Poznan, Poland, 1986; pp. 173–213. [Google Scholar]
- Woś, A. Klimat Polski; Wyd. Naukowe PWN: Warszawa, Poland, 1999. [Google Scholar]
- Oleksyn, J.; Fritts, H. Influence of climatic factors upon tree rings of Larix decidua and L. decidua × L. kaempferi from Puławy, Poland. Trees-Struct. Funct. 1991, 5, 75–82. [Google Scholar] [CrossRef]
- Grudd, H.; Briffa, K.R.; Karlén, W.; Bartholin, T.S.; Jones, P.D.; Kromer, B. A 7400-year tree-ring chronology in northern Swedish Lapland: Natural climatic variability expressed on annual to millennial timescales. Holocene 2002, 12, 657–665. [Google Scholar] [CrossRef]
- Simak, M. Photo- and thermoperiodic responses of different larch provenances (Larix decidua Mill.). Stud. For. Suec. 1970, 86, 1–31. [Google Scholar]
- Oberhuber, W. Influence of climate on radial growth of Pinus cembra within the alpine timberline ecotone. Tree Physiol. 2004, 24, 291–301. [Google Scholar] [CrossRef] [PubMed]
- Anfodillo, T.; Rento, S.; Carraro, V.; Furlanetto, L.; Urbinati, C.; Carrer, M. Tree water relations and climatic variations at the alpine timberline: Seasonal changes of sap flux and xylem water potential in Larix decidua Miller, Pisea abies (L.) Krast and Pinus cembra L. Ann. For. Sci. 1998, 55, 159–172. [Google Scholar] [CrossRef]
- Wilczyński, S.; Szymański, N.; Wertz, B.; Muter, E. Wpływ wieku na odpowiedź przyrostową drzew na czynnik klimatyczny na przykładzie modrzewia europejskiego. Stud. Mater. CEPL Rogowie 2014, 16, 256–264. [Google Scholar]
- Schweingruber, F.H. Tree Rings and Environment-Dendroecology; Paul Haupt Publishers: Berne, Switzerland, 1996; p. 609. ISBN 3-258-05458-4. [Google Scholar]
- Carrer, M. Individualistic and Time-Varying Tree-Ring Growth to Climate Sensitivity. PLoS ONE 2011, 6, 1–8. [Google Scholar] [CrossRef] [PubMed]
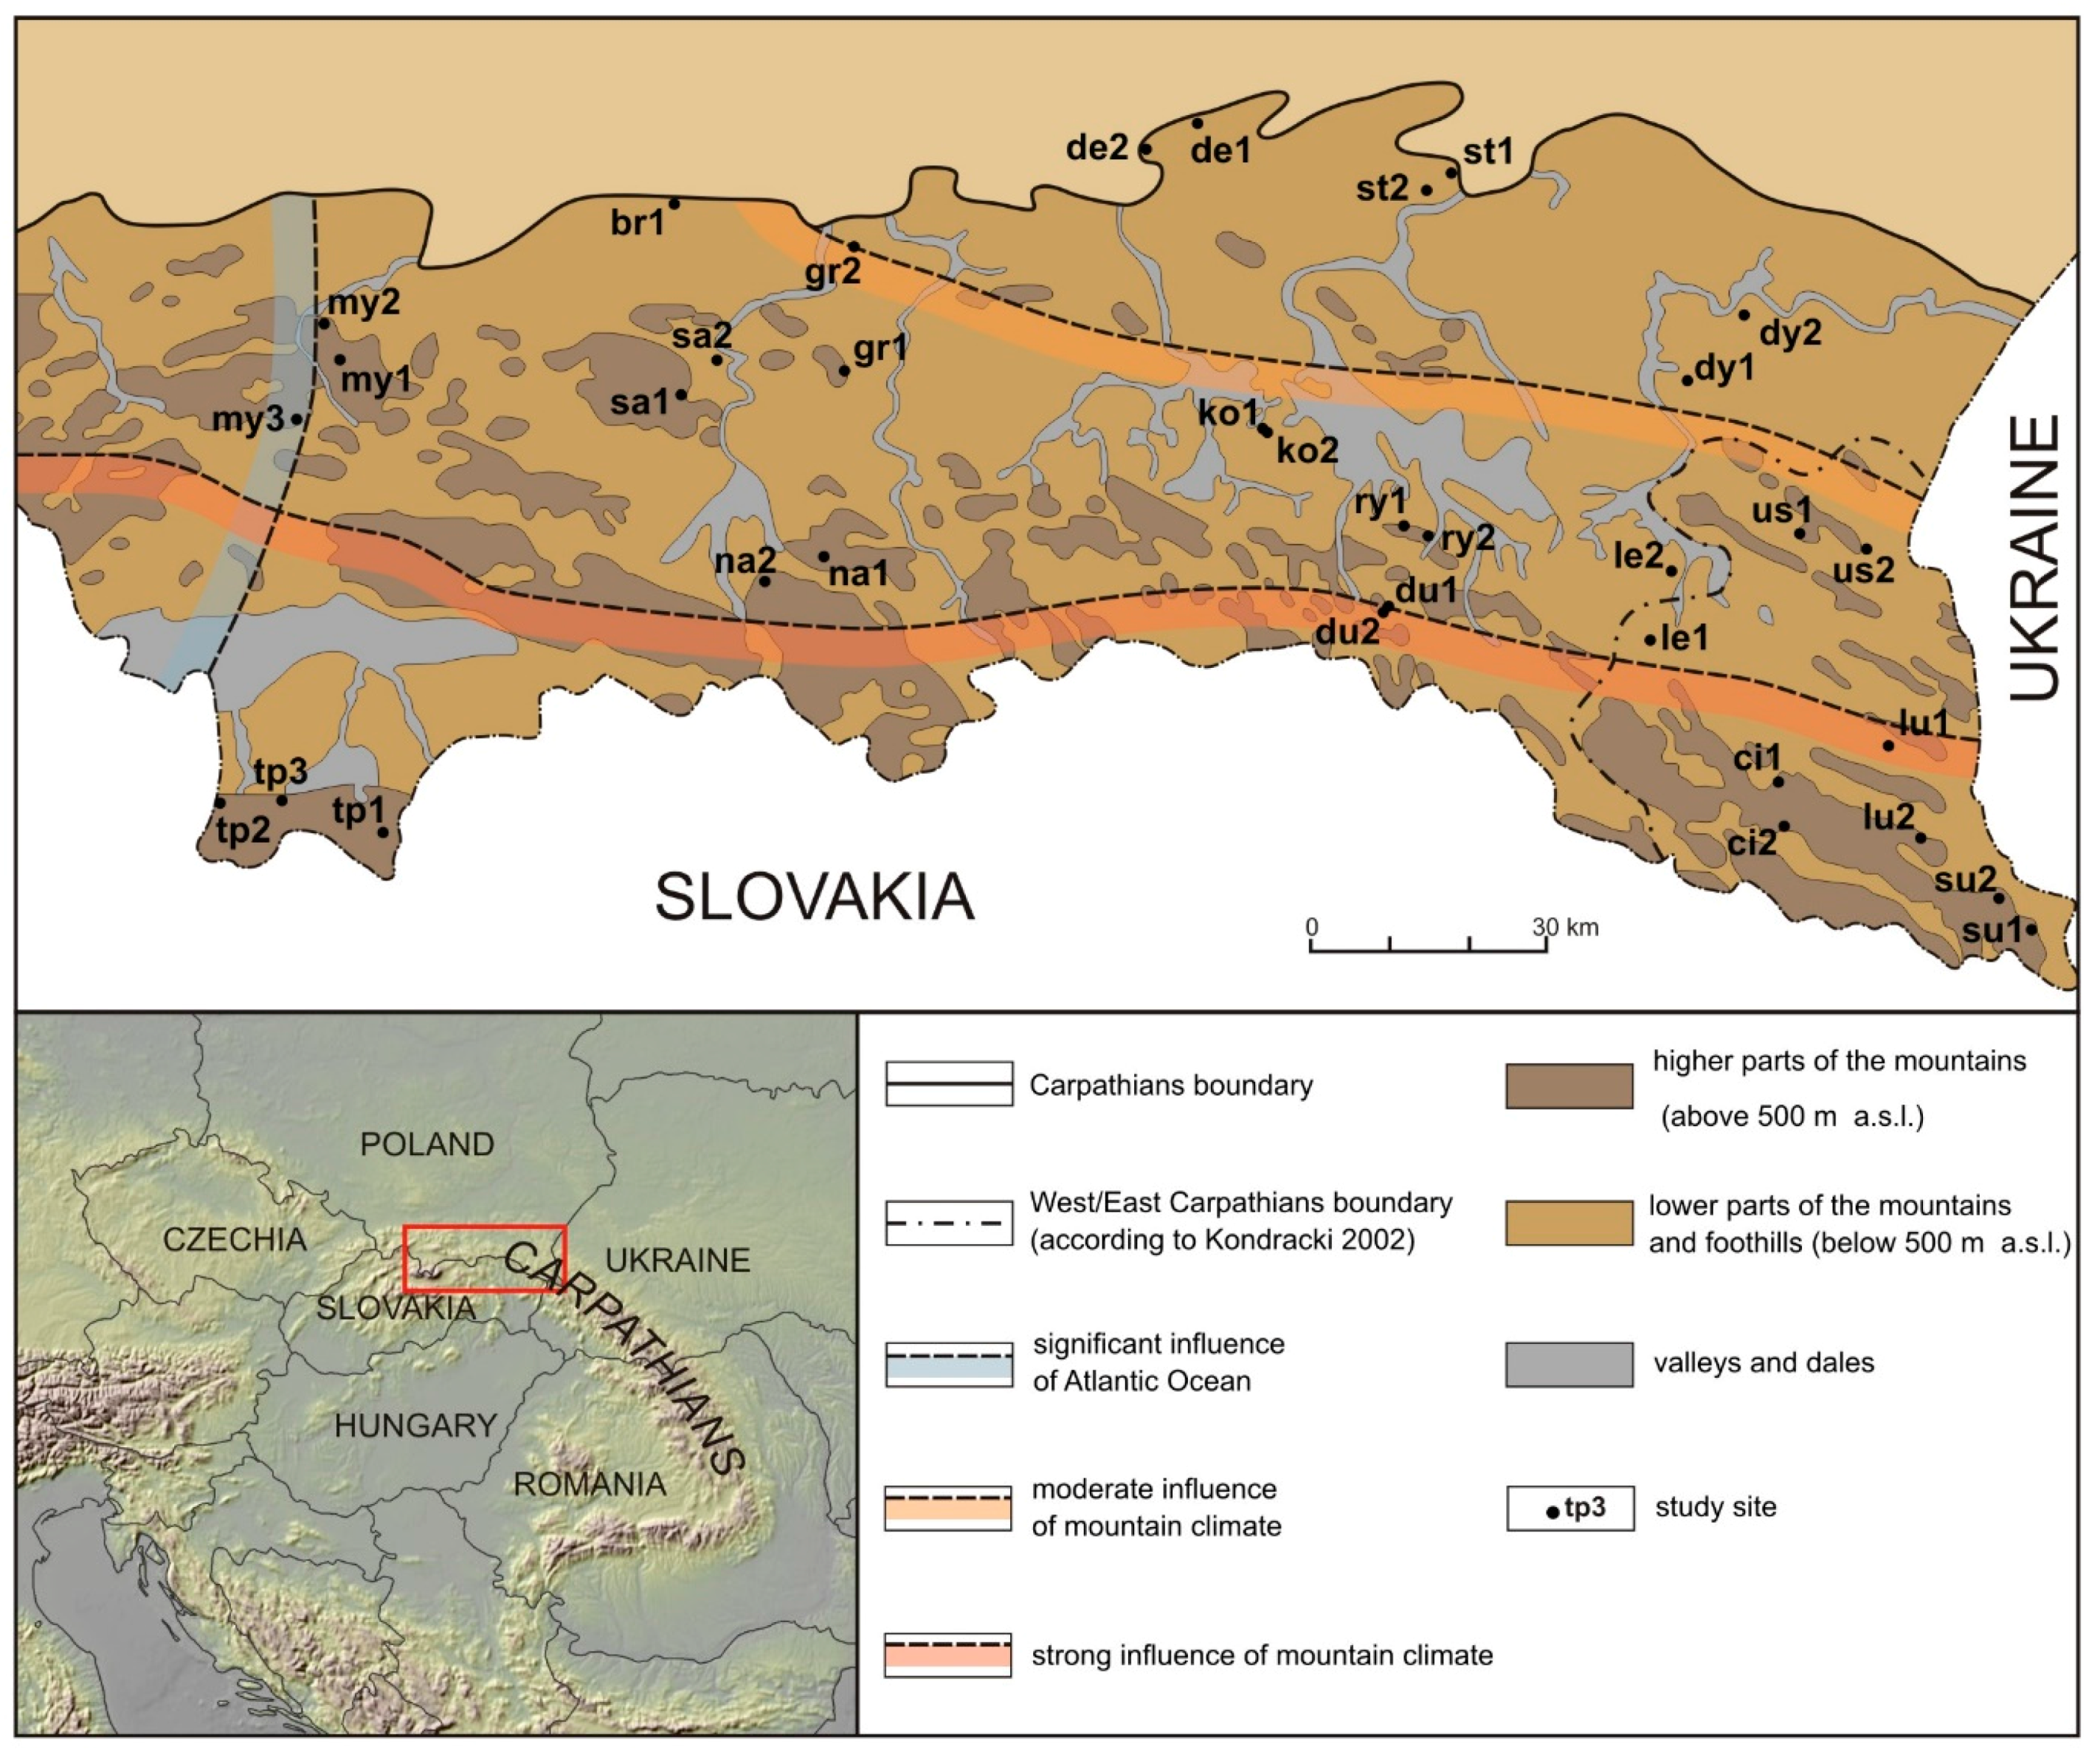
Figure 2.
Results of clustering analysis. Distinguished clusters (C1–C4) are marked.
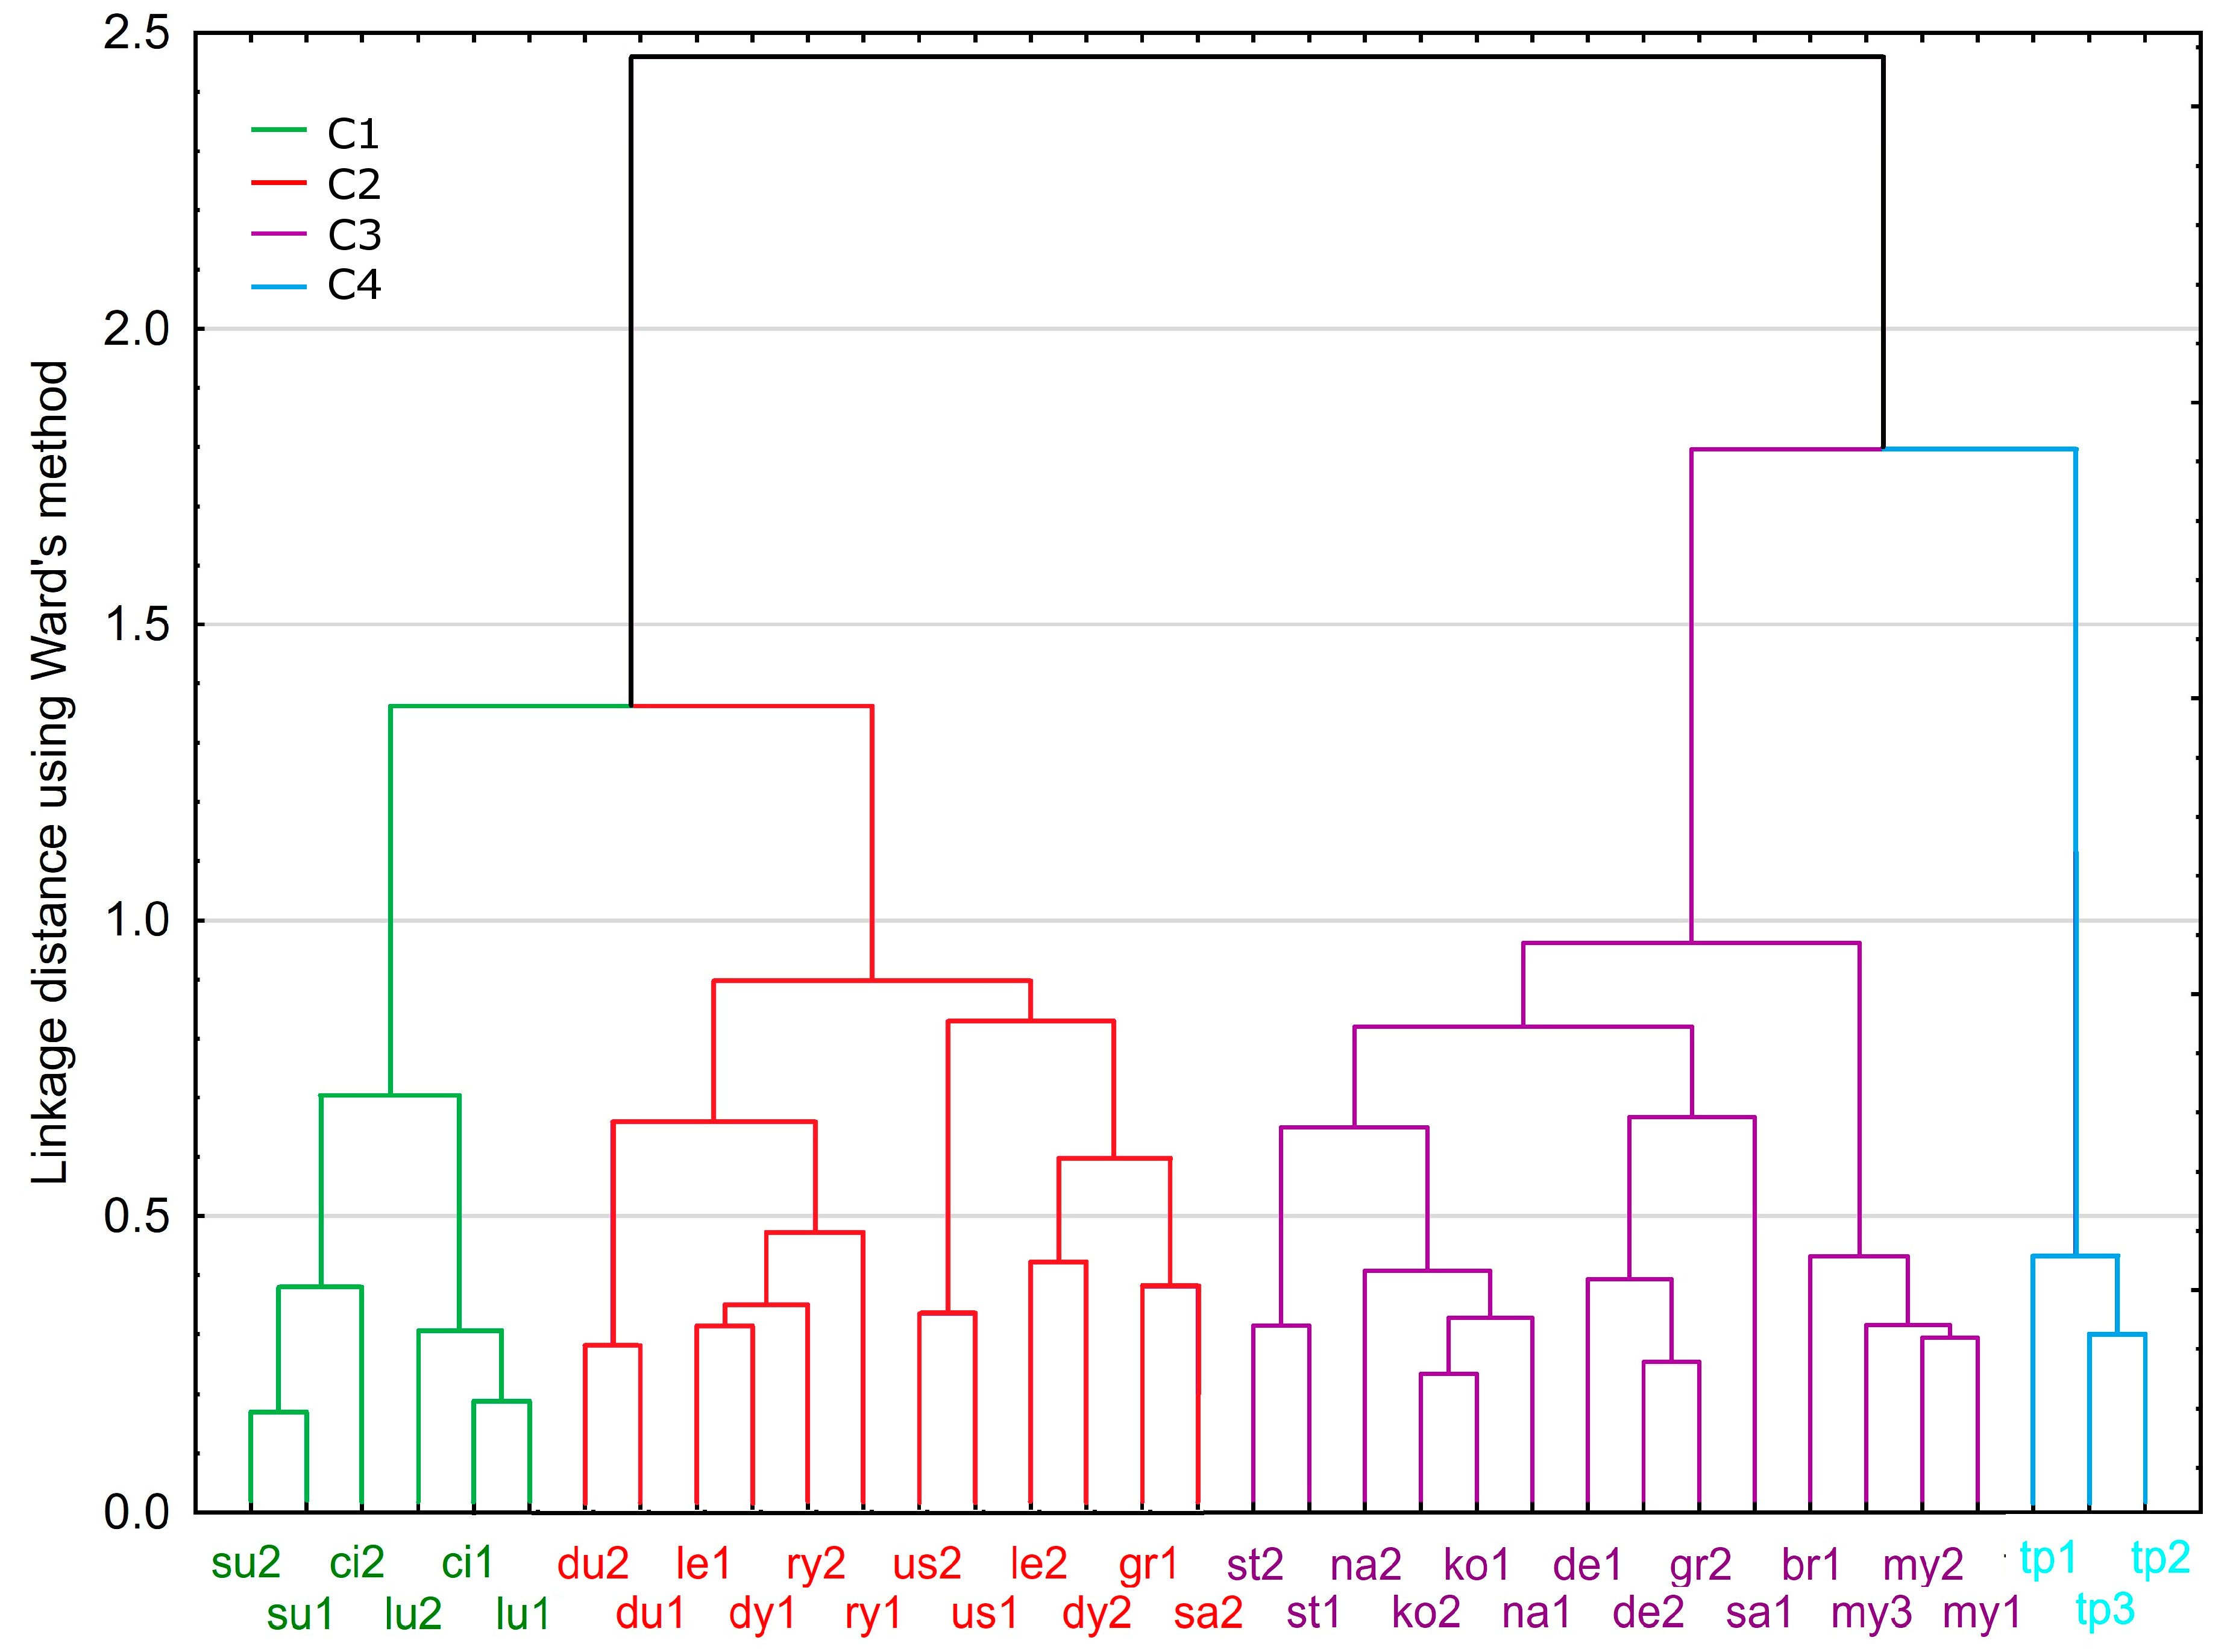
Figure 3.
Results of principal component analysis (PCA) analysis. The share of the first three principal components (PCs) in each site are presented. (a) East to West site order; (b) site order according to clustering.
Figure 3.
Results of principal component analysis (PCA) analysis. The share of the first three principal components (PCs) in each site are presented. (a) East to West site order; (b) site order according to clustering.
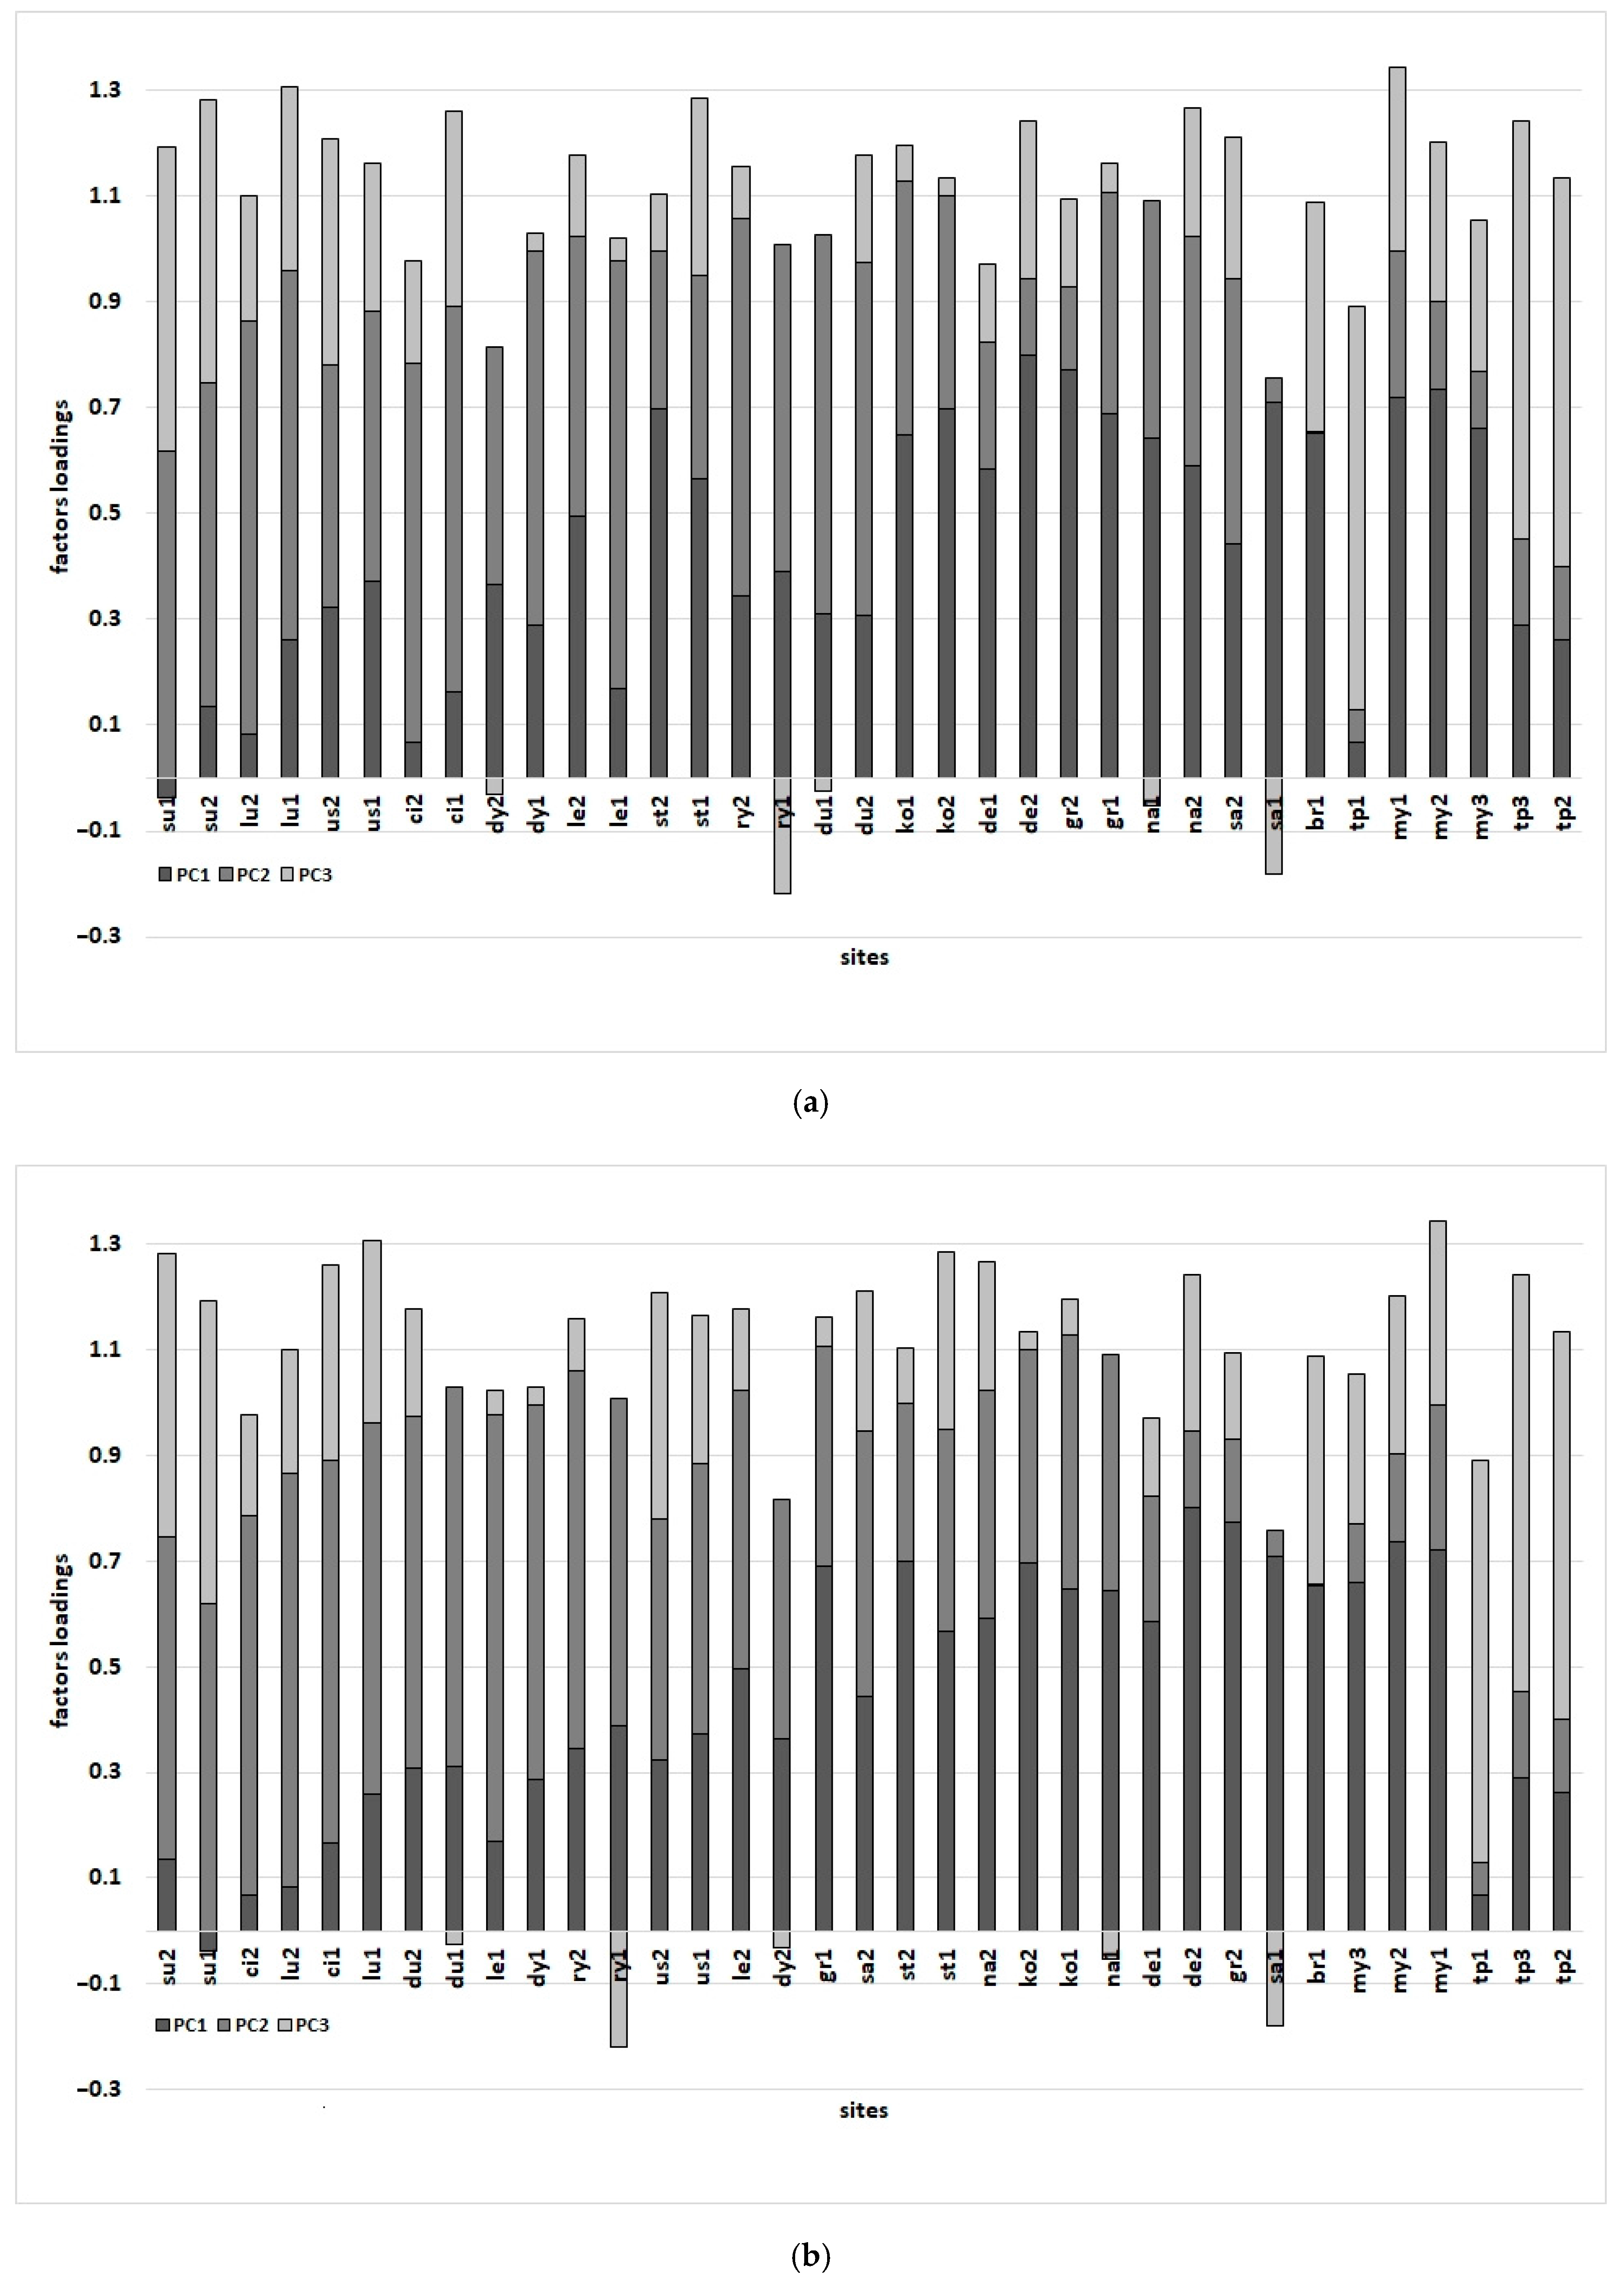
Figure 4.
Scatterplot of the PCA results (after Varimax rotation). Sites and clusters (C1–C4) are marked. (a) PC1 vs. PC2; (b) PC2 vs. PC3.
Figure 4.
Scatterplot of the PCA results (after Varimax rotation). Sites and clusters (C1–C4) are marked. (a) PC1 vs. PC2; (b) PC2 vs. PC3.

Figure 5.
Plot of the relationship between the three first PCs and site longitude, latitude, and altitude. Sites and clusters are marked. (a) PC1; (b) PC2; (c) PC3.
Figure 5.
Plot of the relationship between the three first PCs and site longitude, latitude, and altitude. Sites and clusters are marked. (a) PC1; (b) PC2; (c) PC3.

Figure 6.
Results of climate–growth relationship analysis. Correlations were calculated from previous-year May (M-1) to current-year September (S). Mean values for particular clusters (as lines) were also presented (red line shows significant level). (a) Temperature; (b) precipitation.
Figure 6.
Results of climate–growth relationship analysis. Correlations were calculated from previous-year May (M-1) to current-year September (S). Mean values for particular clusters (as lines) were also presented (red line shows significant level). (a) Temperature; (b) precipitation.
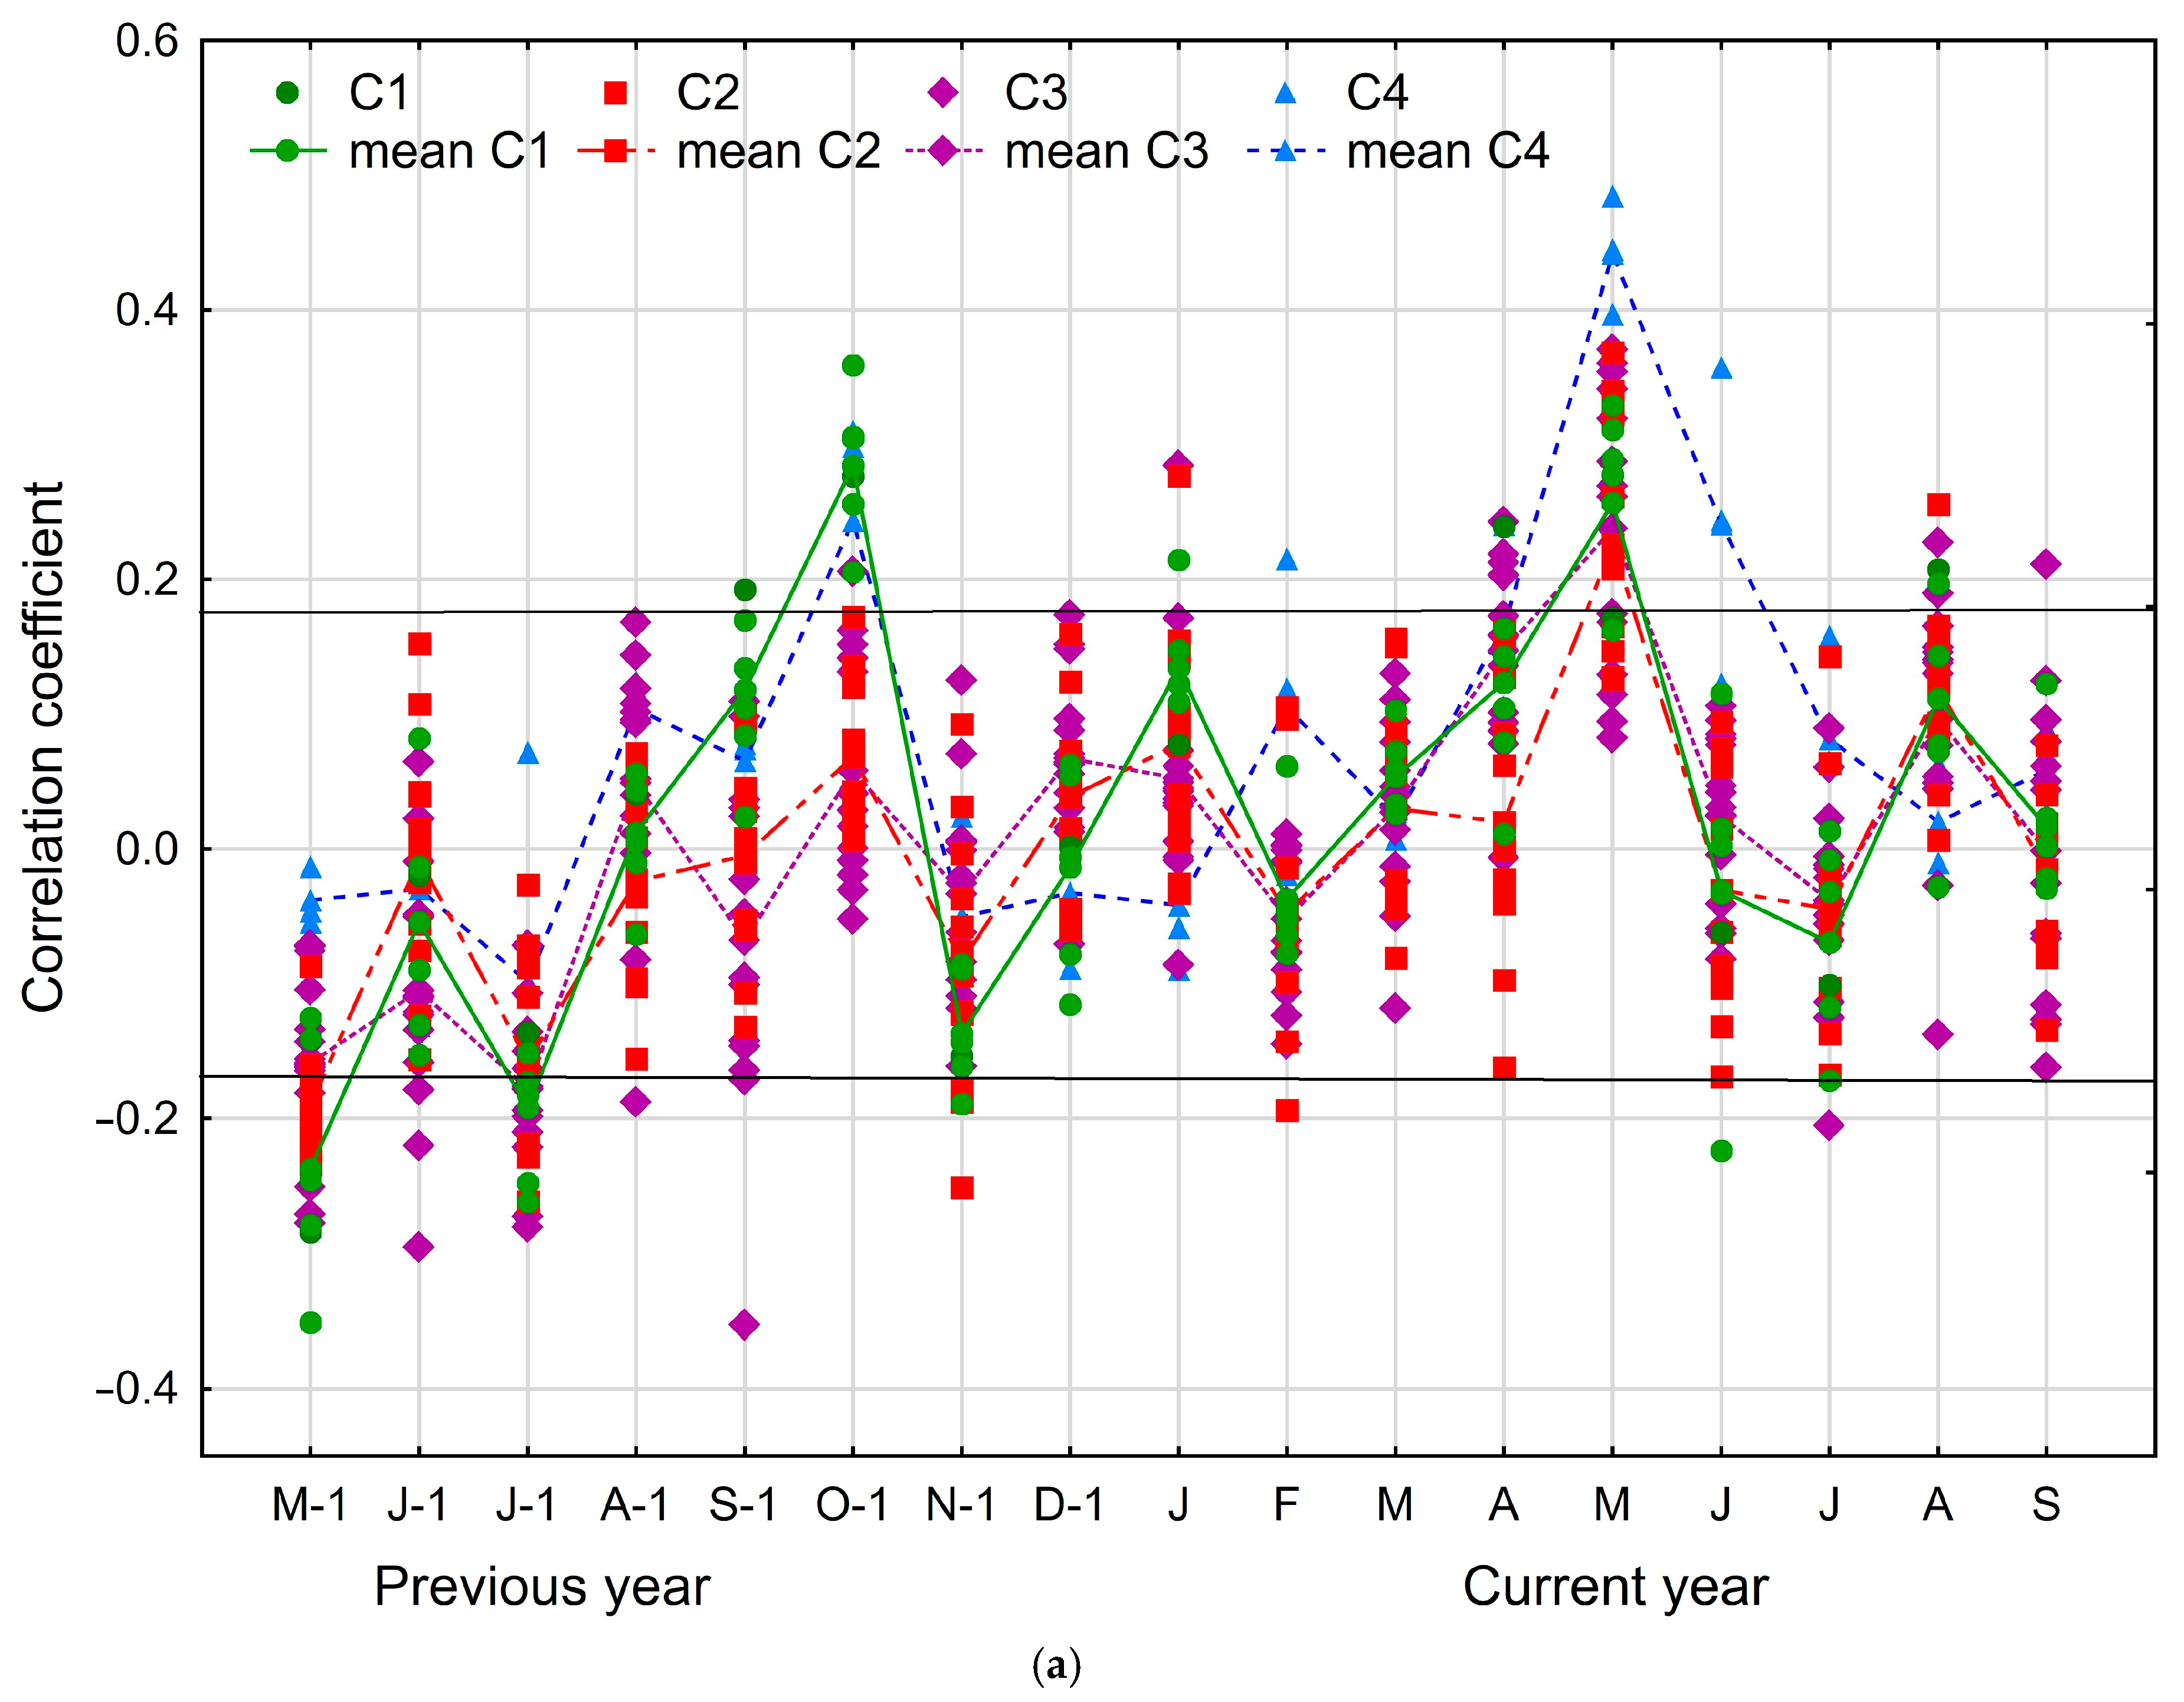

Figure 7.
Results of climate–growth relationship analysis plotted against longitude, latitude, and altitude for the selected months (filled dots represent significant values).
Figure 7.
Results of climate–growth relationship analysis plotted against longitude, latitude, and altitude for the selected months (filled dots represent significant values).


Table 1.
Characteristics of the sampled sites.
| No. | Site | Longitude | Latitude | Altitude (m a.s.l.) | Slope Aspect | Forest Type | Soil Type | No. of Trees |
|---|---|---|---|---|---|---|---|---|
| 1 | tp1 | 20°5′1.90″ E | 49°14′17.00″ N | 1387 | SE | MFF | cambisols | 16 |
| 2 | tp2 | 19°48′6.20″ E | 49°16′2.90″ N | 1211 | NE | MFF | cambisols | 20 |
| 3 | tp3 | 19°54′31.00″ E | 49°16′36.80″ N | 971 | N | MFF | cambisols | 20 |
| 4 | my1 | 19°59′34.32″ E | 49°44′59.59″ N | 471 | WWS | MFF | cambisols | 17 |
| 5 | my2 | 19°57′30.38″ E | 49°49′12.45″ N | 376 | NNW | MFF | cambisols | 14 |
| 6 | my3 | 19°55′26.74″ E | 49°41′0.50″ N | 489 | S | MFF | cambisols | 13 |
| 7 | br1 | 20°33′13.54″ E | 49°57′50.60″ N | 278 | N | USFF | cambisols | 17 |
| 8 | sa1 | 20°34′11.17″ E | 49°43′2.14″ N | 528 | N | MFF | cambisols | 11 |
| 9 | sa2 | 20°39′31.23″ E | 49°45′59.33″ N | 349 | SSE | UFF | cambisols | 14 |
| 10 | na1 | 20°48′53.20″ E | 49°32′35.90″ N | 562 | SW | MFF | cambisols | 15 |
| 11 | na2 | 20°42′43.50″ E | 49°31′40.70″ N | 600 | NE | MFF | cambisols | 13 |
| 12 | gr1 | 20°51′45.10″ E | 49°44′40.10″ N | 447 | NE | UFF | cambisols | 13 |
| 13 | gr2 | 20°53′46.30″ E | 49°55′48.70″ N | 361 | E | UFF | cambisols | 14 |
| 14 | de1 | 21°26′36.20″ E | 50°1′29.83″ N | 325 | N | UFF | luvisols | 14 |
| 15 | de2 | 21°20′51.46″ E | 49°59′56.94″ N | 306 | W | UFF | luvisols | 14 |
| 16 | ko1 | 21°33′22.68″ E | 49°40′47.77″ N | 340 | SW | UFF | cambisols | 20 |
| 17 | ko2 | 21°33′16.10″ E | 49°41′12.02″ N | 325 | NE | UFF | cambisols | 20 |
| 18 | st1 | 21°51′37.57″ E | 49°56′39.57″ N | 306 | WSW | UFF | cambisols | 15 |
| 19 | st2 | 21°52′55.23″ E | 49°57′52.84″ N | 282 | NNE | UFF | cambisols | 15 |
| 20 | ry1 | 21°48′33.12″ E | 49°34′18.90″ N | 474 | S-SE | MFF | cambisols | 17 |
| 21 | ry2 | 21°49′36.64″ E | 49°33′19.12″ N | 534 | N | MFF | cambisols | 15 |
| 22 | du1 | 21°45′34.52″ E | 49°29′9.77″ N | 536 | NW | MFF | cambisols | 20 |
| 23 | du2 | 21°45′21.46″ E | 49°28′44.65″ N | 590 | SSE | MFF | cambisols | 20 |
| 24 | dy1 | 22°15′3.50″ E | 49°42′37.00″ N | 487 | WNW | UFF | cambisols | 20 |
| 25 | dy2 | 22°22′21.80″ E | 49°47′7.40″ N | 414 | SW-SSW | UFF | cambisols | 20 |
| 26 | us1 | 22°27′3.09″ E | 49°31′27.80″ N | 522 | S | MFF | cambisols | 16 |
| 27 | us2 | 22°33′47.08″ E | 49°30′27.61″ N | 580 | N | MFF | cambisols | 17 |
| 28 | le1 | 22°11′48.80″ E | 49°24′45.60″ N | 582 | NE | MFF | cambisols | 24 |
| 29 | le2 | 22°14′4.70″ E | 49°29′4.20″ N | 481 | NW-SW | UFF | cambisols | 20 |
| 30 | lu1 | 22°34′33.10″ E | 49°17′5.80″ N | 569 | NW | MFF | cambisols | 20 |
| 31 | lu2 | 22°37′50.00″ E | 49°11′32.00″ N | 749 | N | MFF | cambisols | 20 |
| 32 | ci1 | 22°22′51.70″ E | 49°15′5.10″ N | 604 | NNE | MFF | cambisols | 20 |
| 33 | ci2 | 22°23′56.60″ E | 49°11′58.60″ N | 723 | SE | MFF | cambisols | 19 |
| 34 | su1 | 22°49′6.30″ E | 49°4′15.80″ N | 875 | SW | MFF | cambisols | 20 |
| 35 | su2 | 22°48′57.50″ E | 49°5′39.90″ N | 760 | WNW | MFF | cambisols | 21 |
MFF: mountain fresh forest; UFF: upland fresh forest; USFF: upland strongly fresh forest [42].
Table 2.
Characteristics and descriptive statistics for the constructed chronologies.
| No. | Site Code | Cluster | Full Period Covered | Number of Years | No. of Trees in Chronology | MSL | AGR (mm) | AC | MS | mRbar (30_15) | mEPS (30_15) |
|---|---|---|---|---|---|---|---|---|---|---|---|
| 1 | tp1 | C4 | 1743–2015 | 274 | 14 | 225 | 0.620 | 0.76 | 0.25 | 0.55 | 0.96 |
| 2 | tp2 | C4 | 1869–2015 | 147 | 18 | 133 | 1.295 | 0.79 | 0.25 | 0.70 | 0.97 |
| 3 | tp3 | C4 | 1868–2015 | 148 | 17 | 136 | 1.542 | 0.79 | 0.20 | 0.68 | 0.97 |
| 4 | my1 | C3 | 1873–2008 | 136 | 12 | 131 | 1.834 | 0.76 | 0.23 | 0.56 | 0.93 |
| 5 | my2 | C3 | 1874–2009 | 136 | 11 | 127 | 1.646 | 0.62 | 0.25 | 0.59 | 0.92 |
| 6 | my3 | C3 | 1866–2009 | 144 | 11 | 139 | 1.717 | 0.77 | 0.25 | 0.59 | 0.94 |
| 7 | br1 | C3 | 1871–2008 | 138 | 12 | 129 | 1.829 | 0.73 | 0.26 | 0.54 | 0.92 |
| 8 | sa1 | C3 | 1900–2009 | 110 | 10 | 101 | 1.964 | 0.68 | 0.25 | 0.50 | 0.9 |
| 9 | sa2 | C2 | 1916–2009 | 94 | 10 | 89 | 2.568 | 0.74 | 0.23 | 0.47 | 0.9 |
| 10 | na1 | C3 | 1895–2010 | 116 | 14 | 99 | 2.795 | 0.63 | 0.23 | 0.45 | 0.91 |
| 11 | na2 | C3 | 1896–2010 | 115 | 13 | 112 | 2.015 | 0.79 | 0.23 | 0.58 | 0.95 |
| 12 | gr1 | C2 | 1894–2010 | 117 | 12 | 110 | 1.904 | 0.81 | 0.21 | 0.47 | 0.91 |
| 13 | gr2 | C3 | 1889-2010 | 122 | 13 | 119 | 1.625 | 0.63 | 0.26 | 0.49 | 0.92 |
| 14 | de1 | C3 | 1911–2008 | 98 | 11 | 93 | 2.534 | 0.65 | 0.26 | 0.45 | 0.88 |
| 15 | de2 | C3 | 1898–2008 | 112 | 11 | 105 | 1.964 | 0.77 | 0.23 | 0.40 | 0.87 |
| 16 | ko1 | C3 | 1888–2014 | 127 | 16 | 118 | 1.760 | 0.69 | 0.25 | 0.52 | 0.94 |
| 17 | ko2 | C3 | 1895–2014 | 120 | 19 | 112 | 1.960 | 0.65 | 0.25 | 0.52 | 0.95 |
| 18 | st1 | C3 | 1879–2013 | 135 | 15 | 130 | 1.549 | 0.78 | 0.21 | 0.55 | 0.95 |
| 19 | st2 | C3 | 1894–2013 | 120 | 15 | 110 | 2.012 | 0.70 | 0.20 | 0.54 | 0.94 |
| 20 | ry1 | C2 | 1901–2013 | 113 | 16 | 107 | 1.601 | 0.69 | 0.21 | 0.47 | 0.92 |
| 21 | ry2 | C2 | 1898–2013 | 116 | 13 | 110 | 1.679 | 0.68 | 0.23 | 0.55 | 0.94 |
| 22 | du1 | C2 | 1907-2014 | 108 | 17 | 102 | 1.981 | 0.80 | 0.21 | 0.45 | 0.93 |
| 23 | du2 | C2 | 1897–2014 | 118 | 19 | 111 | 1.651 | 0.83 | 0.19 | 0.43 | 0.93 |
| 24 | dy1 | C2 | 1908–2015 | 108 | 18 | 99 | 1.858 | 0.73 | 0.19 | 0.50 | 0.94 |
| 25 | dy2 | C2 | 1906–2015 | 110 | 13 | 104 | 1.465 | 0.78 | 0.17 | 0.51 | 0.93 |
| 26 | us1 | C2 | 1893–2014 | 122 | 15 | 116 | 1.898 | 0.69 | 0.21 | 0.48 | 0.91 |
| 27 | us2 | C2 | 1898–2014 | 117 | 14 | 111 | 2.573 | 0.64 | 0.22 | 0.58 | 0.94 |
| 28 | le1 | C2 | 1907–2015 | 109 | 19 | 102 | 1.932 | 0.76 | 0.19 | 0.57 | 0.96 |
| 29 | le2 | C2 | 1887–2015 | 129 | 18 | 110 | 1.466 | 0.75 | 0.19 | 0.47 | 0.94 |
| 30 | lu1 | C1 | 1911–2014 | 104 | 17 | 97 | 2.784 | 0.67 | 0.22 | 0.49 | 0.94 |
| 31 | lu2 | C1 | 1900–2014 | 115 | 18 | 111 | 2.233 | 0.88 | 0.23 | 0.57 | 0.96 |
| 32 | ci1 | C1 | 1905–2014 | 110 | 17 | 105 | 2.600 | 0.72 | 0.20 | 0.53 | 0.95 |
| 33 | ci2 | C1 | 1916–2014 | 99 | 18 | 94 | 2.287 | 0.74 | 0.20 | 0.48 | 0.94 |
| 34 | su1 | C1 | 1918–2014 | 97 | 17 | 92 | 1.919 | 0.79 | 0.21 | 0.56 | 0.95 |
| 35 | su2 | C1 | 1912–2014 | 103 | 19 | 92 | 2.292 | 0.67 | 0.25 | 0.54 | 0.96 |
Chronology statistics: Mean series length (MSL), average growth rate (AGR), standard deviation (SD), and first-order serial autocorrelation (AC) were computed on the raw tree-ring series; mean sensitivity (MS), mean interseries correlation (mRbar), and mean EPS (mEPS) were computed for indexed chronologies (30-year EPS window and 15-year lag). The cluster identification was also provided.
© 2017 by the authors. Licensee MDPI, Basel, Switzerland. This article is an open access article distributed under the terms and conditions of the Creative Commons Attribution (CC BY) license (http://creativecommons.org/licenses/by/4.0/).
Share and Cite
MDPI and ACS Style
Danek, M.; Chuchro, M.; Walanus, A. Variability in Larch (Larix Decidua Mill.) Tree-Ring Growth Response to Climate in the Polish Carpathian Mountains. Forests 2017, 8, 354. https://doi.org/10.3390/f8100354
AMA Style
Danek M, Chuchro M, Walanus A. Variability in Larch (Larix Decidua Mill.) Tree-Ring Growth Response to Climate in the Polish Carpathian Mountains. Forests. 2017; 8(10):354. https://doi.org/10.3390/f8100354
Chicago/Turabian StyleDanek, Małgorzata, Monika Chuchro, and Adam Walanus. 2017. "Variability in Larch (Larix Decidua Mill.) Tree-Ring Growth Response to Climate in the Polish Carpathian Mountains" Forests 8, no. 10: 354. https://doi.org/10.3390/f8100354
Note that from the first issue of 2016, this journal uses article numbers instead of page numbers. See further details here.