Does the Slope of the Self-thinning Line Remain a Constant Value across Different Site Qualities?—An Implication for Plantation Density Management


1
Key Laboratory for Forest Resources and Ecosystem Processes of Beijing, Beijing Forestry University, Beijing 100083, China
2
Academy of Forest Inventory and Planning, State Forestry Administration, Beijing 100714, China
3
Rubinstein School of Environment and Natural Resources, University of Vermont, Burlington, VT 05405, USA
*
Author to whom correspondence should be addressed.
Forests 2017, 8(10), 355; https://doi.org/10.3390/f8100355
Submission received: 19 August 2017
/
Revised: 15 September 2017
/
Accepted: 20 September 2017
/
Published: 21 September 2017
Abstract
:The self-thinning rule is regarded as one of the most important principles in plantation management. This rule, involving the assumption of a constant slope coefficient, has been universally applied when regulating stand density. In this study, we hypothesized that the slope coefficient can change significantly with changes in site quality. To test this hypothesis, we first grouped forest plots into 5 categories based on site index. Second, we produced the self-thinning line represented by the Reineke function for each of the 5 site categories, selecting fully stocked plots using reduced major axis regression. Third, the slope coefficients for the different categories were tested for significant differences. The results indicated that in general, the slope was significantly different with different site quality. In addition, we observed that the slope of the self-thinning line exhibited a steeper trend for sites of lower quality, which indicated increased self-thinning or reduced self-tolerance. Finally, we concluded that it is imperative to produce specific self-thinning lines for different site quality categories.
1. Introduction
Although multiple-purpose forest management has received increasing attention and is today adopted by many countries throughout the world [1,2], plantations are still greatly prioritized in many countries as an important timber production and economic income source for local communities [3,4]. China has the world’s largest number of forest plantations with a plantation area and growing stock volume of 69.33 million ha and 2.48 billion m3, respectively, according to the results of the 8th Chinese national forest inventory [5]. However, these plantations are of extremely low quality in terms of a stand volume (around 52.76 m3/ha) and mean annual increment (4.23 m3/ha/year). The productivity of these plantations is less than one third of the value in Europe at the same latitude [5,6,7]. The vast area but poor quality of the plantations has highlighted the urgent need to develop optimum management regimes.
Stand density has a major potential impact on individual tree size and stand yield [8,9,10]. Castedo-Dorado et al. [11] defined stand density management as the process of controlling the level of growing stock through initial spacing or subsequent thinning to realize specific management objectives. The most important principle underlying stand density management is the self-thinning rule. The self-thinning rule describes a universal relationship between plant size and density of organisms [12] and has been regarded as one of the most important principles of plant population ecology [13,14]. The rule states that, in double logarithmic scales, the relationship between plant size and stand density is a straight line in overcrowded (fully stocked) stands [15,16,17,18].
This self-thinning line has been commonly expressed by the Reineke equation [19] and the −3/2 Rule of Self-thinning or Yoda equation [13,15]:
where N (trees/ha) is the number of individuals per ha, QMD (cm) the quadratic mean tree diameter, MV (m3) mean tree volume, and α1 or α2 is the intercept constant.
Interestingly, these two equations were developed independently by the authors from different research areas at different times, i.e., Reineke was a forester, whereas Yoda was an ecologist. These two equations, however, are mathematically equivalent, though they differ in the variables for characterizing plant size [17,20].
Additionally, both Reineke [19] and Yoda et al. [15] argued that in logarithmic scales, the slopes of their equations are universally constant with values of −1.5 and −1.605, regardless of species, location, age, initial density, and site quality. It is noteworthy that the assumed constant value of −1.5 provided the Yoda equation with its common name “the −3/2 power rule.” The arguments of Yoda et al. [15] and Reineke [19] were further supported by subsequent studies conducted by White and Harper [21], Gorham [22], White [14], and Jack and Long [23]. However, the general validity of the constant slope was also questioned by many authors, who documented that the slope could be significantly different in terms of species, site qualities, and management history [24,25,26,27,28,29,30,31,32,33,34,35,36,37,38,39]. The validity of the constant slope in terms of different species has been extensively examined [34,35,36,37,40,41,42,43,44]. For instance, Puettmann et al. [30] documented that the slope of the Reineke equation was −1.64 for red alder stands and −1.52 for Douglas-fir stands. Solomon and Zhang [35] investigated the validity of the constant slope for softwoods in the northeastern US and found that the slope of the cedar–black spruce forest habitat trees differed significantly from the slopes of hemlock–red spruce and spruce–fir habitat trees.
Site quality refers to the combination of physical and biological factors characterizing a particular geographic location or site, and may involve a descriptive classification [45]. Since site quality directly represents potential stand productivity and plays a major role in sharpening forest structure, it should serve as an important reference for silvicultural diagnosis and prescription [46]. However, few forestry studies have examined the self-thinning rule in relation to site quality [12,24]. Instead, it is widely assumed that the slope of the self-thinning line is constant regardless of site quality. The self-thinning rules are commonly used to produce a stand density management diagram (SDMD) to regulate stand density for different objectives. If the slope of the self-thinning line varied according to site quality, the SDMD might yield biased estimation, which could cause us to fail in our management objectives. Therefore, it is imperative to examine whether the self-thinning rule is influenced by site quality.
In the present study, we hypothesized that the slope of the self-thinning line is sensitive to site quality and significant differences would be observed with varying site quality. We employed 553 plots of China fir (Cunninghamia lanceolata (Lamb.) Hook) plantations in Fujian Province, Southern China, to test this hypothesis. Finally, we suggest stand density management for China fir plantations based on our final results.
2. Materials and Methods
2.1. Data Source
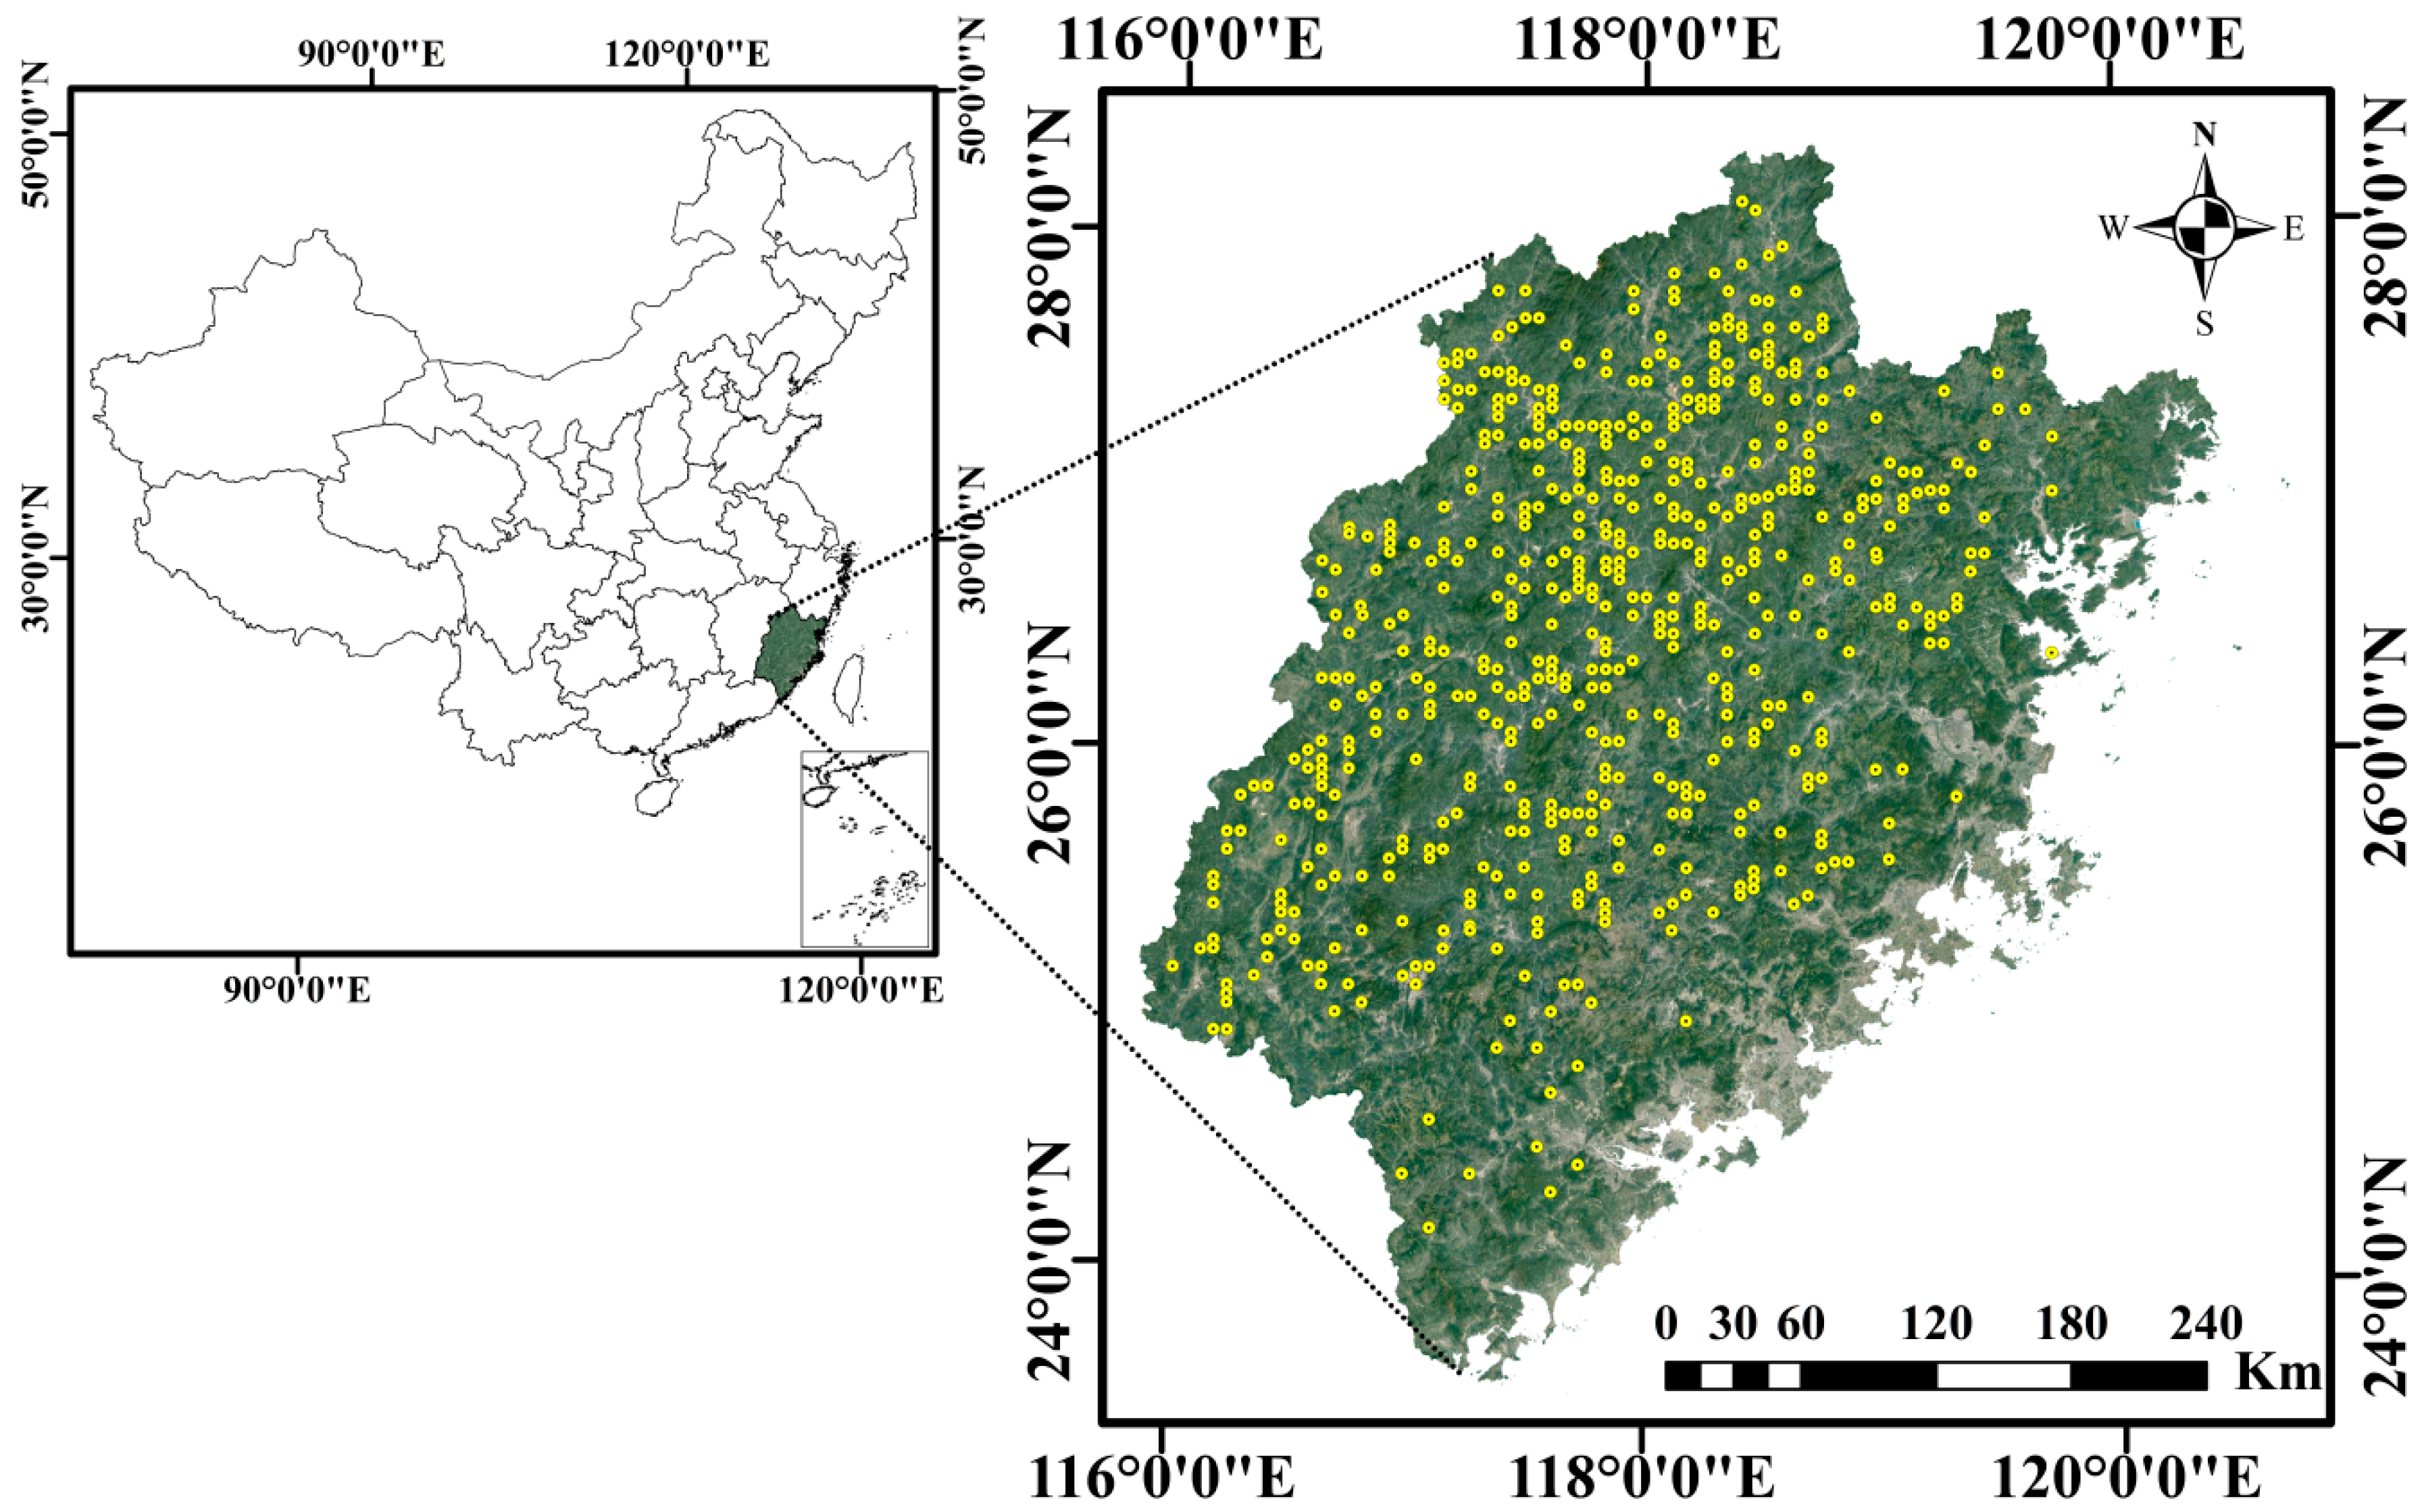
We used the data provided by the 8th Chinese National Forest Inventory (CNFI) in 2013 in Fujian Province (23°31′ N to 28°22′ N, 115°51′ E to 120°40′ E), Southern China (Figure 1). The inventory consists of a systematic sample of 5051 permanent square plots with a size of 1 Mu (Chinese unit of area, 0.067 ha) distributed on a square grid of 4 km × 6 km. According to Zhang et al. [17], a total of 553 plots of China fir (constituting more than 80% of total basal area) were determined as the pure stands, which were employed to investigate the validity of a constant slope for the self-thinning line (Figure 1). The descriptive statistics for these 553 plots are summarized in Table 1.
In these pure China fir stands, the overstory species mainly include Cunninghamia lanceolata (Lamb.) Hook, Pinus massoniana Lamb., Quercus app., Schima superba Gardner et Champ., Cyclobalanopsis gracilis (Rehder et E. H. Wilson) W. C. Cheng et T. Hong, Liquidambar formosana Hance, Alniphyllum fortunei (Hemsl.) Makino, Phoebe bournei (Hemsl.) Yang, Schefflera brevipedicellata Harms and Cinnamomum bodinieri H. Lév., which account for 81.52%, 7.33%, 1.83%, 1.55%, 0.98%, 0.58%, 0.54%, 0.44%, 0.44% and 0.16% of total basal area, respectively. There is almost no understory trees in the young and middle aged China fir planation. In the old plantation, however, there might be understory trees which are naturally regenerated. The major tree species include Eurya nitida Korth., Schima superba Gardner et Champ., Adinandra millettii (Hook. et Arn.) Benth. et Hook. f. ex Hance, and Meliosma rigida Siebold et Zucc., which together account for 60.35%. The other 20 understory tree species totally represent 39.65% [47].
A system of successive cropping is the current management for commercial China fir plantations [48,49]. This system involves intermediate thinnings after canopy closure and the final clear-cutting in Fujian Province, the rotation age is 26 year and there are two or three intermediate thinnings [50,51]. However, non-commercial China fir planation or a planation grown at a site with a slope of more than 35° is under strict protection and no treatments are applied [52].
2.2. Site Quality Classification
There are two different approaches to forest site quality evaluation: phytocentric measures and geocentric measures [46]. Site index (SI), the average height of the dominant portion of the stand at an arbitrarily chosen age, is the most commonly used phytocentric measure of forest site quality, especially for pure plantations [20,46]. In this study, we used the polymorphic SI model (base age 20) developed by Duan and Zhang [53] for China fir in the same region to evaluate the site quality. The model is as follows:
where SI (m) is the site index; H (m) is the dominant height; t (years) is the age at the corresponding SI and H.
As tree height is not measured in the CNFI, it was estimated using the equation proposed by Li and Meng [54] for China fir in the same region:
where h is the tree height in m, and dbh is the breast height diameter in mm.
The stand dominant height was computed as the mean height of the 100 thickest trees per hectare [55]. The SI was calculated respectively for the 553 plots and the descriptive statistics for the SI are also listed in Table 1. In this study, based on the SI, we grouped the plots into 5 categories with an equal number of plots (Table 2) because if the categories were produced with an equal SI interval, fewer trees would be placed in the highest or lowest categories, which could make it difficult to produce the corresponding self-thinning lines.
2.3. Selection of Full Stocked Plots and Regression Methods
Many approaches have been proposed to select fully stocked plots for producing the self-thinning line. The visual method has been extensively used [40,56,57], which purposefully selects data points that lie close to an arbitrarily visualized upper boundary. However, this method has been questioned because of its arbitrariness and subjectivity [57,58]. In this context, many alternative objective methods [16,35,58,59] have been suggested to determine the full stocked plots. Amongst these methods, the relative density (RD) approach proposed by Solomon and Zhang [35] has been commonly used. Solomon and Zhang [35] and Zhang et al. [17] summarized the following steps for identifying the fully stocked plots, which were also applied in the present study. First, the theoretical value of the slope coefficient of the self-thinning line was assumed. Second, the intercept coefficient was calculated using the plots with the largest combination of plant size and stand density. Third, the determined self-thinning equation was employed to calculate the maximum stand density for each plot. Finally, the plots with RD > 0.7 were selected as the most fully stocked plots for developing the final self-thinning line.
Additionally, the other important issue for generating a self-thinning line is the choice of regression method. Because our primary interest was to investigate the functional relationship between two variables, i.e., ln(QMD) and ln(N), instead of least-square regression, we employed reduced major axis regression (RMA), which has been documented to perform better when the primary interest is the values of the equation parameters themselves [60]. Solomon and Zhang [35] used this regression method to produce the self-thinning line for three mixed softwood forest types (hemlock–red spruce, spruce–fir, and cedar–black spruce) in the northeastern US. The model fitting process can be described as follows: suppose a linear regression model: , where αOLS and βOLS () are the two coefficients estimated by OLS regression, and in the Reineke equation y and x are ln (N) and ln (QMD), respectively. The Pearson correlation coefficient between y and x is . For RMA regression, the slope coefficient is , and the intercept coefficient is [35]. The R2RMA is , and errors are calculated as and [61]. Confidence intervals are calculated from these by standard methods [62]. For more detailed description of RMA regression, please refer to Bohonak [61].
2.4. Significance Test of Slope Difference and Model Evaluation
Following Solomon and Zhang [35], if a slope coefficient of any forest site falls outside the lower and upper limits of the corresponding confidence interval of another forest site, we concluded that the difference in slope between the two forest sites was statistically significant. Conversely, if the confidence intervals for a slope coefficient of one forest site included the corresponding coefficients of the other forest site, no significant difference of slope coefficients between the two sites could be determined. For model evaluation, we calculated the coefficient of determination (R2) and the root mean square error (RMSE).
3. Results
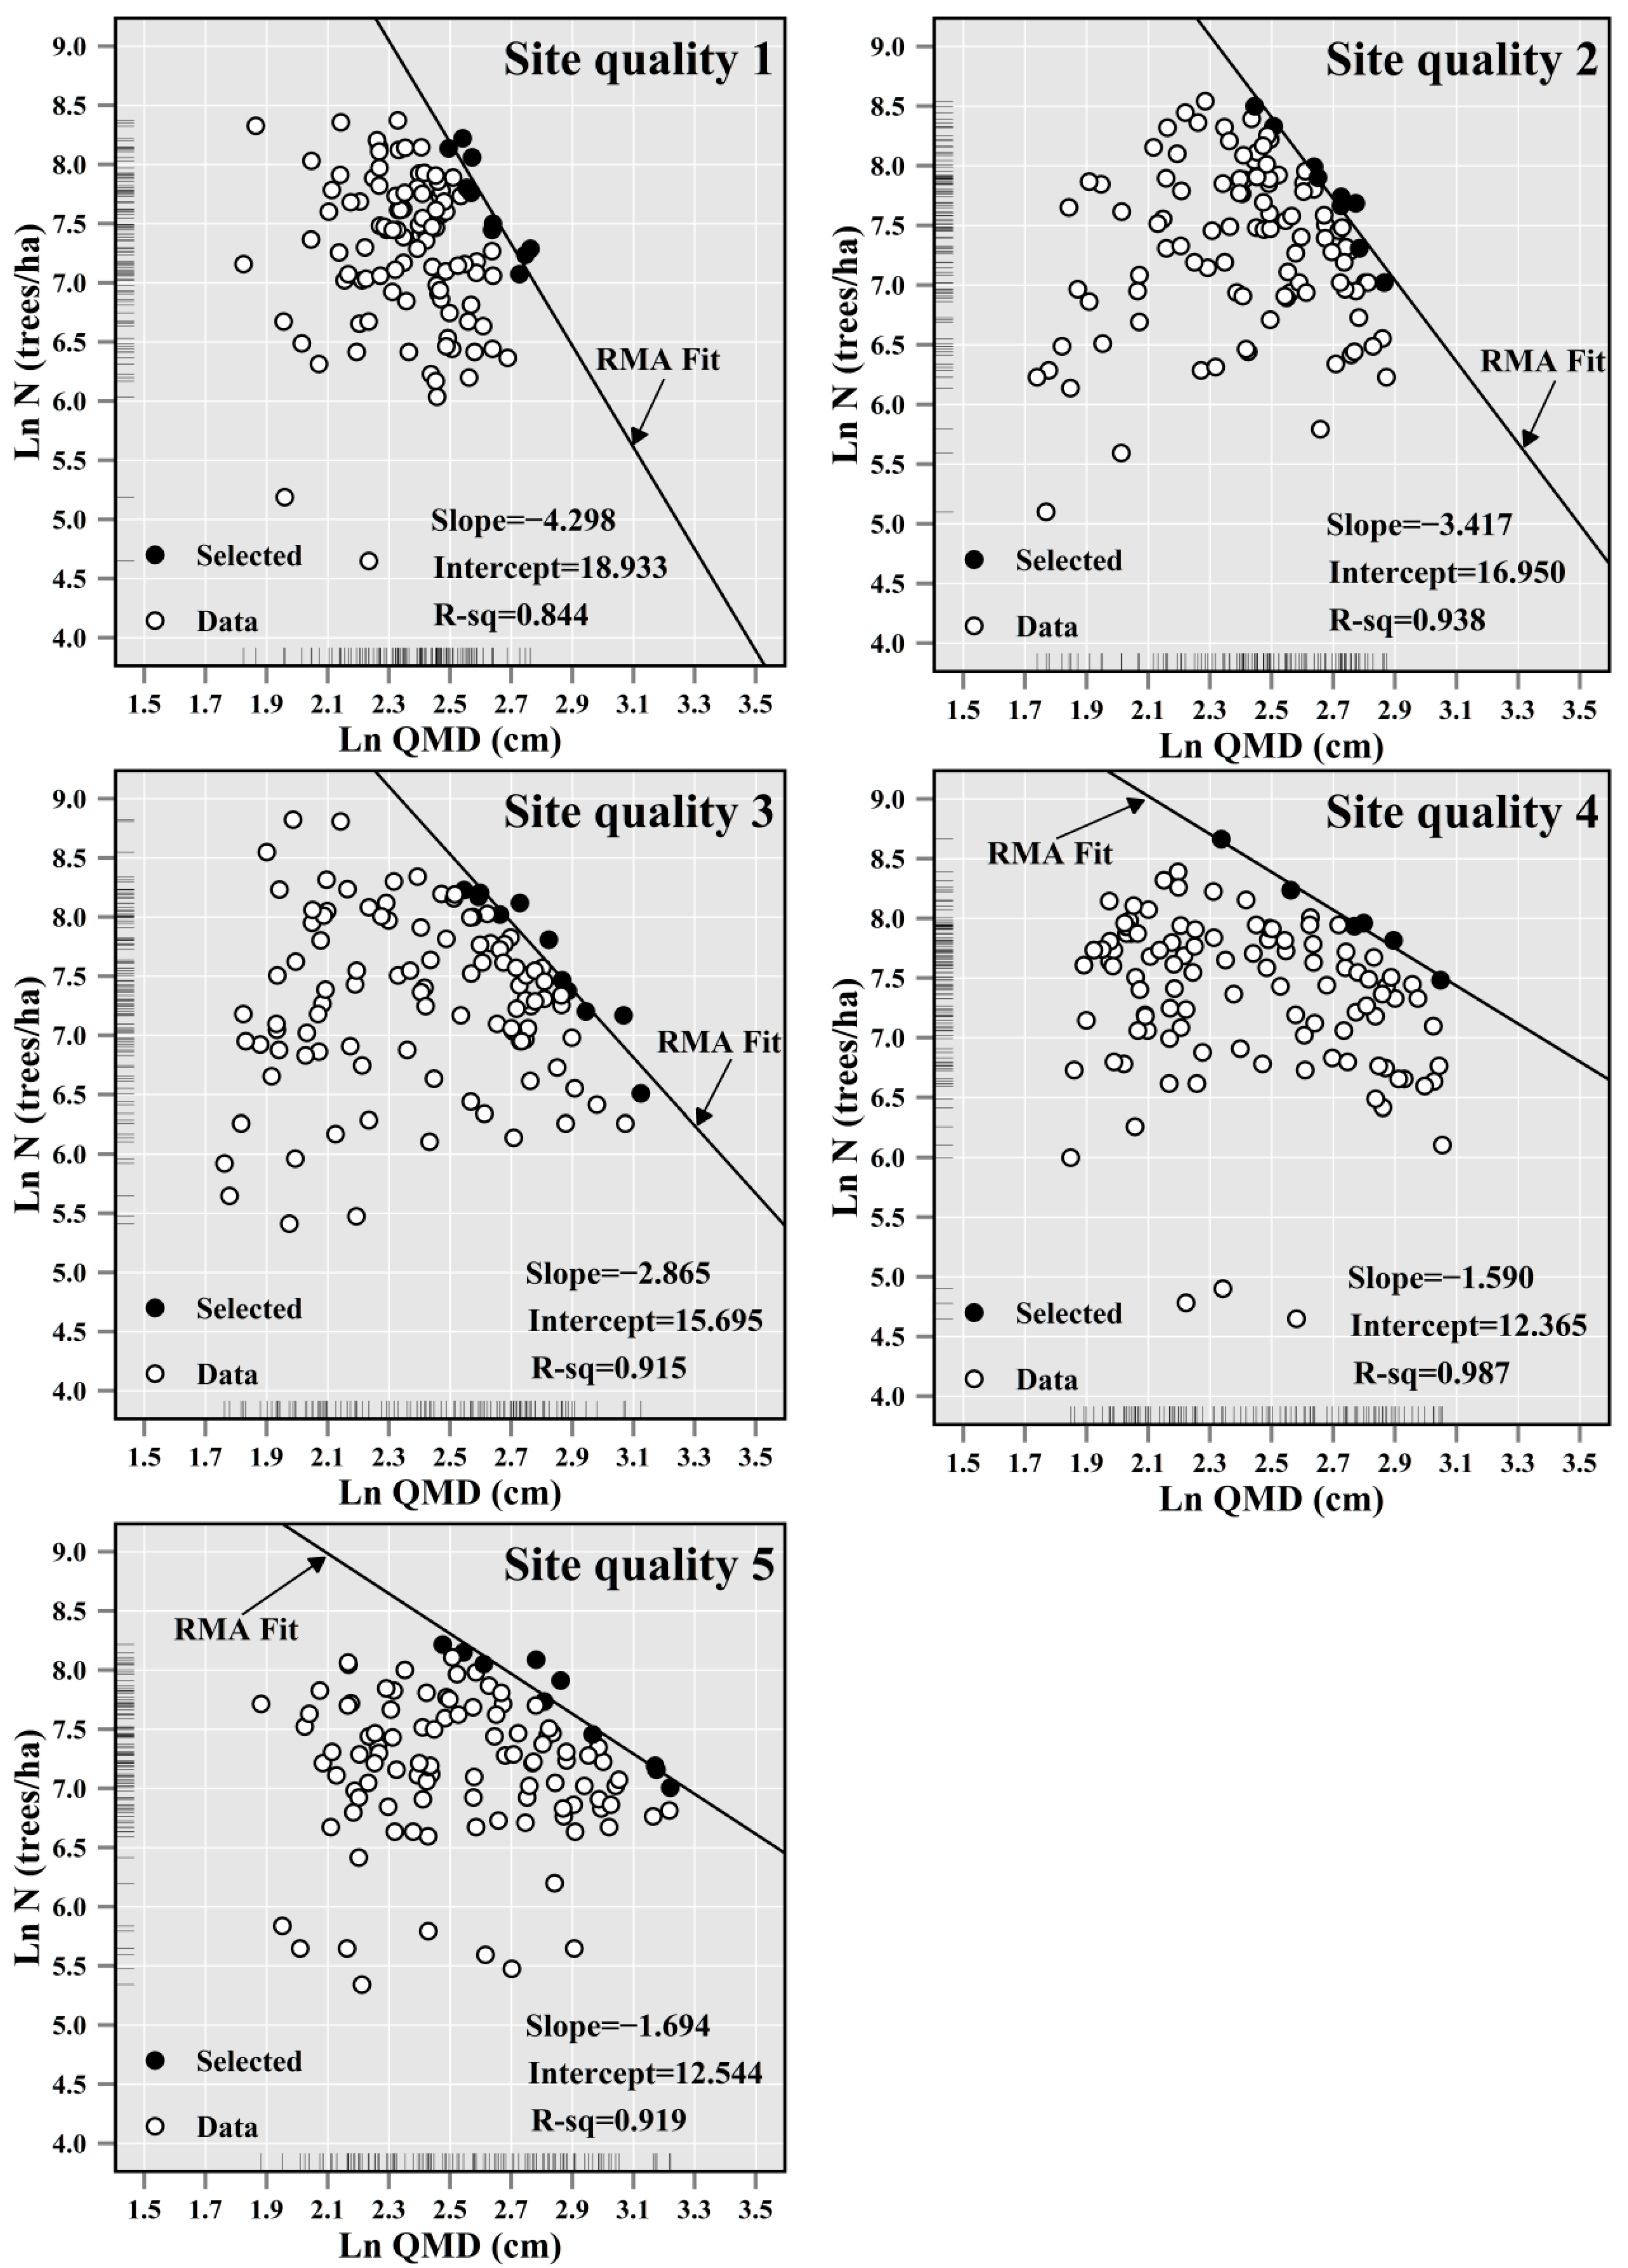
The selected fully stocked plots are indicated by the black points in Figure 2, with which the self-thinning lines were produced for these 5 forest site categories using RMA (Figure 2). The estimated slope coefficients and their corresponding 95% confidence intervals are provided in Table 2. The fitting statistics, i.e., RMSERMA and R2, demonstrated a promising precision of the produced self-thinning lines. For instance, R2 ranged from 0.844 to 0.987.
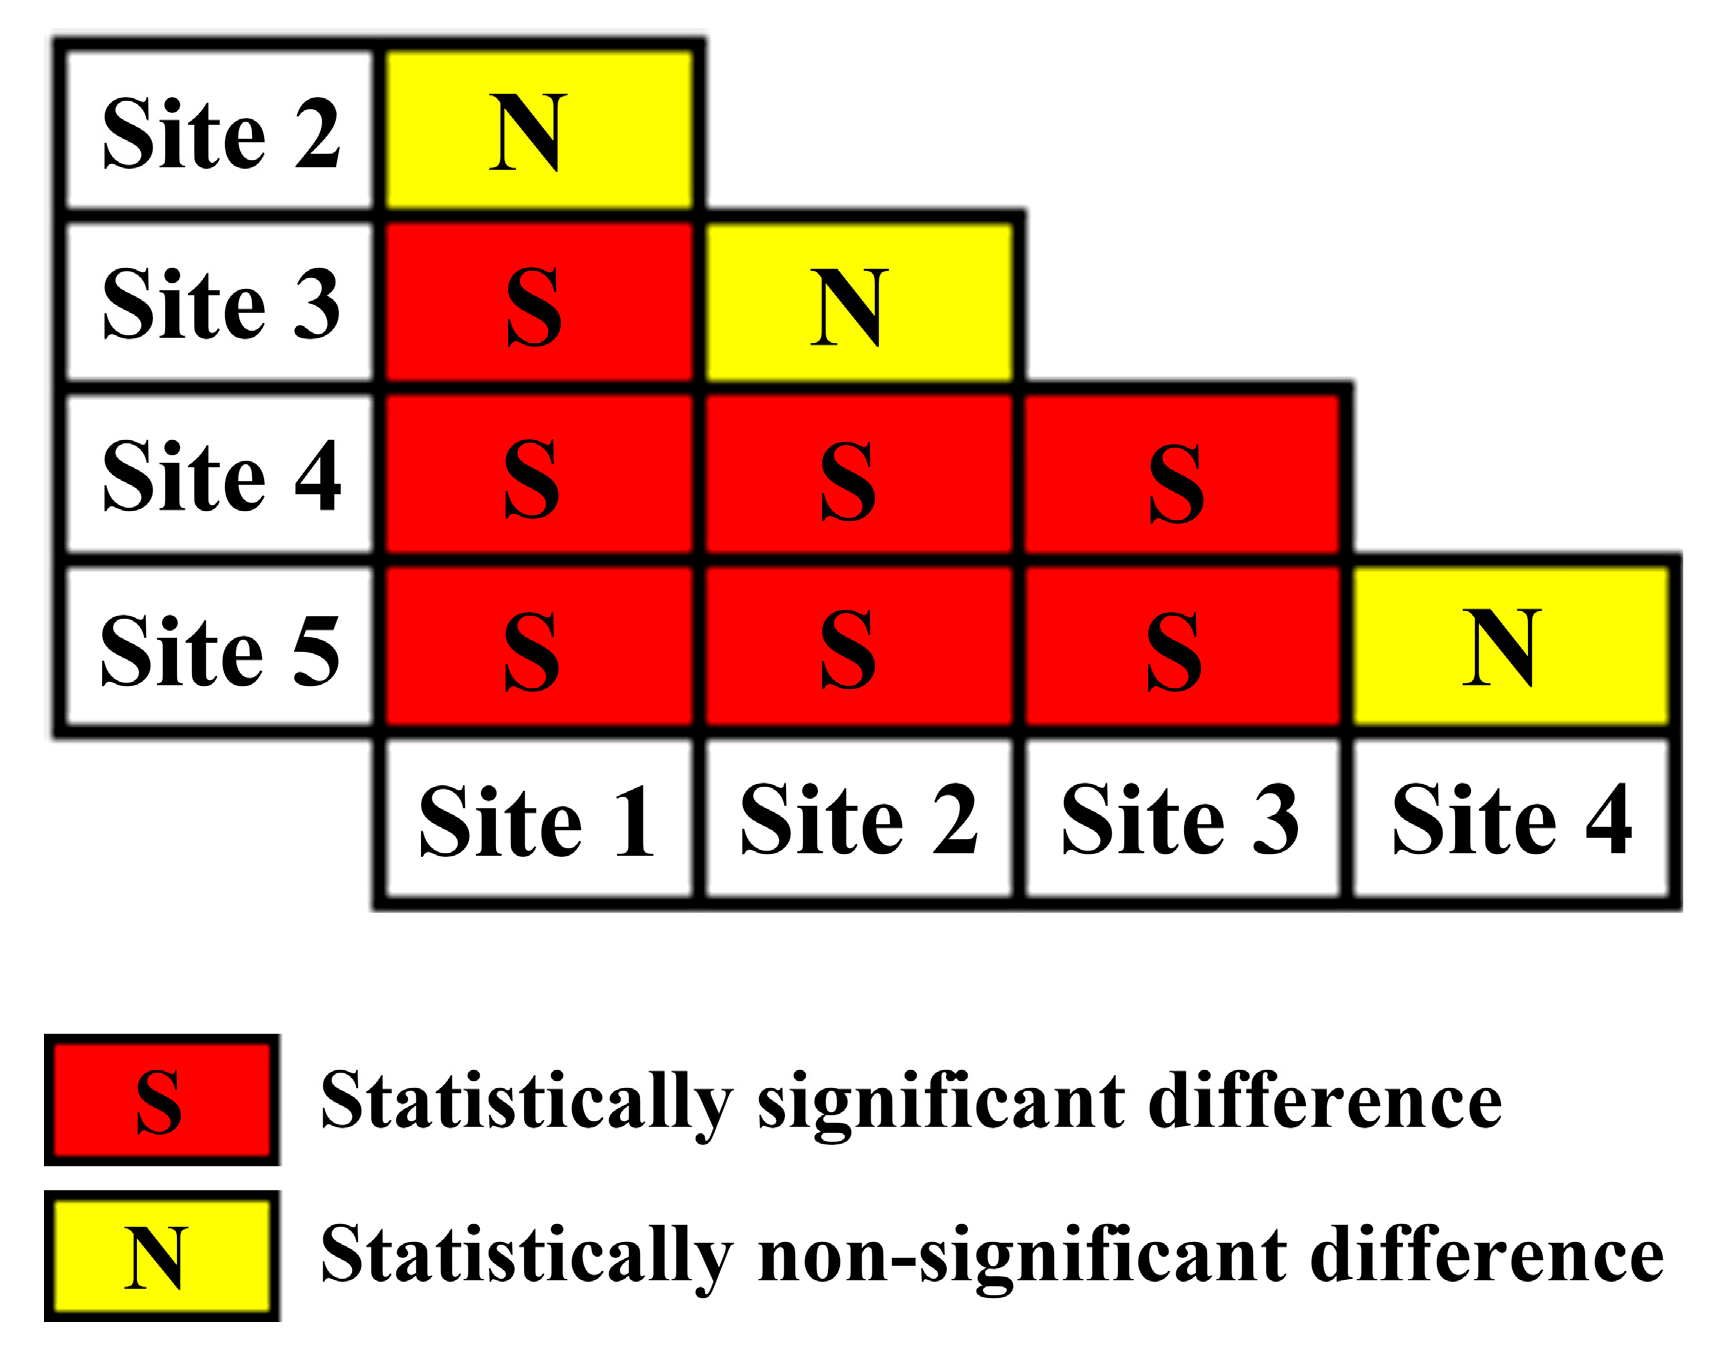
Based on the estimated slope coefficients and their corresponding intervals, we conclude that the slope coefficients can be significantly different amongst forest sites of different site quality represented by SI (Table 2, Figure 3). For instance, there were differences based on site quality as follows: site quality 1 was significantly different from site quality categories 3, 4 and 5. Site quality 2 significantly differed from site quality categories 4 and 5. Site 3 significantly differed from site quality categories 1, 4 and 5. Site quality 4 significantly differed from site quality categories 1, 2 and 3. Site quality 5 significantly differed from site quality categories 1, 2 and 3 (Figure 3). In addition, the absolute value of the slope generally exhibited an increasing trend with the decease of site quality.
4. Discussion
In the present study, we observed that the slope coefficient of the self-thinning line (Reineke function) varied significantly across different site quality categories and the slope coefficient could also differ from the empirical value of −1.605. The hypothesis proposed in the introduction section was found to be true and we therefore conclude that it is imperative to produce self-thinning lines specifically for different site quality categories.
A number of studies have previously examined the validity of a constant slope in relation to site quality. Most of these have argued that the regional difference in site quality could influence the slope of the self-thinning line, whereas the local differences might not. For instance, Comeau et al. [65] found a statistically significant difference in slope of the self-thinning lines between Great Britain and Western Canada for both Sitka spruce and Douglas fir. Cameron [66] documented that the slope of the self-thinning line for Douglas fir in British Columbia differed from those obtained by Drew and Flewelling [8] using data from the US. In contrast, different opinions were reported at the local level. For example, Comeau et al. [65] investigated the local difference in slope of the self-thinning line within Great Britain and Western Canada and found the local difference in site quality did not influence the slope of the self-thinning line. Bégin et al. [67] also reported a similar result for different ecological regions in Eastern Canada; they found a constant slope of the self-thinning line across their study area.
Pretzsch [34] attributed the significant regional difference in slope of the self-thinning line to the substantial differences in environments between different regions. Many authors have already documented that environmental conditions such as water availability [68,69], soil fertility [33,70,71], and abiotic stress [72] can significantly influence this relationship. For example, Chu et al. [72] reported that abiotic stress caused the slope of the self-thinning line to become steeper, but this effect was reduced by positive interactions among individuals.
The reason that no difference is observed at the local level might be because the local difference in environmental conditions is not sufficiently large to influence the relationship. However, our study interestingly indicated significantly different slopes across different site qualities (based on site index) in Fujian Province, Southern China, which suggested the local provincial difference might influence the relationship. A similar study was conducted by Zhang et al. [12], who fitted the self-thinning line based on 169 plots of ponderosa pine measured once across California, US. They found curvilinear trends in maximum stand density index with changing site index, which indicated that the slope of self-thinning line varies with site index. Weiskittel et al. [73] also reported that self-thinning is sensitive to site index at similar provincial levels, i.e., western Oregon, Washington, and Vancouver Island, and British Columbia. It is noteworthy that these studies employed site index as a measure of site quality. Site index is a comprehensive indicator of site quality, which can represent the underlying combined complex effects of environmental factors such as soil fertility and water availability. For instance, Chen et al. [74] explored the relationship between site index and environmental factors, i.e., climate surrogates (latitude, longitude, and elevation), biogeoclimatic zone, slope–aspect, actual soil moisture regime, and soil nutrient regime, and found that approximately 82% of the observed site index variation was explained by these environmental factors. Ercanli et al. [75] and Corona et al. [76] also reported that the site index could accurately represent the combined effects of ecological variables or environmental factors. In addition, many authors reported the relationships between site index and forest structural attributes [77], forest productivity [78], forest growth [79] and tree mortality [80,81], which could directly or indirectly influence the self-thinning line. Therefore, we concluded that the unique features of site index might account for the sensitivity of the slopes and intercept coefficients of the self-thinning line to the local differences.
Additionally, Figure 2 and Table 2 indicate that the lower the site quality, the steeper the slope of the self-thinning line (Reineke function). This indicates that the stand exhibited less self-thinning or more self-tolerance in areas with a higher site quality. A similar trend was also detected by Zeide [24], Zeide [27], DeBell et al. [82], Morris and Myerscough [70], Morris [83], Morris [84], Zhang et al. [12] and Zhang et al. [85], though they employed either a different equation (Yoda equation) or used a reverse coordinate axis. For instance, Zeide [24] employed Reineke equation and the same coordinate axis as the present study; DeBell et al. [82], Zhang et al. [12] and Zhang et al. [85] used Reineke equation but a reverse coordinate axis; Zeide [27], Morris and Myerscough [70], Morris [83], and Morris [84] employed Yoda equation instead of Reineke equation. Zhang et al. [12] reported that at a higher productive site, whether from higher soil fertility, favorable climate, or favorable silvicultural treatments, a stand could grow trees with greater diameters (or biomass) for a given stand density without self-thinning mortality due to the reduced self-thinning or greater self-tolerance.
Self-thinning is considered to be the ultimate expression of competition in dense stands of plants [15,33,86] and therefore the variation of self-thinning lines across site qualities can be accounted for by the net effect of aboveground and belowground competition [84]. The aboveground and belowground competition or the interaction between them can be inferred from evidence such as changes in the allocation to and the dimensions in space of the resource-acquiring organs of individual plants [70,84,87]. The mechanism underlying the variation of self-thinning lines across site qualities can be explained by the optimal partitioning theory [88]. In this theory, plants are able to allocate more biomass to the organ that can access the most limiting resource during growth. Plants determine their size-dependent root/shoot allocation strategy according to environmental conditions in order to maximize their efficiency of capturing the most limiting resource [88,89,90]. If light is the limiting factor, the plants should allocate more biomass to aboveground parts as they grow larger to maximize the uptake of light resources. Therefore, the aboveground biomass would increase at a faster rate than the belowground biomass as plants grow larger, leading to a reduced aboveground self-thinning relative to the belowground equivalent. This argument was supported by Zhang et al. [90]. In contrast, if nutrients are the limiting factor or self-thinning occurs in a harsh environment, plants should allocate more biomass to belowground parts as they grow larger to maximize the uptake of water and nutrient resources, which could lead to a greater aboveground self-thinning relative to the belowground equivalent. This argument was supported by Deng et al. [91] and was also consistent with our finding that with a decrease of site quality, the stand exhibited an increasing self-thinning trend.
The self-thinning line has been widely used to inform forest management. Forest site capacity is one of most important factors that can support plantation management decision making. Bi [92] defined site carrying capacity for even-aged plant populations as the point on the self-thinning line that corresponds to the minimum possible stand density that can maintain full site occupancy. There is a direct link between site carrying capacity and the self-thinning line for even-aged plant populations [92]. Additionally, the self-thinning line (Reineke equation) has been extensively employed to produce stand density diagram to guide plantation density management for various tree species throughout the world, e.g., Tectona grandis Linn. f. [93], Pinus pinaster Aiton [94], Pinus palustris Mill. [95], and Picea abies (Linn.) Karst. [96]. However, all of these studies assumed a constant slope of the self-thinning line with value of −1.605 (Reineke equation), which was shown to vary with site quality in the present study. As a result, we conclude that production of specific self-thinning lines for different site qualities is imperative for sound stand density management.
In the present study, because tree heights are not measured in the CNFI, we had to employ the local diameter–height equation to estimate tree height [54]. Although the equation was developed with large number of sample trees for the same region, using predicted rather than measured heights to derive SI might result in some errors. For instance, incorrect correlations between independent variables in the self-thinning line could be introduced. Furthermore, it may be problematic to assume that site index values that were calculated from allometric equations based on tree diameter, rather than direct measurements of tree height would be completely independent of the other independent variables in the regression models. In order to address these concerns, we performed Pearson correlation analysis and the results showed that there are neither correlation between SI and N (rN·SI = −0.031, n = 553, p = 0.461) nor correlation between SI and QMD (rQMD·SI = −0.017, n = 553, p = 0.701). However, we still strongly recommended that tree heights should be measured in future studies for site quality evaluation. In addition to site quality and species, the self-thinning line has been reported to be sensitive to other stand and site factors, e.g., stand origin [73], stand purity [73] and initial stand density [97]. Therefore, further studies investigating the combined effects of these stand and site factors on the self-thinning line are strongly encouraged.
Acknowledgments
This study was supported by the National Natural Science Foundation of China (31300532). We thank the Academy of Forest Inventory and Planning, State Forestry Administration, China, who provided data support during our research. We thank two anonymous reviewers for their constructive comments on the manuscript.
Author Contributions
All authors made significant contributions to the manuscript: Jinghui Meng conceived, designed and performed the experiments; Fangxing Ge analyzed the data and results; Weisheng Zeng contributed reagents/materials/analysis tools; Jinghui Meng and Fangxing Ge are the main authors who developed and revised the manuscript; and Wu Ma provided important suggestions for the framework of the paper.
Conflicts of Interest
The authors declare no conflict of interest.
References
- Cubbage, F.; Harou, P.; Sills, E. Policy instruments to enhance multi-functional forest management. For. Policy Econ. 2007, 9, 833–851. [Google Scholar] [CrossRef]
- Meng, J.; Lu, Y.; Zeng, J. Transformation of a degraded Pinus massoniana plantation into a mixed-species irregular forest: Impacts on stand structure and growth in southern China. Forests 2014, 5, 3199–3221. [Google Scholar] [CrossRef]
- Mantau, U. Recreational and Environmental Markets for Forest Enterprises: A New Approach towards Marketability of Public Goods; CABI Publishing: New York, NY, USA, 2001. [Google Scholar] [CrossRef]
- Kanninen, M. Plantation forests: Global perspectives. In Ecosystem Goods and Services from Plantation Forests; Bauhus, J., van der Meer, P., Kanninen, M., Eds.; Earthscan Press: London, UK, 2010; pp. 1–15. [Google Scholar] [CrossRef]
- Zeng, W.; Tomppo, E.; Healey, S.P.; Gadow, K.V. The national forest inventory in China: History-results-international context. For. Ecosyst. 2015, 2, 1–16. [Google Scholar] [CrossRef]
- Macdicken, K.; Jonsson, Ö.; Piña, L.; Maulo, S.; Adikari, Y.; Garzuglia, M.; Lindquist, E.; Reams, G.; D’Annunzio, R. Global Forest Resources Assessment 2015: How Are the World's Forests Changing? Food And Agriculture Organization of the United Nations: Rome, Italy, 2015; ISBN 9789251088210. [Google Scholar]
- State Forestry Administration. Report of Forest Resources in China (2009–2013); China Forestry Press: Beijing, China, 2014; ISBN 9787503874246.
- Drew, T.J.; Flewelling, J.W. Stand density management: An alternative approach and its application to Douglas-fir plantations. For. Sci. 1979, 25, 518–532. [Google Scholar]
- Bormann, B.; Gordon, J. Stand density effects in young red alder plantations: Productivity, photosynthate partitioning, and nitrogen fixation. Ecology 1984, 65, 394–402. [Google Scholar] [CrossRef]
- Castano-Santamaria, J.; Barrio-Anta, M.; Alvarez-Alvarez, P. Regional-scale stand density management diagrams for Pyrenean oak (Quercus pyrenaica Willd.) stands in north-west Spain. Iforest 2013, 6, 113–122. [Google Scholar] [CrossRef]
- Castedo-Dorado, F.; Crecente-Campo, F.; Álvarez-Álvarez, P.; Barrio-Anta, M. Development of a stand density management diagram for radiata pine stands including assessment of stand stability. Forestry 2009, 82, 1–16. [Google Scholar] [CrossRef]
- Zhang, J.; Oliver, W.W.; Powers, R.F. Reevaluating the self-thinning boundary line for ponderosa pine (Pinus ponderosa) forests. Can. J. For. Res. 2013, 43, 963–971. [Google Scholar] [CrossRef]
- Drew, T.J.; Flewelling, J.W. Some recent Japanese theories of yield-density relationships and their application to monterey pine plantations. For. Sci. 1977, 23, 517–534. [Google Scholar]
- White, J. Demographic factors in populations of plants. In Demography and Evolution in Plant Populations; Solbrig, O.T., Ed.; Blackwell Publishing: Oxford, UK, 1980; pp. 21–48. [Google Scholar] [CrossRef]
- R Yoda, K.; Kira, T.; Ogawa, H.; Hozumi, K. Self-thinning in overcrowded pure stands under cultivated and natural conditions. J. Biol. Osaka City Univ. 1963, 14, 107–129. [Google Scholar]
- Westoby, M. The self-thinning rule. Adv. Ecol. Res. 1984, 14, 167–225. [Google Scholar] [CrossRef]
- Zhang, L.; Bi, H.; Gove, J.H.; Heath, L.S. A comparison of alternative methods for estimating the self-thinning boundary line. Can. J. For. Res. 2005, 35, 1507–1514. [Google Scholar] [CrossRef]
- Vospernik, S.; Sterba, H. Do competition-density rule and self-thinning rule agree? Ann. For. Sci. 2015, 72, 379–390. [Google Scholar] [CrossRef]
- Reineke, L.H. Perfecting a stand-density index for even-aged forests. J. Agric. Res. 1933, 46, 627–638. [Google Scholar]
- Burkhart, H.E.; Tomé, M. Modeling Forest Trees and Stands; Springer Science & Business Media: Berlin, Germany, 2012. [Google Scholar] [CrossRef]
- White, J.; Harper, J.L. Correlated changes in plant size and number in plant populations. J. Ecol. 1970, 58, 467–485. [Google Scholar] [CrossRef]
- Gorham, E. Shoot height; weight and standing crop in relation to density of monospecific plant Stands. Nature 1979, 279, 148–150. [Google Scholar] [CrossRef]
- Jack, S.B.; Long, J.N. Linkages between silviculture and ecology: An analysis of density management diagrams. For. Ecol. Manag. 1996, 86, 205–220. [Google Scholar] [CrossRef]
- Zeide, B. Tolerance and self-tolerance of trees. For. Ecol. Manag. 1985, 13, 149–166. [Google Scholar] [CrossRef]
- Weller, D.E. A reevaluation of the −3/2 power rule of plant self-thinning. Ecol. Monogr. 1987, 57, 23–43. [Google Scholar] [CrossRef]
- Weller, D.E. Self-thinning exponent correlated with allometric measures of plant geometry. Ecology 1987, 68, 813–821. [Google Scholar] [CrossRef]
- Zeide, B. Analysis of the 3/2 power law of self-thinning. For. Sci. 1987, 33, 517–537. [Google Scholar]
- Lonsdale, W.M. The self-thinning rule: Dead or alive? Ecology 1990, 71, 550–579. [Google Scholar] [CrossRef]
- Weller, D.E. Will the real self-thinning rule please stand up?—A Reply to Osawa and Sugita. Ecology 1990, 71, 1204–1207. [Google Scholar] [CrossRef]
- Puettmann, K.J.; Hann, D.W.; Hibbs, D.E. Evaluation of the size-density relationships for pure red alder and Douglas-fir stands. For. Sci. 1993, 39, 7–27. [Google Scholar]
- Hamilton, N.S.; Matthew, C.; Lemaire, G. In defence of the −3/2 boundary rule: A re-evaluation of self-thinning concepts and status. Ann. Bot. 1995, 76, 569–577. [Google Scholar] [CrossRef]
- Zeide, B. Natural thinning and environmental change: An ecological process model. For. Ecol. Manag. 2001, 154, 165–177. [Google Scholar] [CrossRef]
- Morris, E.C. Self-thinning lines differ with fertility level. Ecol. Res. 2002, 17, 17–28. [Google Scholar] [CrossRef]
- Pretzsch, H. A unified law of spatial allometry for woody and herbaceous plants. Plant Biol. 2002, 4, 159–166. [Google Scholar] [CrossRef]
- Solomon, D.S.; Zhang, L. Maximum size–density relationships for mixed softwoods in the northeastern USA. For. Ecol. Manag. 2002, 155, 163–170. [Google Scholar] [CrossRef]
- Pretzsch, H. Stand density and growth of Norway spruce (Picea abies (L.) Karst.) and European beech (Fagus sylvatica L.): Evidence from long-term experimental plots. Eur. J. For. Res. 2005, 124, 193–205. [Google Scholar] [CrossRef]
- Pretzsch, H.; Biber, P. A re-evaluation of Reineke’s rule and stand density index. For. Sci. 2005, 51, 304–320. [Google Scholar]
- Pretzsch, H. Species-specific allometric scaling under self-thinning: Evidence from long-term plots in forest stands. Oecologia 2006, 146, 572–583. [Google Scholar] [CrossRef] [PubMed]
- Fu, L.H.; Zhang, J.G.; Duan, A.G.; Sun, H.G. Review of studies on maximum size-density rules. J. Plant Ecol. 2008, 32, 501–511. [Google Scholar] [CrossRef]
- Osawa, A. Inverse relationship of crown fractal dimension to self-thinning exponent of tree populations: A hypothesis. Can. J. For. Res. 1995, 25, 1608–1617. [Google Scholar] [CrossRef]
- Kikuzawa, K. Theoretical relationships between mean plant size; size distribution and self thinning under one-sided competition. Ann. Bot. 1999, 83, 11–18. [Google Scholar] [CrossRef]
- Li, B.L.; Wu, H.I.; Zou, G. Self-thinning rule: A causal interpretation from ecological field theory. Ecol. Model 2000, 132, 167–173. [Google Scholar] [CrossRef]
- Del Río, M.; Montero, G.; Bravo, F. Analysis of diameter–density relationships and self-thinning in non-thinned even-aged Scots pine stands. For. Ecol. Manag. 2001, 142, 79–87. [Google Scholar] [CrossRef]
- Yang, Y.; Titus, S.J. Maximum size–density relationship for constraining individual tree mortality functions. For. Ecol. Manag. 2002, 168, 259–273. [Google Scholar] [CrossRef]
- Skovsgaard, J.P.; Vanclay, J.K. Forest site productivity: A review of the evolution of dendrometric concepts for even-aged stands. Forestry 2008, 81, 13–31. [Google Scholar] [CrossRef]
- Weiskittel, A.R.; Hann, D.W.; Kershaw, J.A., Jr.; Vanclay, J.K. Forest Growth and Yield Modeling; John Wiley & Sons Incorporated: Hoboken, NJ, USA, 2011. [Google Scholar] [CrossRef]
- Lin, K.; Guo, Y.; Yu, X.; Zhang, W.; Chen, Y. The structure characters of undergrowth vegetation composition in the old-growth Chinese fir forest. J. Fujian Coll. For. 1999, 19, 124–128. [Google Scholar] [CrossRef]
- Chen, C.; Wang, S. Ecology of Mixed Plantation Forest; Science Press: Beijing, China, 2004; ISBN 9787030134745. [Google Scholar]
- Wang, Q.; Wang, S.; Huang, Y. Comparisons of litterfall, litter decomposition and nutrient return in a monoculture Cunninghamia lanceolata and a mixed stand in southern China. For. Ecol. Manag. 2008, 255, 1210–1218. [Google Scholar] [CrossRef]
- Wang, W.; Duan, Y.; Zhang, L.; Wang, B.; Li, X. Effects of different rotations on carbon sequestration in Chinese fir plantations. Chin. J. Plant Ecol. 2016, 40, 669–678. [Google Scholar] [CrossRef]
- Yu, X. The research of Chinese fir in China. J. Fujian Coll. For. 1988, 8, 203–220. [Google Scholar] [CrossRef]
- State Forestry Administration. Code of Forest Harvesting (LY/T 1646−2005); State Forestry Administration: Beijing, China, 2005.
- Duan, A.; Zhang, J. Modeling of dominant height growth and building of polymorphic site index equations of Chinese fir plantation. Sci. Silvae Sin. 2004, 40, 13–19. [Google Scholar] [CrossRef]
- Li, Z.; Meng, J. Selection of optimal height–diameter models for Cunninghamia Lanceolata in Fujian Province based on cross–validation analysis. J. Northwest For. Univ. 2016, 31, 92–96. [Google Scholar] [CrossRef]
- Sharma, M.; Amateis, R.L.; Burkhart, H.E. Top height definition and its effect on site index determination in thinned and unthinned loblolly pine plantations. For. Ecol. Manag. 2002, 168, 163–175. [Google Scholar] [CrossRef]
- Wilson, D.S.; Seymour, R.S.; Maguire, D.A. Density management diagram for northeastern red spruce and balsam fir forests. N. J. Appl. For. 1999, 16, 48–56. [Google Scholar]
- Inoue, A.; Miyake, M.; Nishizono, T. Allometric model of the Reineke equation for Japanese cypress (Chamaecyparis obtusa) and red pine (Pinus densiflora) stands. J. For. Res. 2004, 9, 319–324. [Google Scholar] [CrossRef]
- Bi, H.; Turvey, N.D. A method of selecting data points for fitting the maximum biomass–density line for stands undergoing self-thinning. Aust. J. Ecol. 1997, 22, 356–359. [Google Scholar] [CrossRef]
- Blackburn, T.M.; Lawton, J.H.; Perry, J.N. A method of estimating the slope of upper bounds of plots of body size and abundance in natural animal assemblages. Oikos 1992, 65, 107–112. [Google Scholar] [CrossRef]
- Leduc, D.J. A comparative analysis of the reduced major axis technique of fitting lines to bivariate data. Can. J. For. Res. 1987, 17, 654–659. [Google Scholar] [CrossRef]
- Bohonak, A.J. RMA: Software for Reduced Major Axis Regression, Version 1.17; San Diego State University: San Diego, CA, USA, 2004. Available online: http://www.bio.sdsu.edu/pub/andy/rma.html (accessed on 3 September 2004).
- Sokal, R.R.; Rohlf, F.J. Biometry, 3rd ed.; W.H. Freeman and Company: New York, NY, USA, 1995; ISBN 0716724111. [Google Scholar]
- R Core Team. R: A Language and Environment for Statistical Computing; R Foundation for Statistical Computing: Vienna, Austria, 2015; Available online: https://www.r-project.org/ (accessed on 20 June 2015).
- Legendre, P. lmodel2: Model II Regression. In R Package; Version 1.7-2; Legendre, P., Ed.; R Foundation for Statistical Computing: Vienna, Austria, 2014; Available online: http://CRAN.R-project.org/package=lmodel2 (accessed on 24 February 2014).
- Comeau, P.G.; White, M.; Kerr, G.; Hale, S.E. Maximum density–size relationships for Sitka spruce and coastal Douglas-fir in Britain and Canada. Forestry 2010. [Google Scholar] [CrossRef]
- Cameron, I.R. Evaluation of the density management diagram for coastal Douglas-fir. FRDA Rep. 1988, 426, 311–316. [Google Scholar]
- Bégin, E.; Bégin, J.; Bélanger, L.; Rivest, L.P.; Tremblay, S. Balsam fir self-thinning relationship and its constancy among different ecological regions. Can. J. For. Res. 2001, 31, 950–959. [Google Scholar] [CrossRef]
- Liu, J.; Wei, L.; Wang, C.M.; Wang, G.X.; Wei, X.P. Effect of water deficit on self-thinning line in spring wheat (Triticum aestivum L.) populations. J. Integr. Plant Biol. 2006, 48, 415–419. [Google Scholar] [CrossRef]
- Bai, G.Y.; Zhang, W.; Jia, X.; Wang, N.; Zhou, L.; Xu, S.; Wang, G. Variation in root: Shoot ratios induced the differences between above and belowground mass-density relationships along an aridity gradient. Acta. Oecol. 2010, 36, 393–395. [Google Scholar] [CrossRef]
- Morris, E.; Myerscough, P. Self-thinning and competition intensity over a gradient of nutrient availability. J. Ecol. 1991, 79, 903–923. [Google Scholar] [CrossRef]
- Dewar, R.C. A mechanistic analysis of self-thinning in terms of the carbon balance of trees. Ann. Bot. 1993, 71, 147–159. [Google Scholar] [CrossRef]
- Chu, C.J.; Weiner, J.; Maestre, F.T.; Wang, Y.S.; Morris, C.; Xiao, S.; Yuan, J.L.; Du, G.Z.; Wang, G. Effects of positive interactions; size symmetry of competition and abiotic stress on self-thinning in simulated plant populations. Ann. Bot. 2010. [Google Scholar] [CrossRef] [PubMed]
- Weiskittel, A.; Gould, P.; Temesgen, H. Sources of variation in the self-thinning boundary line for three species with varying levels of shade tolerance. For. Sci. 2009, 55, 84–93. [Google Scholar]
- Chen, H.Y.; Krestov, P.V.; Klinka, K. Trembling aspen site index in relation to environmental measures of site quality at two spatial scales. Can. J. For. Res. 2002, 32, 112–119. [Google Scholar] [CrossRef]
- Ercanli, I.; Gunlu, A.; Altun, L.; Zeki Baskent, E. Relationship between site index of oriental spruce [Picea orientalis (L.) Link] and ecological variables in Maçka, Turkey. Scand. J. For. Res. 2008, 23, 319–329. [Google Scholar] [CrossRef]
- Corona, P.; Scotti, R.; Tarchiani, N. Relationship between environmental factors and site index in Douglas-fir plantations in central Italy. For. Ecol. Manag. 1998, 110, 195–207. [Google Scholar] [CrossRef]
- Reinhardt, E.D. Influence of Site Quality on the Height-Diameter Relationship of Western Larch; Dissertation; University of Montana: Missoula, MT, USA, 1982. [Google Scholar]
- Waring, R.H.; Milner, K.S.; Jolly, W.M.; Phillips, L.; Mcwethy, D. Assessment of site index and forest growth capacity across the Pacific and Inland Northwest USA with a MODIS satellite-derived vegetation index. For. Ecol. Manag. 2006, 228, 285–291. [Google Scholar] [CrossRef]
- Sánchez-González, M.; del Río, M.; Canellas, I.; Montero, G. Distance independent tree diameter growth model for cork oak stands. For. Ecol. Manag. 2006, 225, 262–270. [Google Scholar] [CrossRef]
- Fosbroke, D.E.; Hicks, R.R., Jr. Tree Mortality Following Gypsy Moth Defoliation in Southwestern Pennsylvania; USDA Forest Service General Technical Report NC-North Central Forest Experiment Station: Newtown Square, PA, USA, 1989. [Google Scholar]
- Davidson, C.B.; Gottschalk, K.W.; Johnson, J.E. Tree mortality following defoliation by the European gypsy moth (Lymantria dispar L.) in the United States: A review. For. Sci. 1999, 45, 74–84. [Google Scholar]
- DeBell, D.S.; Harms, W.R.; Whitesell, C.D. Stockability: A major factor in productivity differences between Pinus taeda plantations in Hawaii and the southeastern United States. For. Sci. 1989, 35, 708–719. [Google Scholar]
- Morris, E. Self-thinning in Ocimum basilicum grown at three soil fertility levels with and without mycorrhizal inoculum. Proc. Linn. Soc. New South Wales 1995, 115, 89–107. [Google Scholar]
- Morris, E.C. Density-dependent mortality induced by low nutrient status of the substrate. Ann. Bot. 1999, 84, 95–107. [Google Scholar] [CrossRef]
- Zhang, J.; Ritchie, M.W.; Maguire, D.A.; Oliver, W.W. Thinning ponderosa pine (Pinus ponderosa) stands reduces mortality while maintaining stand productivity. Can. J. For. Res. 2013, 43, 311–320. [Google Scholar] [CrossRef]
- Watkinson, A. Density-dependence in single-species populations of plants. J. Theor. Biol. 1980, 83, 345–357. [Google Scholar] [CrossRef]
- Morris, E. Effect of localized placement of nutrients on root competition in self-thinning populations. Ann. Bot. 1996, 78, 353–364. [Google Scholar] [CrossRef]
- Bloom, A.J.; Chapin, F.S.; Mooney, H.A. Resource limitation in plants—An economic analogy. Ann. Rev. Ecol. Syst. 1985, 16, 363–392. [Google Scholar] [CrossRef]
- Weiner, J. Allocation, plasticity and allometry in plants. Perspect. Plant. Ecol. 2004, 6, 207–215. [Google Scholar] [CrossRef]
- Zhang, W.P.; Jia, X.; Bai, Y.Y.; Wang, G.X. The difference between above-and below-ground self-thinning lines in forest communities. Ecol. Res. 2011, 26, 819–825. [Google Scholar] [CrossRef]
- Deng, J.M.; Wang, G.X.; Morris, E.C.; Wei, X.P.; Li, D.X.; Chen, B.M.; Zhao, C.M.; Liu, J.; Wang, Y. Plant mass–density relationship along a moisture gradient in north-west China. J. Ecol. 2006, 94, 953–958. [Google Scholar] [CrossRef]
- Bi, H. Stochastic frontier analysis of a classic self-thinning experiment. Austral Ecol. 2004, 29, 408–417. [Google Scholar] [CrossRef]
- Kumar, B.M.; Long, J.N.; Kumar, P. A density management diagram for teak plantations of Kerala in peninsular India. For. Ecol. Manag. 1995, 74, 125–131. [Google Scholar] [CrossRef]
- Luis, J.F.S.; Fonseca, T.F. The allometric model in the stand density management of Pinus pinaster Ait. In Portugal. Ann. For. Sci. 2004, 61, 807–814. [Google Scholar] [CrossRef]
- Shaw, J.D.; Long, J.N. A density management diagram for longleaf pine stands with application to red-cockaded woodpecker habitat. South J. Appl. For. 2007, 31, 28–38. [Google Scholar]
- Vacchiano, S.G.; Derose, R.J.; Shaw, J.D.; Svoboda, M.; Motta, R. A density management diagram for Norway spruce in the temperate European montane region. Eur. J. For. Res. 2013, 132, 535–549. [Google Scholar] [CrossRef]
- Tang, S.; Meng, F.R.; Meng, C.H. The impact of initial stand density and site index on maximum stand density index and self-thinning index in a stand self-thinning model. For. Ecol. Manag. 1995, 75, 61–68. [Google Scholar] [CrossRef]
Figure 1.
Geographical distribution of the inventory sample plots within pure China fir stands.

Figure 2.
The maximum size-density line in the 5 different site quality categories (Site quality 1 < Site quality 2 < Site quality 3 < Site quality 4 < Site quality 5) classified based on site index.
Figure 2.
The maximum size-density line in the 5 different site quality categories (Site quality 1 < Site quality 2 < Site quality 3 < Site quality 4 < Site quality 5) classified based on site index.

Figure 3.
Significance test for slope difference of the maximum size-density line in the 5 different site quality categories classified based on site index.
Figure 3.
Significance test for slope difference of the maximum size-density line in the 5 different site quality categories classified based on site index.


Table 1.
Descriptive statistics of stand and site variables for pure China fir plantations (n = 553) 1.
Table 1.
Descriptive statistics of stand and site variables for pure China fir plantations (n = 553) 1.
| Variable | Mean | S.D. | Min. | Max. |
|---|---|---|---|---|
| Age (a) | 19 | 10 | 4 | 46 |
| Density (stems/ha) | 1801 | 1047 | 104 | 6791 |
| Quadratic mean diameter (cm) | 12.1 | 3.8 | 5.7 | 25.0 |
| Elevation (m) | 483 | 222 | 43 | 1350 |
| Soil depth (cm) | 93.8 | 18.8 | 9.0 | 160.0 |
| Humus depth (cm) | 9.5 | 5.2 | 0 | 42.0 |
| Litter depth (cm) | 3.8 | 5.5 | 0 | 30.0 |
| Slope (°) | 25.9 | 7.1 | 3.0 | 46.0 |
| Azimuth (°) | 194.8 | 104.4 | 45.0 | 360.0 |
| Site index (m) | 22.8 | 5.2 | 8.3 | 42.2 |
1 S.D.: standard deviation, Min.: minimum, Max.: maximum.
Table 2.
Comparison of the slope coefficients of the maximum size-density line between the 5 different site quality categories (based on site index) and the relevant fitting statistics.
Table 2.
Comparison of the slope coefficients of the maximum size-density line between the 5 different site quality categories (based on site index) and the relevant fitting statistics.
| Site Quality Categories (SI Interval) | No. of Plots (Selected) 1 | Slope (β) | Standard Error | Confidence Interval 2 | RMSE | R2 |
|---|---|---|---|---|---|---|
| 1 (8.32, 18.51) | 110 (10) | −4.298 | 0.600 | (−5.898, −3.132) | 0.154 | 0.844 |
| 2 (18.53, 21.30) | 110 (9) | −3.417 | 0.320 | (−4.257, −2.743) | 0.109 | 0.938 |
| 3 (21.35, 23.48) | 111 (11) | −2.865 | 0.279 | (−3.564, −2.304) | 0.157 | 0.915 |
| 4 (23.49, 26.24) | 111 (6) | −1.590 | 0.090 | (−1.860, −1.360) | 0.041 | 0.987 |
| 5 (26.27, 42.16) | 111 (10) | −1.694 | 0.171 | (−2.132, −1.346) | 0.125 | 0.919 |
1 The number of data plots (the number of plots selected as the most fully-stocked plots); 2 The lower and upper limits of the 95% confidence interval of the slope estimated by RMA.
© 2017 by the authors. Licensee MDPI, Basel, Switzerland. This article is an open access article distributed under the terms and conditions of the Creative Commons Attribution (CC BY) license (http://creativecommons.org/licenses/by/4.0/).
Share and Cite
MDPI and ACS Style
Ge, F.; Zeng, W.; Ma, W.; Meng, J. Does the Slope of the Self-thinning Line Remain a Constant Value across Different Site Qualities?—An Implication for Plantation Density Management. Forests 2017, 8, 355. https://doi.org/10.3390/f8100355
AMA Style
Ge F, Zeng W, Ma W, Meng J. Does the Slope of the Self-thinning Line Remain a Constant Value across Different Site Qualities?—An Implication for Plantation Density Management. Forests. 2017; 8(10):355. https://doi.org/10.3390/f8100355
Chicago/Turabian StyleGe, Fangxing, Weisheng Zeng, Wu Ma, and Jinghui Meng. 2017. "Does the Slope of the Self-thinning Line Remain a Constant Value across Different Site Qualities?—An Implication for Plantation Density Management" Forests 8, no. 10: 355. https://doi.org/10.3390/f8100355
Note that from the first issue of 2016, this journal uses article numbers instead of page numbers. See further details here.