Assessing Alternative Silvicultural Prescriptions for Mid-Rotation, Unthinned, Spruce-Fir Stands in Maine


1
Department of Forestry and Environmental Conservation, Clemson University, 261 Lehotsky Hall, Clemson, SC 29634, USA
2
Paul Smith’s College, Department of Forestry, 7833 New York 30, Paul Smiths, NY 12970, USA
3
School of Forest Resources, University of Maine, 5755 Nutting Hall, Orono, ME 04469, USA
*
Author to whom correspondence should be addressed.
Forests 2017, 8(10), 370; https://doi.org/10.3390/f8100370
Submission received: 20 August 2017
/
Revised: 22 September 2017
/
Accepted: 26 September 2017
/
Published: 28 September 2017
Abstract
:Determining the optimal timing and type of entry in mid-rotation, unthinned stands can be complicated by a variety of economic and biological factors. In this analysis, long-term data from the Commercial Thinning Research Network was used to project spruce-fir (Picea spp.—Abies balsamea (L.) Mill.) stand growth on six different sites across Maine following six alternative thinning treatments (33% and 50% relative density removal paired with low, crown, and dominant thinning methods). Results showed that the low-thinning treatment performed best in terms of maximum net present value, stand age at time of maximum net present value, and average merchantable stem size. Although the low-thinning resulted in a 10% mean reduction in maximum net present value when compared to the control, the average merchantable stem size more than doubled. Overall, results of this analysis indicate that it may be financially responsible to commercially thin these stands using a low-thinning method and a light removal intensity, as the average merchantable stems size was increased and a mid-rotation financial return provided.
1. Introduction
Maine is a heavily forested state with 82% of the total land area in forest cover [1]. Ninety-three percent of these forests are privately owned, including family forest and industrial ownerships [1]. The industrial ownership of this productive forest land has changed significantly between 1994 and 2000, with 80% of the land base changing hands [2] from traditional forest industries to Timber Investment Management Organizations (TIMOs) and Real Estate Investment Trusts (REITs). New owners also faced the challenge of managing vast areas of forestland that did not receive intermediate forest management treatments (e.g., pre-commercial thinning (PCT), commercial thinning (CT)). The combination of the legacy of extensive commercial and salvage clearcuts following the spruce budworm (Choristoneura fumiferana) outbreak in the 1970s and 1980s [3,4] and the ownership changes resulted in an abundance of forestland of similar age that would benefit from intermediate treatments, but did not receive any.
PCT and CT are often used to manage young conifer forests in North America and Europe [5,6,7]. PCT is a widely accepted tool for density management [8,9], control of species composition [10], accelerated growth [11], and reduction in time to merchantability [12]. CT is often prescribed as a treatment years after PCT to maintain or increase residual tree growth [13,14] and decrease mortality [15,16,17]. Clune [13] showed that spruce-fir (Picea spp.—Abies balsamea (L.) Mill.) stand stability and growth in Maine was positively influenced by early and light CT. Hiesl et al. [18] indicated that there may be a margin of 10 years following first merchantability of a stand in which a CT will result in no difference in net present value (NPV).
The spruce-fir forest-type is of high relative importance to Maine, as it comprises of 2.3 million ha or approximately 33% of the state’s forest land and can be found throughout the region [1]. As noted by Seymour [3], Zon [19], and Murphy [20], both species have been described as late-successional, shallow rooted, and very shade tolerant. Both species also occupy a variety of sites and grow from sea level up to an elevation of 1700 m for balsam fir and 1400 m for red spruce (Picea rubens Sarg.) [21]. Balsam fir produces an abundance of seeds at as early as 15 years of age [21], however, the lifespan of this species is often limited to 70 years due to its susceptibility to various stem rot fungi [3,21]. In addition, balsam fir is also susceptible to several insects, with the spruce budworm and woolly aphid (Adelges piceae) being the most important ones [21]. A severe spruce budworm outbreak occurs every 30 to 60 years [4]. The last outbreak occurred in the 1970s and 1980s and defoliated millions of ha of spruce-fir forest in Maine [4,22]. Currently there is a spruce budworm outbreak in Quebec, and Maine is experiencing the early stages of a new outbreak [22]. Red spruce produces seeds at as early as 15 years of age, however, good seed crops are infrequent [21]. The species is reasonably resistant to decay [3,21], and although there are several insect enemies, including the spruce budworm [21], red spruce can live for more than 300 years [23,24]. An important silvicultural property of red spruce is its capability to stay suppressed for many decades but still respond well to a subsequent release [3]. Due to the tendency of balsam fir to stem-rot and the shorter life-span, thinning treatments generally focus on removing mature balsam fir over red spruce [3]. However, the long-term influence of both PCT and CT remain relatively unknown for this forest type.
In Maine, the Commercial Thinning Research Network (CTRN) was created in 2000 [25,26] to study the effects of PCT and CT on stand conditions in spruce-fir forests that were commonly inherited by forest managers due to ownership changes and forestland acquisitions. One aspect of the study was to investigate the effect of CT with two different removal intensities (33% and 50% relative density removal) and three different thinning methods (low, crown, dominant) on stand growth. Clune [13] analyzed data following 10 years since CT and found that low and crown thinning increased piece size and produced larger and more valuable trees within a few years of CT. Low and crown thinning with a high removal intensity (50% relative density removal) resulted in the highest value per unit of volume [13]. However, Clune [13] did not provide a projection over the full rotation of the stand to determine the differences in net present value for these different treatments to assess whether or not it is economically responsible to prescribe a CT to these types of stands. Bataineh et al. [27] projected stand growth in a spruce-fir forest in Maine to investigate economic differences between herbicide and PCT treatments compared to untreated plots. They found that PCT returned the highest NPV gain, however, their projection did not include further intermediate treatments such as CT. Consequently, there is still high uncertainty about how to manage mid-rotation stands without a prior PCT.
The goal of this analysis was to use existing stand information from the CTRN to understand and forecast stand development over the full length of a rotation to answer the following questions: (1) what are the differences in NPV across the contrasting treatments; (2) are there changes in rotation length in reaching maximum NPV; and (3) what are the differences in average merchantable piece size across all treatments.
2. Materials and Methods
2.1. Study Sites
For this study, data from six sites that are part of the University of Maine’s Commercial Thinning Research Network (CTRN) were used (Figure 1). All sites had been naturally regenerated following a stand-replacing disturbance, had never been pre-commercially thinned [28], and had a relative density of greater than 0.50 according to the stand density diagram of Wilson et al. [26,29]. All study sites were within the Acadian forest, with red spruce and balsam fir being the most dominant tree species. Before CT, four of the six sites were red spruce dominated, with a red spruce to balsam fir ratio between 1 and 444, whereas the other two sites were balsam fir dominated, with a red spruce to balsam fir ratio of 0 to 1. Post treatment, the red spruce to balsam fir ratio for red spruce dominated sites ranged from 2 to 146, and from 0 to 1 for balsam fir dominated sites. More detailed information about the CTRN and the study area can be found in Wagner and Seymour [25], Wagner et al. [26], and Hiesl et al. [18].
Each site consists of seven plots with a 3 × 2 factorial design of varying thinning methods (low, crown, dominant) and density reduction levels (33% and 50% reduction in relative density) as well as an untreated control (Table 1 [26]). Plots were randomly assigned, with a few exceptions, as noted in Wagner et al. [26]. For the low thinning treatment, trees that were foremost overtopped and intermediate were removed; for the dominant thinning, foremost dominant trees were removed. For the crown thinning, crop trees were selected and competing trees surrounding these trees were removed. Selected crop trees consisted of balsam fir and red spruce. For a full description of the thinning methods, see Wagner et al. [26]. Establishment of CTRN and the individual plots was started in 2000 and plot installation was finished in 2001 [25,26]. Rectangular permanent plots, 809 m2 in size, were fully inventoried on an annual or semi-annual basis between 2001 and 2012. Diameter at breast height (DBH) and total tree height were recorded for each tree with a DBH > 5 cm. Thinning prescriptions were developed based on pre-treatment data from each plot, and individual trees were marked for removal [26]. Plots were thinned between 2000 and 2002 using standard machinery, and each treated plot has a forwarder trail running through its center (Table 2).
2.2. Growth and Yield
Growth and yield for each plot was projected from plot measurements taken in 2011 (Table 2). Data from 2011 was used, as this was the last time all six sites were completely inventoried within the same year. Plot data was projected forward for 35 years using the Acadian variant of the Forest Vegetation Simulator (FVS-ACD) [31,32]. This variant projects the growth and mortality of individual trees on an annual basis using species-specific equations developed for the Acadian region. This variant also includes growth and mortality modifiers for balsam fir and red spruce based on information from the last CT [33,34]. Since the average stand age was 53 years, a projection period of 35 years was deemed to be adequate to cover a reasonable rotation length for spruce-fir stands. We further used observed plot data measured in 2000, 2001, 2002, 2007, and 2011 to calculate NPVs for all treatments.
2.3. Product Merchandising
Similar to the procedure outlined in Hiesl et al. [18], an R-based [35] product merchandizer developed by Hutchinson [36] was used. Sawlog and pulpwood volumes were estimated based on regional taper equations using species- and product-specific specifications [37,38]. Biomass and studwood volume were not estimated as part of the merchandizer. Minimum top diameter for pulpwood for all relevant species was 10.2 cm. For sawlogs, the minimum top diameter for hardwood and softwood species was 24.4 cm and 19.3 cm, respectively.
2.4. Harvest Costs and Revenues
To calculate the maximum NPV from each plot, including both the CT and final harvest, two different methods were used based on data availability. At the time of CT, volume removed in each product class was recorded, but harvest costs were not; the contribution to overall NPV from the CT was calculated using product-specific stumpage values. For the potential final harvest, modeled volumes at each possible final harvest year were used in conjunction with harvest costs and mill-delivered prices to calculate landowner returns and contribution to NPV.
At the time of CT, products harvested from all sites except Rump Road (RR) were measured and recorded in a database [26]. Due to similar stand and site characteristics, the product volumes of RR were estimated using the volume recorded for the Saint Aurelie (SA) site. CT revenue were estimated based on average stumpage values for pulpwood, studwood, and sawlogs in the respective years where sites were thinned (Table 3).
To estimate final harvest costs, the tree list produced by the growth and yield projection was expanded to represent a one-hectare harvest block. The growth and yield projection produced such a tree list on an annual basis for 35 years starting in 2011. Each year’s projection was based on the previous year’s tree list as a starting point. Potential final harvest costs were estimated for every year following CT by multiplying the harvest time consumption in each year by the machine rates for the various equipment utilized. There was no pre-set definition of the final stand in terms of age.
Harvest time consumption, and subsequently harvest costs, for a cut-to-length (CTL) harvesting system were estimated using regional cycle time equations for harvesting equipment [42,43]. The CTL system consisted of a harvester (US$160/Productive Machine Hour (PMH)) and forwarder (US$110/PMH). Machine rates represent averages estimated as part of an early commercial thinning study in Maine [44] and were also used in Hiesl et al. [18]. The time consumption for a loader-crane (US$40/PMH) to load one truck was assumed to be 25 min. For forwarding, we used an average distance of 300 m and a payload of 10 m3.
The cost of delivering roundwood to the mill was added to the final harvest cost with an assumed round-trip distance of 160 km at a cost of US$1.67 km−1. This distance was chosen based on the authors’ experience with trucking in Maine, and, according to a recent trucking survey by Koirala et al. [45], is just short of the average trucking distance. Payload for one truck was assumed to be 28 m3. Revenue for each plot was estimated by multiplying the product estimation from each plot in each year by the different mill-delivered product values [18] for pulpwood (US$42 m−3) and sawlogs (US$72 m−3). We did not adjust product values for possible changes in the future.
NPV was estimated by discounting or compounding all cash flows, positive or negative, to a base year (=2002). In this study there were two cash flows: CT landowner revenue, and final harvest cost and gross revenue (Equation (1)). Other management costs of the stand such as reforestation (all stands were naturally regenerated) and future values past the final harvest were not included.
CTLandownerRev is the net revenue from CT based on stumpage rates shown in Table 3. FHgross is the gross revenue from final harvest, and HCFH is the harvest cost at final harvest. The years of CT and final harvest are described by t1 and t2, respectively, as the time since the base year. The base year, t, is 2002. We used a discount rate, i, of 4% based on the adopted recommendation of the United States Department of Agriculture (USDA) Forest Service for long-term resource planning [46]. NPV was calculated from the growth and yield projections for every possible final harvest year and treatment.
2.5. Analytical Approach
Three linear mixed-effect analysis of variance (ANOVA) models were developed to assess (1) the impact of treatment on maximum NPV; (2) the timing of maximum NPV; and (3) the impact of treatment on average stem size. Random effect for plots nested within site were estimated to account for variation from factors that have not been identified, but may have had an influence on the dependent variables. Pairwise comparisons using Tukey’s method of multiple comparisons at a significance level of 0.05 were performed among thinning treatments and controls. A sensitivity analysis of NPV to interest rate was performed using six different interest rates (1% to 6%). NPV was calculated for every year with each of the six interest rates.
3. Results
Data from the projections showed that control plots retained the highest merchantable volume (Figure 2a), ranging from 253 m3 ha−1 in 2002 to 947 m3 ha−1 in 2046. The next highest standing merchantable volume was present in the light low thinning treatment (Low33), with volumes ranging from 176 to 682 m3 ha−1. The two crown thinnings (Crown33, Crown50), light dominant thinning (Dom33), and heavy low thinning (Low50) were similar in standing merchantable volume, ranging from 110 to 497 m3 ha−1. The heavy dominant thinning (Dom50) resulted in the lowest merchantable volume, ranging from 64 to 326 m3 ha−1. The species composition of red spruce and balsam fir for the projected period of time stayed the same for each site and plot.
Mean annual increment (MAI) was the highest for control plots throughout the projection period, ranging from 4.5 to 9.6 m3 ha−1 year−1 (Figure 2b). The trend for the other treatments was the same as for merchantable volume, with the light low thinning (Low33) having the second highest MAI, the heavy dominant thinning (Dom50) having the lowest MAI, and the two crown thinnings (Crown33, Crown50), light dominant thinning (Dom33), and heavy low thinning (Low50) being close together in the middle. Average merchantable stem size was the highest for the heavy low thinning (Low50), ranging from 0.19 to 0.78 m3 (Figure 2c). The light low thinning (Low33) had the next highest average merchantable stem size until approximately 25 years after CT, at which point the heavy crown thinning (Crown50) had a slightly larger average stem size. All other treatments, including the control, were 37% to 68% below the largest stem sizes projected for the heavy low thinning (Low50).
NPVs for the different treatments were extremely variable and ranged from a low of US$412 ha−1 for the heavy dominant thinning (Dom50) to a maximum of US$7,179 ha−1 for the control (Figure 2d). Throughout the measured and projected timeframe, the control had the highest NPV, while the light low thinning (Low33) had the next closest NPV, with an 8% smaller maximum NPV than the control (Figure 2e). All other treatments had a maximum NPV that was at least 24% smaller than the control. Across all recorded and projected years, no treatment reached a NPV as high as the control (Figure 2e).
3.1. The Effect of Treatment on Maximum NPV
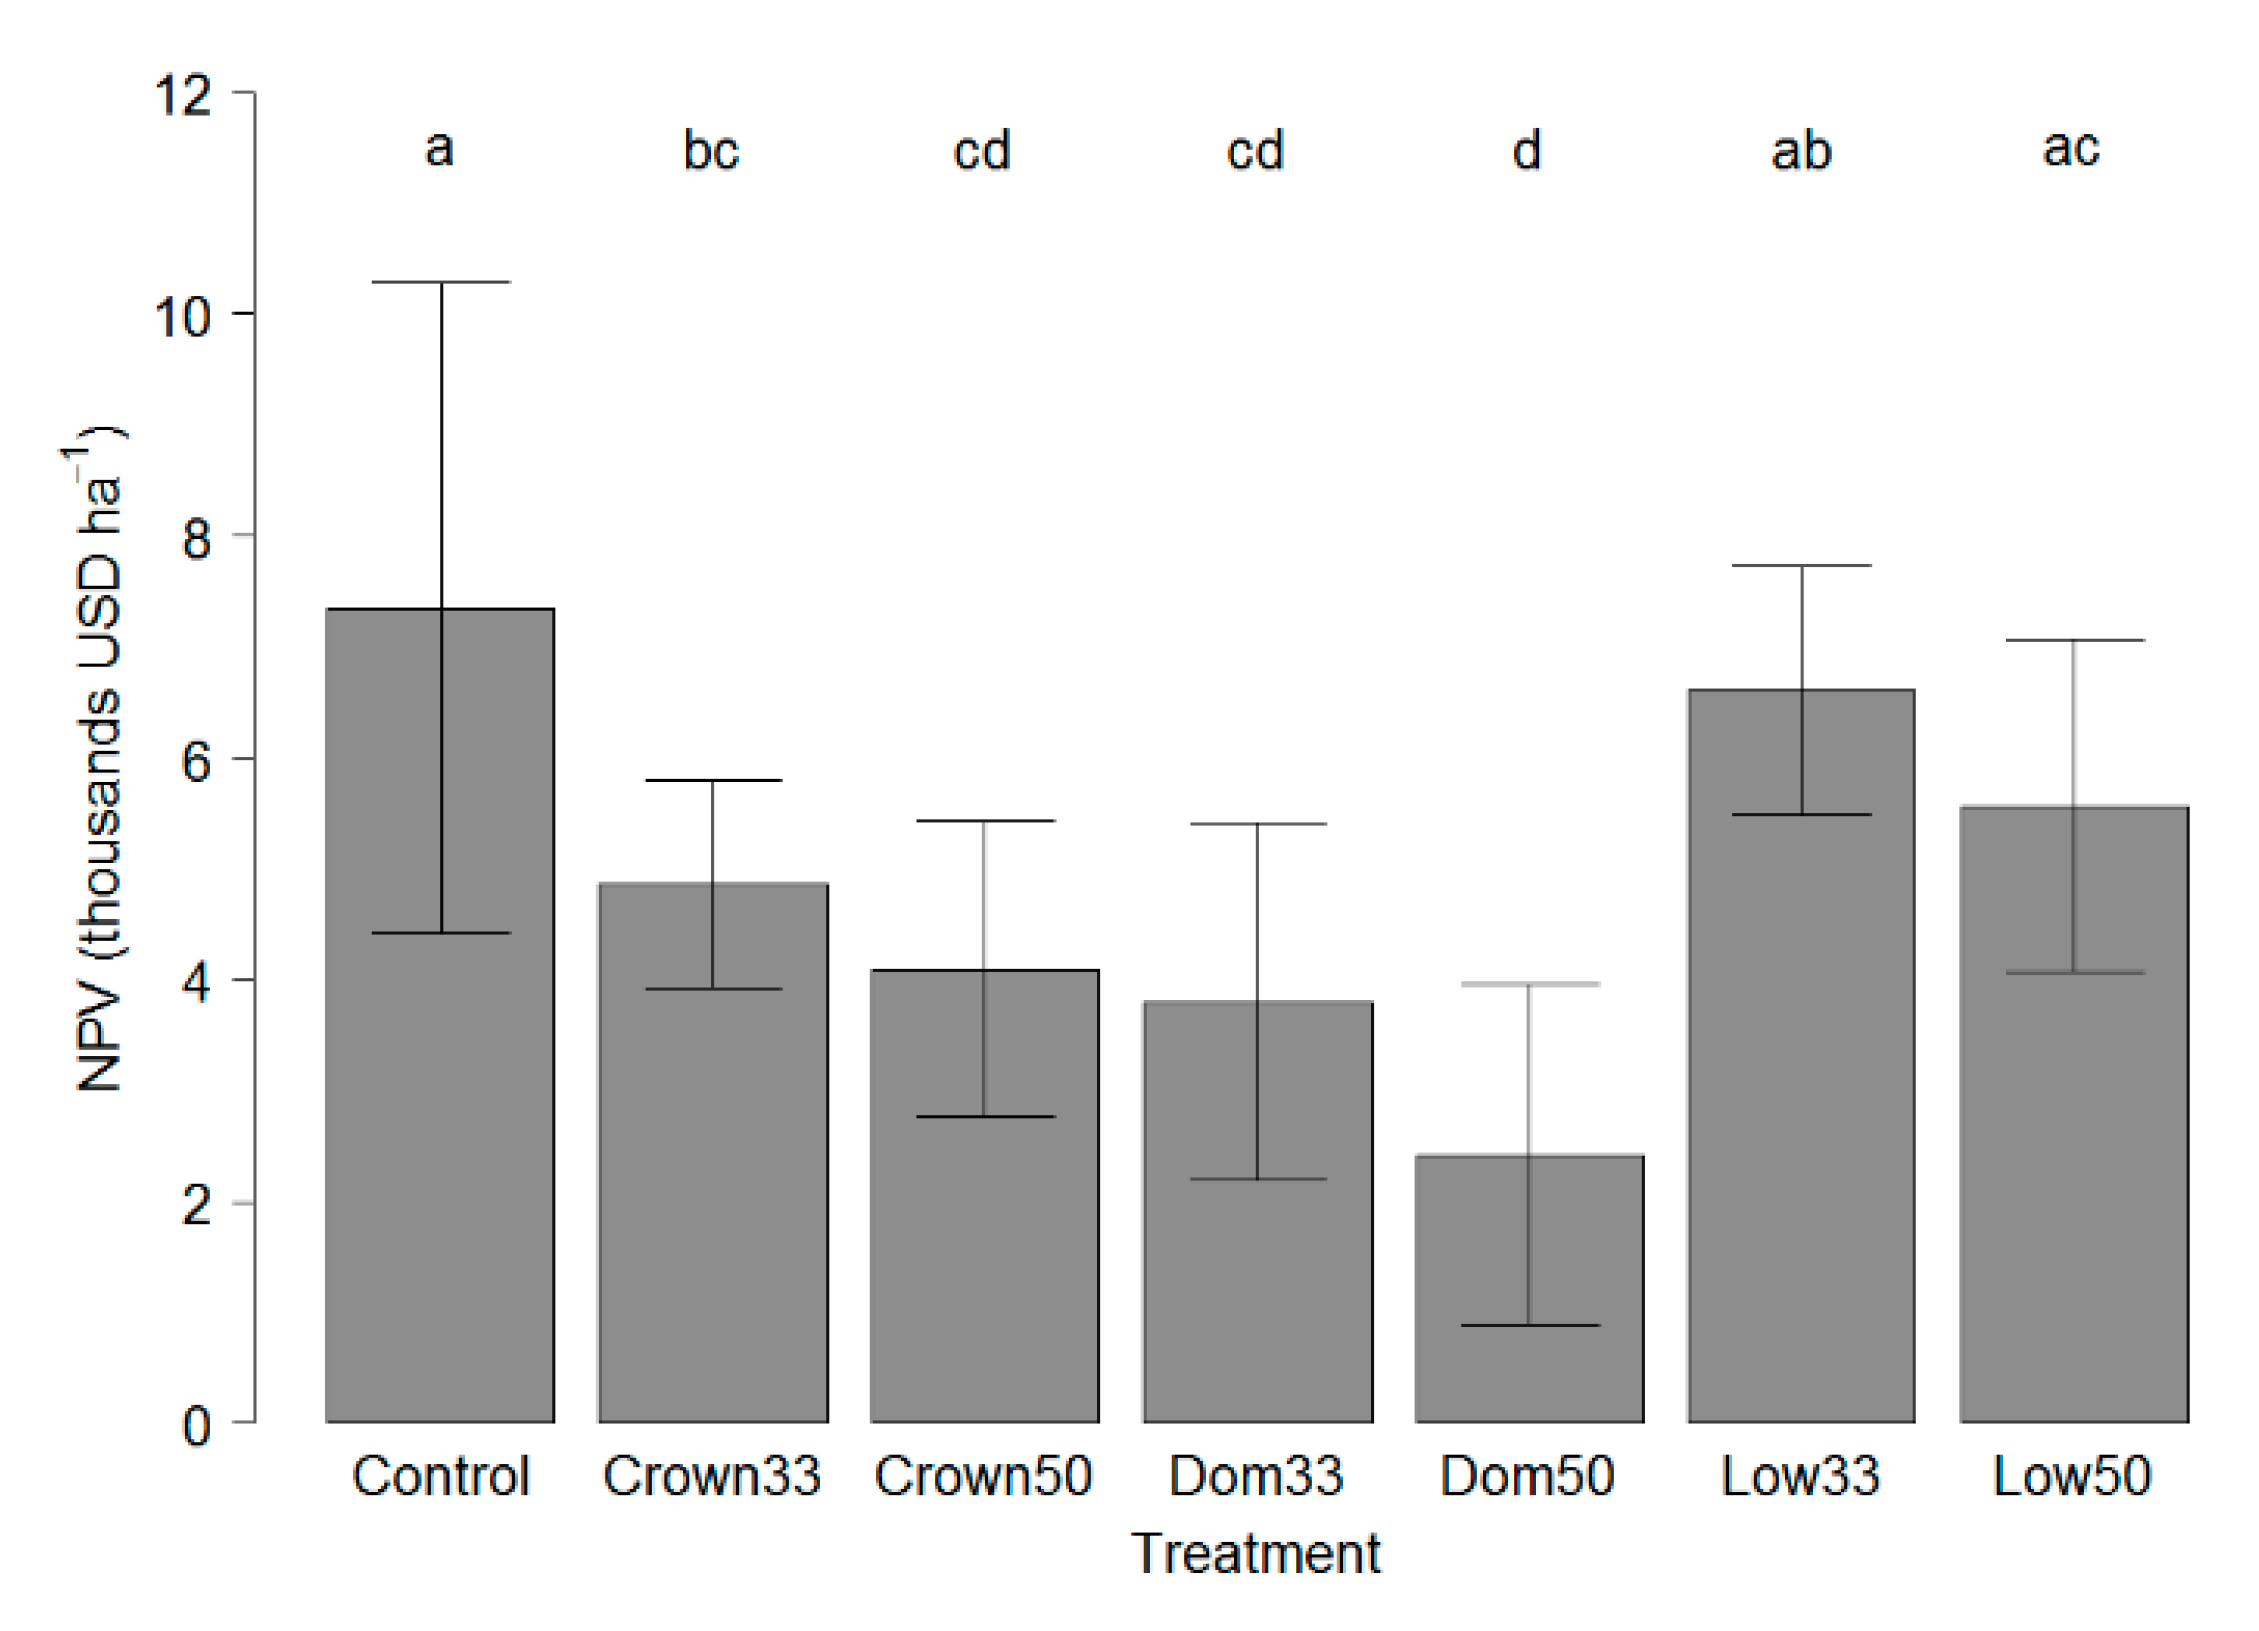
Treatment had a significant effect on maximum NPV (p < 0.001), with the two low thinning treatments (Low33, Low50) having a maximum NPV that was not significantly different from the control (Figure 3). Another trend that was observed was that the two crown thinning treatments (Crown33, Crown50); the light dominant thinning (Dom33), and the heavy low thinning (Low50) were not statistically different from each other. In addition, the heavy crown thinning (Crown50); and the two dominant thinning (Dom33, Dom50) were also not statistically different from each other. The model of treatment and maximum NPV (Table 4a) had a generalized R2 of the fixed effects of 0.51 and a R2 of 0.99 when including the random effects of plot and site.
3.2. The Effect of Treatment on Stand Age at Time of Maximum NPV
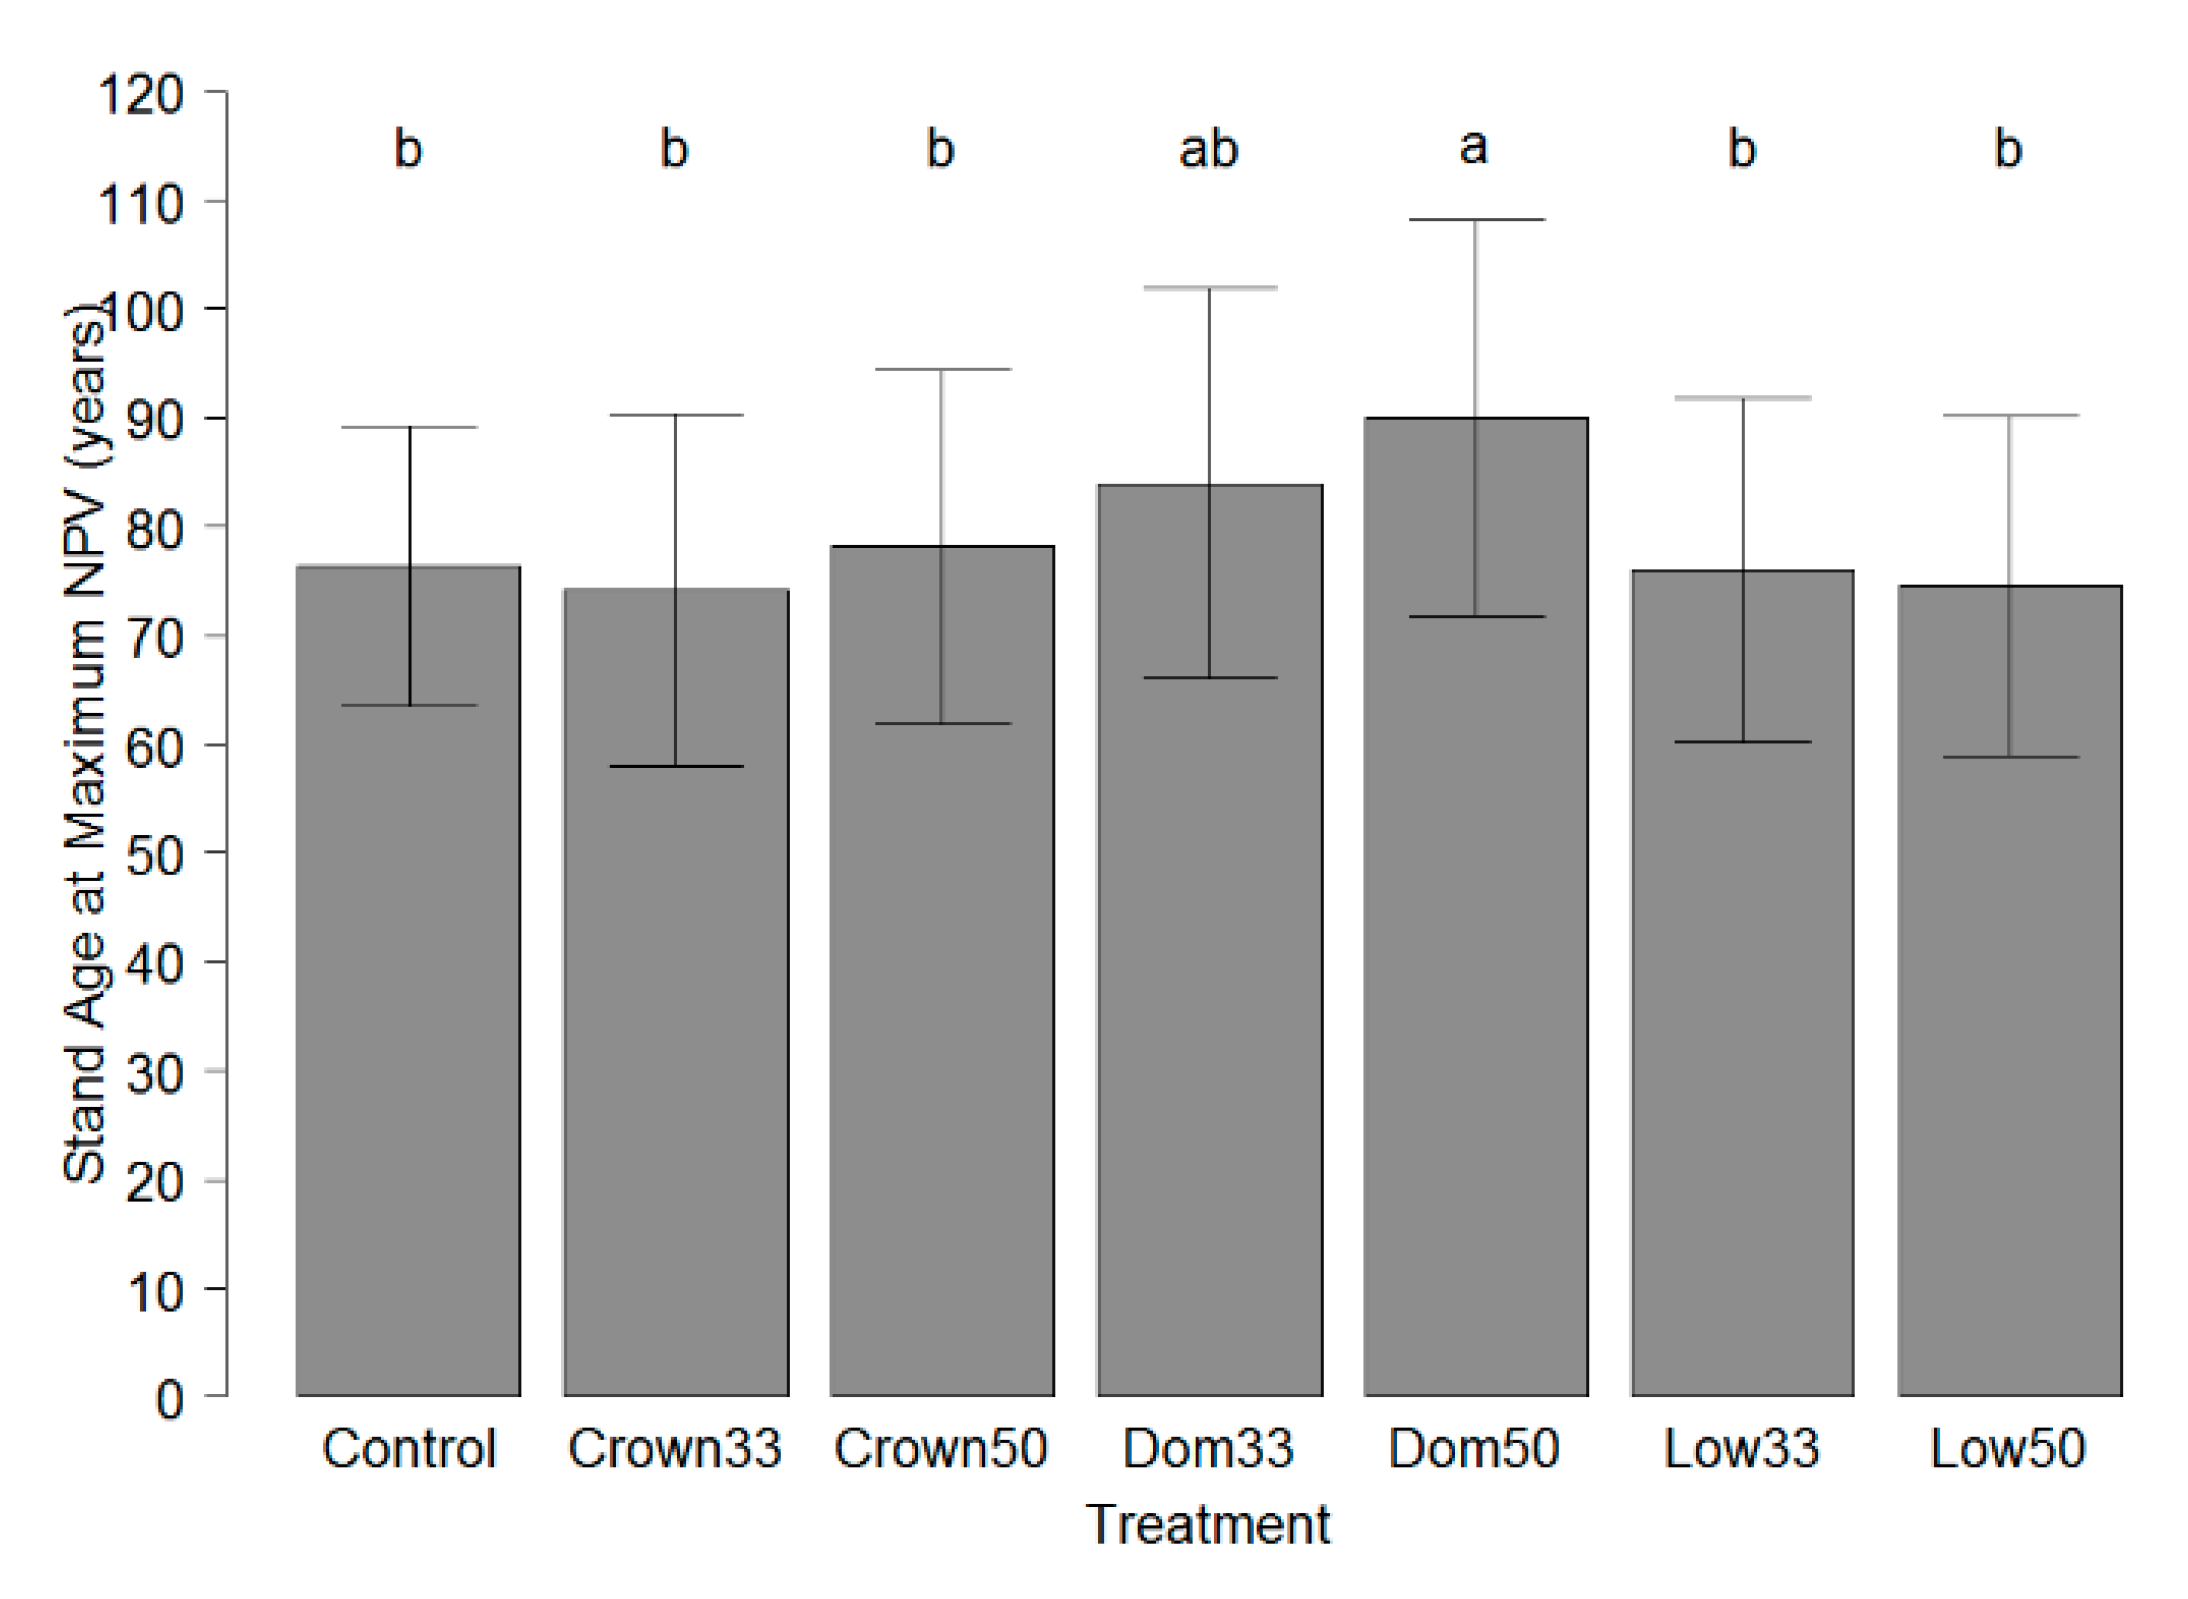
Treatment had a significant effect on stand age at time of maximum NPV (p < 0.001), however, the two crown thinning (Crown33, Crown50), light dominant thinning (Dom33), and the two low thinning (Low33, Low50) treatments did not differ significantly from the control (Figure 4). There was also no significant difference noted between the two dominant thinning treatments (Dom33, Dom50). The model of treatment and stand age at time of maximum NPV (Table 4b) had a generalized R2 of the fixed effects of 0.12 and a R2 of 0.99 when including the random effects of plot and site.
3.3. The Effect of Treatment on Average Merchantable Stem Size
Treatment had a significant effect on merchantable stem size (p < 0.001), with the average merchantable stem size not being significantly different between the heavy crown (Crown50) thinning and the heavy low thinning (Low50; Figure 5). No significant difference was found between the average merchantable stem size of the low crown thinning (Crown33), the two dominant thinnings (Dom33, Dom50), and the control. The stem size between the two low thinning treatments (Low33, Low50) was significantly different. The model of treatment and average merchantable stem size (Table 4c) had a generalized R2 of the fixed effects of 0.55 and a R2 of 0.99 when including the random effects of plot and site.
3.4. Sensitivity of Net Present Value to Interest Rate
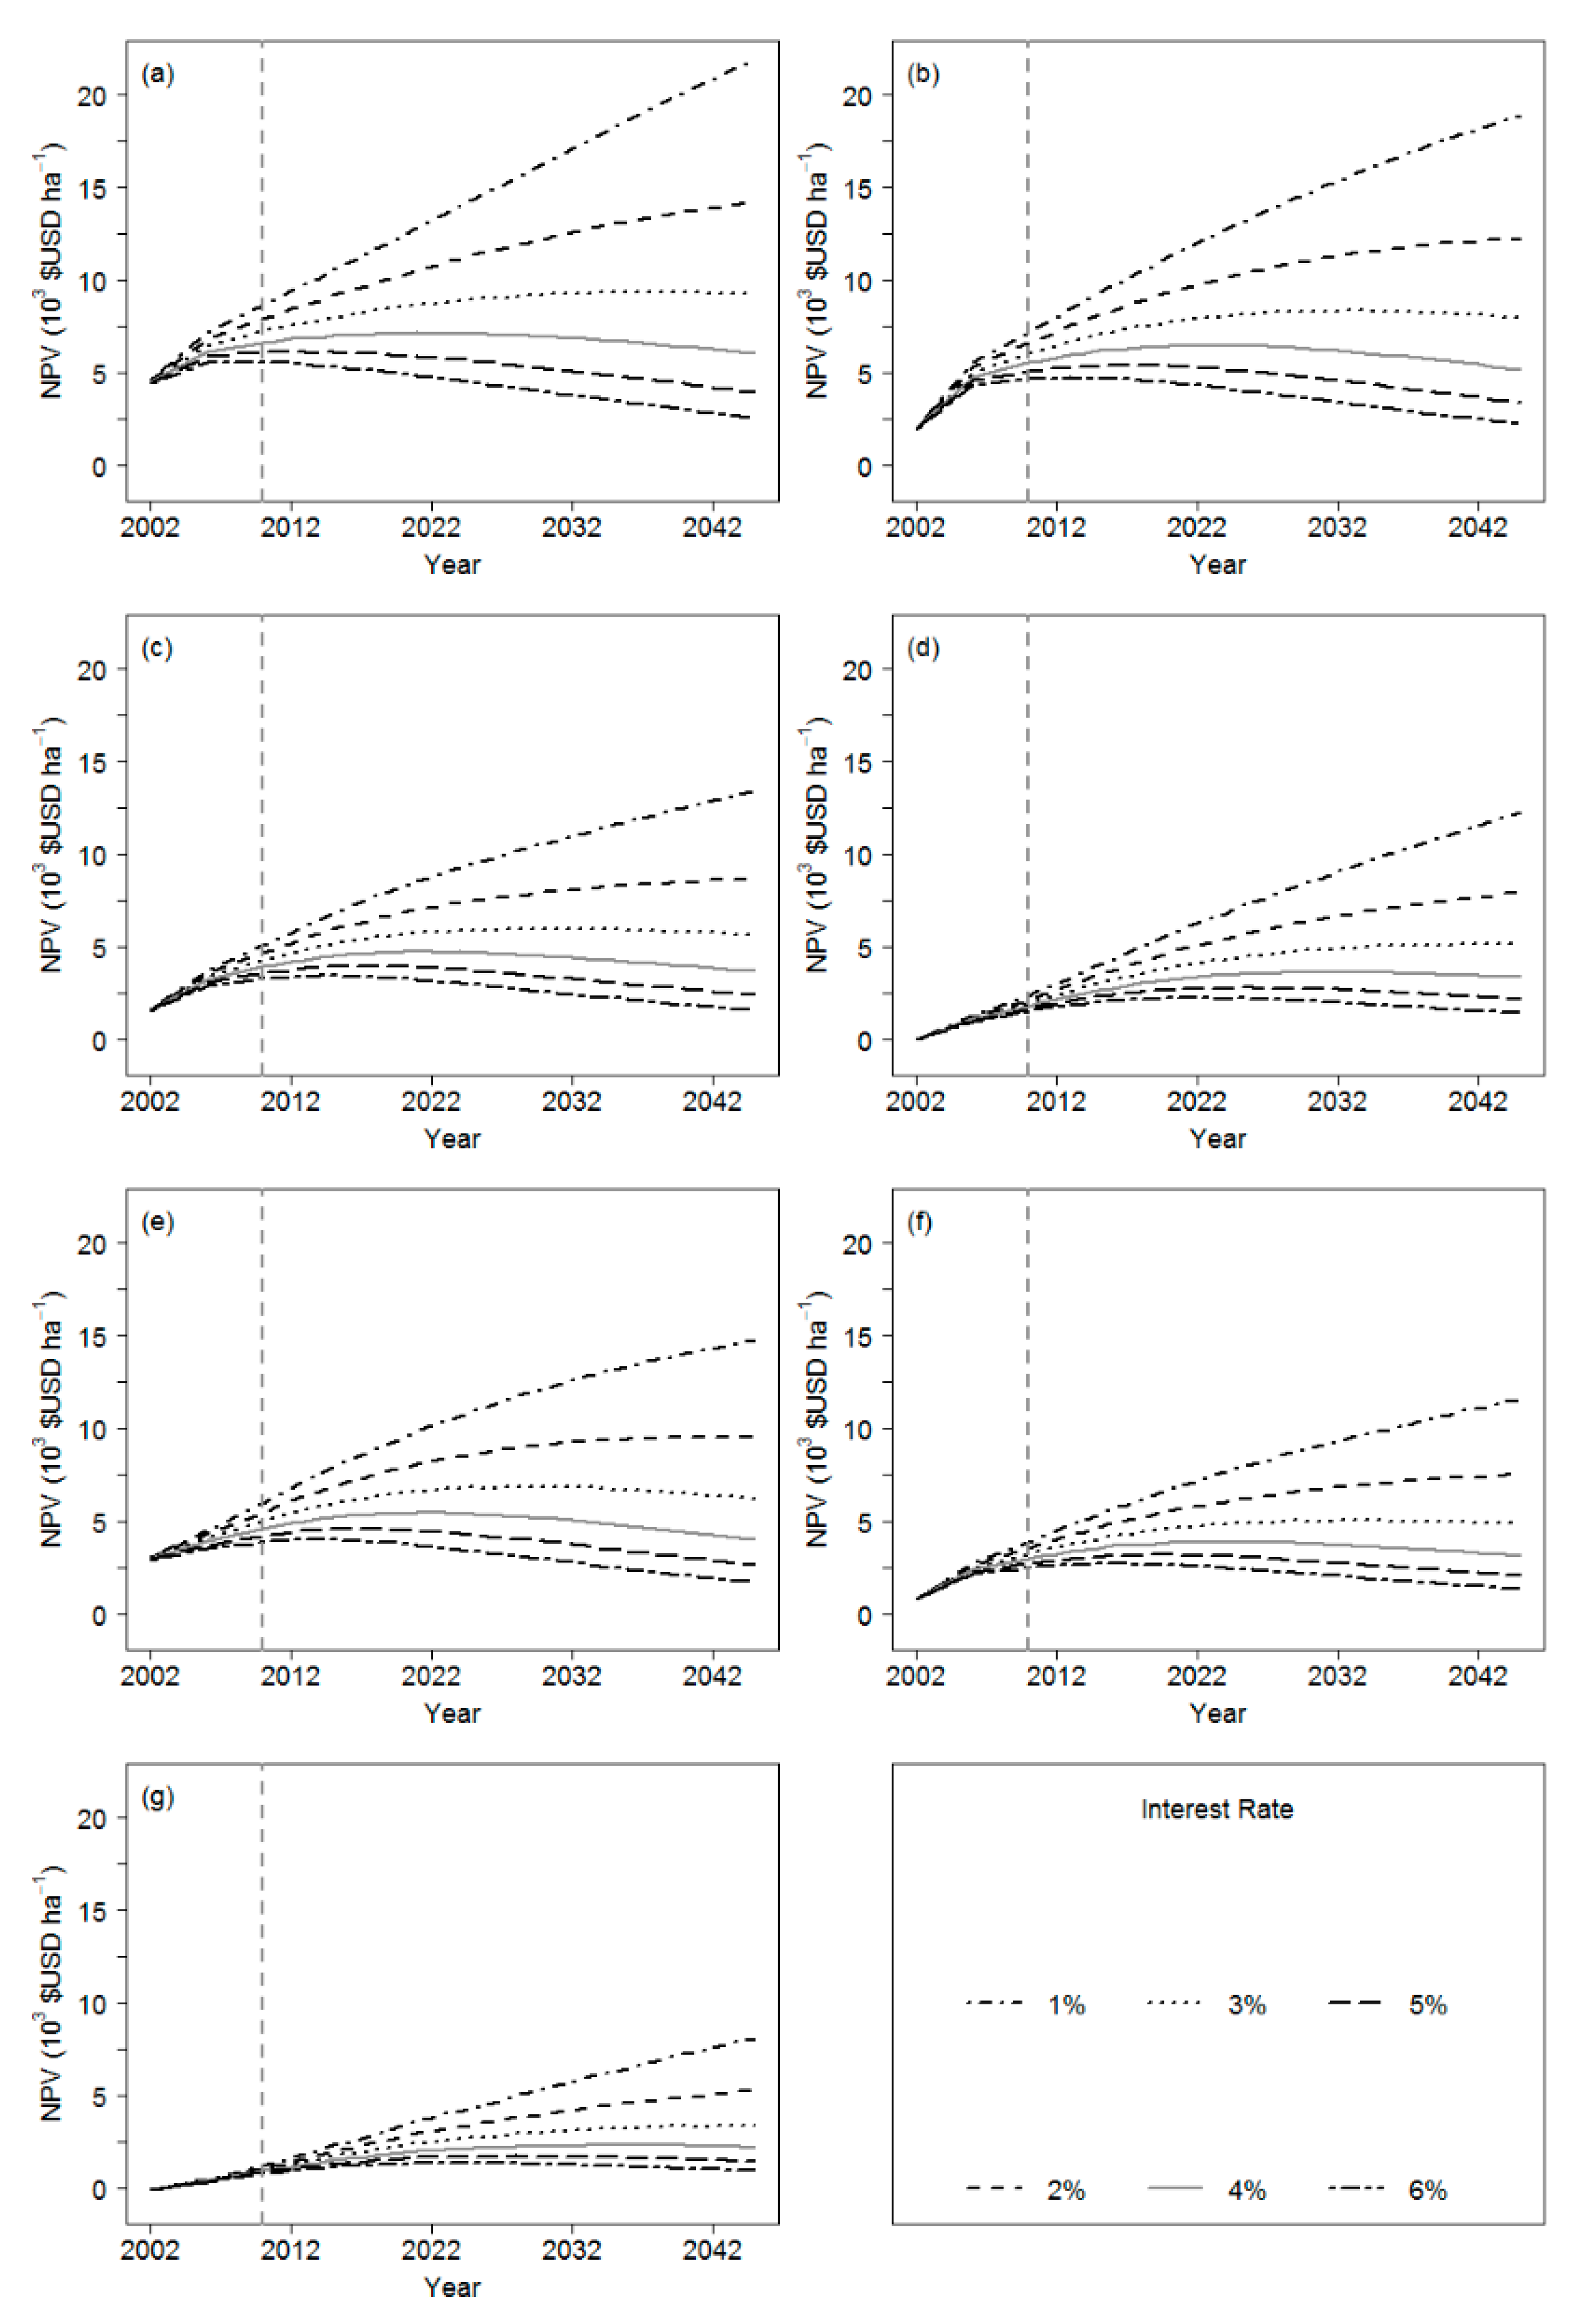
The sensitivity analysis of NPV using six different interest rates showed that the differences were comparatively small for the measured time period, with differences of less than US$5000/ha between 1% and 6% interest rates (Figure 6). For the projected time period (2011–2046), however, the differences were increasing over time up to a difference of over US$17,500/ha between 1% and 6% interest rates. A higher interest rate than 4% resulted in earlier culmination of NPV and thus an earlier financial maturity. Smaller interest rates resulted in a delayed culmination of NPV and thus a later financial maturity. The most prominent NPV differences between interest rates were found in the control (Figure 6a) and the two low thinning treatments (Low33 (Figure 6b), Low50 (Figure 6e)). Slightly less prominent were the differences for the two crown thinnings (Crown33 (Figure 6c), Crown50 (Figure 6f)) and the light dominant thinning (Figure 6d). The smallest differences for NPV were found in the heavy dominant thinning (Figure 6g).
4. Discussion
4.1. Commercial Thinning Effects
Our results indicated that there were significant differences in maximum NPV between the control and the two crown thinning (Crown33, Crown50) and the two dominant thinning (Dom33, Dom50) treatments. However, the two low thinning treatments (Low33, Low50) were not significantly different from the control. Clune [13] analyzed data from 10 years following CT in the same stands that we used for our analysis and found that five years after CT all treatments, except the light low thinning treatment (Low33), were significantly different in the value per unit of volume. He further found that 10 years post CT the light dominant thinning (Dom33) and light low thinning (Low33) treatments were not different from the control in terms of value per unit of volume. Using a 4% discount rate, Clune [13] also found that 10 years after CT the NPV of the light low thinning treatment (Low33) was 2% higher than that of the control, however, pairwise comparisons indicated that there were no statistically significant differences in NPV between all treatments and the control. One reason for the difference in NPV between Clune [13] and our study may be the contrasting merchantable volume calculation and harvest costs used. While Clune [13] used an approach outlined by Saunders et al. [47] utilizing a harvest cost model by Randolph et al. [48], we utilized region specific taper equations for merchantable volume calculations [37,38], but also regional harvest cost and cycle time information (e.g., Hiesl and Benjamin [43]).
4.2. Effect of Thinning Method
The thinning method (low, crown, dominant) had significant effects on maximum NPV and the stand age at maximum NPV. Low thinning, both with 33% (Low33) and 50% relative density removal (Low50), did not result in a significantly different NPV from the control. In terms of stand age at time of maximum NPV, both crown (Crown33, Crown50) and low thinning (low33, Low50) methods did not result in significantly different stand ages from the control. Emmingham et al. [49] compared tree and stand volume growth responses to low and crown thinning in Douglas-fir (Pseudotsuga menziesii (Mirb.) Franco) stands and found that neither thinning method resulted in a decrease in growth in dominant and co-dominant trees. However, they also noted that low-thinned stands tended to grow more volume per area than crown-thinned stands. Clune [13] also noted that low-thinning treatments resulted in a more rapidly increasing total volume than crown-thinned treatments. Dominant thinning treatments (Dom33, Dom50) decreased total volume for at least five years before volume started to accumulate again [13]. The lack of differences in stand age at maximum NPV between the treatments and control may be due to the large variation in stand age at time of CTRN establishment (Table 2). A projection based on a more homogenous set of stand conditions may return different results.
4.3. Thinning Effect on Average Merchantable Stem Size
Low thinning and crown thinning treatments resulted in significantly higher average stem sizes than the control. This result is similar to the result of Emmingham et al. [49] who found that low-thinned and crown-thinned stands grew up to 124% more volume than the control. In New Brunswick, Canada, a study by Pelletier and Pitt [50] showed that all of the tested CT treatments resulted in improved diameter and volume growth on fewer individual trees. They further reported that early thinning entries increased the merchantable volume per stem by up to 24% over unthinned controls. A recent study by Hiesl et al. [18] in spruce-fir stands with a PCT also showed an increase in merchantable stem size as a result of CT, regardless of removal intensity or timing of CT. The reason for the lack of differences between dominant thinning treatments (Dom33, Dom50) and the control is due to the fact that dominant thinning removes most of the dominant and co-dominant trees and thus leaves less vigorous and smaller trees.
4.4. Limitations
This analysis is based on a set of assumptions that may not hold true for the projected 35-year period. Although the individual tree growth and yield model used was developed for Maine and has been well tested, the accuracy decreases and uncertainty increases for longer projection intervals. In fact, stand-level rather than individual tree growth models like the one used here have been suggested when projection lengths exceed 20 years [51]. Despite this general recommendation, the performance of the growth model appeared reasonable and the effect of the CT growth/mortality modifiers used generally diminished after 10 years post treatment.
Another key limitation is that the stands will be growing free of insect damage for this time period. Given the history of spruce budworm in Maine, with a recurrence interval of 30–60 years and the last outbreak in the 1970s and 1980s [4], this assumption may not hold for the entire time projected. Currently there is a spruce budworm outbreak in Quebec and spruce budworm counts in Maine are increasing and the next outbreak is expected soon [22]. Even low levels of defoliation by spruce budworm can have significant effects on individual tree growth and mortality [52]. Other factors that can influence the outcome of thinnings and stand growth over time are abiotic factors such as ice storms and hurricanes. Even though hurricanes and ice storms can be severe, Fraver and White [53] and Fraver et al. [54] did not find any evidence for stand replacing events in old growth forest over the past three centuries. Investigating the severity of disturbances in an old growth forest that included red spruce, Fraver et al. [54] found that the average canopy damage in a decade rarely exceeded 30%. However, this can have a significant impact on NPV and thus management recommendations and the economic viability intermediate treatments.
Other limitations of the analysis were the assumed and fixed machine rates and fuel costs. Both of these can fluctuate greatly and can have a significant impact on harvesting costs and subsequently NPV. We further assumed constant product values. As the drop in product values between Randolph et al. [55] and Hiesl et al. [18] shows, product values can change within a short period of time. As we cannot foresee future product values, a certain level of uncertainty is included in our projection. The economic situation of the United States and Canada are also important considerations. Our assumption for this model includes a constant economy and does not account for inflation or economic market failures such as the most recent recession. Lastly, our projection is based on a limited number of sites and a model generated from the best data available at the time, however, each model is a generalization and cannot take into account micro-site features. Thus, actual stand growth may be more or less than what our model predicted.
5. Conclusions
Our conclusion is that it is economically feasible to CT previously unthinned spruce-fir stands that range in age from 34 to 70 years. A low thinning with a light removal intensity (33% relative density) results in a slightly lower NPV than the control, but also provides a significantly larger average merchantable stem size at the time of final harvest. If average stem size is of great importance, then a low and heavy (50% relative density removal) thinning would be the right choice, but can result in a potential 10–20% decrease in NPV compared to the light thinning. Crown and dominant thinning do provide a larger average merchantable stem size than the control and also provide a mid-rotation financial return, but at the potential cost of greater than 35% reduction in NPV. Thus, these thinning methods are not very desirable or attractive to forest managers dealing with stands as presented in this study.
Whether or not a mid-rotation treatment for these stands is desirable is debatable. Clearly, the highest NPV is returned on control plots that did not receive any intermediate treatment. However, the average stem size of control plots was approximately half of the light and low thinning treatment. Especially in northern Maine, the biomass market is not as prominent or accessible as in other parts of the state and thus a larger average stem size may be more preferable for marketing purposes. No clear recommendation can be made, as it comes down to the landowners’ objectives and local market conditions, however, the information presented in this analysis can guide forest managers to mid-rotation treatments that result in appropriate stem sizes for their local markets. Additional long-term data will be needed to verify these projections and confirm findings, as the growth and yield projection may have been too conservative on control plot mortality.
Acknowledgments
We would like to acknowledge the Cooperative Forestry Research Unit for funding this project and making long-term data available. Clemson University is acknowledged for generous allotment of computing time on the Palmetto cluster. We would also like to thank two anonymous reviewers for their comments and suggestions to improve an earlier version of this manuscript.
Author Contributions
P.H. was principal investigator on the grant from the Cooperative Forestry Research Unit (CFRU) and drafted the original manuscript. M.S.C. was a co-principal investigator on the CFRU grant, provided guidance on the economic analysis, and edited various versions of this manuscript. A.R.W. was a co-principal investigator on the CFRU grant, provided the growth and yield model as R code, provided guidance with the growth and yield modeling, and edited various versions of this manuscript. A.R.K. was a co-principal investigator on the CFRU grant and edited various versions of this manuscript.
Conflicts of Interest
The authors declare no conflict of interest.
References
- McCaskill, G.L.; McWilliams, W.H.; Barnett, C.J.; Butler, B.J.; Hatfield, M.A.; Kurtz, C.M.; Morin, R.S.; Moser, W.K.; Perry, C.H.; Woodall, C.W. Maine’s Forests 2008; U.S. Department of Agriculture Forest Service, Northern Research Station: Newtown Square, PA, USA, 2011.
- Jin, S.; Sader, S.A. Effects of forest ownership and change on forest harvest rates, types and trends in northern Maine. For. Ecol. Manag. 2006, 228, 177–186. [Google Scholar] [CrossRef]
- Seymour, R.S. The red spruce-balsam fir forest of Maine: Evolution of silvicultural practice in response to stand development patterns and disturbances. In The Ecology and Silviculture of Mixed-Species Forests. A Festschrift for David M. Smith; Kelty, M.J., Larson, B.C., Oliver, C.D., Eds.; Kluwer Publishers: Norwell, MA, USA, 1992; pp. 217–244. [Google Scholar]
- Irland, L.C.; Dimon, J.B.; Baum, E.; Falk, J.; Stone, J.L. The Spruce Budworm Outbreak in Maine in the 1970’s—Assessment and Directions for the Future; Maine Agricultural Experiment Station: Orono, ME, USA, 1988. [Google Scholar]
- Hiesl, P.; Benjamin, J.G.; Roth, B.E. Evaluating harvest costs and profit of commercial thinnings in softwood stands in west-central Maine: A Case Study. For. Chron. 2015, 91, 150–160. [Google Scholar] [CrossRef]
- Zhang, S.; Chauret, G.; Tong, Q. Impact of precommercial thinning on tree growth, lumber recovery and lumber quality in Abies balsamea. Scand. J. For. Res. 2009, 24, 425–433. [Google Scholar] [CrossRef]
- Zeide, B. Thinning and growth: A full turnaround. J. For. 2001, 99, 20–25. [Google Scholar]
- Smith, D.M. The Practice of Silviculture, 8th ed.; John Wiley & Sons, Inc.: New York, NY, USA, 1986. [Google Scholar]
- Nyland, R.D. Silviculture: Concepts and Applications, 2nd ed.; McGraw-Hill: New York, NY, USA, 2002. [Google Scholar]
- Weiskittel, A.R.; Kenefic, L.S.; Li, R.; Brissette, J. Stand structure and composition 32 years after precommercial thinning treatments in a mixed northern conifer stand in central Maine. North. J. Appl. For. 2011, 28, 92–96. [Google Scholar]
- Prévost, M.; Gauthier, M.M. Precommercial thinning increases growth of overstory aspen and understory balsam fir in a boreal mixedwood stand. For. Ecol. Manag. 2012, 278, 17–26. [Google Scholar] [CrossRef]
- Pitt, D.G.; Lanteigne, L.; Hoepting, M.K.; Plamondon, J. Effects of precommercial thinning on the forest value chain in northwestern New Brunswick: Part 1—Roundwood production and stumpage value. For. Chron. 2013, 89, 446–457. [Google Scholar] [CrossRef]
- Clune, P.M. Growth and Development of Maine Spruce-Fir Forests Following Commercial Thinning. Master’s Thesis, University of Maine, Orono, ME, USA, 2013. [Google Scholar]
- Reukema, D.L.; Bruce, D. Effects of Thinning on Yield of Douglas-Fir: Concepts and Some Estimates Obtained by Simulation; U.S. Department of Agriculture Forest Service, Pacific Northwest Research Station: Portland, OR, USA, 1977.
- Pekol, J.R. The Influence of Commercial Thinning on Stand- and Tree-Level Mortality Patterns of Balsam Fir (Abies balsamea) and Red Spruce (Picea rubens) Forests in Maine that Have or Have Not Received Precommercial Thinning. Master’s Thesis, University of Maine, Orono, ME, USA, 2011. [Google Scholar]
- Mäkinen, H.; Isomäki, A. Thinning intensity and growth of Scots pine stands in Finland. For. Ecol. Manag. 2004, 201, 311–325. [Google Scholar] [CrossRef]
- Mäkinen, H.; Isomäki, A. Thinning intensity and growth of Norway spruce stands in Finland. Forestry 2004, 77, 349–364. [Google Scholar] [CrossRef]
- Hiesl, P.; Crandall, M.S.; Weiskittel, A.; Benjamin, J.G.; Wagner, R.G. Evaluating the long-term influence of alternative commercial thinning regimes and harvesting systems on projected net present value of precommercially thinned spruce—Fir stands in northern Maine. Can. J. For. Res. 2017, 47, 203–214. [Google Scholar] [CrossRef]
- Zon, R. Balsam Fir; U.S. Department of Agriculture: Washington, DC, USA, 1914.
- Murphy, L.S. The Red Spruce: Its Growth and Management; U.S. Department of Agriculture: Washington, DC, USA, 1917.
- Fowells, H.A. Silvics of Forest Trees of the United States; U.S. Department of Agriculture: Washington, DC, USA, 1965.
- Wagner, R.G.; Bryant, J.; Burgason, B.; Doty, M.; Roth, B.E.; Strauch, P.; Struble, D.; Denico, D. Coming Spruce Budworm Outbreak: Initial Risk Assessment and Preparation & Response Recommendations for Maine’s Forestry Community; Cooperative Forestry Research Unit, University of Maine: Orono, ME, USA, 2016. [Google Scholar]
- Cary, A. On the growth of spruce. In Second Annual Report of the Forest Commissioner of the State of Maine; Burleigh & Flynt: Augusta, ME, USA, 1894; pp. 20–36. [Google Scholar]
- Leak, W.B. Age distribution in virgin red spruce and northern hardwoods. Ecology 1975, 56, 1451–1454. [Google Scholar] [CrossRef]
- Wagner, R.G.; Seymour, R.S. Commercial Thinning Research Network. In Cooperative Forestry Research Unit 2000 Annual Report; Griffin, H.E., Ed.; University of Maine: Orono, ME, USA, 2000; pp. 21–27. [Google Scholar]
- Wagner, R.G.; Seymour, R.S.; McConville, D.J. Commercial Thinning Research Network. In Cooperative Forestry Research Unit 2001 Annual Report; Griffin, H.E., Ed.; University of Maine: Orono, ME, USA, 2001; pp. 23–35. ISBN 4055220189. [Google Scholar]
- Bataineh, M.M.; Wagner, R.G.; Weiskittel, A.R. Long-term response of spruce–fir stands to herbicide and precommercial thinning: Observed and projected growth, yield, and financial returns in central Maine, USA. Can. J. For. Res. 2013, 43, 385–395. [Google Scholar] [CrossRef]
- DeRose, R.J.; Seymour, R.S. Patterns of leaf area index during stand development in even-aged balsam fir—Red spruce stands. Can. J. For. Res. 2010, 40, 629–637. [Google Scholar] [CrossRef]
- Wilson, D.S.; Seymour, R.S.; Maguire, D.A. Density management diagram for northeastern red spruce and balsam fir forests. North. J. Appl. For. 1999, 16, 48–56. [Google Scholar]
- Briggs, R.D. Site Classification; Maine Agricultural and Forest Experiment Station: Orono, ME, USA, 1994. [Google Scholar]
- Weiskittel, A.R.; Russell, M.B.; Wagner, R.G.; Seymour, R.S. Refinement of the Forest Vegetation Simulator Northeast variant growth and yield model: Phase III. In Cooperative Forestry Research Unit 2011 Annual Report; Roth, B.E., Ed.; University of Maine: Orono, ME, USA, 2012; pp. 85–93. [Google Scholar]
- Weiskittel, A.R.; Kershaw, J.A., Jr.; Crookston, N.L.; Hennigar, C.R. The Acadian Variant of the Forest Vegetation Simulator: Continued development and evaluation. In Proceedings of the 2017 Forest Vegetation Simulator (FVS) e-Conference; Keyser, C., Keyser, T., Eds.; U.S. Department of Agriculture Forest Service, Southern Research Station: Asheville, NC, USA, 2017; pp. 10–13. [Google Scholar]
- Kuehne, C.; Weiskittel, A.R.; Wagner, R.G.; Roth, B.E. Development and evaluation of individual tree- and stand-level approaches for predicting spruce-fir response to pre- and commercial-thinning in Maine, USA. For. Ecol. Manag. 2016, 376, 84–95. [Google Scholar] [CrossRef]
- Weiskittel, A.R.; Hennigar, C.; Kershaw, J.A., Jr. Extending the Acadian variant of FVS to managed stands. In Cooperative Forestry Research Unit 2014 Annual Report; Wagner, R.G., Ed.; University of Maine: Orono, ME, USA, 2015; pp. 47–51. [Google Scholar]
- R Core Team. R: A Language and Environment for Statistical Computing; R Foundation for Statistical Computing: Vienna, Austria, 2015. [Google Scholar]
- Hutchinson, S.F. Evaluating Variation in Commercial Timber and Land Value for Parcels in the Northeast United States. Master’s Thesis, University of Maine, Orono, ME, USA, 2014. [Google Scholar]
- Weiskittel, A.; Li, R. Development of regional taper and volume equations: Hardwood species. In Cooperative Forestry Research Unit 2011 Annual Report; Roth, B.E., Ed.; University of Maine: Orono, ME, USA, 2012; pp. 87–95. [Google Scholar]
- Li, R.; Weiskittel, A.; Dick, A.R.; Kershaw, J.A., Jr.; Seymour, R.S. Regional stem taper equations for eleven conifer species in the Acadian Region of North America: Development and Assessment. North. J. Appl. For. 2012, 29, 5–14. [Google Scholar] [CrossRef]
- Maine Forest Service. 2000 Stumpage Prices; Department of Conservation—Maine Forest Service: Augusta, ME, USA, 2001.
- Maine Forest Service. 2001 Stumpage Prices; Department of Conservation—Maine Forest Service: Augusta, ME, USA, 2002.
- Maine Forest Service. 2002 Stumpage Prices; Maine Department of Conservation—Maine Forest Service: Augusta, ME, USA, 2003.
- Hiesl, P.; Benjamin, J.G. Estimating processing times of harvesters in thinning operations in Maine. For. Prod. J. 2015, 65, 180–186. [Google Scholar] [CrossRef]
- Hiesl, P.; Benjamin, J.G. Harvesting Equipment Cycle Time and Productivity Guide for Logging Operations in Maine; Maine Agricultural and Forest Experiment Station: Orono, ME, USA, 2013. [Google Scholar]
- Benjamin, J.G.; Seymour, R.S.; Meacham, E.; Wilson, J.S. Impact of whole-tree and cut-to-length harvesting on postharvest condition and logging costs for early commercial thinning in Maine. North. J. Appl. For. 2013, 30, 149–155. [Google Scholar] [CrossRef]
- Koirala, A.; Kizha, A.R.; Roth, B.E. Perceiving major problems in forest products transportation by trucks and trailers: A cross-sectional survey. Eur. J. For. Eng. 2017, 3, 23–34. [Google Scholar]
- Row, C.; Kaiser, H.F.; Sessions, J. Discount rate for long-term forest service investments. J. For. 1981, 79, 367–376. [Google Scholar]
- Saunders, M.R.; Wagner, R.G.; Seymour, R.S. Thinning Regimes for Spruce-Fir Stands in the Northeastern United States and Eastern Canada; Cooperative Forestry Research Unit: Orono, ME, USA, 2008. [Google Scholar]
- Randolph, K.C.; Seymour, R.S.; Wagner, R.G. ThinME: User’s Guide; University of Maine: Orono, ME, USA, 2001. [Google Scholar]
- Emmingham, W.; Fletcher, R.; Fitzgerald, S.; Bennett, M. Comparing tree and stand volume growth response to low and crown thinning in young natural Douglas-fir stands. West. J. Appl. For. 2007, 22, 124–133. [Google Scholar]
- Pelletier, G.; Pitt, D.G. Silvicultural responses of two spruce plantations to midrotation commercial thinning in New Brunswick. Can. J. For. Res. 2008, 38, 851–867. [Google Scholar] [CrossRef]
- Mäkinen, A.; Kangas, A.; Kalliovirta, J.; Rasinmäki, J.; Välimäki, E. Comparison of treewise and standwise forest simulators by means of quantile regression. For. Ecol. Manag. 2008, 255, 2709–2717. [Google Scholar] [CrossRef]
- Chen, C.; Weiskittel, A.R.; Bataineh, M.M.; MacLean, D. Evaluating the influence of varying levels of spruce budworm defoliation on annualized individual tree growth and mortality in Maine, USA and New Brunswick, Canada. For. Ecol. Manag. 2017, 396, 184–194. [Google Scholar] [CrossRef]
- Fraver, S.; White, A.S. Disturbance dynamics of old-growth Picea rubens forests of northern Maine. J. Veg. Sci. 2005, 16, 597–610. [Google Scholar] [CrossRef]
- Fraver, S.; White, A.S.; Seymour, R.S. Natural disturbance in an old-growth landscape of northern Maine, USA. J. Ecol. 2009, 97, 289–298. [Google Scholar] [CrossRef]
- Randolph, K.C.; Seymour, R.S.; Wagner, R.G. ThinME: Development of Commercial Thinning Guidelines for Maine Spruce-Fir Forests; University of Maine: Orono, ME, USA, 2002. [Google Scholar]
Figure 1.
Study site locations in Maine with county boundaries shown. Study sites were: GR, Golden Road; HR, Harlow Road; RR, Rump Road; SA, St. Aurelie; SC, Schoolbus Road; SR, Sarah’s Road.
Figure 1.
Study site locations in Maine with county boundaries shown. Study sites were: GR, Golden Road; HR, Harlow Road; RR, Rump Road; SA, St. Aurelie; SC, Schoolbus Road; SR, Sarah’s Road.
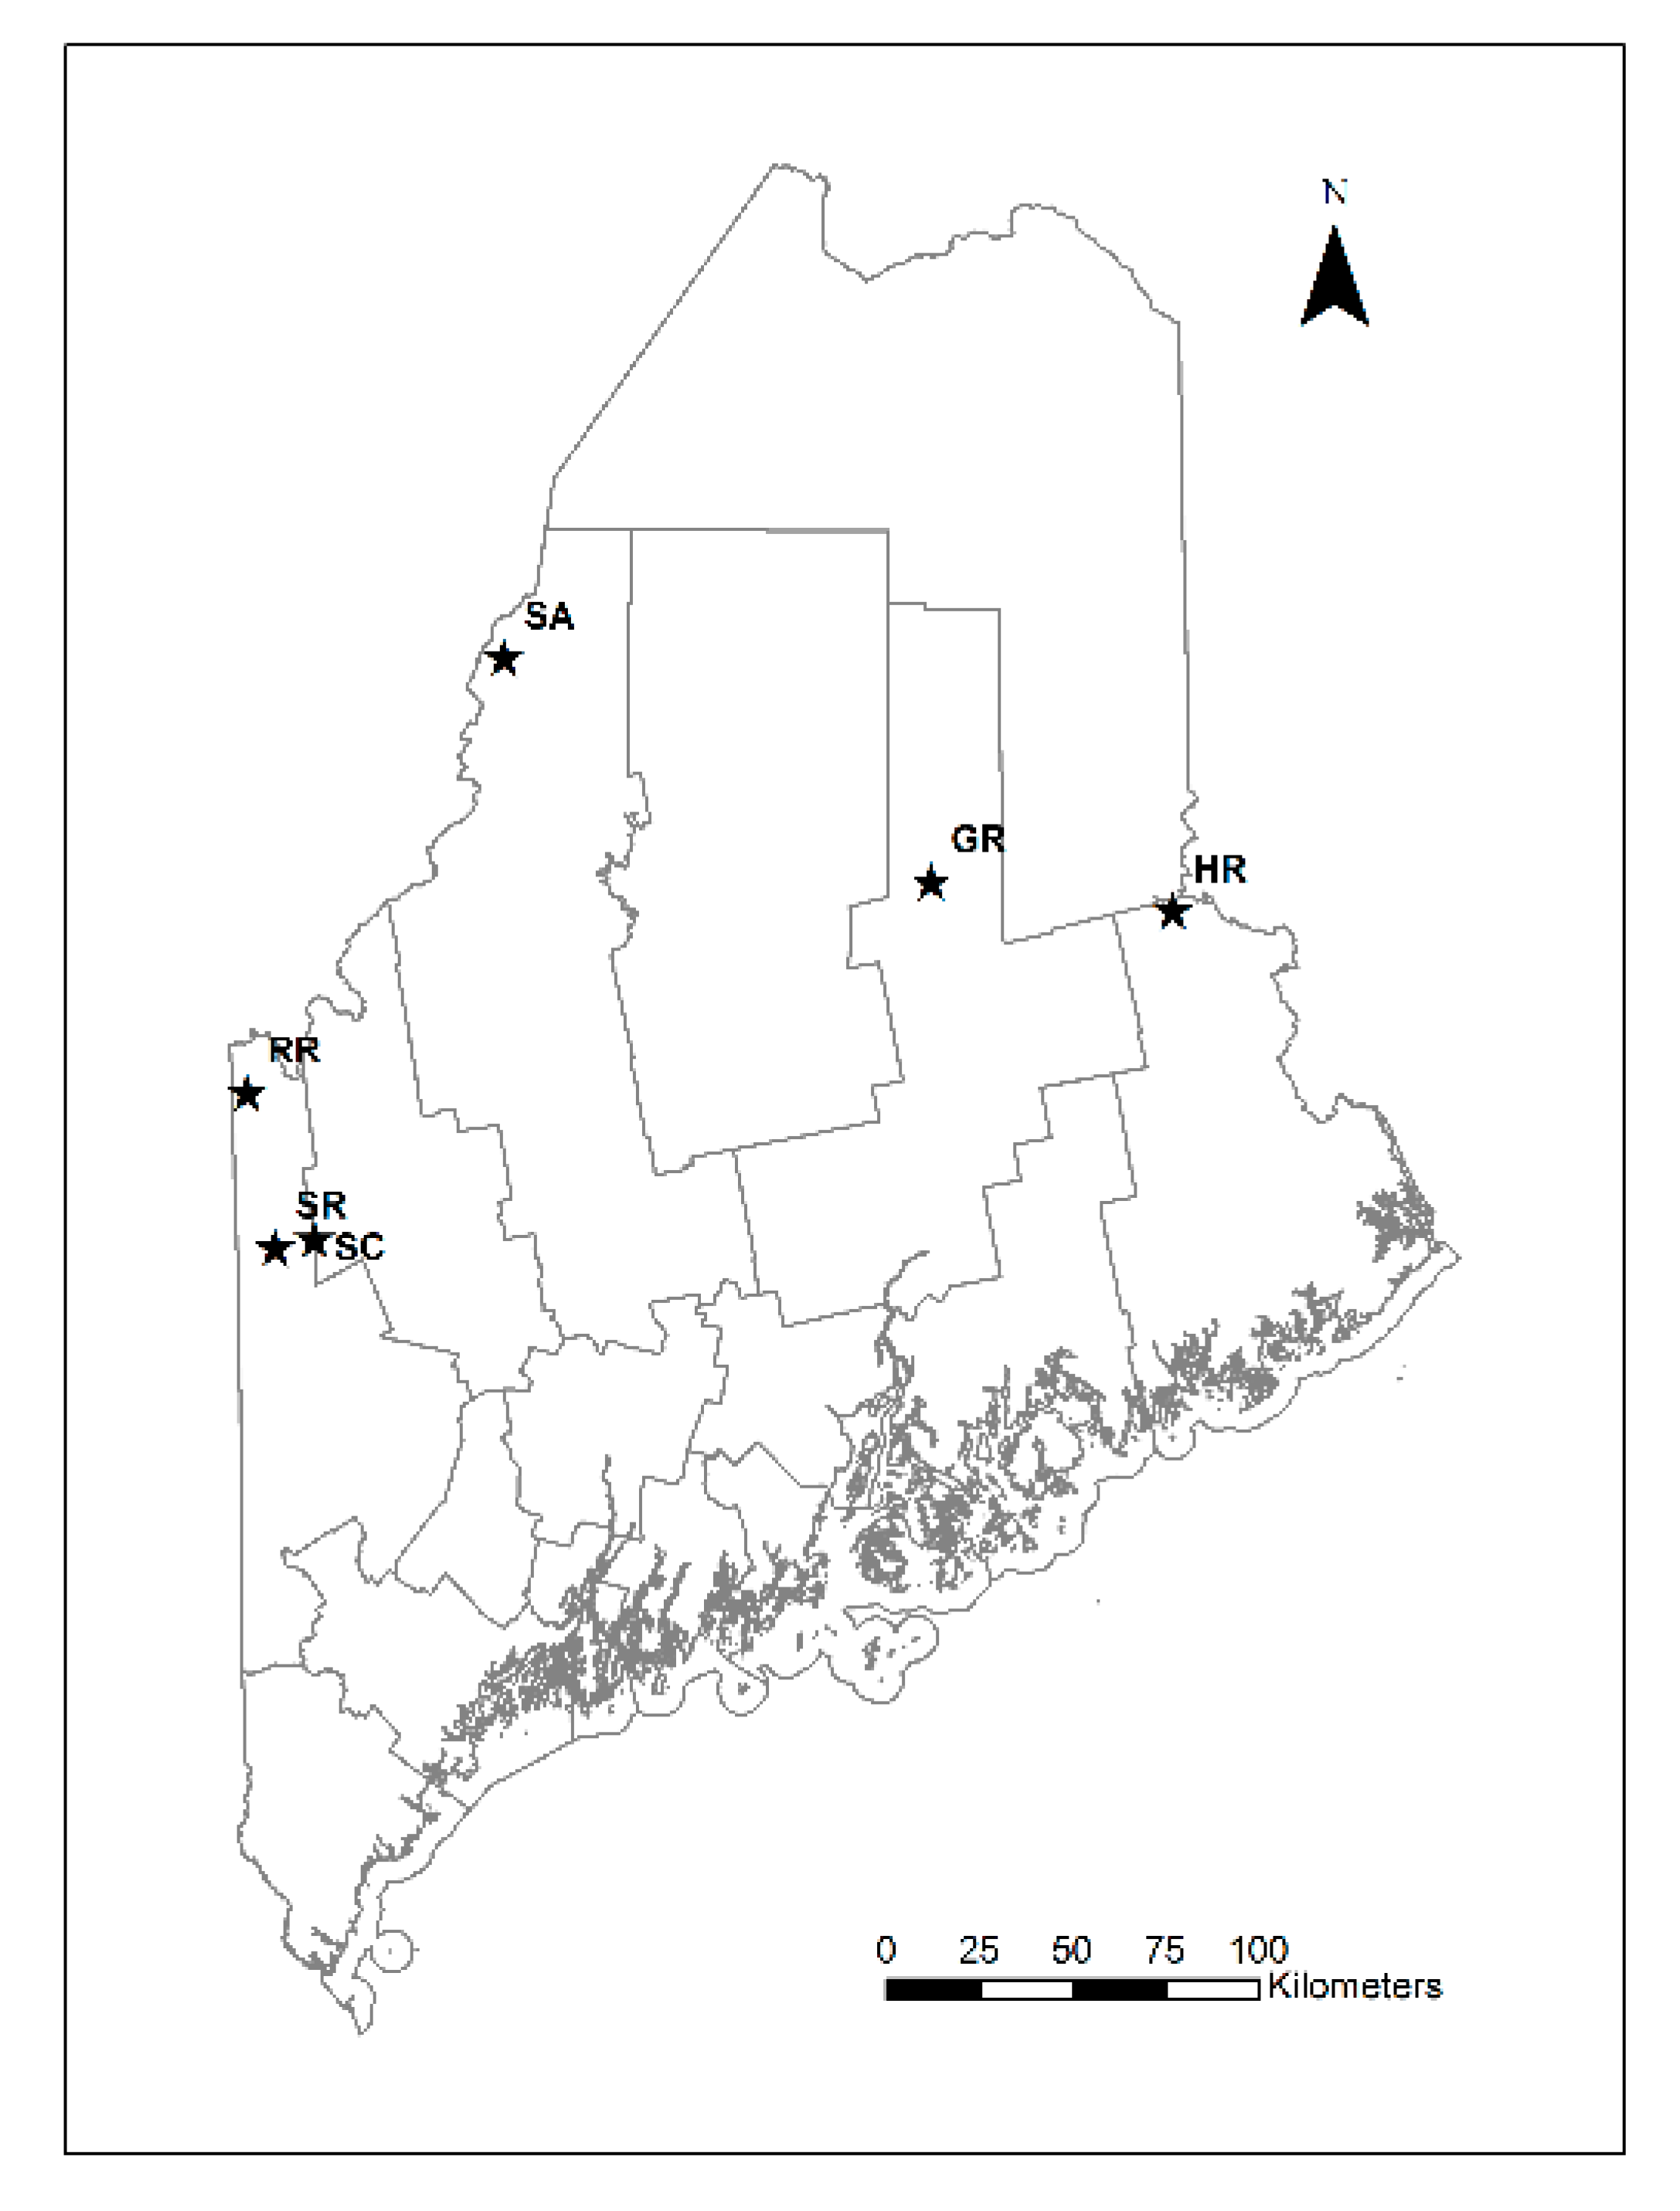
Figure 2.
Average projection results across the various treatments for all sites: merchantable volume (a); mean annual increment (b); average merchantable stem size (c); net present value (NPV) (d); and percent difference in NPV from control (e).
Figure 2.
Average projection results across the various treatments for all sites: merchantable volume (a); mean annual increment (b); average merchantable stem size (c); net present value (NPV) (d); and percent difference in NPV from control (e).
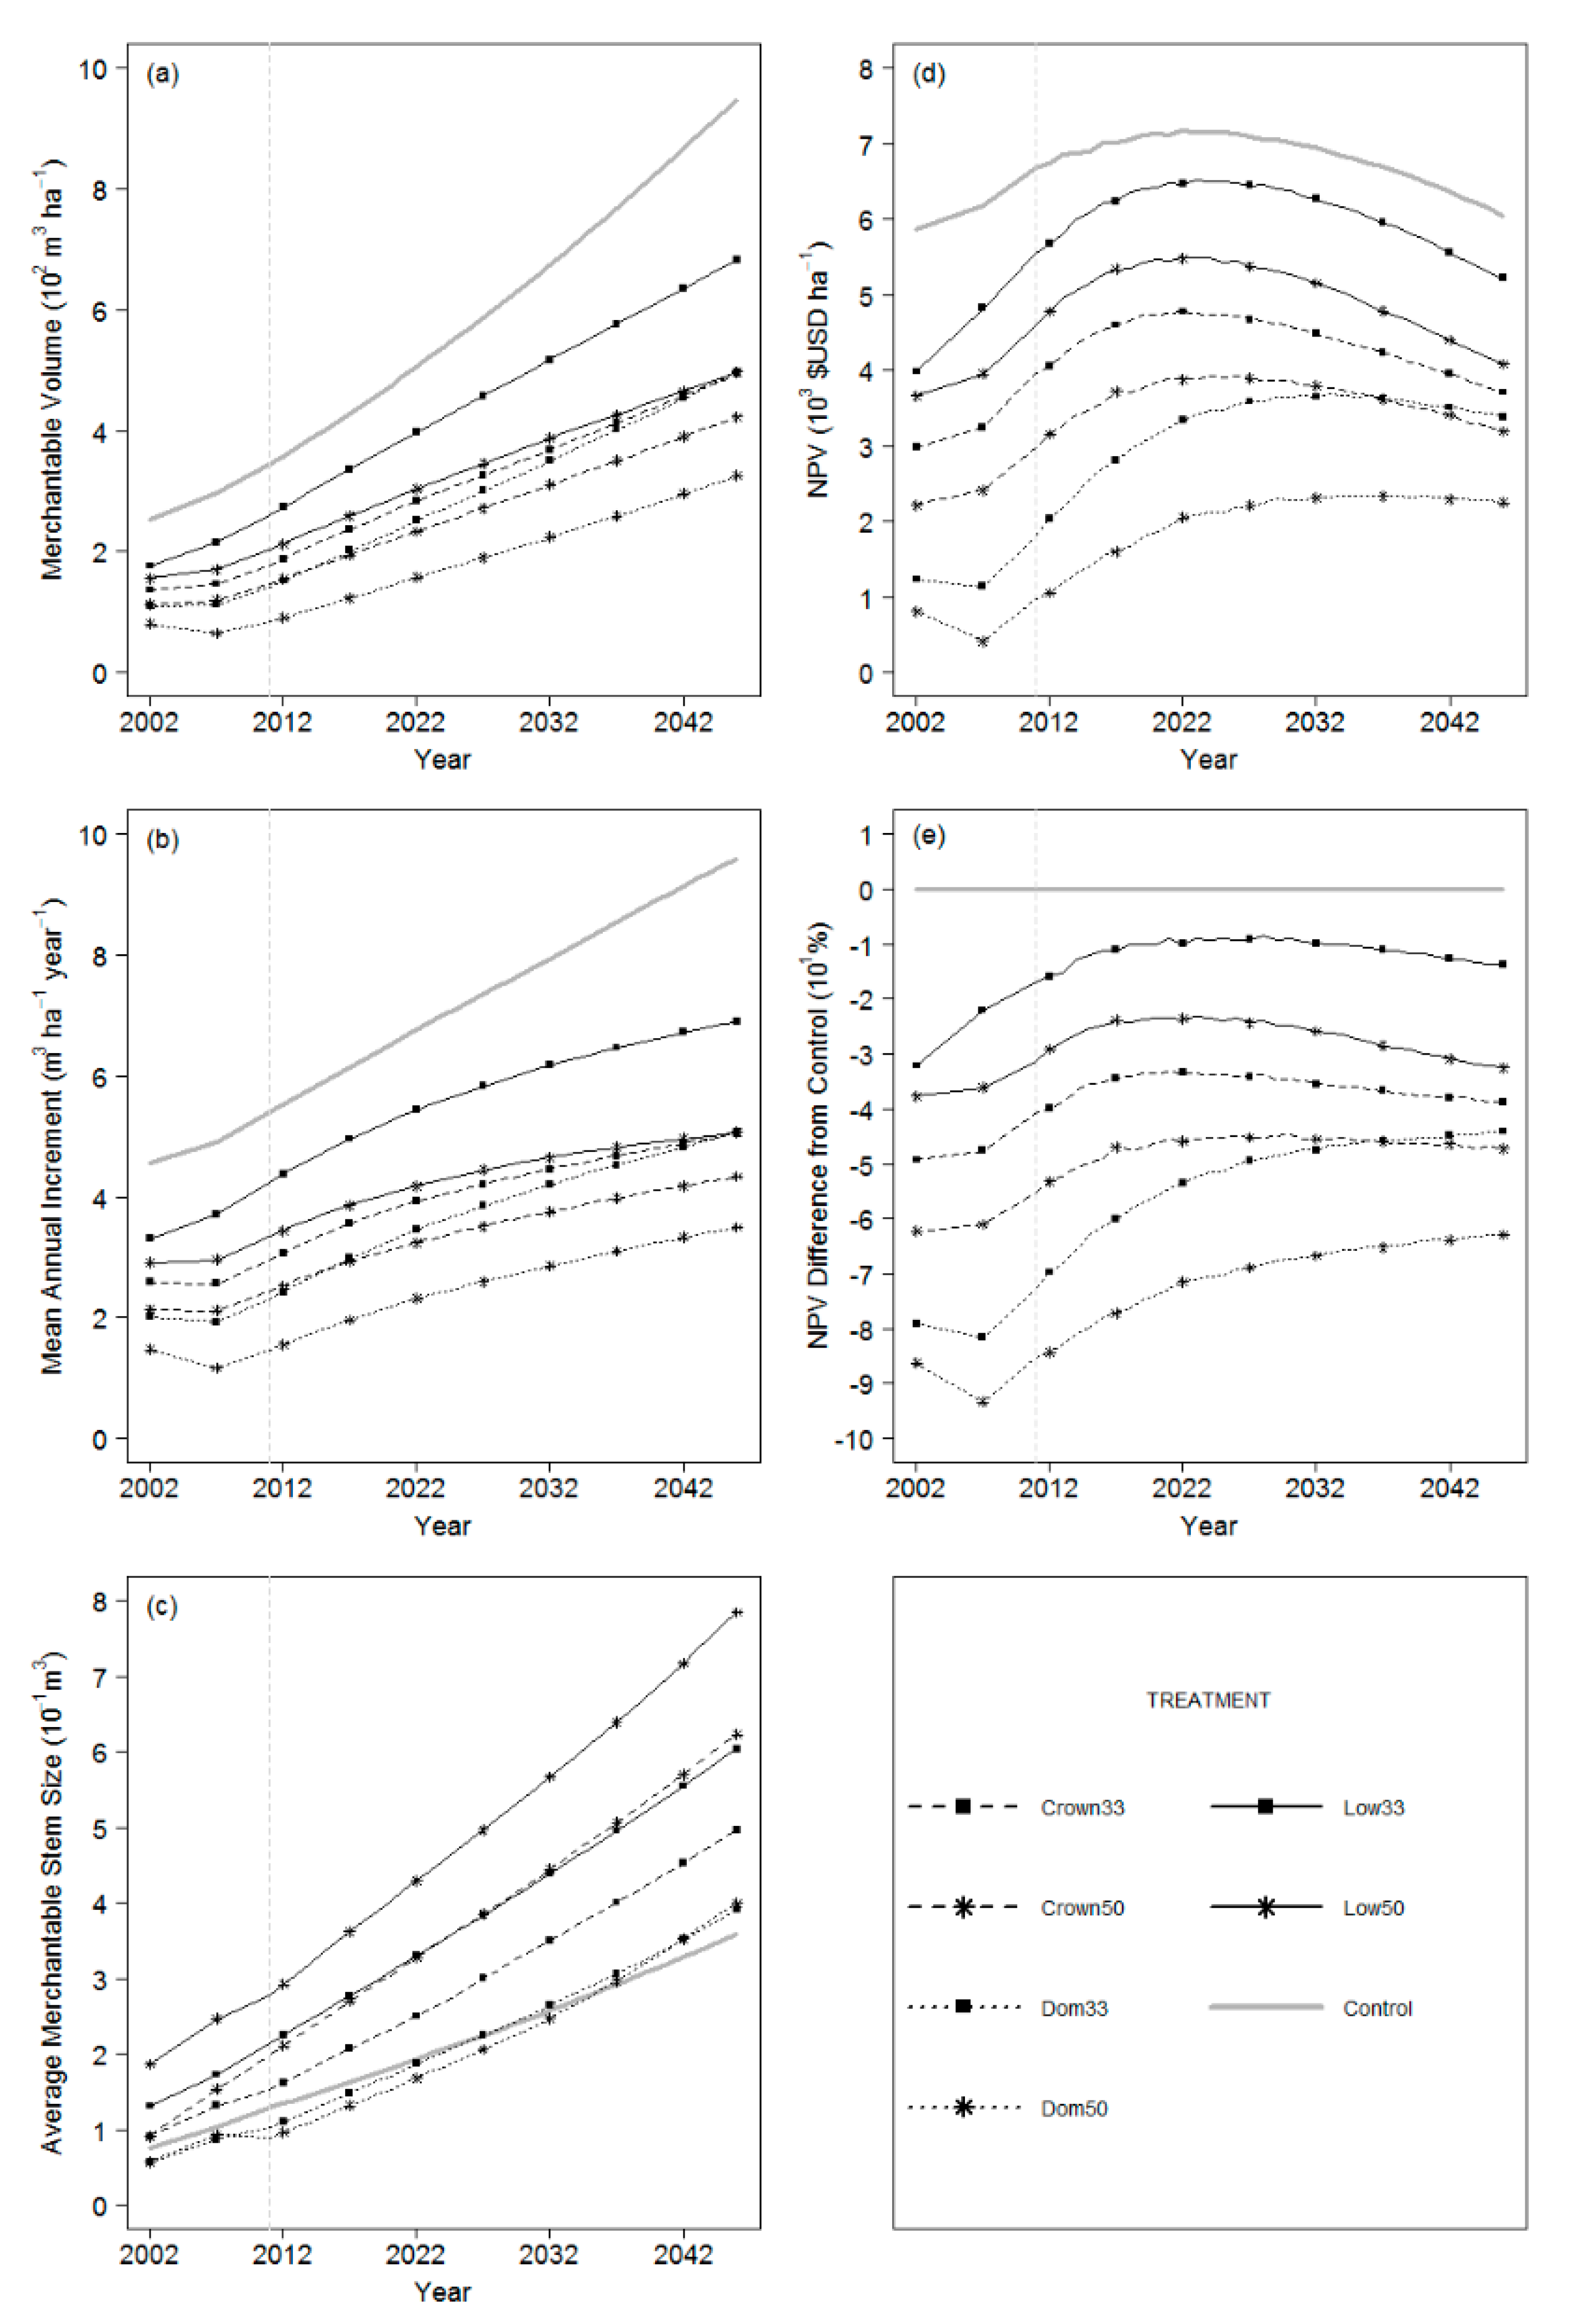
Figure 3.
Maximum net present value (NPV) for all treatments and control including error bars (one standard deviation). Letters above the bars indicate statistically significant differences between treatments and control.
Figure 3.
Maximum net present value (NPV) for all treatments and control including error bars (one standard deviation). Letters above the bars indicate statistically significant differences between treatments and control.

Figure 4.
Stand age at time of maximum net present value (NPV) for all treatments and control including error bars (one standard deviation). Letters above the bars indicate statistically significant differences between treatments and control.
Figure 4.
Stand age at time of maximum net present value (NPV) for all treatments and control including error bars (one standard deviation). Letters above the bars indicate statistically significant differences between treatments and control.

Figure 5.
Average merchantable stem size for all treatments and control including error bars (one standard deviation). Letters above the bars indicate statistically significant differences between treatments and control.
Figure 5.
Average merchantable stem size for all treatments and control including error bars (one standard deviation). Letters above the bars indicate statistically significant differences between treatments and control.
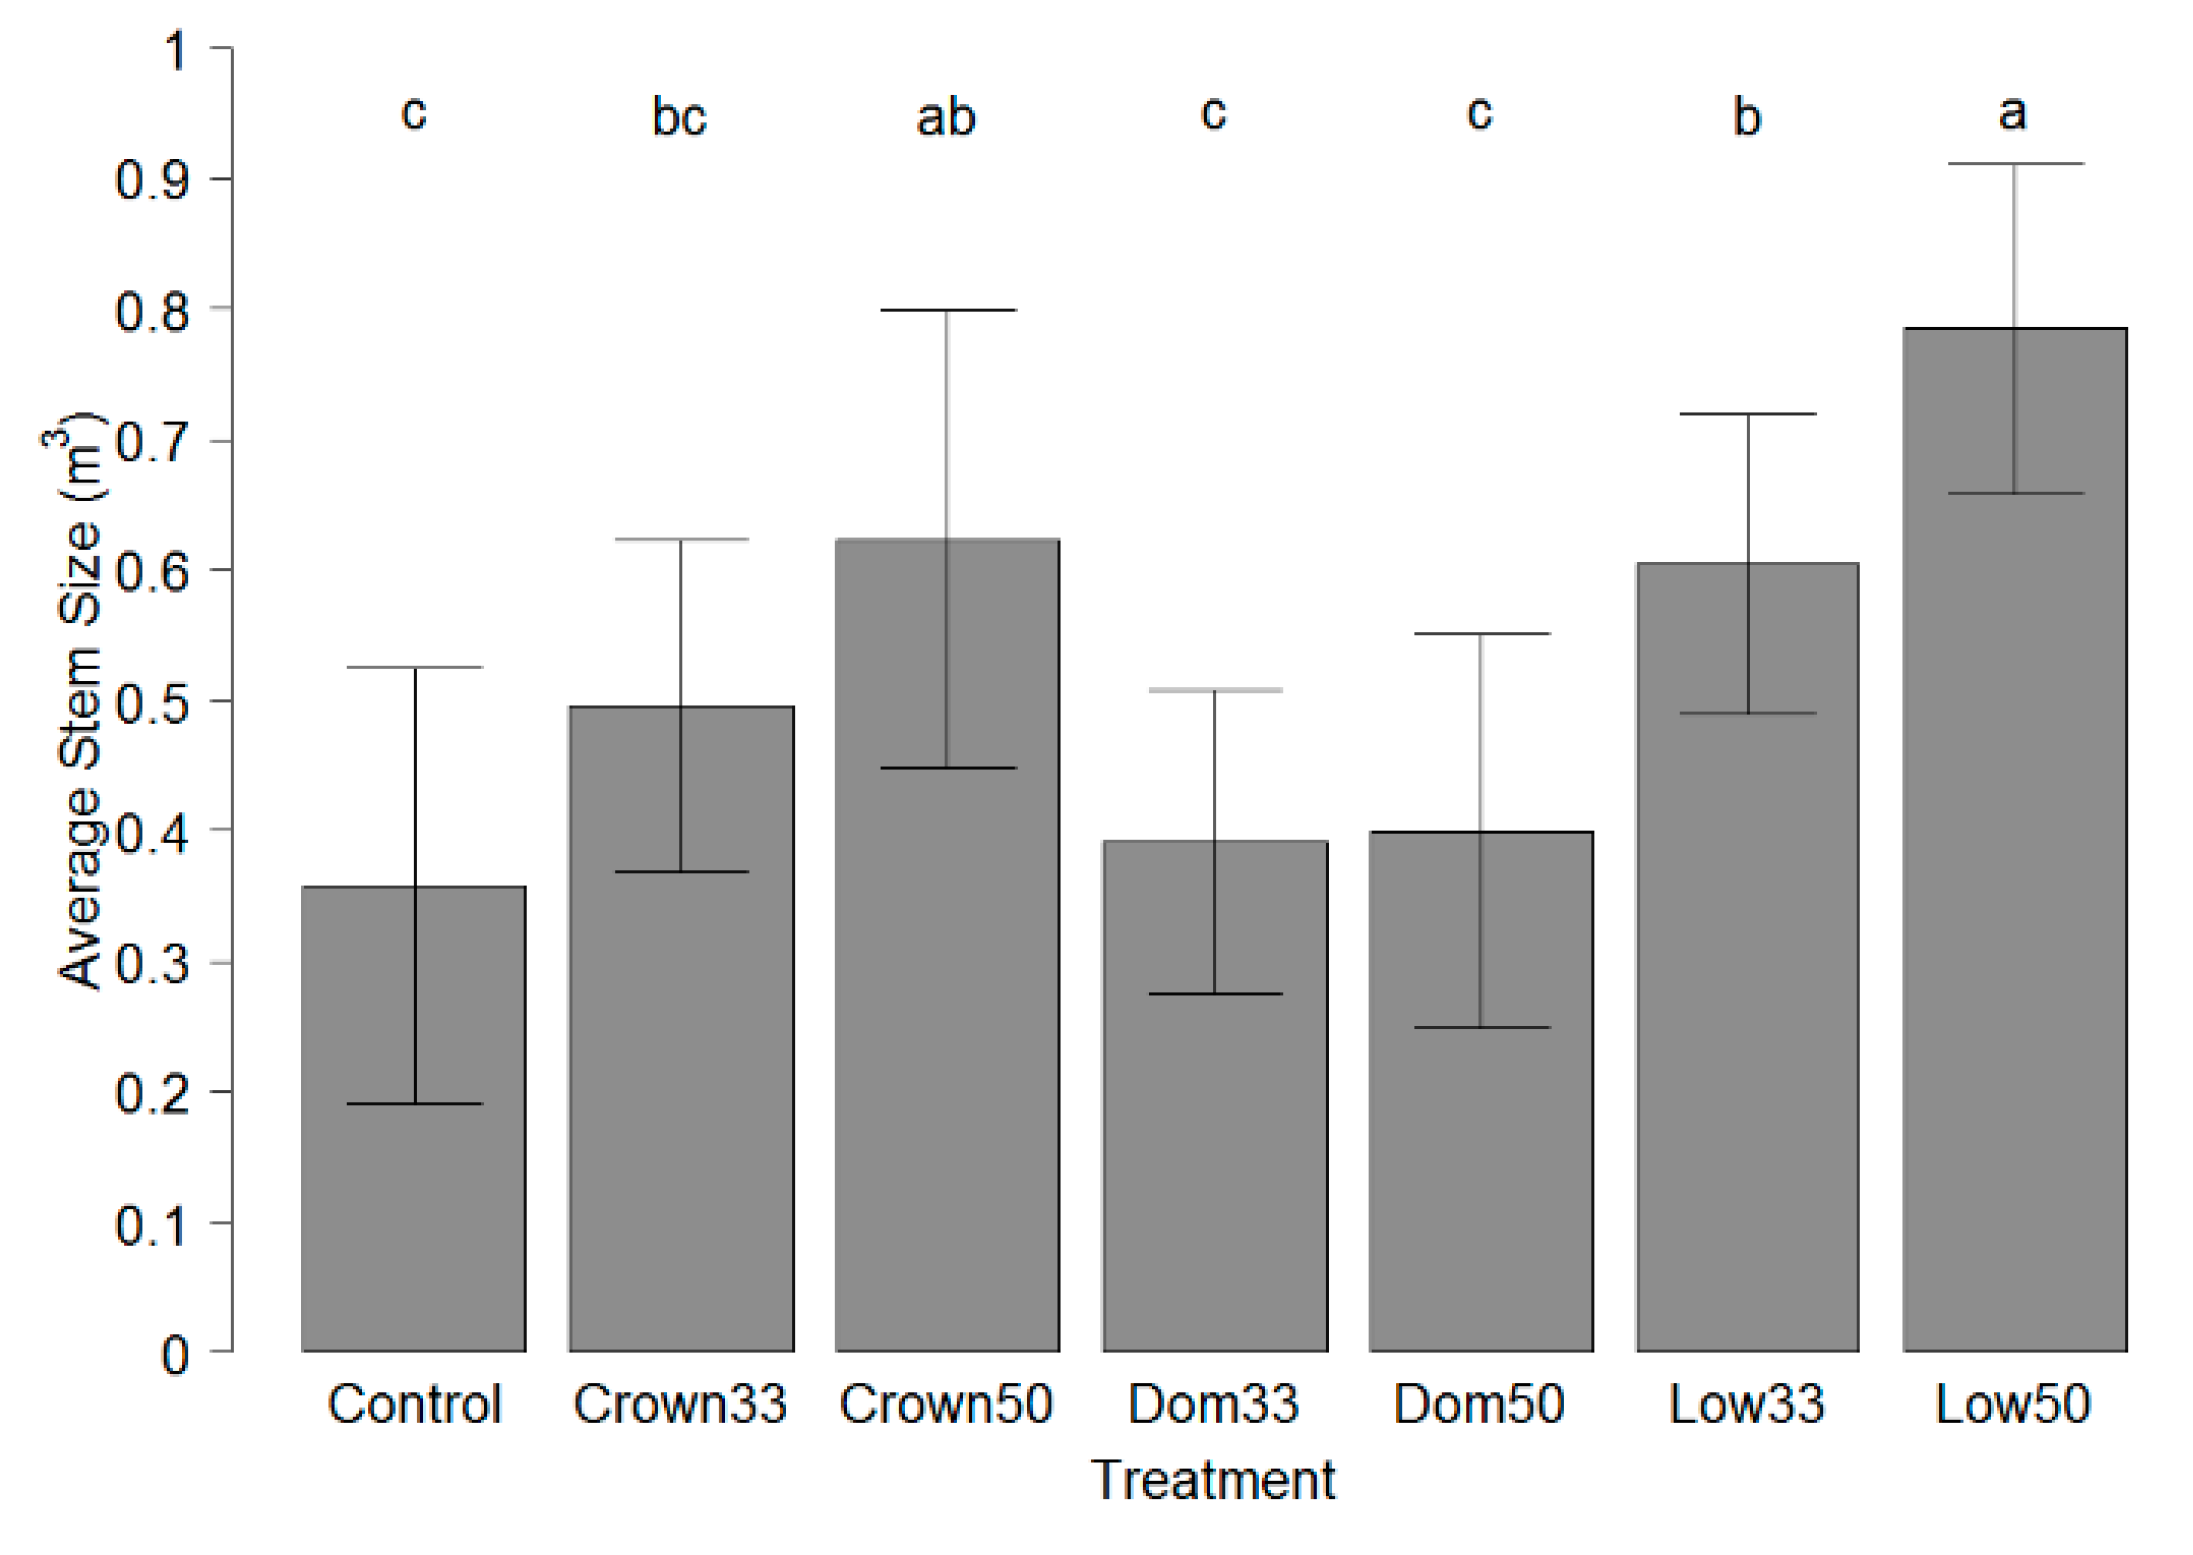
Figure 6.
Net present value (NPV; USD$ ha−1) for six treatments and control using six different interest rates. Treatments: (a) Control; (b) light low thinning (Low33); (c) light crown thinning (Crown33); (d) light dominant thinning (Dom33); (e) heavy low thinning (Low50); (f) heavy crown thinning (Crown50); (g) heavy dominant thinning (Dom50). The vertical dashed line marks the split between observed data to the left and projected data to the right.


Table 1.
Description of thinning treatments.
| Treatment | Description |
|---|---|
| Crown33 | Crown thinning with 33% relative density reduction |
| Crown50 | Crown thinning with 50% relative density reduction |
| Dom33 | Dominant thinning with 33% relative density reduction |
| Dom50 | Dominant thinning with 50% relative density reduction |
| Low33 | Low thinning with 33% relative density reduction |
| Low50 | Low thinning with 50% relative density reduction |
| Control | Unthinned |
Table 2.
Description of study sites at time of Commercial Thinning Research Network (CTRN) establishment.
Table 2.
Description of study sites at time of Commercial Thinning Research Network (CTRN) establishment.
| Site Name | BH Age (years) a | Elevation (m) | Aspect (°) | Briggs Site Class b | Site Index (m) c | Year of CT d | TPH e | BA f (m2 ha−1) | QMD g (cm) |
|---|---|---|---|---|---|---|---|---|---|
| Golden Road (GR) | 57 | 145–149 | 230 | 2 | 12.9 | 2000 | 3115 | 38.8 | 12.7 |
| Harlow Road (HR) | 70 | 154–155 | 150 | 4 | 12.1 | 2002 | 2072 | 40.2 | 15.7 |
| Rump Road (RR) | 40 | 640–652 | 122 | 4 | 16.4 | 2002 | 5834 | 45.9 | 9.9 |
| St. Aurelie (SA) | 34 | 415–422 | 92 | 4 | 17.6 | 2001 | 5727 | 39.0 | 9.4 |
| Schoolbus Road (SC) | 65 | 521–529 | 140 | 4 | 13.2 | 2001 | 3470 | 47.3 | 13.2 |
| Sarah’s Road (SR) | 54 | 475–485 | 159 | 2 | 12.6 | 2001 | 4404 | 48.2 | 12.2 |
a BH, breast height age is at time of CTRN establishment in 2000 and 2001. b Briggs site class on a 1–5 ordinal scale with a lower value representing a better site [30]. c Site index, base year 50 for dominant red spruce and balsam fir [13]. d CT, commercial thinning. e TPH, stand density in trees per hectare [26]. f BA, basal area [26]. g QMD, quadratic mean diameter [26].
Table 3.
Stumpage prices for spruce/fir pulpwood, studwood, and sawlogs, as well as hemlock (Tsuga Canadensis (L.) Carrière) sawlogs as used for CT revenue estimation. Conversion from $ tonne−1 to $ m−3 was done using a conversion factor of 0.87 tonnes m−3.
Table 3.
Stumpage prices for spruce/fir pulpwood, studwood, and sawlogs, as well as hemlock (Tsuga Canadensis (L.) Carrière) sawlogs as used for CT revenue estimation. Conversion from $ tonne−1 to $ m−3 was done using a conversion factor of 0.87 tonnes m−3.
| CT Year | Pulpwood $ m−3 | Studwood $ m−3 | Sawlogs $ m−3 | Hemlock Sawlogs $ m−3 |
|---|---|---|---|---|
| 2000a | 8.70 | 15.66 | 26.93 | 10.51 |
| 2001b | 8.28 | 16.53 | 23.61 | 10.15 |
| 2002c | 7.46 | 12.18 | 23.40 | 9.79 |
Table 4.
ANOVA results for fixed and random effects on the effect of treatment on (a) maximum net present value (NPV); (b) stand age at time of maximum NPV; and (c) average stem size.
Table 4.
ANOVA results for fixed and random effects on the effect of treatment on (a) maximum net present value (NPV); (b) stand age at time of maximum NPV; and (c) average stem size.
| Fixed Effects | Random Effects | |||||||
|---|---|---|---|---|---|---|---|---|
| n | df | F value | p value | Variable | SD | Variance | % Explained | |
| (a) Maximum NPV | ||||||||
| Intercept | 1 | 30 | 137.831 | <0.001 | SITE | 881.937 | 777,813 | 28 |
| Treatment | 6 | 30 | 8.470 | <0.001 | PLOT (in SITE) | 1327.377 | 1,761,930 | 62 |
| Residual | 532.820 | 283,897 | 10 | |||||
| (b) Stand Age at Time of Maximum NPV | ||||||||
| Intercept | 1 | 30 | 160.489 | <0.001 | SITE | 15.122 | 229 | 87 |
| Treatment | 6 | 30 | 6.172 | <0.001 | PLOT (in SITE) | 5.062 | 26 | 10 |
| Residual | 2.795 | 8 | 3 | |||||
| (c) Average Merchantable Stem Size | ||||||||
| Intercept | 1 | 30 | 153.455 | <0.001 | SITE | 0.095 | 0.009 | 45 |
| Treatment | 6 | 30 | 13.305 | <0.001 | PLOT (in SITE) | 0.096 | 0.009 | 46 |
| Residual | 0.041 | 0.002 | 9 | |||||
Note: n, sample size; df, degrees of freedom; SD, standard deviation.
© 2017 by the authors. Licensee MDPI, Basel, Switzerland. This article is an open access article distributed under the terms and conditions of the Creative Commons Attribution (CC BY) license (http://creativecommons.org/licenses/by/4.0/).
Share and Cite
MDPI and ACS Style
Hiesl, P.; Crandall, M.S.; Weiskittel, A.R.; Kizha, A.R. Assessing Alternative Silvicultural Prescriptions for Mid-Rotation, Unthinned, Spruce-Fir Stands in Maine. Forests 2017, 8, 370. https://doi.org/10.3390/f8100370
AMA Style
Hiesl P, Crandall MS, Weiskittel AR, Kizha AR. Assessing Alternative Silvicultural Prescriptions for Mid-Rotation, Unthinned, Spruce-Fir Stands in Maine. Forests. 2017; 8(10):370. https://doi.org/10.3390/f8100370
Chicago/Turabian StyleHiesl, Patrick, Mindy S. Crandall, Aaron R. Weiskittel, and Anil R. Kizha. 2017. "Assessing Alternative Silvicultural Prescriptions for Mid-Rotation, Unthinned, Spruce-Fir Stands in Maine" Forests 8, no. 10: 370. https://doi.org/10.3390/f8100370
Note that from the first issue of 2016, this journal uses article numbers instead of page numbers. See further details here.