Environmental Influences on Forest Fire Regime in the Greater Hinggan Mountains, Northeast China


1
Department of Geography, University of South Carolina, Columbia, SC 29208, USA
2
College of Geography Sciences, Harbin Normal University, Harbin 150025, China
3
Key Laboratory of Remote Sensing Monitoring of Geographic Environment, College of Heilongjiang Province, Harbin Normal University, Harbin 150025, China
*
Author to whom correspondence should be addressed.
Forests 2017, 8(10), 372; https://doi.org/10.3390/f8100372
Submission received: 14 June 2017
/
Revised: 23 September 2017
/
Accepted: 26 September 2017
/
Published: 30 September 2017
(This article belongs to the Special Issue Wildland Fire, Forest Dynamics, and Their Interactions)
Abstract
:Fires are the major disturbances in the Greater Hinggan Mountains, the only boreal forest in Northeast China. A comprehensive understanding of the fire regimes and influencing environmental parameters driving them from small to large fires is critical for effective forest fire prevention and management. Assisted with satellite imagery, topographic data, and climatic records in this region, this study examines its fire regimes in terms of ignition causes, frequencies, seasonality, and burned sizes in the period of 1980–2005. We found an upward trend for fire occurrences and burned areas and an elongated fire season over the three decades. The dates of the first fire in a year did not vary largely but those of the last fire were significantly delayed. Topographically, spring fires were prevalent throughout the entire region, while summer fires mainly occurred at higher elevations under severe drought conditions. Fall fires were mostly human-caused in areas at lower elevations with gentle terrains. An ordinal logistic regression revealed temperature and elevation were both significant factors to the fire size severity in spring and summer. Other than that, environmental impacts were different. Precipitation in the preceding year greatly influenced spring fires, while summer fires were significantly affected by wind speed, fuel moisture, and human accessibility. An important message from this study is that distinct seasonal variability and a significantly increasing number of summer and fall fires since the mid-1990s suggest a changing fire regime of the boreal forests in the study area. The observed and modeled results could provide insights on establishing a sustainable, localized forest fire prevention strategy in a seasonal manner.
1. Introduction
Forests are important natural resources and play a significant role in regulating climate and the carbon cycle. Boreal forests, also known as Taiga in high northern latitudes across North America and Eurasia, account for 29% of the world’s forests, and store 37% of global terrestrial carbon [1,2]. Forest fire is primarily a natural process in boreal ecosystems [3]. With a low decomposition rate, the post-fire productivity of boreal forests could decline for up to 80 years before the organic leaf litter layer is reestablished [4]. Under the pressure of climate warming and accelerated human activities, fire behavior in boreal forests has been found to be undergoing dramatic changes [5]. It is crucial to understand these changes of fire characteristics and to identify the driving factors for sustainable forest management.
Fire regime defines the combined characteristics of fire in terms of its frequency of occurrences, size, intensity, seasonality, cause, and severity. Instead of considering a forest fire as a singular random event, fire regime treats it as a landscape-level spatial process, which helps us understand the forest fire and its causal factors at a larger spatial extent in a climate change context [6,7]. The interaction of top-down and bottom-up factors governs forest fire regimes over a range of spatial and temporal scales. The bottom-up controls usually act at fine scales by regulating fire physics and behavior [8]. For instance, fire propagation is mainly controlled by weather, local terrain plus fuel load, moisture content, and fuel continuity. Topographic factors (i.e., elevation, slope, and aspect) also strongly influence the forest environment in aspects of potential incident radiation and temperature. On the other hand, climate acts as a top-down control, which impacts fire occurrence through intra- and inter-annual climatic variations. Studies have shown that the impact of intra-annual precipitation variability on fire frequency is greater than the total annual precipitation in forests of the eastern United States [9]. It is not clear whether the top-down or bottom-up factors are leading factors. In years of extreme drought, climate would create weather and fuel conditions to overtake the bottom-up controls, allowing fires to cross natural barriers like streams or roads. Controlling factors vary in different biophysical scenarios and, sometimes, are a combination of multiple factors [10]. Anthropogenic forces also play a significant role in influencing forest fire regime. It is reported that more human-induced fires in Russian boreal forests have occurred due to the lack of control and ineffectual fire management policies since the creation of the Russian Federation [11]. In Northeast China, extensive logging increases the forest vulnerability to future burning and the half-century fire suppression policy has greatly altered its fire patterns [12]. It is challenging to understand how these factors interact to regulate the fire regime.
Boreal forests of China are mainly distributed in the Greater Hinggan Mountains that are located at the southern end of Siberian boreal forest. Fire regimes vary spatially across the region due to different species compositions, physiographic conditions, climate characteristics, and characteristics of the local economies. Intensive studies have been conducted to examine the controlling factors on fires in this region. For instance, Wu et al. found that climate was the primary factor influencing fire occurrence, while human activities were the secondary control [13]. Another study from Hu et al. reported that climatic factors were dominant drivers for lightning-caused fires, but not for human-caused ones [14]. Three fire environment zones were identified in this area through spatial clustering of environmental variables [15]. Chang et al. utilized a binary logistic regression to predict the fire occurrence patterns and to assess fire risks in Heilongjiang Province, China [16]. Forest fire regime and the surrounding environments usually exhibit dramatic seasonal variations; however, few studies have examined it from this perspective.
Forest fires in the Greater Hinggan Mountains have been analyzed in a seasonal manner, with spring season from March to June, summer season from July to August, and fall season starting in September and generally lasting to October when it begins to snow [17]. Moreover, extremely large fires, sometimes named mega fires, are catastrophic and their impacts to the landscape are complex and far reaching [18]. Usually a small number of large fires constitute the majority of burned areas [19]. Studies have also shown that fire burning sizes varied with environmental conditions such as vegetation, topography, and weather [20,21]. It is necessary to examine how these environmental factors regulate the fires in terms of fire sizes in different seasons, which could be of great help for effective fire control in this remote, boreal forest.
However, there exist some challenges to carry out such quantitative fire studies at the landscape scale. One is the data availability. Taking fuel conditions as an example, it is difficult to obtain actual in-field fuel conditions when a fire occurs. Remote sensing imagery becomes a promising data source for its frequent updating and synoptic coverage. Studies have shown that vegetation index is correlated with fuel moisture content. For example, the Normalized Difference Vegetation Index (NDVI) products from the Advanced Very High Resolution Radiometer (AVHRR) [22] and Moderate Resolution Imaging Spectroradiometer (MODIS) [23] imagery have been successfully used to estimate fuel moisture content. Therefore, vegetation index could serve as a good proxy for fuel moisture at the landscape scale. Another challenge is the difficulty of quantifying human impacts on fires. In limited studies, distance to the most nearby road was used to approximate the accessibility to a fire location [24]. Road network density could be an indicator of the intensity of human activities.
The primary goal of this study is to identify the forest fire regimes in the Greater Hinggan Mountains, and to characterize the controlling environmental factors in spring, summer, and fall seasons. Integrating multiple sources of data sets, this study analyzes how these factors regulate the fire severity through a statistical analysis approach in this boreal region.
2. Materials and Methods
2.1. Study Area
The Greater Hinggan Mountains, covering an approximate area of 7.3 million ha in Northeast China (Figure 1), is one of the largest national forests of China. It lies between the Inner Mongolia Plateau and the Northeast China Plain, covering a large geographic area between 51°30′–53°33′N and 121°10′–127°08′E. It comprises about 10% of the boreal ecosystems in the Northern Eurasia region [25]. Located within the sub-arctic climatic zone, winters of the study area are long, dry, and cold. The annual average temperature ranges from −4 °C to −2 °C and annual precipitation ranges from 400 to 500 mm, with almost half of the precipitation falling in summer, especially in July and August [25]. As a southern extension of Eurasia’s boreal ecosystem, vegetation is dominated with deciduous coniferous tree species. From the 1:1,000,000 China Vegetation Atlas at the Environmental and Ecological Science Data Center for West China (http://westdc.westgis.ac.cn), larch (Larix gmelini) covers 55.4% of the study area. Other tree species include evergreen coniferous such as Mongolian pine (Pinus sylvestris var. mongolica) and spruce (Picea koraiensis), and deciduous broadleaved trees such as birch (Betula platphylla) and aspen (Populus tremuloides). Non-forest land covers are limited, mostly in forms of herbaceous grasses and shrubs in the valleys and croplands in the plains at lower elevations.
The study area is one of the major timber production bases in China. It is composed of five counties. From northwest to southeast are Mohe, Tahe, Huzhong, Xinlin, and Huma counties (as marked in Figure 1). Mohe has the highest forest cover of 93.3% across the county, while Huma has the least. Huma is the only county relying on an agriculture-based economy. The population in the study area is approximately 500,000 according to the 2010 census from the National Bureau Statistics of China. Tahe has the largest population, followed by Mohe and Huma.
2.2. Data Sets
2.2.1. Historical Fire Records
The 26-year fire data (1980–2005) in the Greater Hinggan Mountains were obtained from the Forest Fire Prevention Office, China Forest Bureau. A total of 404 fires were recorded in 1980–2005. Points of the recorded fires are marked in Figure 1. These fires were real-time observations by field staff at China Forest Bureau. Attributes of a fire record include: fire location, time and date of ignition (start date) and extinction (end date), burned size (burned area of a fire), and cause of ignition. Complying with strict fire prevention policies in Northeast China, fires were often rapidly extinguished. The average time to put out a fire was 26.33 h in the study area, although there was an exception of the “Black Dragon” fire on 6 May–2 June 1987, the largest fire in this area that burned 1.3 million ha of forests in 26 days. Among all fire records, the lightning-caused fires accounted for 63% (254 fires); 29% (117 fires) were caused by human activities such as smoking, debris burning, equipment usage, and short circuit of power lines. A small portion (8%) of the records were fires with unknown causes (34 fires).
2.2.2. Topography and Road Network
The digital elevation model (DEM) was acquired from the Shuttle Radar Topography Mission (SRTM) global products at 1 arc-second cell size (approximately 30 m). As shown in Figure 1, the terrain of the study area is mountainous, rising from east to west at elevations ranging from 130 to 1500 m with an average of 560 m. Slopes and aspects of terrain surfaces were derived from the DEM. Road infrastructure is limited in this natural forest. Provincial-level and township-level road data were obtained from the National Geomatics Center of China.
2.2.3. Meteorological Data
The meteorological data were downloaded from the U.S. National Oceanic and Atmospheric Administration (NOAA) Earth System Research Laboratory. The gridded climate data, with a 0.5° (approximately 50 km) cell size, include monthly mean temperature and monthly total precipitation in the period of 1901 to 2014, and long-term mean of the monthly mean temperature and that of monthly total precipitation. Wind speed was obtained from the China Meteorological Administration. Five weather stations are evenly distributed in the study area, and have monitored daily wind speed (km/h) since the 1950s. Adopting the Beaufort Scale [26], wind speeds were transformed to the categorical scales from 1 to 5, representing breeze, moderate, strong, very strong, and stormy winds, respectively.
2.2.4. Vegetation Data
Fuel moisture condition is an essential control of forest fires. Studies have shown that vegetation index is correlated with fuel moisture content [27]. The bi-weekly NDVI product of the Global Inventory Modeling and Mapping Studies (GIMMS), namely the AVHRR GIMMS NDVI3g with a pixel size of 8 km, were obtained from the U.S. National Aeronautics and Space Administration (NASA) Earth Exchange (NEX) platform. At each fire point, the accumulative NDVI in the snow-free growing season (May–September) of the preceding year was computed to serve as a surrogate for fuel moisture condition (representing the organic layers). It was referred to as ΣNDVIpreceding in this study, with a range of [−10, 10] accumulated in the 6-month period.
2.3. Approaches
2.3.1. Data Processing
Fire records in the study area were grouped into categories of spring (March–June), summer (July–August), and fall (September–October) fires according to their igniting dates. The burned area of each fire was recorded in the fire data. Since the degrees of fire severity were not recorded in this historical data set, here we took the burned area as a measure of fire size severity, or FSS. Note that it is different from the terms fire severity and burn severity which are often interchangeably used based on the loss of soil and aboveground organic matter [28]. Following the standards of the Chinese Forest Fire Prevention Office, fires were assigned into four ordinal levels on basis of burned areas, i.e., ≤1 ha, ≤100 ha, ≤1000 ha, and >1000 ha, corresponding to low, moderate, moderate/high, and high FSS, respectively. With these FSS data, the causes of ignition (lightning vs. human) and seasonality (spring, summer, fall) of fire regimes in the study area were examined.
With the data sets described in Section 2.2, environmental parameters were extracted to assess the environmental influences on fires in the study area (Table 1). Considering fire as a natural process that behaves in a spatial extent, environmental effects on a fire are a spatial representation within this extent. For this reason, parameters in Table 1 are retrieved from an areal buffer instead of merely at a single fire point. For the fire records in this study, the average burned area was 4864 ha/fire. To extract the environmental parameters for each fire, we approximated each fire as a circular buffer centered at the fire point with a radius of 4000 m. For each fire, the environmental parameters in Table 1 are calculated as the average values within this buffer. Although the spatial coverage of the burned area of each fire was not available, the spatial average within such a buffer fairly represented the environmental variables when this fire broke out.
For topographic data, the average values of elevation, slope, and aspect within each buffer represented the three topographic parameters at this fire point. For vegetation data, the average GIMMS NDVIg3 value accumulated in May–September in the preceding year was the ΣNDVIpreceding at this fire point.
Using the province- and township-level road network, the distance from any fire point to the nearest road was extracted. We used the distance to the nearest road as a proxy of human accessibility at a given pixel. A shorter distance indicated higher accessibility and therefore higher possibility of human-induced fires. Local dirt roads and pathways were rare in this remote boreal forest with low population. Fire behavior such as fire spread at a landscape was not considered in this study. The road density map in the study area was generated using the kernel density tool in ArcGIS (Figure 2). Road density at each fire point was thus extracted.
For meteorological data, the annual climatic variables, mean annual temperature (MAT) and total annual precipitation (TAP), were extracted at each fire point. Also, studies have shown that meteorological conditions in the preceding year could directly affect fire risks for the coming spring [29]. For example, several severe spring fires broke out in Huma County in 2003, which directly followed the prolonged drought in 2002 when the annual precipitation was reduced by 50–90% in comparison to normal years [30]. Hence, in addition to the precipitation of the current year (TAPcurrent) when a fire broke out, a variable of total precipitation over the past year (TAPpreceding) was also analyzed.
To examine the weather abnormality of a fire, we calculated the ratios of monthly precipitation and temperature over their long-term means, respectively. This process effectively alleviated the spatial and temporal bias of fire points across the study area in the 26-year period. All temperature measures were converted to the unit of Kelvin. Given the and as the long-term monthly mean temperature and monthly total precipitation, the ratios at a fire point can be calculated as:
With Equations (1) and (2), the climatic data are standardized to represent local variations at the same scale. The standardization also reduces the spatial correlation between these explanatory variables and therefore, benefits the logistic modeling in the next section.
The wind speed at each fire point was assigned as the daily mean wind speed recorded at the nearest station on the ignition date.
2.3.2. Analytical Approaches
Descriptive statistics were implemented to explore the fire regimes and their decadal trends from 1980 to 2005 in terms of ignition causes, fire occurrence frequencies, fire burned areas (sizes), and seasonality. The Welch’s ANOVA tests were applied to examine the variations of the explanatory variables, including topographic factors, weather/climate conditions, human impacts, as well as fuel conditions in different seasons. For the categorical variable (wind speed), the non-parametric Kruskal-Wallis test was applied.
An ordinal logistic regression was developed to quantitatively examine the driving factors that impact the fire size severity (FSS) in each season. Defining the FSS as the response variable, y, and the environmental parameters as the set of independent explanatory variables, , the logistic regression is described as [31]:
where , with c = 4 in this study (the four FSS levels). Each cumulative logit uses all FSS levels.
Equation (3) is an ordinary logit model for a binary response in which categories 1 to form one outcome and categories to form the other [31]. The Pearson’s r and rank-based Spearman’s rho (for categorical data) are used to identify the correlation among all explanatory variables.
The rule of thumb for the sample size in a logistic regression is that there are at least 10 events for each explanatory variable [32]. Only 30 fall fires were recorded in our study period, which was not a sufficient number for model establishment with the 12 explanatory variables listed in Table 2. Therefore, the ordinal logistic analysis was only conducted for spring and summer fires.
When implementing the ordinal logistic regression in the SAS package, the response variable (FSS) was entered in a descending manner. In this way, the resulted positive coefficient of each explanatory variable (environmental parameter) represents a positive influence of this parameter, i.e., the increased value of a specific parameter produces higher odds of larger fires, and vice versa. The interpretation of the results is as follows. Assume the coefficient for a parameter in the logistic model is . For a continuous variable such as elevation, given that all other parameters in the model are held stable, with 1 m increase of elevation, the odds of a larger fire would be computed as of a smaller fire. For categorical parameters (e.g., wind speed), a base level is required. In this study, the wind speed scale 1 (i.e., breeze wind) was chosen as the base level. With 1 scale increase of wind speed, the odds of a larger fire would be over breeze wind.
A significance level α = 0.1 was set in the Wald Chi-square Test to examine the significance of the environmental parameters in the logistic model. With the ordinal logistic model, the environmental parameters that play a significant role in spring and summer fires were thus identified.
3. Results
3.1. Characteristics of Fire Regimes in the Study Area
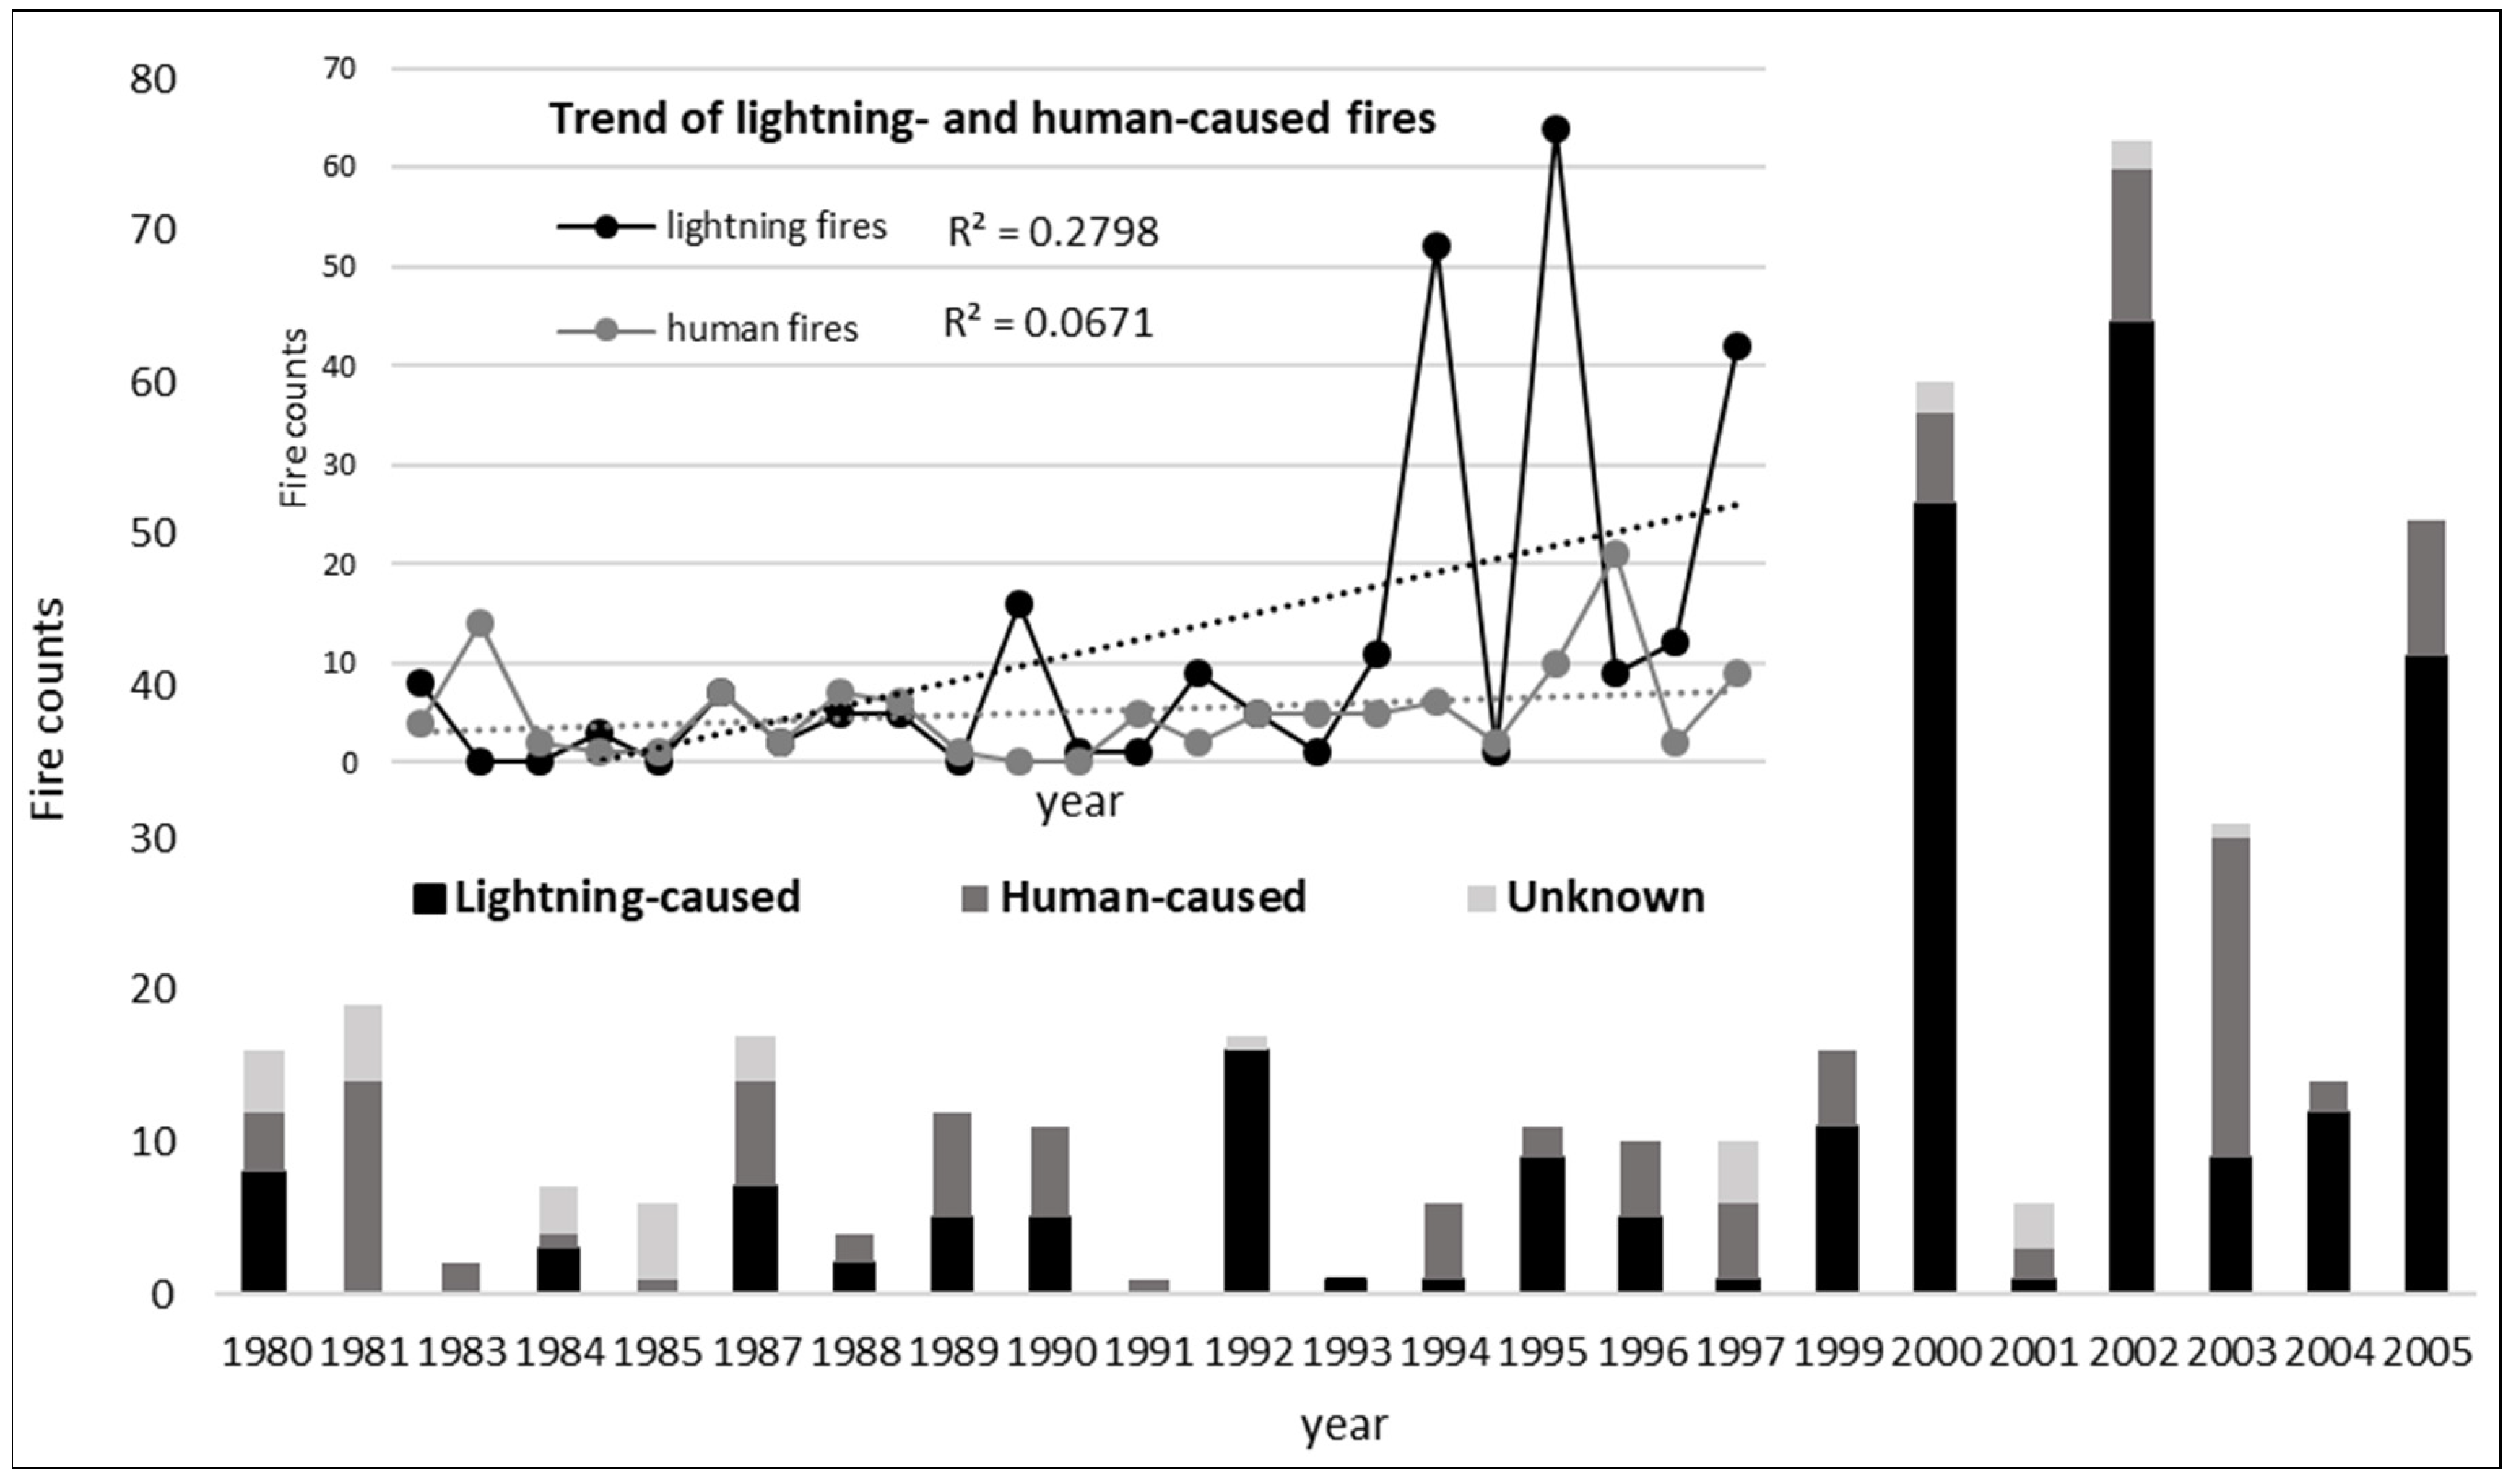
The 26-year variations of fire occurrences are plotted against three causal factors: lightning, human-induced, and unknown (Figure 3). Total occurrences showed relatively stable counts in years before 2000 and an obvious increase after then, especially in 2000, 2002–2003, and 2005.
Lightning fires were dominant in the study area, accounting for ~63% of total occurrences. For the two different causal factors, an apparent increase of lightning fires was observed (r = 0.53, p = 0.009). As shown in the inset of Figure 3, the counts of human-induced fires did not display a statistically significant change in 26 years (p = 0.23).
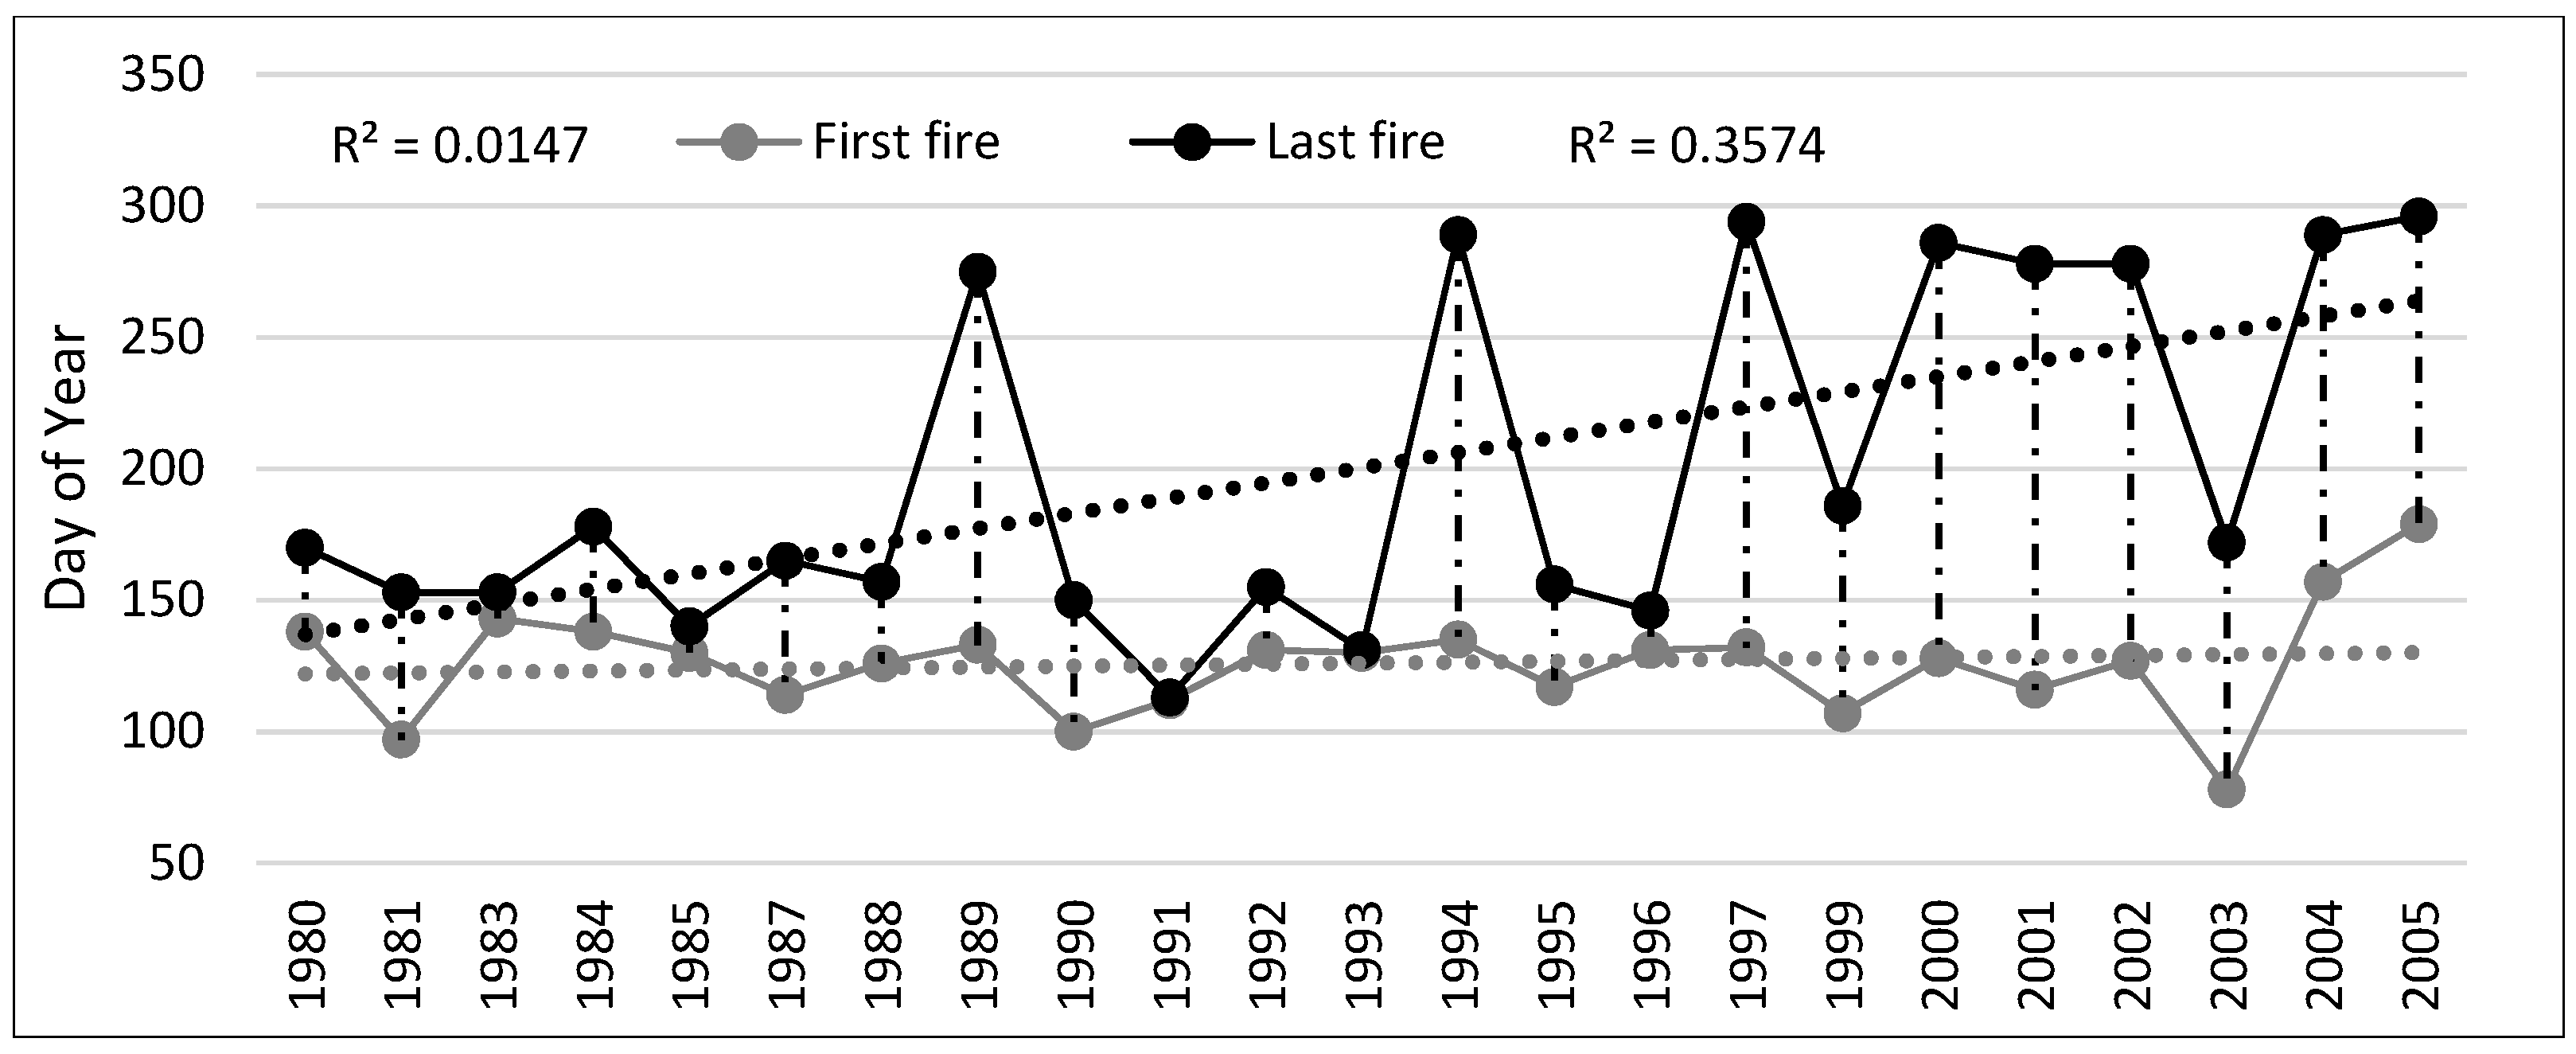
Fire season length in each year was calculated as the duration between the start date of the first fire and the end date of the last fire in this year. In Figure 4, the first fire date did not show a statistically significant trend (p = 0.58), with most outbreaks having occurred in late April. On the contrary, the last fire date showed a significantly increasing trend, revealing a prolonged fire season length in past decades (r = 0.60, p = 0.003). An apparent change to fire season length was caused by fall fires (Day of Years (DOY) > 240). In the 1980s to early 1990s, there were no fall fires except in 1989. After 2000, however, fall fires occurred every year except 2003.
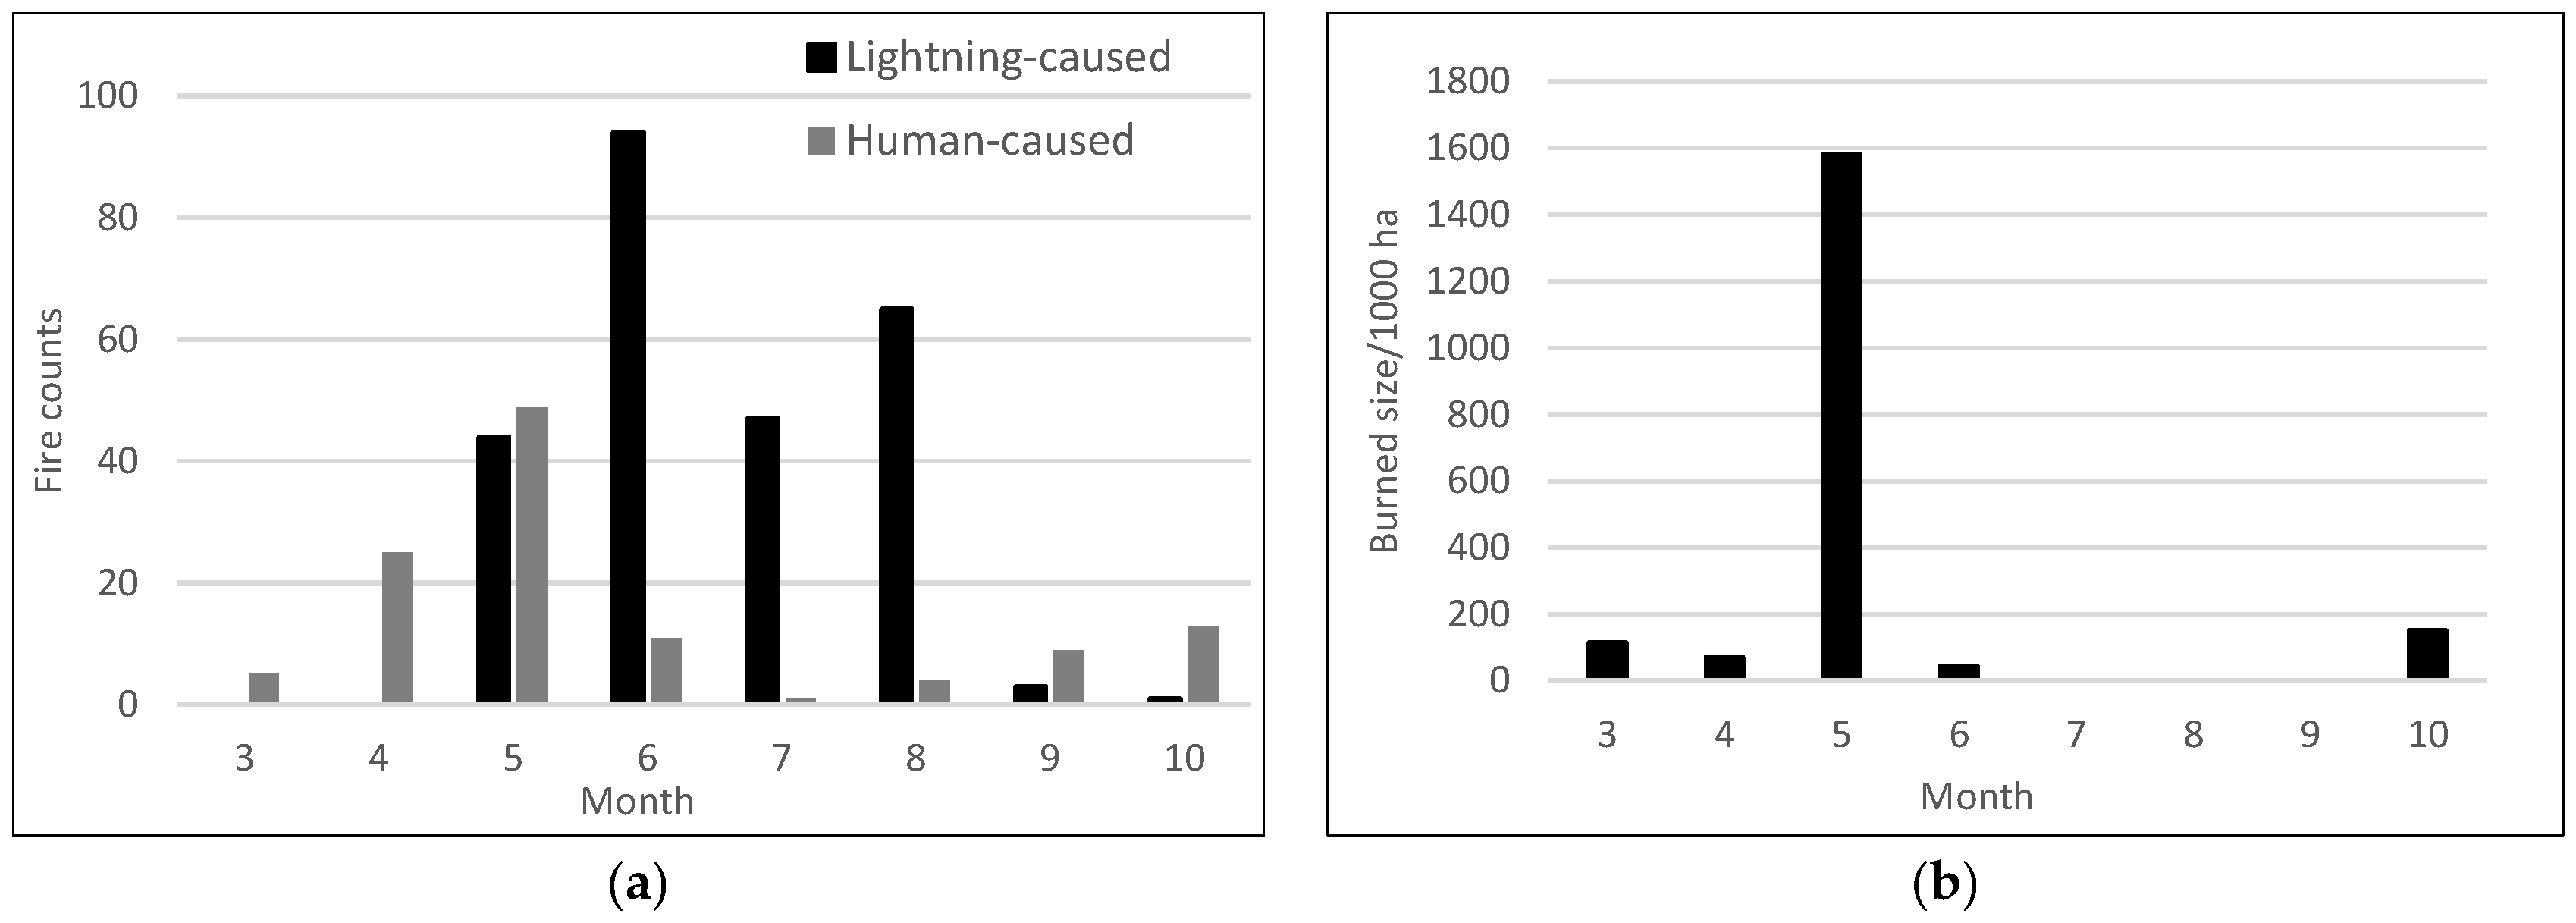
Fire seasonality (i.e., the season when a fire broke out) in the study area was analyzed with all fire records in 1980–2005. Figure 5a fairly reflects the seasonal categorization of this study which groups all fire records into spring, summer, and fall fires. Spring fires (March–June) accounted for the largest proportion (64%) of all fire counts, followed by summer fires (July–August) at 29% and fall fires (September–October) at 7%. The causal factors of fire ignition showed apparent seasonal variations. For fire counts, spring fires were fairly split between lightning-caused (54%) and human-caused (35%). Oppositely, almost all summer fires (96%) were lightning-caused, and most fall fires (74%) were human-caused. More specifically, lightning-caused fires mainly occurred from spring through summer (May to August), while human-caused fires were split between early spring (April–May) and fall (September–October). In Figure 5b, spring fires had the largest burned areas, followed by fall fires (October). The extremely high burned areas in May came from the catastrophic “Black Dragon” fire in 1987. The burned areas of summer fires were limited, probably because of ground wetness in peak growing season.
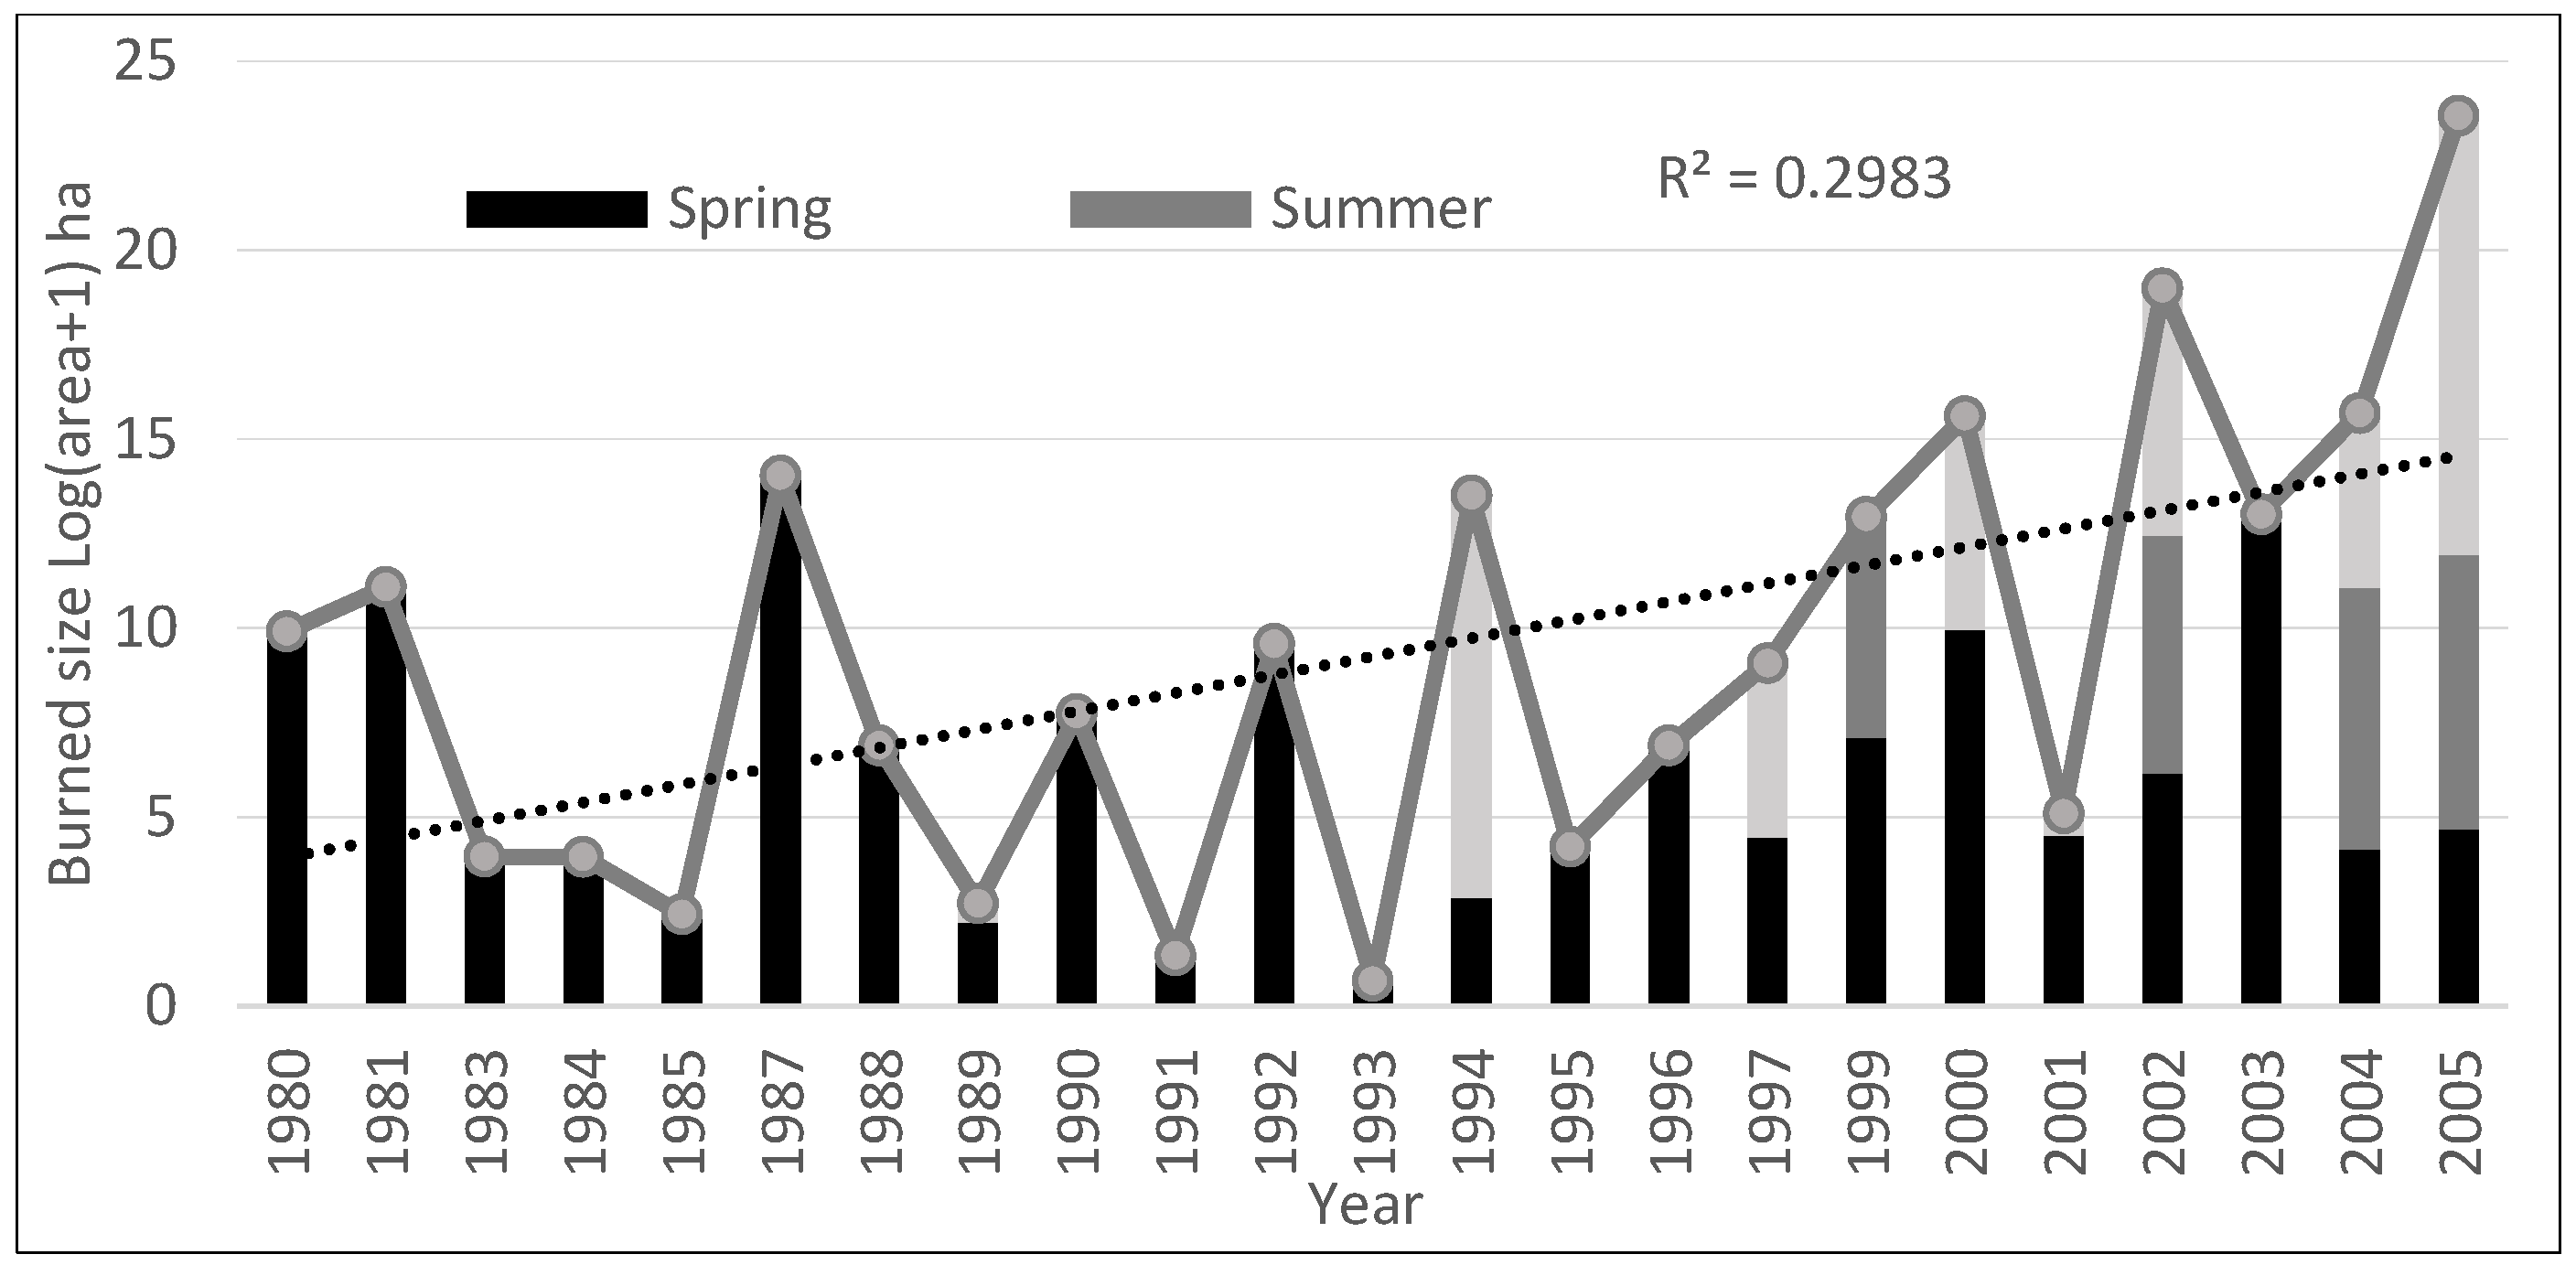
In addition to the increased fire occurrences and extended fire season length, the annual total burned area also showed an upward trend (r = 0.55, p = 0.007). In Figure 6, the area (ha) on the y-axis is transformed to logarithmic form for better visualization of the plot. Before 1994, burned areas were predominantly from spring fires. In later years, areas burned from fall fires dramatically increased. Summer fires were rare in the 1980s to 1990s, but burned large areas in 1999, 2002, and 2004–2005. While areas burned from spring fires remained relatively stable, more areas were burned from summer and fall fires in recent years, contributing to a significant increase in total burned areas. It is therefore reasonable to assume that the fire regime in the study area has changed in comparison to past decades.
The total burned area in 1980–2005 was about 1.97 million ha, and a small number of severe fires disproportionately burned excessive areas. Among the 404 fire records, 27 severe fires with high FSS (>1000 ha) composed 98.8% of the total burned area. The majority of these high FSS fires took place in spring (for example, the most catastrophic fire in 1987). From Figure 5, spring fires accounted for the largest number of fires as well as the most burned areas. No high FSS fire (>1000 ha) broke out in summer during our studied period.
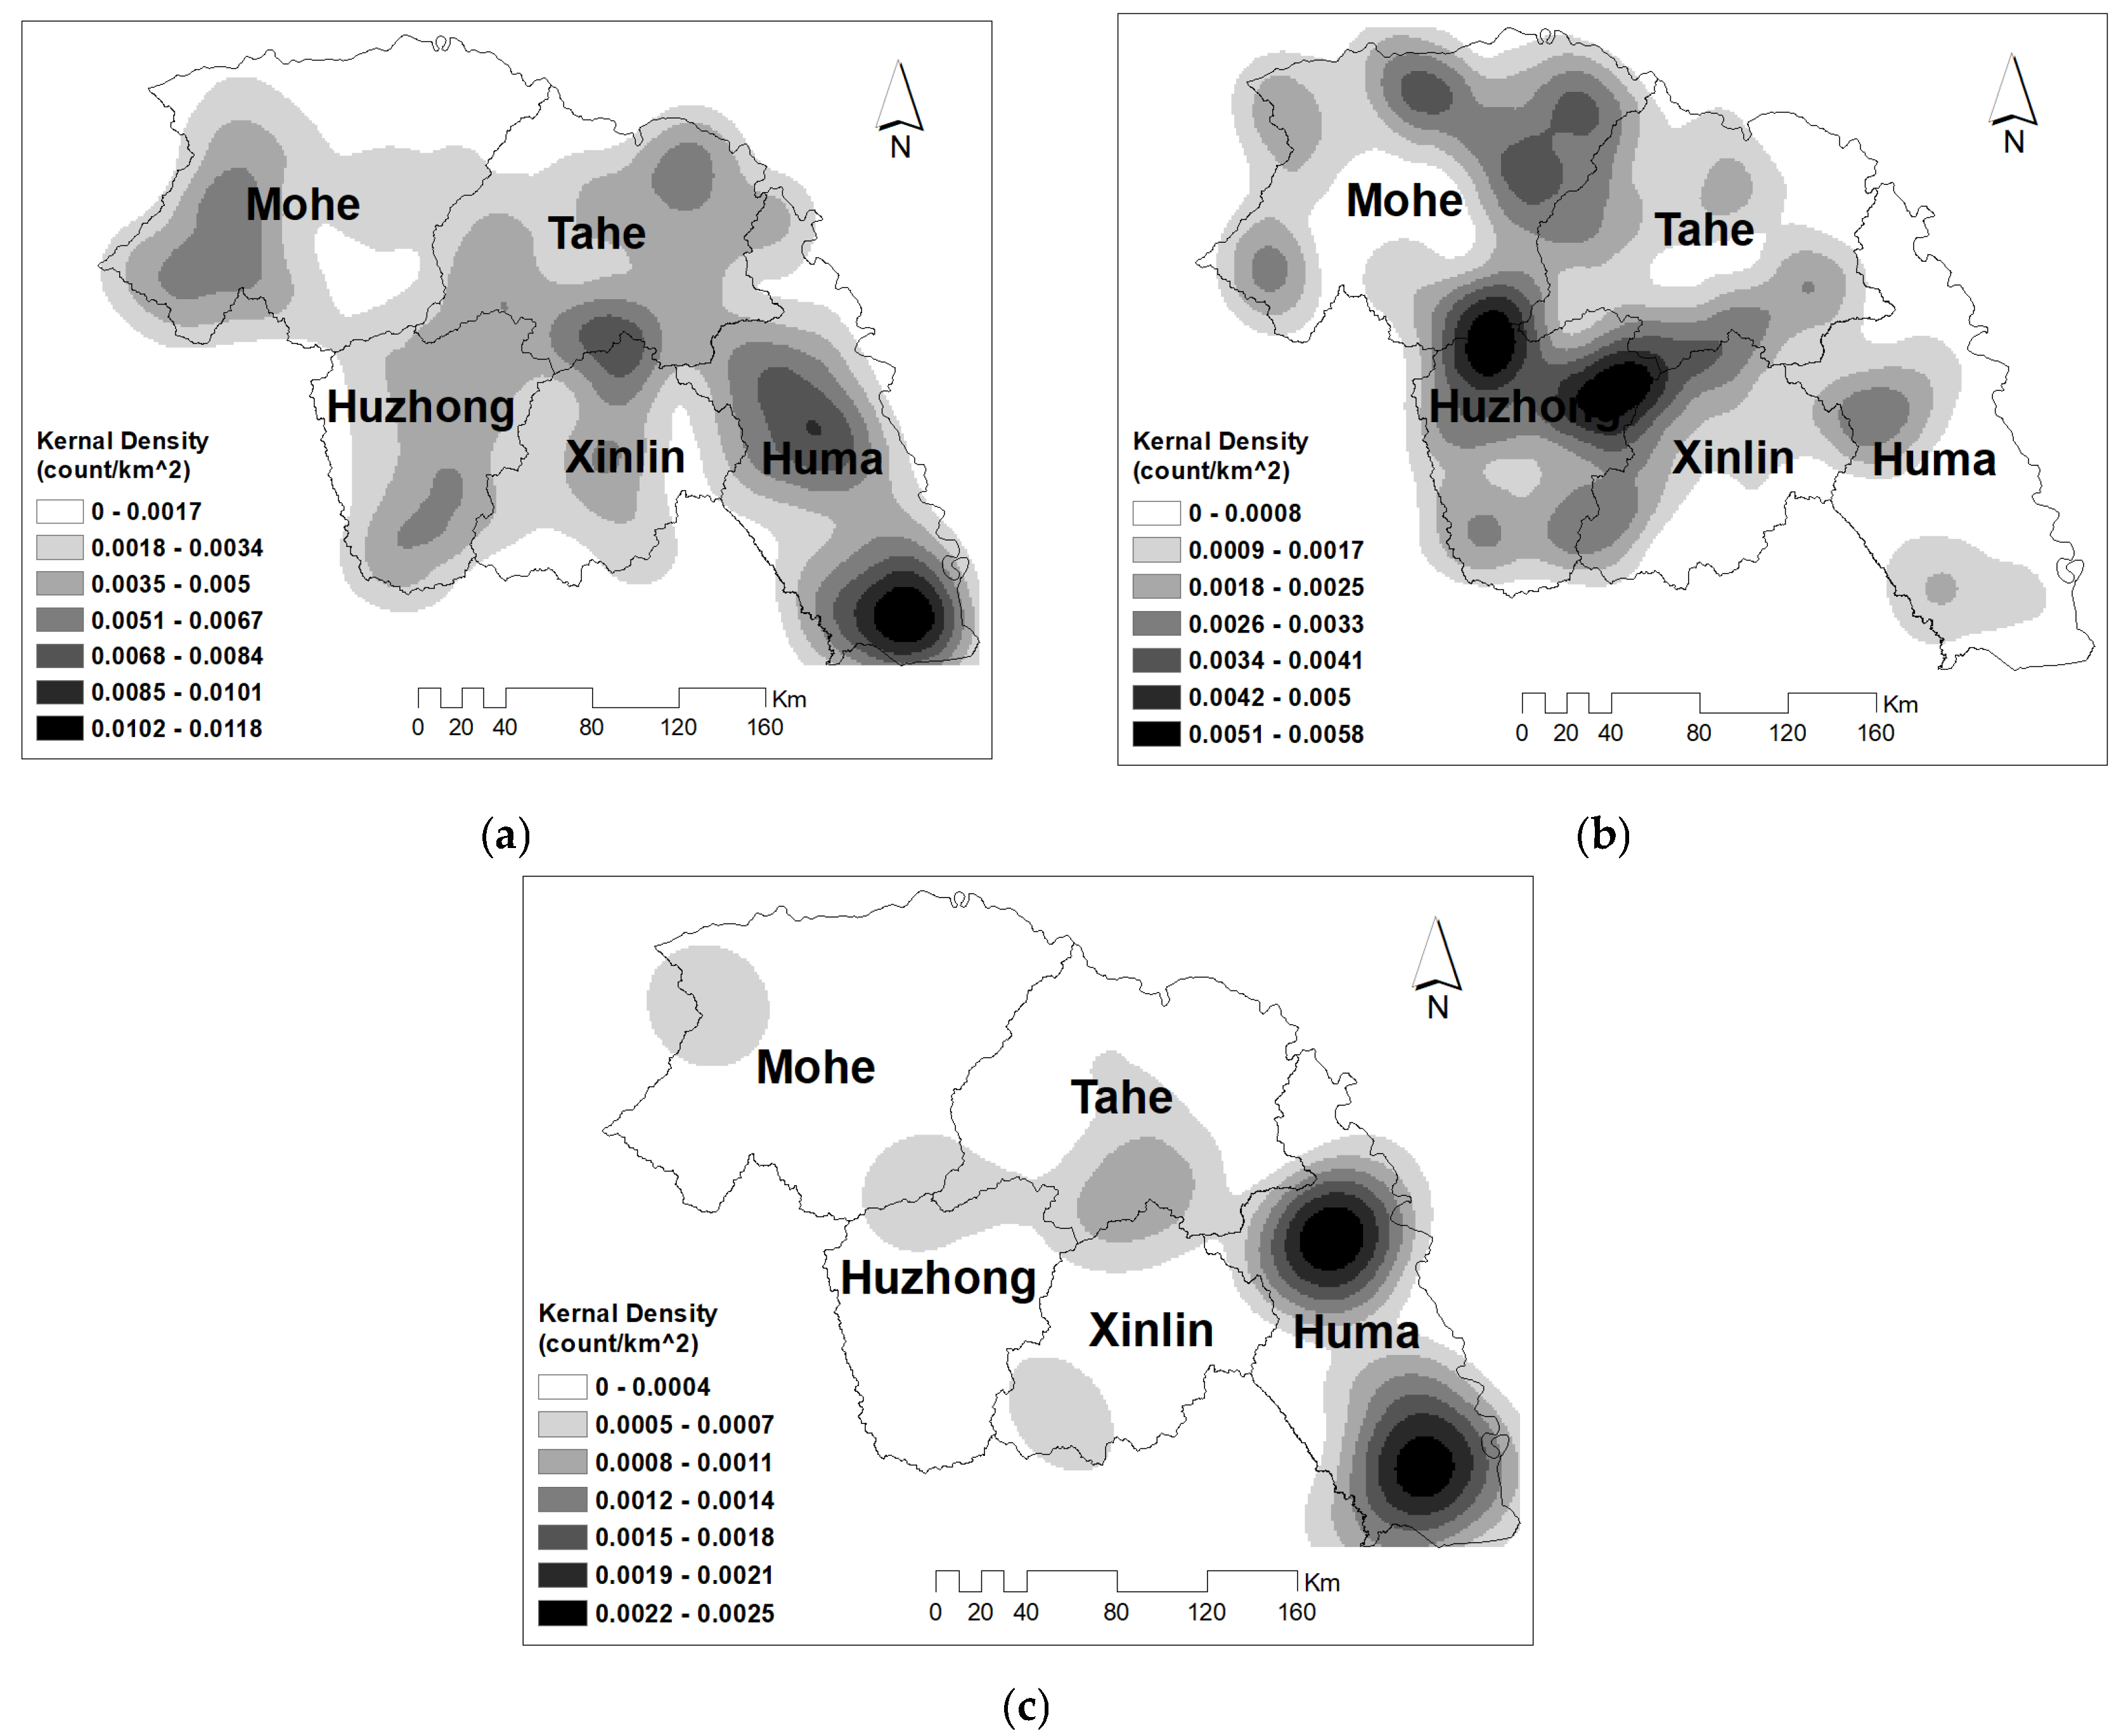
The kernel densities of fire occurrences in three seasons are extracted in Figure 7. The density maps highlight the fire hotspots in spring (Figure 7a), summer (Figure 7b), and fall (Figure 7c). Both spring and fall fires were common in Huma County, which had the most agricultural lands in the study area. Summer fires were mostly located in Huzhong County at higher elevations. While fall fires mostly occurred in the agriculture-based Huma County, spring and summer fires spread across the forested mountains in other counties.
3.2. Seasonal Variations of the Explanatory Variables
Descriptive statistics of the environmental parameters in Table 1 are summarized (Table 2). The Welch’s ANOVA tests were performed to examine if a parameter showed significant differences in the three different seasons. A significant difference indicated that this parameter played an active role on the seasonality of fire occurrences. For topographic parameters, elevation and slope showed significant impacts on fire seasonality (p < 0.0001), while aspect was irrelevant. As shown in Figure 7a, spring fires were distributed across the whole study area, from Mohe at higher elevations to Huma at lower elevations. In Figure 7b, summer fires exhibited a higher density in Huzhong at higher elevations (average = 641 m) and steeper slopes (average = 8.15°) than spring and fall fires. There was a higher tendency for lightning strikes at higher elevations, which explained how lightning mainly caused summer fires (as revealed in Figure 5). Around two-thirds of fall fires occurred in Huma County, which had more cultivated lands and higher populations in plain areas. Therefore, topography (elevation and slope) had different impacts on fire occurrences in different seasons in the study area.
For meteorological parameters, the monthly temperature percentage (MTP%) was slightly higher than 100.0% in all three seasons. This indicated that temperature in each season had been slightly increasing from 1980 to 2005. However, this inter-annual increase of temperature was not seasonally different in the ANOVA test. Oppositely, the MPP% was much lower than 100% (in a range of 59–80%), indicating that there was dramatically decreased precipitation in this period. The ANOVA test confirmed that the inter-annual decrease of precipitation was seasonally different (p = 0.0005). In other words, the decreased precipitation casted a significant impact on fire seasonality. There also existed significant seasonal variations for the mean annual temperature (MAT) and total annual precipitation (TAPcurrent) (both with p < 0.0001). Considering both MTP% and MPP%, it was reasonable to assume that fire seasonality could be related to seasonal temperature and precipitation in current years as well as precipitation reduction from the preceding year. For example, fall fires were often accompanied by higher mean annual temperature while summer fires were associated with much lower precipitation. While some studies indicated the effects of precipitation in the preceding year [29], this study found that precipitation in the preceding year did not cast a significant effect on fire seasonality (p = 0.3283). Wind speed was a categorical variable. The Kruskal Wallis test was performed to examine its seasonal differences in Table 2 (p < 0.001). Statistics also showed that spring and fall fires suffered more severe wind conditions than summer. The strong to stormy (scale 3 to 5) winds composed 53.7% of all wind scales for spring fires and 46.7% for fall fires, while all wind speeds were within the category of strong wind (scale 3) for summer fires.
For vegetation, no significant variations of ΣNDVIpreceding were found (p = 0.4682), indicating that fuel moisture conditions were not significantly different among the three seasons.
Regarding human impacts, the road density had a strong significant impact on fire seasonality (p < 0.048). The distance to roads had a weaker impact (p < 0.075). Summer fires exhibited the longest distance to roads and lowest road density in comparison to spring and fall fires. Oppositely, fall fires held the highest road density and shortest distance, while spring fires were in middle. These results were consistent with the distributions of ignition causes in Figure 5a and Figure 7, revealing that summer fires occurred in more remote areas at higher elevations. Fall fires were in more populated areas at lower elevations. Spring fires featured both aspects.
In short, forest fires exhibited distinct seasonal variability in terms of topographical, meteorological, and human-related conditions in this area. Specifically, summer fires mainly occurred in drier conditions by lightning and were located at high elevations and remote areas. Fall fires were in relatively flat areas and were mostly human-caused fires. Spring fires took place across the whole region. In the following analysis, we simulated how these environmental parameters regulate the fire size severity in each season.
3.3. Environmental Influences with the Ordinal Logistic Regression
The collinearity analysis showed that two topographic factors, elevation and slope, were highly correlated in both spring and summer fire datasets ( > 0.8, p < 0.001). For forest fires in mountainous areas, the critical slope threshold is 25 degrees beyond which the burning behavior changes [33]. The maximum slope for all fires was <20 degrees in the study area. Therefore, slope was not used in our model. There was no significant correlation among meteorological variables ( < 0.45, p > 0.05) in spring fires. However, in summer fires the monthly precipitation was highly correlated with annual precipitation ( = 0.75, p < 0.001), probably because summer was the primary rain season in this region. The Spearman’s correlation showed that monthly precipitation had higher correlation with FSS than annual precipitation, hence annual precipitation was not used. Variables of human influence proxy (road density and distance) did not show significant correlation ( < 0.2, p ≈ 0.05). The environmental parameters used in the model are listed in Table 3.
Both final modes in Table 3 are converged and the Wald Chi-square tests for the proportional odds assumption are significant (p < 0.1). For spring fires, the three significant environmental parameters were elevation, monthly temperature, and total annual precipitation of the preceding year. The interpretation of the results was as follows. Given that all other parameters in the model were held stable, with 1 mm more precipitation in the preceding year, the odds of a larger fire were calculated as of a smaller fire. Similarly, a 1 m increase of elevation lowered the odds of larger fires by . It was particularly noteworthy that when monthly temperature increases by one percent over long-term monthly mean temperature the odds for a larger fire were of a smaller fire. The coefficient value of each parameter revealed its relative importance. For spring fires, the most influencing parameters were monthly temperature, followed by the precipitation of the preceding year, and lastly elevation. Other environmental parameters examined in this study did not significantly affect the spring fires.
For summer fires, five influencing parameters were identified: wind speed, elevation, NDVI, mean annual temperature, and distance to road. The distance to road, mean annual temperature, and wind speed positively affected the fire size severity. Overall, wind speed was a significant variable that affected the fire size severity. A change of wind speed from scale 1 to 2 (breeze to moderate wind) did not significantly affect the fire size severity (p = 0.6863). However, when wind speed increased from scale 1 to 3 (breeze to strong wind), the odds of larger fires were of smaller fires, thus greatly increasing the chance of large fires. For the mean annual temperature, a 1 °C increase would increase the odds for larger fires by 1.538 times. The impacts of distance to road, NDVI, and elevation were limited.
4. Discussion
4.1. Fire Regime Changes
This study carried out a comprehensive analysis of fire regimes in the study area. Increasing trends for fire occurrences and burned areas were found in 1980–2005, which were greatly attributed to there being more summer and fall fires after the mid-1990s, thus resulting in a prolonged fire season length. Fire prevention in the study area has been one of the most important management activities of the National Forest Bureau of China. In the past decades, spring and fall have received the primary attention because it was not easy to form large fires in summer due to the high wetness from precipitation and leaf moisture of green canopies. The significant upward trend of summer fire occurrences since the mid-1990s indicates that more attention should be given to the summer season. While high FSS fires (burned area > 1000 ha) were not recorded in summers of 1980–2005, an increased number of moderate fires (100–1000 ha) have been observed in recent years. Under certain circumstances—for example, a stronger wind speed or insufficient fire fighting forces—these moderate-sized fires could possibly develop into larger conflagrations. Therefore, our study raised a sound alarm that summer fires cannot be ignored for effective fire prevention.
Causes of these fire regime changes could be twofold. Firstly, great efforts of fire prevention and management have been enforced in the Greater Hinggan Mountains since the catastrophic “Black Dragon” Fire in 1987 [34]. Through a rich set of evenly distributed lookout towers, an expanded fire monitoring network was established for field staff to detect and report wildfires in a timely manner (Mr. Huadong Wu, Vice Director, Fire Prevention Office, Tuqiang Forest Bureau, personal communication on 5 June 2015). Improved community learning programs and strict fire management policies led to reduced human-caused fires. On the other hand, the increased lightning fires, especially in summer, could be strongly impacted by climate change. For all fires in 1980–2005 in the study area, apparent weather anomalies were observed when fires broke out, with a trend that the mean annual temperature increased by 0.672 °C and the total annual precipitation decreased by 32.38 mm. The prolonged fire season length observed in this study was also inter-related with climate change. Studies have projected that the fire season will be prolonged by 20 to 30 days under the Intergovernmental Panel on Climate Change (IPCC) A2 and B2 scenarios of climate change in Northeast China [35].
4.2. Environmental Impacts on Fire Seaonality
Spatial patterns of fire points in different seasons varied with topography and road accessibility. Both spring and fall fires prevail in Huma County, a more populated and agriculture-heavy area at lower elevations that connects to the Northeast Plain of China. Therefore, fire prevention management should be always vigilant from spring to fall, especially in regard to human-induced fires. On the other hand, the dominancy of summer lightning fires at higher elevations in Huzhong County indicated that this area should be given higher attention during summer fire watch.
Fires in all three seasons were affected by similar meteorological changes, such as significantly higher temperature and lesser precipitation. However, they still varied in some aspects; for instance, summer fires usually occurred in dry years with dramatically reduced precipitation. Fall fires erupted when there was much higher annual temperature.
4.3. Environmental Influences on Fire Size Severity
Elevation had a negative impact on both spring and summer fires in the Greater Hinggan Mountains. At lower elevations, local temperature tended to be higher, which promoted dry fuel accumulation and led to an enlarged combustion area. Good accessibility to road network at lower elevations could facilitate the occurrences of human-caused fires in spring.
It is counterintuitive that wind speed was an influencing factor in summer but not in spring. Spring is prone to large forest fires due to the rising temperature and accumulated dry leaves on the ground, accompanied with prevailing strong wind speeds. Wind speed is expected to be one of the most influential factors for fire spread and consequently larger burned area [19]. This study found that about half of spring fires were accompanied with strong to stormy winds (scale 3 to 5, respectively). In contrast, wind condition was much milder in summer, all within the scale of 1 to 3 which represents breezes to strong winds, respectively. The logistic regression results revealed that wind speed was a significantly positive factor facilitating the formation of larger fires in summer. In other words, although wind speed was still the key factor affecting large fire formation, summer fires were more sensitive to wind speed than spring fires at the landscape scale. Wind not only directly propagated the fire spread, but affected the moisture content of surface fuels more rapidly.
Fuel moisture significantly influenced summer fires. As shown in Table 3, NDVI has a negative coefficient in the logistic model. Summer fires were often caused by lightning—in most cases by dry thunderstorms, occurring in dense forests at higher elevations, where the high leaf moisture in peak growing season restricted the occurrences of large fires. Moreover, distance to nearest roads acted as a constraint to developing large fires in summer, since the distant location of fire incidences hindered firefighters to extinguish the fires in time. Even worse, if accompanied with strong wind, the situation became more difficult to control. In contrast, distance to nearest roads may act as a driving factor of fire occurrences in other seasons. In spring and fall, for example, high accessibility to road network could facilitate the occurrences of human-caused fires in Huma County.
Two other significant factors for spring fires were the monthly temperature (MTP against long-term mean) and the precipitation in the preceding year. Usually, fine fuels like fallen leaves and forest litter accumulate in spring. High temperature would expedite the evaporation and drying of fire fuel, resulting in a high flammability and propagation speed. A dry preceding meteorological condition created a vulnerable condition for fires in the coming spring, consequently posing an elevated risk for larger fires. Taking the preceding meteorological factors into consideration helps us develop more appropriate measures for fire prevention in the coming spring.
4.4. Limitations and Future Work
Some limitations remain in this study. The fire records that we could access are only available for a relatively short period (26 years), and fall fire is not examined in this study, given its low number of fire records. This study indicates that more fall fires would occur with a prolonged fire season. When longer data series are available in the future, fall fires could be better studied, thus allowing for a more comprehensive understanding of the fire regime and its evolution in the long run. This study also implies the promising application of integrating remote-sensed data, such as NDVI, into fire studies. In the future, more remote sensing products, for example, land surface temperature and active fire data from coarse-resolution satellite imagery, could be applied to substitute the limited in-field observations in fire studies.
Human impacts on fires in boreal forests were not deeply examined in this study. The distance to the nearest road and road density surrounding a fire point were simply extracted to approximate the anthropogenic disturbances. In the past decades, human activities in the study area have been accelerating (e.g., logging, planting, sawmills, and wood product transportation). In the early 2000s, the “Tian Bao” Project was enforced to permanently prohibit logging activities in the Greater Hinggan Mountains for natural forest protection [34]. It is therefore necessary to integrate these human activities and consequences of policies into fire studies in order to establish a better understanding of human impacts in this unique boreal forest region.
5. Conclusions
This study explored the statistical characteristics of fire records in boreal forests of the Greater Hinggan Mountains in the period of 1985–2006, analyzed the impacts of different environmental parameters on fire seasonality, and performed an ordinary logistic regression in order to identify the influencing environmental parameters on the fire regime in this region. It was found that spring fires accounted for the largest proportion of fire occurrences as well as the most burned areas, and fall fires were more related to anthropogenic activities in harvesting season. Summer fires were mostly lightning-caused and were rare before the mid-1990s. However, the increased summer fires in recent years, together with prolonged fire season length, deserve higher attention as a result of the possibly changing fire regime of the region. Different sets of significant environmental factors were identified: elevation, temperature, and precipitation in the preceding year for spring fires; wind speed, elevation, temperature, NDVI, and distance to road for summer fires. Spatial distributions and densities of fires in different seasons varied across the study area. The spatially and seasonally specific fire patterns extracted from this study could help to develop more localized fire prevention strategies for sustainable forest management.
Acknowledgments
This study was financially supported by the National Natural Science Foundation of China (No. 41371397).
Author Contributions
Qian Fan performed data analysis and drafted the manuscript. Cuizhen Wang completed and revised the manuscript and was in charge of communication with co-authors for revisions and comments to improve the manuscript. Dongyou Zhang collected the fire data and performed pre-processing for spatial and statistical analysis. Shuying Zang supervised and revised the manuscript in aspect of the fire regime change and environmental influences.
Conflicts of Interest
The authors declare no conflicts of interest.
References
- Goldammer, J.G.; Furyaev, V.V. Fire in Ecosystems of Boreal Eurasia; Springer Science & Business Media: Berlin, Germany, 2013. [Google Scholar]
- Kuusela, K. The Dynamics of Boreal Coniferous Forests, 1st ed.; SITRA: Helsinki, Finland, 1990. [Google Scholar]
- De Groot, W.J.; Cantin, A.S.; Flannigan, M.D.; Soja, A.J.; Gowman, L.M.; Newbery, A. A comparison of Canadian and Russian boreal forest fire regimes. For. Ecol. Manag. 2013, 294, 23–34. [Google Scholar] [CrossRef]
- Ward, C.; Pothier, D.; Paré, D. Do Boreal Forests Need Fire Disturbance to Maintain Productivity? Ecosystems 2014, 17, 1053–1067. [Google Scholar] [CrossRef]
- Kelly, R.; Chipman, M.L.; Higuera, P.E.; Stefanova, I.; Brubaker, L.B.; Hu, F.S. Recent burning of boreal forests exceeds fire regime limits of the past 10,000 years. Prec. Natl. Acad. Sci. USA 2013, 32, 13055–13060. [Google Scholar] [CrossRef] [PubMed]
- Liu, Z.; Yang, J.; Chang, Y.; Weisberg, P.; He, H. Spatial patterns and drivers of fire occurrence and its future trend under climate change in a boreal forest of Northeast China. Glob. Chang. Biol. 2012, 18, 2041–2056. [Google Scholar] [CrossRef]
- Bergeron, Y.; Leduc, A.; Harvey, B.D.; Gauthier, S. Natural fire regime: A guide for sustainable management of the Canadian boreal forest. Silva Fenn. 2002, 36, 81–95. [Google Scholar] [CrossRef]
- Parks, S.A.; Parisien, M.A.; Miller, C. Spatial bottom-up controls on fire likelihood vary across western North America. Ecosphere 2012, 3, 1–20. [Google Scholar] [CrossRef]
- Lafon, C.; Quiring, S. Relationships of Fire and Precipitation Regimes in Temperate Forests of the Eastern United States. Earth Interact. 2012, 16. [Google Scholar] [CrossRef]
- Falk, D.A.; Heyerdahl, E.K.; Brown, P.M.; Farris, C.; Fule, P.Z.; McKenzie, D.; Swetnam, T.W.; Taylor, A.H.; Van Horne, M.L. Multi-scale controls of historical forest-fire regimes: New insights from fire-scar networks. Front. Ecol. Environ. 2011, 9, 446–454. [Google Scholar] [CrossRef]
- Mollicone, D.; Eva, H.; Achard, F. Ecology—Human role in Russian wild fires. Nature 2006, 440, 436–437. [Google Scholar] [CrossRef] [PubMed]
- Chang, Y.; He, H.; Hu, Y.; Bu, R.; Lia, X. Historic and current fire regimes in the Great Xing’an Mountains, northeastern China: Implications for long-term forest management. For. Ecol. Manag. 2008, 254, 445–453. [Google Scholar] [CrossRef]
- Wu, Z.W.; He, H.S.; Yang, J.; Liu, Z.H.; Liang, Y. Relative effects of climatic and local factors on fire occurrence in boreal forest landscapes of northeastern China. Sci. Total Environ. 2014, 493, 472–480. [Google Scholar] [CrossRef] [PubMed]
- Hu, T.Y.; Zhou, G.S. Drivers of lightning- and human-caused fire regimes in the Great Xing’an Mountains. For. Ecol. Manag. 2014, 329, 49–58. [Google Scholar] [CrossRef]
- Wu, Z.; He, H.S.; Yang, J.; Liang, Y. Defining fire environment zones in the boreal forests of northeastern China. Sci. Total Environ. 2015, 518, 106–116. [Google Scholar] [CrossRef] [PubMed]
- Chang, Y.; Zhu, Z.L.; Bu, R.C.; Chen, H.W.; Feng, Y.T.; Li, Y.H.; Hu, Y.M.; Wang, Z.C. Predicting fire occurrence patterns with logistic regression in Heilongjiang Province, China. Landsc. Ecol. 2013, 28, 1989–2004. [Google Scholar] [CrossRef]
- Wu, Z.; Chang, Y.; He, H.; Hu, Y. Analyzing the spatial and temporal distribution characteristics of forest fires in Huzhong area in the Great Xing’an Mountains. Guangdong Agric. Sci. 2011, 5, 189–193. (In Chinese) [Google Scholar]
- Romme, W.H.; Everham, E.H.; Frelich, L.E.; Moritz, M.A.; Sparks, R.E. Are large, infrequent disturbances qualitatively different from small, frequent disturbances? Ecosystems 1998, 1, 524–534. [Google Scholar] [CrossRef]
- Dimitrakopoulos, A.; Gogi, C.; Stamatelos, G.; Mitsopoulos, I. Statistical analysis of the fire environment of large forest fires (>1000 ha) in Greece. Pol. J. Environ. Stud. 2011, 20, 327–332. [Google Scholar]
- Fang, L.; Yang, J.; Zu, J.; Li, G.; Zhang, J. Quantifying influences and relative importance of fire weather, topography, and vegetation on fire size and fire severity in a Chinese boreal forest landscape. For. Ecol. Manag. 2015, 356, 2–12. [Google Scholar] [CrossRef]
- Wu, Z.W.; He, H.S.; Liang, Y.; Cai, L.Y.; Lewis, B.J. Determining Relative Contributions of Vegetation and Topography to Burn Severity from LANDSAT Imagery. Environ. Manag. 2013, 52, 821–836. [Google Scholar] [CrossRef] [PubMed]
- Chuvieco, E.; Cocero, D.; Riano, D.; Martin, P.; Martinez-Vega, J.; de la Riva, J.; Perez, F. Combining NDVI and surface temperature for the estimation of live fuel moisture content in forest fire danger rating. Remote Sens. Environ. 2004, 92, 322–331. [Google Scholar] [CrossRef]
- Yebra, M.; Chuvieco, E.; Riano, D. Estimation of live fuel moisture content from MODIS images for fire risk assessment. Agric. For. Meteorol. 2008, 148, 523–536. [Google Scholar] [CrossRef]
- Chuvieco, E.; Aguado, I.; Yebra, M.; Nieto, H.; Salas, J.; Martin, M.P.; Vilar, L.; Martinez, J.; Martin, S.; Ibarra, P.; et al. Development of a framework for fire risk assessment using remote sensing and geographic information system technologies. Ecol. Model. 2010, 221, 46–58. [Google Scholar] [CrossRef]
- Xu, H. Forest in Great Xing’an Mountains of China; Science Press: Beijing, China, 1998. (In Chinese) [Google Scholar]
- Beaufort Scale. Wikipedia. Available online: https://en.wikipedia.org/w/index.php?title=Beaufort_scale&oldid=746213871 (accessed on 12 June 2017).
- Glenn, E.; Huete, A.; Nagler, P.; Nelson, S. Relationship between remotely-sensed vegetation indices, canopy attributes and plant physiological processes: What vegetation indices can and cannot tell us about the landscape. Sensors 2008, 8, 2136–2160. [Google Scholar] [CrossRef] [PubMed]
- Keeley, J.E. Fire intensity, fire severity and burn severity: A brief review and suggested usage. Int. J. Wildland Fire 2009, 18, 116–126. [Google Scholar] [CrossRef]
- Liu, X.; Yan, Z. Analysis of Pre-meterological conditions of forest spring fires in Greater Hinggan Mountain in 2003. Heilong Jiang Meteorol. 2003, 4, 29–30. (In Chinese) [Google Scholar]
- Zhang, A. Forest Fires in Great Hinggan Mountains. China News, 29 March 2003. (In Chinese) [Google Scholar]
- Agresti, A.; Kateri, M. Categorical Data Analysis; Springer: Berlin/Heidelberg, Germany, 2011. [Google Scholar]
- Peduzzi, P.; Concato, J.; Kemper, E.; Holford, T.R.; Feinstein, A.R. A simulation study of the number of events per variable in logistic regression analysis. J. Clin. Epidemiol. 1996, 49, 1373–1379. [Google Scholar] [CrossRef]
- Butler, B.; Anderson, W.; Catchpole, E. Influence of slope on fire spread rate. In Proceeedings of the Fire Environment—Innovations, Management, and Policy; USDA Forest Service, Rocky Mountain Research Station: Fort Collins, CO, USA, 2007; pp. 75–82. [Google Scholar]
- Wang, J.; Wang, C.; Zang, S. Assessing re-composition of Xing’an larch in boreal forests after the 1987 fire, Northeast China. Remote Sens. 2017, 9, 504. [Google Scholar] [CrossRef]
- Tian, X.; Shu, L.; Zhao, F.; Wang, M.; McRae, D.J. Future impacts of climate change on forest fire danger in northeastern China. J. For. Res. 2011, 22, 437–446. [Google Scholar] [CrossRef]
Figure 1.
The study area and historic fire points in 1980–2005.
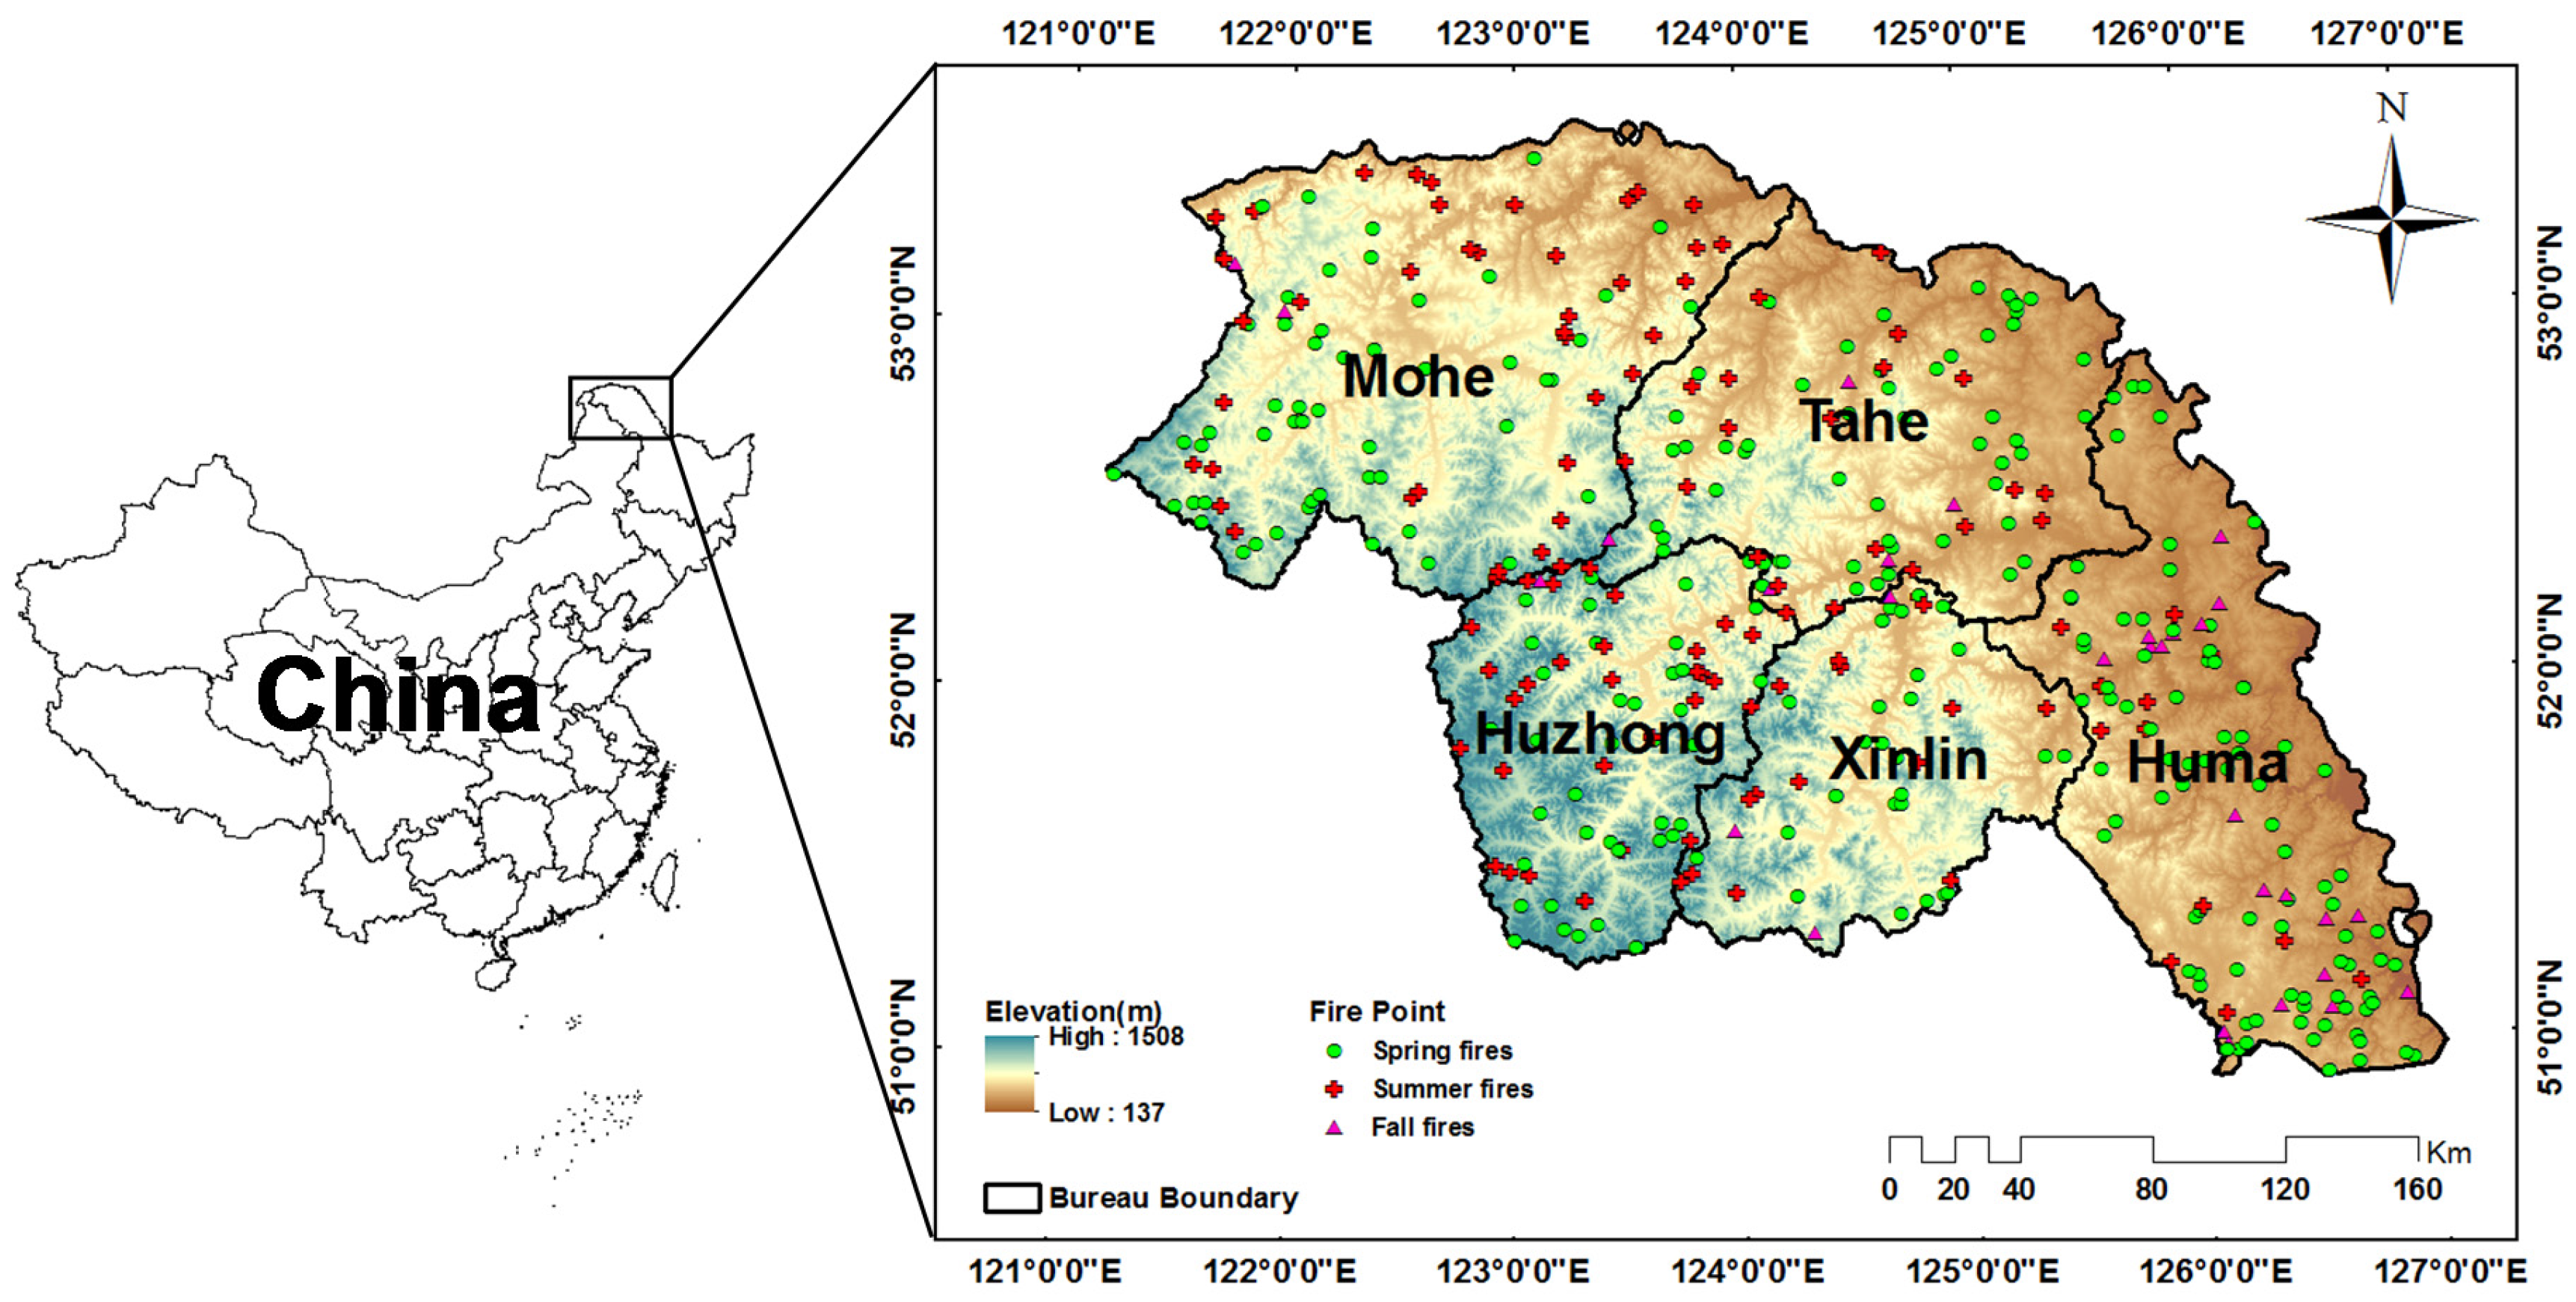
Figure 2.
Road density map in km/km2.
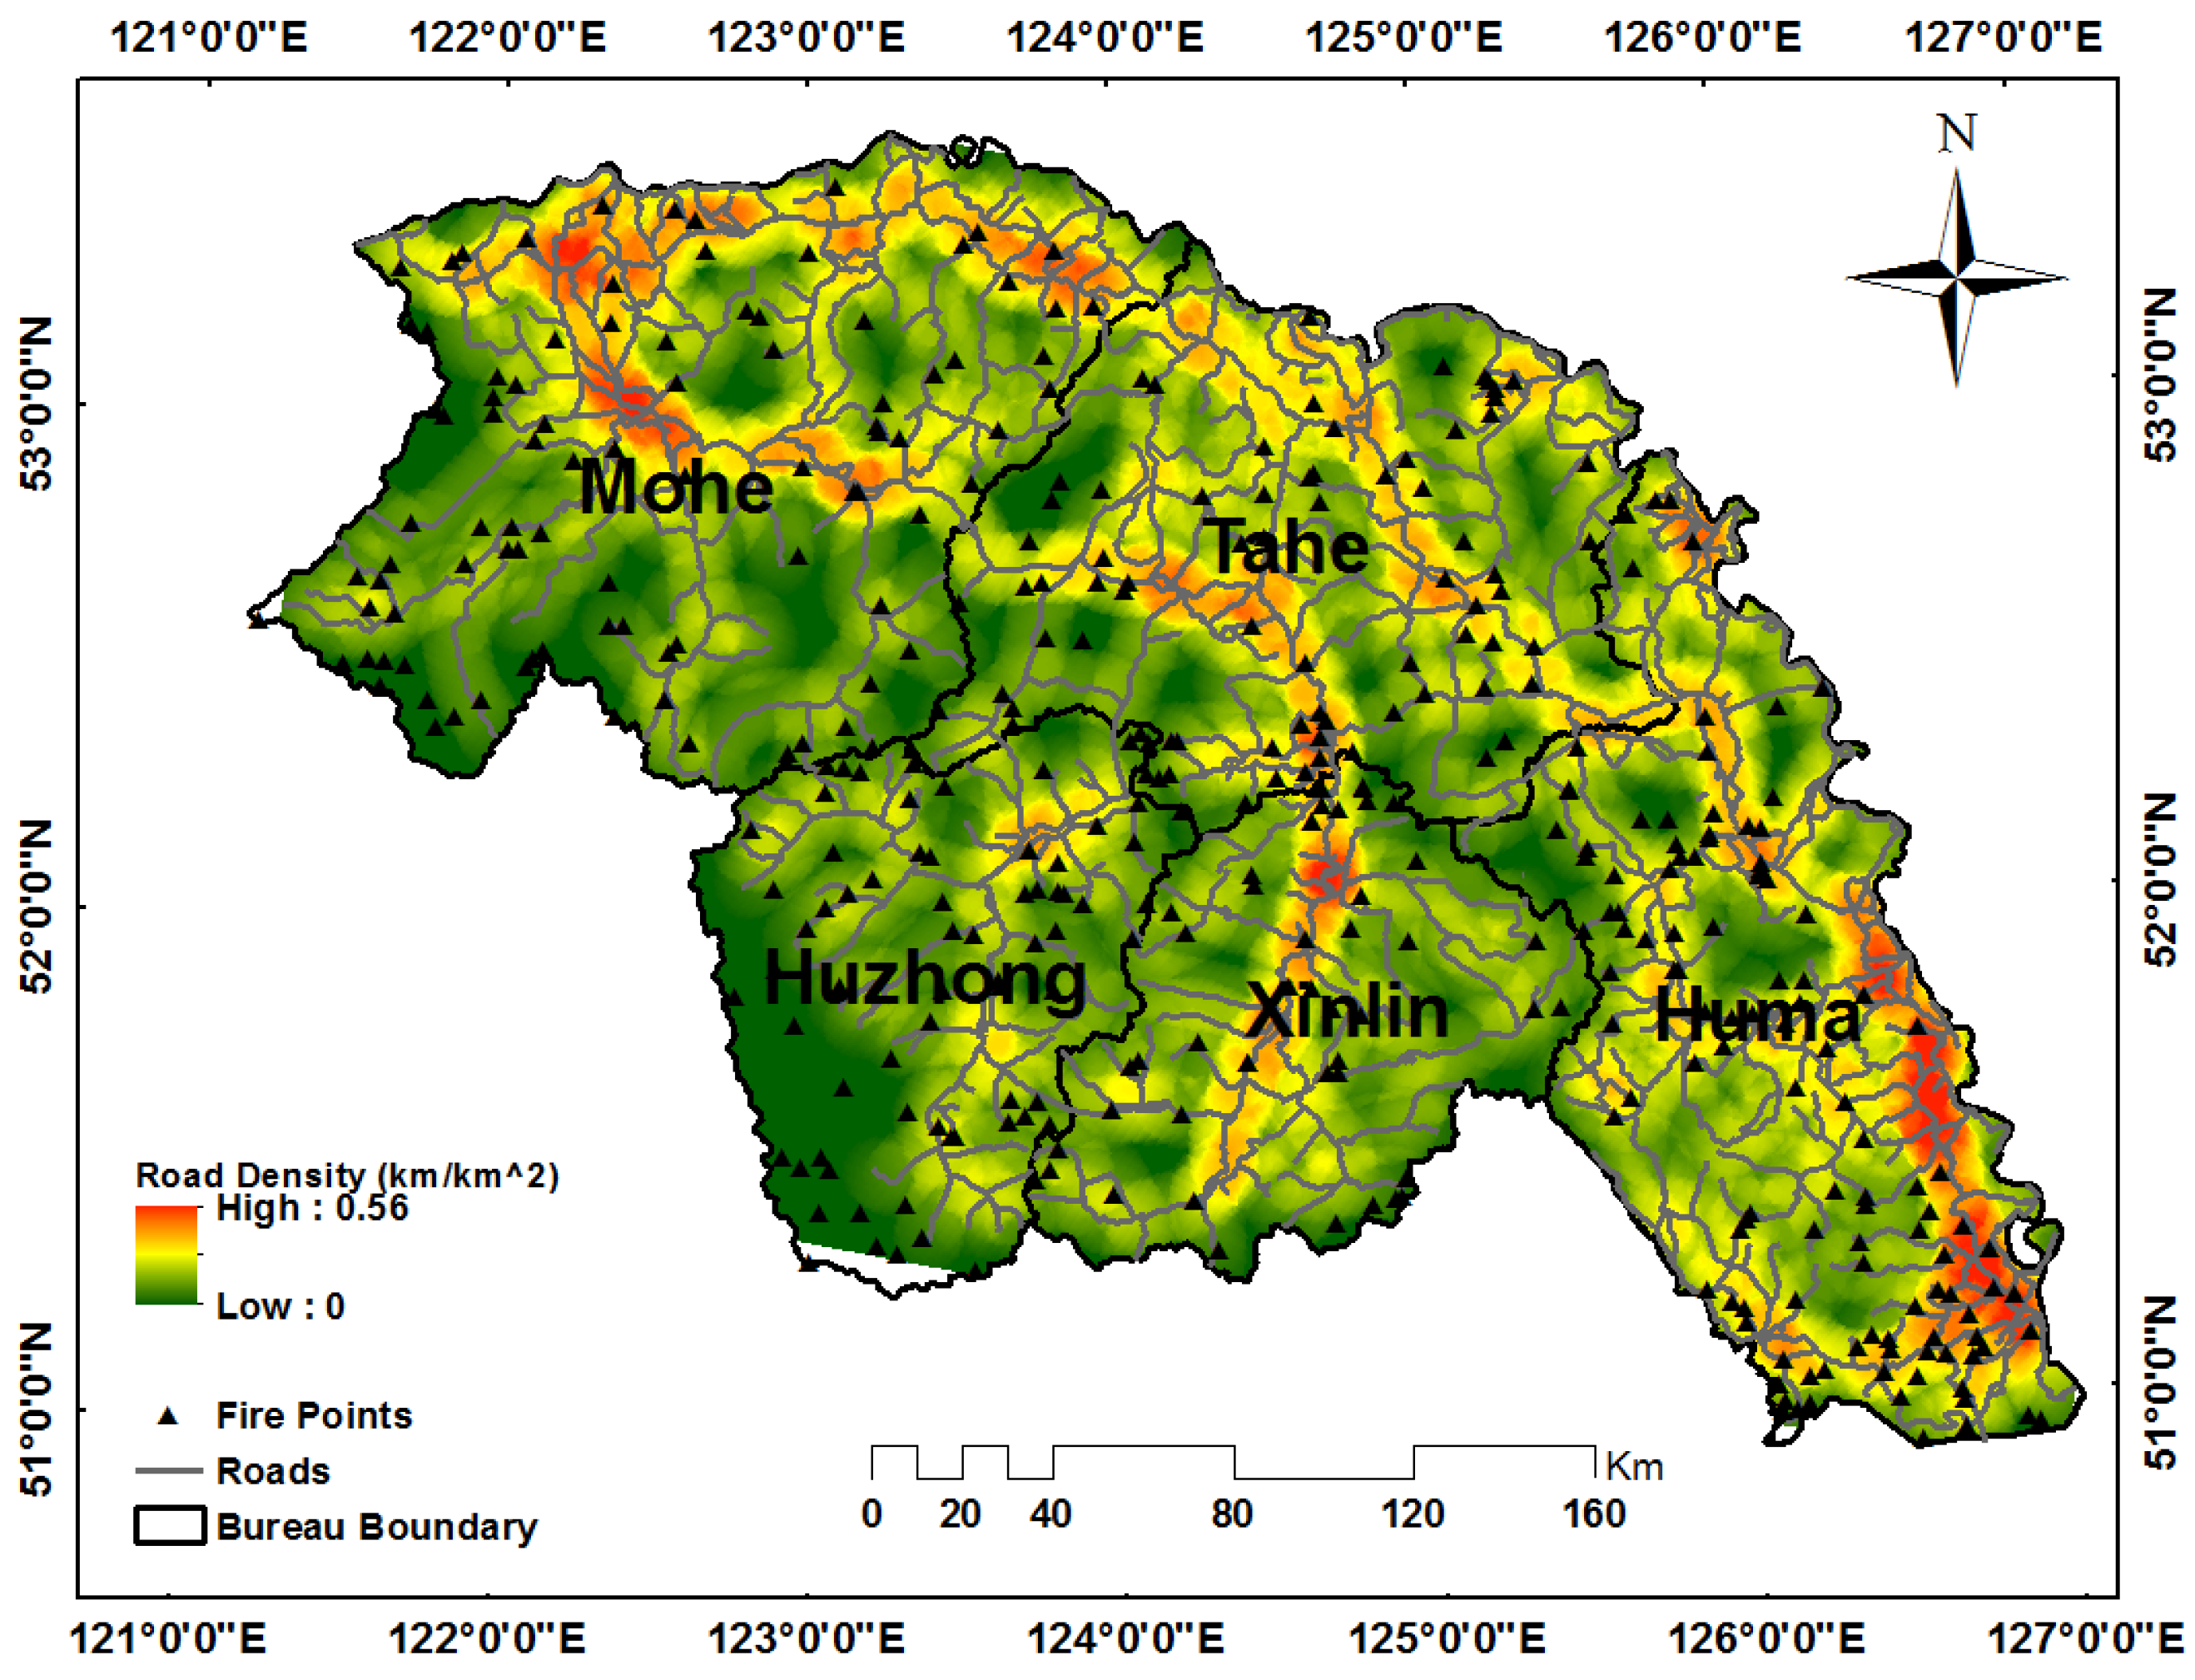
Figure 3.
The occurrences of lightning- and human-caused fires in 1980–2005.

Figure 4.
The 26-year variations of fire season length (the first and last fires in a year).

Figure 5.
Fire counts (a) and burned areas (b) by month.

Figure 6.
The 26-year variations of total burned areas by season.

Figure 7.
Kernel densities of fire occurrences in spring (a); summer (b); and fall (c).

Table 1.
Environmental parameters used in this study.
| Data Category | Abbreviation | Parameter | Format | Unit | Cell Size |
|---|---|---|---|---|---|
| Topography | Slope | Continuous | Degree | 30 m | |
| Elevation | Continuous | m | 30 m | ||
| Aspect | Continuous | Unitless | 30 m | ||
| Climate | MAT | Mean Annual Temperature | Continuous | Celsius | 0.5° |
| TAPcurrent | Total Annual Precip. (current year) | Continuous | mm | 0.5° | |
| TAPpreceding | Total Annual Precip. (preceding) | Continuous | mm | 0.5° | |
| MTP | Monthly Temperature Percentage | Continuous | % | 0.5° | |
| MPP | Monthly Precipitation Percentage | Continuous | % | 0.5° | |
| Wind Speed | Daily Mean Wind Speed | Categorical | 1 to 5 | 0.5° | |
| Vegetation | ΣNDVIpreceding | Continuous | Unitless | 8 km | |
| Road | Distance to Nearest Road | Continuous | m | / | |
| Road Density | Continuous | km/km2 | / |
Table 2.
The mean and standard deviation values of the extracted environmental parameters for fires in each season and the ANOVA tests for their seasonal differences.
Table 2.
The mean and standard deviation values of the extracted environmental parameters for fires in each season and the ANOVA tests for their seasonal differences.
| Parameters | Statistics | Spring | Summer | Fall | Welch’s ANOVA p-Value |
|---|---|---|---|---|---|
| Elevation (m) | Mean | 538.8 | 641.0 | 440.7 | p < 0.0001 # |
| Std. Dev. | 211.2 | 208.1 | 189.6 | ||
| Slope (°) | Mean | 6.35 | 8.15 | 4.61 | p < 0.0001 # |
| Std. Dev. | 3.13 | 3.49 | 2.77 | ||
| Aspect | Mean | −0.03 | −0.02 | −0.01 | p = 0.5108 |
| Std. Dev. | 0.15 | 0.14 | 0.14 | ||
| MTP (%) | Mean | 100.39 | 100.36 | 100.30 | p = 0.5630 |
| Std. Dev. | 0.53 | 0.24 | 0.43 | ||
| MPP (%) | Mean | 71.33 | 59.11 | 79.89 | p = 0.0005 # |
| Std. Dev. | 41.95 | 22.15 | 46.62 | ||
| MAT (°C) | Mean | −3.58 | −3.40 | −2.22 | p < 0.0001 # |
| Std. Dev. | 1.60 | 1.26 | 1.53 | ||
| TAPcurrent (mm) | Mean | 454.8 | 325.2 | 399.2 | p < 0.0001 # |
| Std. Dev. | 82.3 | 58.3 | 62.3 | ||
| TAPpreceding (mm) | Mean | 423.9 | 425.6 | 444.5 | p = 0.3283 |
| Std. Dev. | 83.28 | 63.55 | 69.36 | ||
| Wind Speed (Beaufort scale 1–5) | Mean | 2.6 | 2.3 | 2.4 | p < 0.0001 *,# |
| Std. Dev. | 0.65 | 0.49 | 0.67 | ||
| ΣNDVIpreceding | Mean | 7.89 | 7.87 | 7.78 | p = 0.4682 |
| Std. Dev. | 0.39 | 0.37 | 0.44 | ||
| Distance to road (m) | Mean | 2694.3 | 3400.2 | 2358.4 | p = 0.0751 # |
| Std. Dev. | 3122.1 | 3504.6 | 1883.0 | ||
| Road density (km/km2) | Mean | 0.174 | 0.147 | 0.182 | p = 0.0478 # |
| Std. Dev. | 0.111 | 0.095 | 0.095 |
* Wind Speed was tested with the Kruskal Wallis test; # indicated significant differences.
Table 3.
Ordinal logistic regression of spring and summer fires.
| Parameter | Coefficient | Wald Chi-Square | p-Value | |
|---|---|---|---|---|
| Spring fires | Elevation | −0.00014 | 5.5775 | 0.0182 |
| MTP(%) | 0.4991 | 4.4273 | 0.0354 | |
| TAPpreceding | −0.00834 | 25.5820 | <0.0001 | |
| Summer fires | Wind Speed (scale 2) | 0.1999 | 0.1632 | 0.6863 |
| Wind Speed (scale 3) | 1.7719 | 8.1004 | 0.0044 | |
| Elevation | −0.00359 | 5.1185 | 0.0237 | |
| NDVI | −0.00285 | 11.1797 | 0.0008 | |
| MAT (°C) | 0.4287 | 3.1402 | 0.0764 | |
| Distance to road | 0.00014 | 3.4953 | 0.0615 |
© 2017 by the authors. Licensee MDPI, Basel, Switzerland. This article is an open access article distributed under the terms and conditions of the Creative Commons Attribution (CC BY) license (http://creativecommons.org/licenses/by/4.0/).
Share and Cite
MDPI and ACS Style
Fan, Q.; Wang, C.; Zhang, D.; Zang, S. Environmental Influences on Forest Fire Regime in the Greater Hinggan Mountains, Northeast China. Forests 2017, 8, 372. https://doi.org/10.3390/f8100372
AMA Style
Fan Q, Wang C, Zhang D, Zang S. Environmental Influences on Forest Fire Regime in the Greater Hinggan Mountains, Northeast China. Forests. 2017; 8(10):372. https://doi.org/10.3390/f8100372
Chicago/Turabian StyleFan, Qian, Cuizhen Wang, Dongyou Zhang, and Shuying Zang. 2017. "Environmental Influences on Forest Fire Regime in the Greater Hinggan Mountains, Northeast China" Forests 8, no. 10: 372. https://doi.org/10.3390/f8100372
Note that from the first issue of 2016, this journal uses article numbers instead of page numbers. See further details here.