Potential Impact of the REDD+ Program on Poverty Reduction in Nghe An Province, Vietnam


1
Center for Agricultural Research and Ecological Studies (CARES), Vietnam National University of Agriculture, Hanoi, Vietnam
2
College of Economics and Management, University of the Philippines Los Baños, Laguna, 4031 Philippines
3
Center for International Forestry Research (CIFOR), Indonesia
*
Author to whom correspondence should be addressed.
Forests 2017, 8(10), 376; https://doi.org/10.3390/f8100376
Submission received: 5 July 2017
/
Revised: 28 September 2017
/
Accepted: 30 September 2017
/
Published: 3 October 2017
(This article belongs to the Section Forest Economics, Policy, and Social Science)
Abstract
:The REDD+ program provides a mechanism for providing financial rewards to forest owners and users who contribute to the reduction of carbon emissions from deforestation and forest degradation. This paper determines the potential impact of the REDD+ program on poverty reduction by comparing income and poverty rate between two household groups that were willing to participate in this study, but that will not participate in the REDD+. The results showed that carbon payment from forests is a significant contributor to the increase in household income of poor people. The average income of households participating in the program is VND 20.68 million in contrast to those not participating whose average income is VND 14.72 million. Results showed that the REDD+ program intervention helped reduce the poverty rate in the two communes by 6.40% (from 39.4% to 33%). The paper recommends that the REDD+ program should facilitate the distribution of land titles to provide security of tenure for individual households that are participating in the program. While the program can contribute to poverty reduction, the program payments can increase income inequality and conflicts between those involved and those not involved in the program and legal ownership of the lands. In addition, a comprehensive research study on the impact of the program on forest conservation and poverty reduction is necessary. Stakeholders of the program should recognize and acknowledge the trade-offs between conservation and economic development or poverty reduction. A comprehensive trade-off analysis of program implementation and a business-as-usual option of commodity production is needed, which could reveal the indirect economic, political, and social costs and benefits of the program.
1. Introduction
The REDD+ program mechanism, which can provide financial incentives to developing countries for protecting their forests, can take account of payments to forest owners with rights over forests [1]. Through this mechanism, countries can measure and monitor the emissions of CO2 resulting from deforestation and degradation within their borders. Countries may be compensated through grant funds or through the sale of carbon credits in international carbon markets [2,3]. If it is sensibly designed and effectively implemented, the program can promote sustainable economic and social development.
Vietnam is now drafting its National REDD+ Program Strategy and has established a National Readiness Management Arrangement, including a Vietnam REDD+ Program Steering Committee, a network and a dedicated office. In 2010, the Ministry of Agriculture and Rural Development (MARD) established the National REDD+ Program Network and its Working Group to create awareness of its mechanism and build capacity at the national and provincial levels to coordinate activities of ministries, international agencies and organizations. The National REDD+ program office was established in 2011 to coordinate and manage the process of developing tools to implement Vietnam’s National REDD+ Program. The various partners are now rapidly moving the country forward to make it a reality in the country. Moreover, a series of national strategies and actions, supported by decrees and decisions enacting and promulgating their various components, have been developed as a response to climate change. For example, Decision No. 2139/QD-TTg, which was passed in December 2011, approved the National Strategy on Climate Change, and included the establishment of national programs such as the forest programs to address climate change. Decision No. 799/QD-TTg was also issued by the Prime Minister in June 2012, approving the National REDD+ Action Program (NRAP) for the period 2011–2020. Despite the number of pilot programs and research on REDD+, however, the concept of REDD+ payments through a carbon market is still a new concept in Vietnam [4].
Since the implementation of the REDD+ program in Vietnam in 2009, progress has been slow and is not bringing its expected results even after 7 years of implementation. The North Central Region contains six provinces in the northern half of Vietnam’s narrow central part. All provinces in this region stretch from the coast in the east to Laos in the west. The emissions reduction program includes 5.1 million ha in the North Central Region, 4.33 million ha of which is forestland. Thanh Hoa, Nghe An, Ha Tinh, Quang Binh, Quang Tri and Thua Thien Hue are the six provinces that were selected for the pilot REDD+ program [5]. Parts of this region are experiencing deforestation, flooding, drought, soil degradation and risks to sources of livelihood. Given the high poverty rate, very few upland farmers are willing to serve in protecting the forest, since income from forest protection is low and not attractive to local people [6].
The objective of the REDD+ program is not only to reduce deforestation and forest degradation but also to improve livelihoods, reduce poverty and consequently, to mitigate climate change. However, it was agreed in the 2007 Bali Action Plan that the program should go beyond mitigation. It should also deliver environmental and social co-benefits that would contribute to poverty reduction [7]. Among those that would benefit the most are poor people living in remote areas who rely on non-timber forest products (NTFPs) such as animals, honey bees and fish to supplement their household income, as well as income from illegal logging. Illegal logging brings more benefits/income to households than do other farming activities. Thus, the REDD+ program will only be successful if the program’s contribution of carbon payments to the family income is attractive enough for the households to join. An analysis of the impact of REDD+ on poverty reduction in the study area is therefore important, since it may open a new window for REDD+ program implementation. The aim of this paper is to determine the potential impact on poverty reduction of the pilot national REDD+ program in Con Cuong District, Nghe An Province, Vietnam.
2. Methods
2.1. Introducing the Case Study
2.1.1. Geographical Location and Demographics
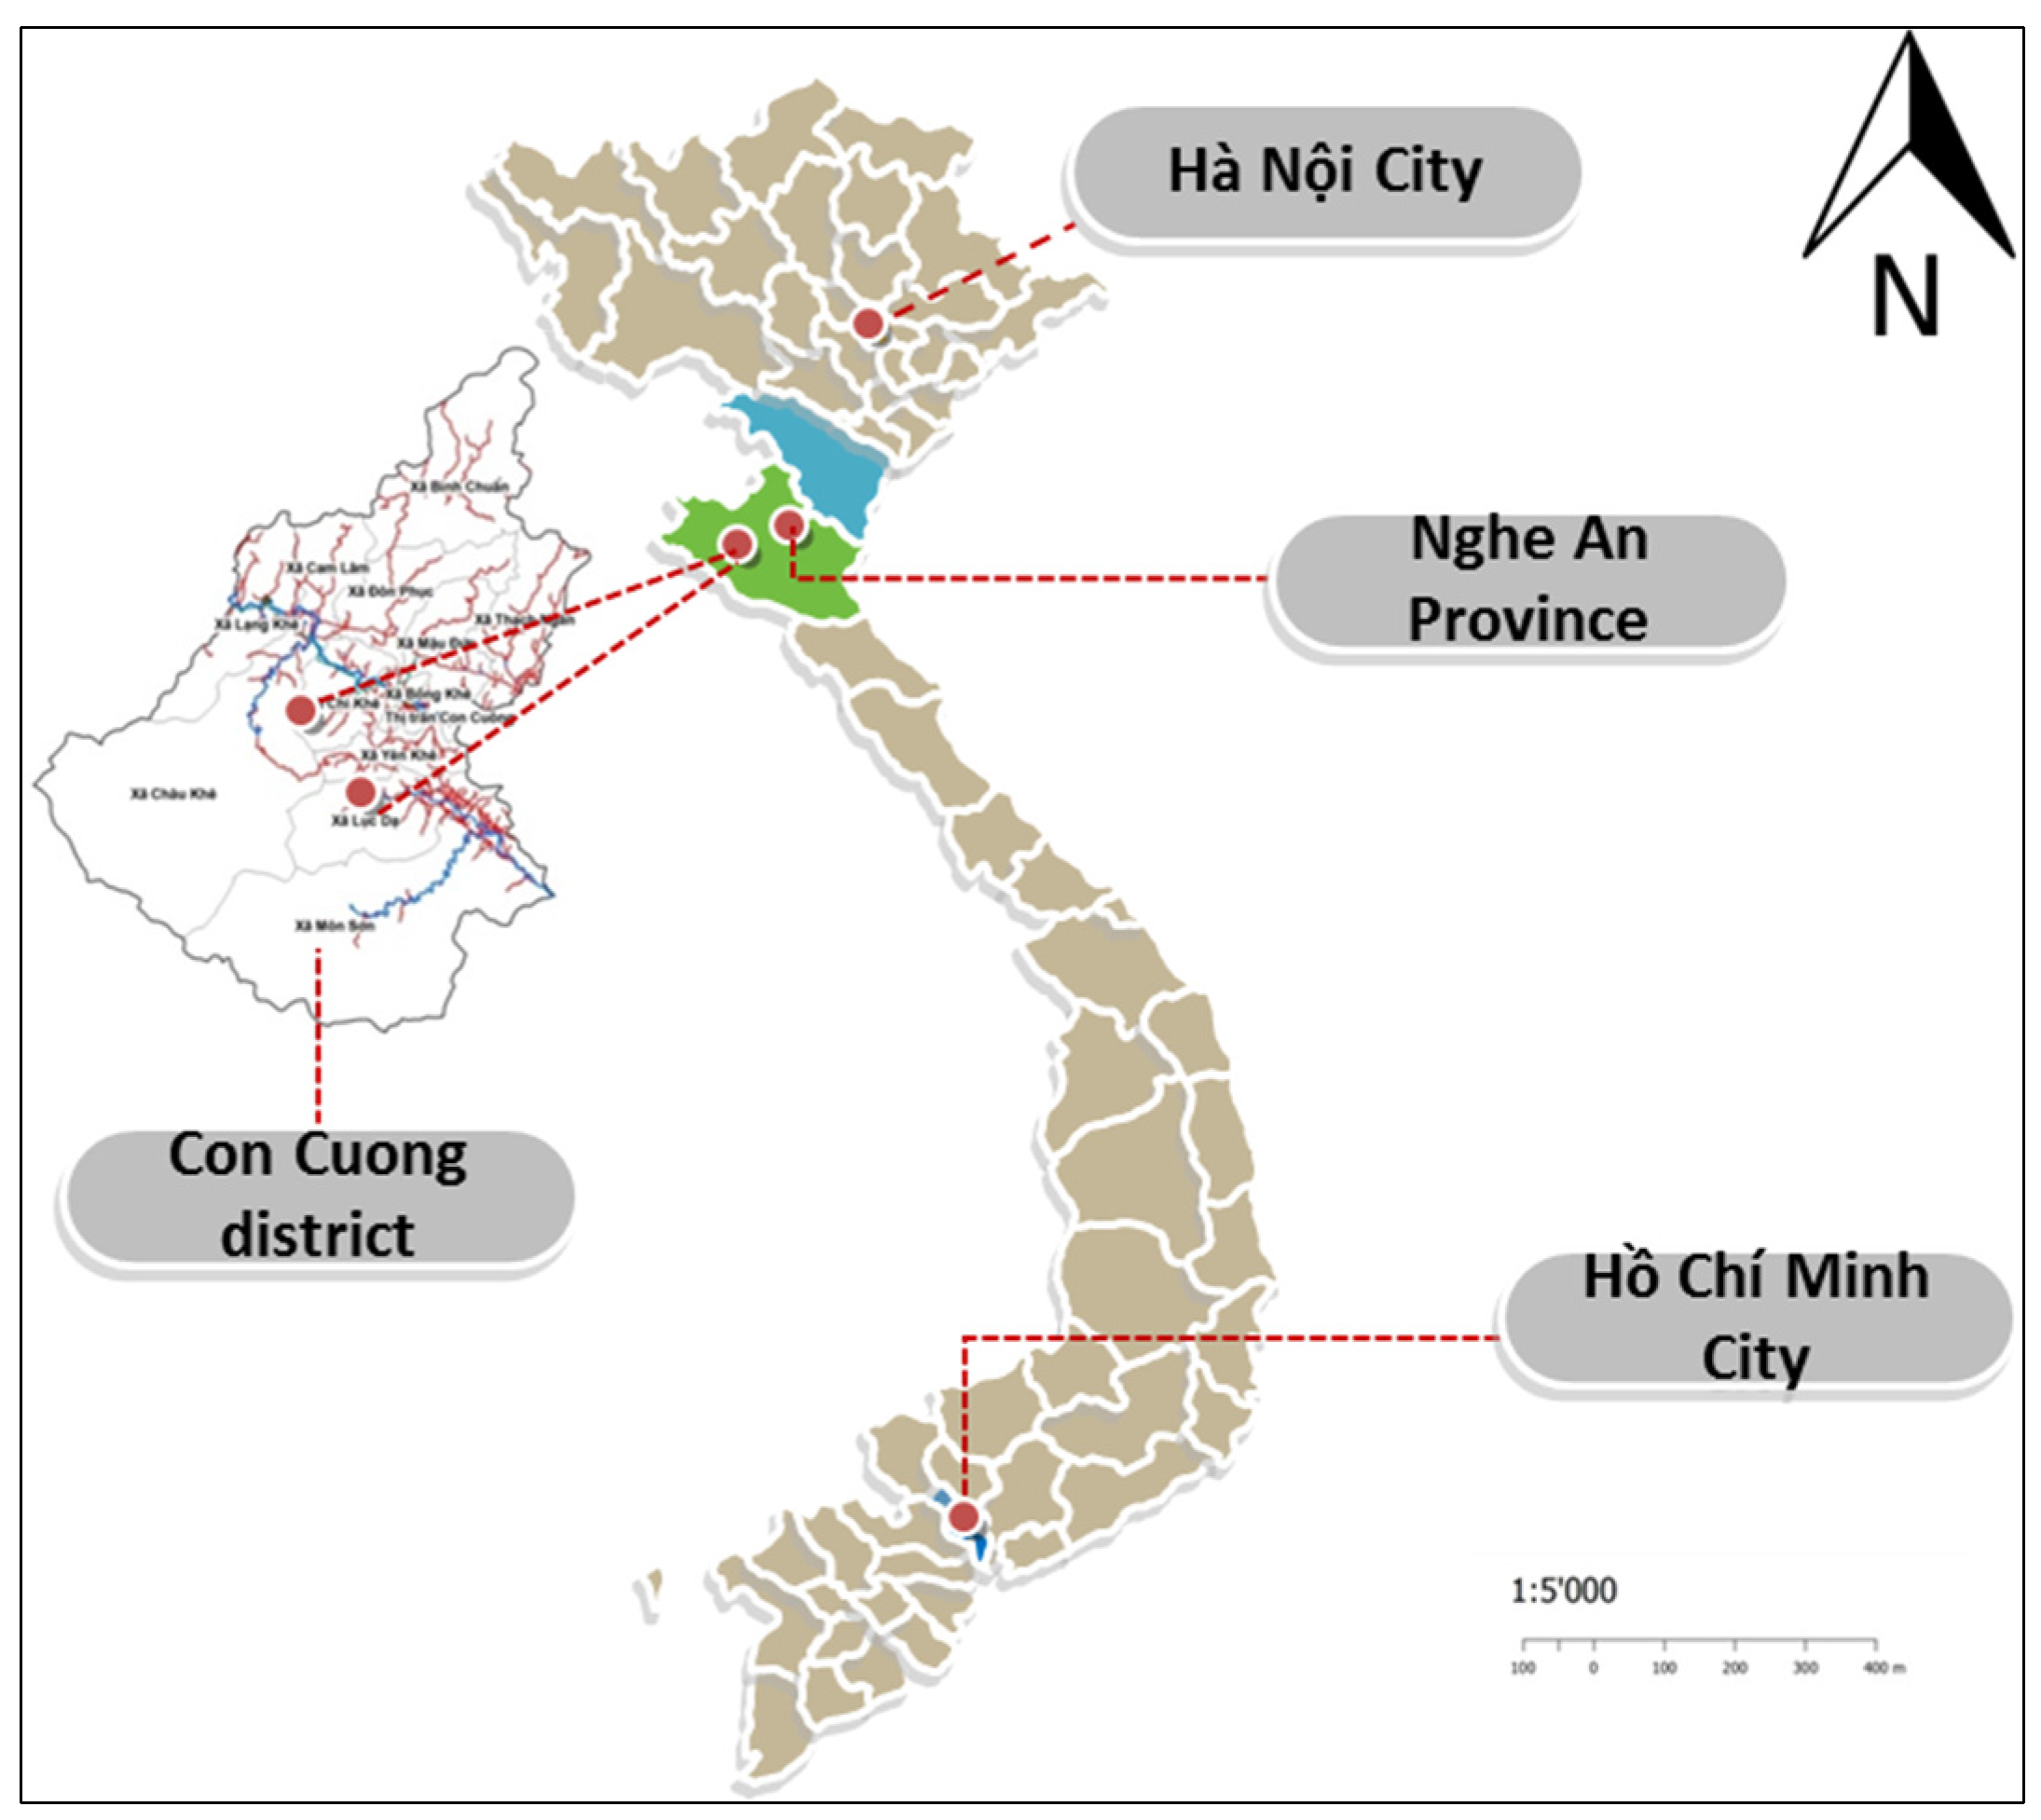
Con Cuong is one of the mountainous districts in Nghe An Province. It is composed of 13 administrative units, including one town and 12 communes. Located in the western part of Nghe An, Con Cuong borders the districts of Anh Son in the southeast, Tan Ky and Quy Hop in the northeast and Tuong Duong in the northwest (Figure 1). Con Cuong experiences severe weather conditions, with the highest-ever temperature recorded at 43 °C and the lowest at 6.2 °C. Owing to its geographical features, the district is prone to the direct effects of the hot and dry southwest wind from Lao PDR, greatly affecting crop plantations [8].
2.1.2. Population and the Labor Force
In 2014, the total population of Con Cuong—composed mainly of Thai, Kinh, Dan Lai and Tay groups—was estimated at 69,773. Of these, 49.95% were males and 50.05% were females. The total number of households in the district was 15,820 (Table 1). The total labor force—composed of individuals aged 18 to 60 years—was estimated at 43,734, comprising 62.78% of the district’s total population. Male labor comprised 51% of the total labor force in the district. Most of the labor force was untrained and had very low education levels. In addition, most of the labor came from rural areas (92.70%). This poses a major constraint to the district’s economic development.
2.1.3. Land Use
The total land area of Con Cuong is 173,831.12 ha, of which 94.61% (164,460.42 ha) is comprised of agricultural land. The district devotes 10,145 ha to agricultural production, accounting for 6.17% of agricultural land, while forestland occupies 154,262 ha or 93.8% of agricultural land. Nonagricultural land—including construction land, roads and residential land—occupies 2942.98 ha (1.69%), while unused land covers 6427 ha (3.7%) (Table 2).
2.2. Survey Instrument Design and Data Analysis
A simple random sampling method was employed in selecting household/farmer survey respondents. The sampling frame of the survey included all farmer households that participated in forest protection programs and owned forestlands in the two communes in Con Cuong District, Nghe An Province. Lists of all farmers with forestlands were obtained with the help of local authorities in the area. A total of 300 households in the two communes were randomly chosen as samples for the study.
The contingent valuation method (CVM) was used to determine the willingness-to-participate in REDD+ in the selected study sites. Respondents were asked directly the question “Would you like to participate in the REDD+ program? If YES, How much would you be willing to accept for this price level of carbon given a certain carbon price level?” The questionnaire was divided into six sections: (a) Identification and knowledge about REDD+; (b) Existing situation regarding REDD+ in the area; (c) Household’s expectation; (d) Basic information of the household; (e) Willingness-to-participate in REDD+; and (f) Poverty and food security status.
Since the payment for REDD+ is not yet defined, the amount of payment from estimating Willingness To Pay (WTP) will be understood as an additional income to households. Firstly, the household income was estimated from the household survey. Indicators related to poverty issues such as household income per year, food security status, and sources of income were used as baselines in analyzing the impact of REDD+ on household income. Poverty rate data were gathered from commune authorities based on the MOLISA (Ministry of Labour—Invalids, and Social Affairs) indicator (Poor households in rural areas are those with an average income below VND 400,000 per capita per month or VND 4,800,000 per capita per year (roughly USD 19 per capita per month). For urban areas, the average income is below VND 500,000 per capita per month or VND 6,000,000 per capita per year (roughly USD 24 per capita per month). The near-poor households in rural areas are households with an average income of VND 401,000–520,000 per capita per month (roughly USD 19–25 per capita per month) and for urban areas, the average income is in the range of VND 501,000–650,000 per capita per month (roughly USD 24–31 per capita per month) in 2015. Comparison of the average household income after receipt of carbon payments with the poverty line in the communes provided an estimate of the potential impact of REDD+ payments on poverty reduction.
2.3. Literature Review
2.3.1. Poverty Situation in Vietnam
Vietnam has a remarkable record for achieving the first of the Millennium Development Goals (MDGs)—by reducing poverty by half over the period 1990–2015—more than a decade in advance of forecast rates of change. According to the most recent progress report published in 2005 [10], the percentage of households below the poverty line (assessed as the cost of adequate food plus non-food essentials) fell from 58% in 1993 to less than 24% in 2004, while extreme poverty (food costs alone) dropped from 25% to below 8%. As compared with other countries in Asia, Vietnam has made significant progress in reducing poverty over the past two decades compared with countries such as Lao PDR, Philippines and Myanmar, which have very high poverty rates in the range of 23.2–25.6% (Figure 2).
Based on the information released by MOLISA, the incidence of poverty in Vietnam was estimated to be 12% at the end of 2011. In 2015, the poverty incidence was further reduced to 7% based on the indicators shown in Table 3. As shown in Table 3, rural households with incomes less than VND 400,000 (USD 19) were classified as poor. In urban areas, households were classified as poor if their income was VND 500,000 (USD 24) or less.
The poverty rate, based on the cost of a consumption basket allowing a daily intake of 2100 calories per person and some non-food expenditure, dropped from 58.1% in 1993 to 14.5% in 2008. This means that about 43 million people have risen out of poverty. The food poverty rate fell from 24% to 7% over the same period, while the poverty gap narrowed from 18.5% to 3.5%. The results of the 2010 survey of living standards in Vietnam following the methodology used by the MOLISA showed that the poverty rate fell from 18.1% in 2004 to 15.5% in 2006 and to 13.4% in 2008, but rose again to 14.2% in 2010 (Figure 3).
For the period 2010–2015, Vietnam was able to reduce the incidence of poverty from 14.2% in 2010 to 7% in 2015 (Figure 3). However, the poverty rate in the mountainous regions is still very high. Nghe An Province is a mountainous area where most people rely on forest resources for their livelihood. More than 80% of the Nghe An area is mountainous. Nghe An is composed of 217 commune administrative units of which 195 are mountainous and remote communes. According to the General Statistics Offices (GSO), the poverty rate of Nghe An was 25% in 2006 but sharply declined to 12.3% in 2015. However, this figure is double that of the whole country. Since most household incomes in the mountainous areas are derived from forest products, there is a need to improve forest production and protection to enhance their incomes.
FAO has developed six strategies that may help those local people who rely on forest resources for their income to escape poverty. These include: converting production forestland to agricultural production, and generating income from logging timber, NTFPs, payment for environmental services, creating jobs, and enjoying indirect benefits from the forest [12]. In her study on forest development and its contribution to poverty reduction, Dieu [12] indicated that payment for environmental services (PES) can on average help local people increase their household income by about VND 1.8 million/ha/year (USD 90/ha/year).
2.3.2. The Role of Forest in Local Poverty Reduction
Forest cover and poverty. In Vietnam, there is a very strong positive relationship between poverty rate and forest cover (Table 4 and Figure 4). About 240 million people live in the forest areas of developing countries, of which 60 million are ethnic or local people. Forest products are an important source of income for a significant number of the poor and of mountain people. Forests provide them with food (wild vegetables, fruits, rice, cassava, maize and meat), energy (wood fuels) and natural medicines [14].
In Dak Lak Province, however, local people rely much more on agricultural produce than on forest products for their livelihood, since they live too far from the city and the forest area is very inaccessible to them [16].
PES and Poverty Reduction. The introduction of the PES mechanism has the potential to benefit service providers in rural areas. The benefit can be direct or indirect and can come in the form of diversified income sources, reliable and stable payments, training and better infrastructure. “Since PES schemes appeal to land-owning and land-controlling participants, it is more complicated to assist the poorest people” [17]. In the worldwide debate about the effects of PES on poverty, the subject is beginning to be controversial. While it is crucial to promote a PES scheme that considers the effects of payments on poverty reduction, these should not affect the main purpose of the program, which is the conservation and provision of environmental services. There is a need to be clear on the objectives of the PES program and consider poverty alleviation as a valuable eligibility criterion that is beneficial for the poorest communities [18].
REDD+ and Poverty Reduction. REDD+ is a performance-based program that will be financed from international sources, presumably by developed countries although this has not been adequately defined. Payment will be ex post based on performance over a 5-year period. Therefore, the contribution of REDD+ to poverty alleviation is still a big question. No study to date has been undertaken on that subject.
However, the REDD+ program provides great opportunities for a participating country to enhance its economic programs, especially on sustainable forest management, environment protection and poverty reduction. For the poor, the program is expected to provide both income through the Carbon Finance Mechanism and non-income benefits. The Carbon Finance Mechanism is intended to provide incentives for stakeholders, including local peoples and the private sector, so as to ensure the long-term sustainability of the REDD+ projects. Non-income benefits on the other hand, may include increases in human and social capital and higher visibility vis-à-vis external investors. However, the extent of possible incomes generated for the rural poor from REDD+ is too early to estimate. Experiences for example from a number of countries show that poor people who participate in environmental service schemes similar to REDD+ are generally better off, or at least not worse off [19].
In addition, it is believed that the program can provide incentives for addressing deforestation because carbon payments are made for standing trees rather than just for logged trees and cleared land. However, the success of the REDD+ program implementation, particularly when payment is based on performance, will depend on three factors. First is the amount or level of compensation. If it is too low compared with the opportunity costs or program implementation costs, governments or participants will lose interest in the program. Second is the fairness or attribution issue. The REDD+ payment systems need to be designed in such a way that people or organizations that have actually contributed to reduction in deforestation are provided payments commensurate to their contributions. Third is the initial costs of the programs, which seem to be very large. A mechanism to pay for part of these costs from future REDD+ payments may need to be developed. Initially focusing on reducing carbon emissions, the REDD+ process became increasingly linked with developmental goals that represented the primary interest of all Amazon countries. As a consequence, REDD+ can be seen as another attempt to achieve the twin goals of environmental protection and rural development [20].
3. Results and Discussion
3.1. National Policies That Support Forest Management Programs and REDD+ in Nghe An Province
3.1.1. Forest Development Programs
Forest improvements in Con Cuong District are largely driven by different national programs/policies that encourage local people to protect the forest and improve their livelihoods in upland areas. Key informant interviews show that government programs, such as those instituted under Decision Nos. 661, 167, 147, 327, 135, and 30a, have helped local people in improving forests and their livelihoods. For example, Decision Nos. 134 and 135 have helped poor households build their houses, in addition to providing seedlings and animals such as cattle and pigs. The reforestation program, instituted under Decision No. 147 issued by the Prime Minister, has aimed to provide rice to local people to stop them from practicing shifting cultivation. Also, it provided seedlings, including Melia and acacia trees, and livestock such as cows and pigs to the households. Recently, the government has adopted reforestation programs such as the one stipulated in Decision No. 327 (the re-greening bare hills and wasteland program) (The objectives of Program 327 were to re-green open land and bare hills, protect existing forests, assist natural regeneration and reforestation, utilize coastal alluvia, promote aquaculture, develop long-term industrial crops and fruit trees, expand cultivated land in delta areas, build infrastructure, promote social welfare, and recruit laborers to project areas in order to form new communes) and in Decision No. 661 (the 5-million-hectare reforestation program), which has increased the forest cover rate from 38.6% in 1999 to 53.1% in 2010 at the provincial level.
To improve forest protection, some communes established forest protection groups that operated using funds from the payment for forest environmental services (PFES). For instance, Chi Khe commune established the Forest Protection Committee in 2013, which is composed of two groups in charge of patrolling and managing forests. Committee members include the Chairman of communes and two Vice Chairmen. The Forest Protection Committee has to cooperate with Forest Rangers at the district level to patrol and manage forests in the commune. The forest protection group also worked well in the case of Pu Mat National Park (PMNP). In 2014, the PMNP paid VND 5 million per household to contracted households for forest protection and patrolling. PMNP staff forged a contract with a group of households residing in forestland near the national park’s border. People were satisfied with the payments from the PMNP, thus encouraging them to protect the forest better.
3.1.2. Payment for Forest Environmental Services (PFES)
Nghe An Province has formulated the Forest Protection and Development Fund (FPDF) by virtue of Provincial People’s Committee No. 69/2011/QD-UBND dated 16 November 2011. This is based on instructions under Decree No. 99/ND-CP [21,22] of the Central Government on PFES. The fund comes from payments of users of forest environmental services. To date, the provincial government has been able to collect payments from 7 out of 14 hydropower plants in the province, as well as from local water companies [23]. According to Nghe An FPDF report, forest environmental service users had paid a total of VND 94.837 billion up to April 2014. Specifically, the total amount received was VND 88.462 billion from hydropower plants and VND 28.037 million from local water companies. The highest amount was collected from the Ban Ve hydropower plant, which paid VND 25.166 billion.
The total area of forestland that was flooded due to the construction of the hydropower plants was 562,743 ha in 2013 and 273,982 ha in 2014 [24]. However, payments were only received by forest owners who were members of organizations and state enterprises. The remaining forest owners, such as individual households and community forests, were not able to receive their payments because of unclear boundaries among forest owners. According to the FPDF report, the total amount paid from the FPDF was VND 16.141 billion, of which VND 6.245 billion was paid to forest owners in 2012 and VND 5.682 billion in 2013. Unpaid fees to forest owners, including individual households, private owners and community forest owners, amounted to VND 3.254 billion.
The main reason for withholding payment is the lack of clear boundaries within forest areas of forest owners. Data on forest areas of individual households, commune management and community forest management are not clear and need to be clarified [25]. Decree 99/2010/ND-CP requires applying the K coefficient in determining payment price between basins in the same river. This is difficult to apply in Nghe An Province, however, because of the unclear boundaries. In response, the Nghe An DARD (Department of Agricultural and Rural Development) and the Department of Finance and Department of Trade have submitted a proposal on the average price of payment for environmental services to the PPC (Provincial People’s Committee) for approval [25]. The problem of slow distribution of payment to forest owners in Nghe An can be resolved by identifying the correct boundary marks and forest owners.
The PFES initiative is in the process of paying forest owners VND 20 per KWh collected from hydropower plants (HPPs) based on Decree 99. Since these have shut down, forest owners are yet to receive PES from HPPs. About 500 ha of the entire territory of Chi Khe and other communes are located within the watershed area. The HPPs are working on identifying the forest areas of each forest owner in the watershed, which they will have to submit to DARD. Afterwards, a meeting with local villagers will be organized to inform them of the forestland areas that will attract PFES from HPPs.
It is widely recognized that providing economic incentives to local people can improve forest development. NTFPs and PFES can stimulate local people’s interest in protecting the forest by providing additional income to households. Villagers play an important role in forest protection, and in ensuring the fair distribution of benefits among themselves. Improving local livelihoods is necessary in dealing with deforestation and forest degradation. Thus, the linkages among various development program outcomes, together with the support from government, must be considered.
3.1.3. REDD+ Pilot in Con Cuong
REDD+ was implemented in Con Cuong District under the LEAF project (Lowering of Emissions in Asia’s Forests) organized by SNV (The Netherlands Development Organization) and research activities conducted by CARES-VNUA (Center for Agricultural Research and Ecological Studies—Vietnam National University of Agriculture) from 2011 to 2013. However, the outcome of the project was deemed insufficient, since the local people have not benefited from the program. Local people were less interested in the REDD+ program compared with PFES and the forest protection programs. This points to a limited understanding of the REDD+ program at the village level, as it is unclear how benefits from emissions reduction can be achieved and shared among stakeholders. Currently, only the State Forest Company has authority to implement REDD+. However, there is a conflict of interest since the purpose of the program is to address carbon emissions while the company annually logs timber and contributes to the carbon emissions.
As stipulated in the Nghe An’s Provincial REDD+ Action Plan (PRAP), Con Cuong District has been identified as one of the pilot areas for the national REDD+ program. The two study sites, Luc Da and Chi Khe communes, were designated as pilot sites for the national REDD+ program in Con Cuong District.
In September 2015, the REDD+ committee for Nghe An was established based on Decision No. 4308 issued by Nghe An People’s Committee on 24 September 2015. However, after a year, Nghe An had just completed the draft of the PRAP for the period 2016–2020. To date, Con Cuong District has not yet implemented the national REDD+ program.
3.2. Sociodemographic Characteristics of the Respondents
Table 5 presents the demographic characteristics of household respondents in the two communes. Results showed that the average household size, number of family, members in the labor force, and income per capita of respondent households that responded positively to participating in REDD+ were slightly higher than those who did not. While the income per capita of households that agreed to participate in the program in Chi Khe commune was higher than of those that did not, in Luc Da commune, the income of participating households was only VND 3.495 million, which was less than that of those that did not agree to participate in REDD+, with an income of VND 3.507 million. However, the difference was not statistically significant. This can be explained by the fact that Luc Da is located in a remote area, where villagers have limited access to information and thus depend on forest products for their livelihood.
The available family labor of households that agreed to participate in the program was greater and also younger than those households that did not agree to participate. This is because only the younger people could manage to traverse the steep slopes and rugged terrain of the forests. Household sizes of participating and no-participating households in Luc Da were 4.7 and 4.52 members, respectively. The average age of respondents who participated in the program was less than for the nonparticipants. The reason is that the older people often choose to undertake other kinds of work, such as farming, which is closer to home than the work in the forest.
3.3. Sources of Income of Households in the Study Sites
A comparison of income sources by household groups in both communes is presented in Table 6. Findings show that the total income of participating households in both Chi Khe and Luc Da communes was higher than those of nonparticipating households. The average income of households that participated in the program in Chi Khe and Luc Da was VND 16.63 million/year and VND 15.42 million/year, respectively. The nonparticipating groups, on the other hand, earned VND 15.01 million/year and VND 14.48 million/year, respectively. The t-test conducted confirmed that there was a significant difference at the 10% level between the participating and nonparticipating groups.
It is interesting to note that off-farm income of households in Chi Khe was higher than that of nonparticipating households at VND 3.01 million/year and VND 2.4 million/year, respectively, while in Luc Da this amounted to VND 2.68 million/year and VND 3.06 million/year, respectively (Table 6). This can be attributed to the fact that few households in Luc Da commune earn income from off-farm jobs. This means that the time people in Luc Da devote to look for jobs significantly reduces the time they can spend protecting the forests. In Chi Khe, on the other hand, because villagers live near the road, they can get off-farm jobs easily while managing to spend time for forest protection.
Income from forests, including that from NTFPs, timber logging and PFES is the major consideration in the decision to participate in the program. This is because the perception is that protecting the forest will bring more benefits from NTFPs. A comparison of income derived from forests by the participating group has shown that participating households in Chi Khe commune have higher incomes than their counterparts in Luc Da commune. The reason is that the forest area managed by participants in Chi Khe is larger than that in Luc Da. Also, a number of households in Chi Khe commune receive PFES from the HPPs. Thus, for the participating group, income from forest resources is significantly higher at 1% than for the nonparticipating group. Livestock income was also higher for the participating group since most large animals such as buffaloes and cows are protected in the forestland areas where they are allowed to freely graze. The fences that farmers erect and the dense thicket of the forest area provide natural protection for the animals (Table 6).
3.4. Awareness of REDD+
A better understanding of the traditional knowledge and the constraints of local communities about forest protection, carbon sequestration and climate change can also help decision makers in devising more effective mechanisms for encouraging more community involvement in REDD+. However, up to now, REDD+ is still a new and strange term for the local people in the study sites.
The survey respondents were asked if they were aware that deforestation and forest degradation are linked to climate change, since CO2 is released to the atmosphere once the trees are cut. Out of 300 respondents, 290 (96.6%) said they were aware of the threat of deforestation and forest degradation to the environment. Despite this high rate of awareness, the number of households that had recently cleared forests was high. About 45% of households admitted that they had cleared the forest for various purposes during the past 5 years. As shown in Figure 5, 21% of interviewed households admitted that they themselves cleared the forest for their personal use while 17% of forest users reported that people from other villages were also responsible for the forest clearings. According to 41% of respondents, the main forest users were households from outside the villages. Moreover, 56% of forest users were reported to be outsiders, which included commercial and household users. These users are normally companies that collect timber, such as acacia and bamboo, for industrial purposes (Figure 5).
Using a scale of 1 to 5, respondents were asked about the importance of reducing carbon emissions from deforestation and forest degradation (REDD+) to the environment to and climate change. As shown in Figure 6, results indicate that 33.7% said REDD+ is slightly important, 22% saw it as being important and 15.3% mentioned that it is very important. Significant differences can be observed between the two groups. It is worth mentioning that those who responded that REDD+ was important were also usually the ones who accepted the REDD+ program and the payments for carbon. On the other hand, groups that expressed willingness-to-participate in REDD+ were also the ones who mentioned that the program was important for addressing climate change and protecting the environment.
3.5. Impact of REDD+ on Poverty Alleviation
REDD+ could contribute to poverty reduction in many ways. Our study indicates that REDD+ provides local households with additional income from carbon credit payments (162 respondents or 83.07%) and offers other co-benefits such as improved land tenure or information exchanges (21 respondents or 10.77%). There are many factors affecting poverty reduction; about 26.67% of respondent indicated that REDD+ can contribute not only to household income but also to sustainable community development and especially to providing benefits for the environment and water sources.
The income of poor households is just about half of the income of non-poor households. As shown in Table 7, livestock and crop cultivation constitute a large percentage of total income relative to other sources of income, since the communes depend mostly on agriculture as the main income source. The contribution of income from forest resources such as timber and NTFPs (honey bees, bamboo shoots, and rattan) to poor households is relatively high (28.8%) compared with other income groups (19.4%). While the non-poor households earn more income from off-farm activities, the poor households depend much on the forests resources, owing to their limited access to information from outside the village relative to other groups. In addition, capital and operations costs of collecting forest products are relatively very small. Thus, poor households can afford to engage in these activities extensively. t-test results show that the differences among income sources are statistically significant at the 1% level of significance.
Table 8 shows that there is a negative correlation between income from forest products and the income status of households, which is significant at the 1% significance level. That is, income from forests is a significant contributor to the household income of the poor. If the REDD+ program is carried out in the communes, income from forests will increase via payment from carbon sequestration, which will then contribute to poverty reduction in the community.
Comparison of income of the respondent households with and without participation in the REDD+ program is presented in Table 9. It is clear that with the REDD+ program, each household can receive about VND 7.83 million per year, which represents 37.86% of the total household income. Total income of households with the REDD+ program is VND 20.68 million and VND 14.72 million for households that do not participate. Thus, it is clear that REDD+ will significantly contribute to household income.
However, other farming income sources still contribute significantly to the household income. Due to large fluctuations in the market prices of perennial crops and carbon prices, the REDD+ program should incorporate agricultural production activities and traditional livelihood practices (such as hunting, fishing, and NTFP collection, among others) in the overall development strategy to ensure the attainment of subsistence income from various sources, as well as food security in the long term. This is because poor people do not have enough capital to expand their agricultural plots, and are then forced to collect forest products for their household subsistence.
Table 10 shows that both the poor and non-poor households in the communes benefit from the REDD+ program. Without the program, each poor household earns a total of 10.34 million VND/year while each non-poor household earns 21.27 million VND/year. The program will increase the income of both the poor and non-poor households in the study areas. Total income of non-poor households participating in REDD+ is VND 26.57 million, higher by 5.3 million VND/year than non-poor households that did not agree to participate in REDD+. Poor households that participated in REDD+ program earned a total of 15.25 million VND/year, higher than the poor households that did not participate in the program.
The contribution of the program to poverty reduction at the household level is shown in Table 11. Initially, survey results showed that 118 out of 300 households in the two communes were classified as poor (based on the list of poor households in the communes), which means that the initial poverty rate in the study sites was 39.4%. However, factoring in the income from the program, only 99 households are now classified as poor. The poverty rate for both communes was reduced from 39.4% to 33% with the REDD+ program (Table 11).
3.6. Income Distribution and Equality of Sampled Households
The analysis on distribution of income of households in the study sites is presented in Figure 7. The GINI coefficient was used to measure the level of inequality of the distribution of income. The coefficient varies between 0, which reflects complete equality, and 1, which indicates complete inequality (one person has all the income or consumption; all others have none). Graphically, the GINI coefficient can easily be represented by the area between the Lorenz curve and the line of equality. As shown in Figure 7a, the GINI ratio without REDD+ was quite low at 0.29 and the Lorenz curve was close to the 45-degree line, indicating equal distribution among households. These results show that while there are poor and non-poor households in the two communes, no household classified itself as rich according to commune officers. Some respondents were alarmed that the program could actually increase income inequality among the households since only households that owned forestlands can receive payment from the program. However, the results showed that the program can actually contribute to furthering equity in the local community, as the GINI coefficient was smaller than that without the program (GINI = 0.25). This means that poor households are provided the opportunity by the program to increase their income (Figure 7b).
3.7. Suggestions on the Distribution of REDD+ Funds to Local Villagers
The top-down land use management approach that is based on land use planning from subnational government programs (provincial and district) has not been feasible. The use of participatory methods and a bottom-up approach are more effective and equitable in promoting the REDD+ program [27]. A participatory approach may be more effective in encouraging farmers to actively participate in providing carbon sequestration services [28]. Hence, it is necessary to identify clear beneficiaries and the ways implementation of benefit-sharing mechanisms can induce local people to participate in the REDD+ program [29,30]. Therefore, empowering local stakeholders would be a key element for the success of the REDD+ program [31]. Benefit-sharing mechanisms involving democratic and interactive processes for local people will make it more likely that REDD+ goals will be achieved [32]. One of the issues addressed during the focus group discussions was the benefit-sharing mechanisms. One group supported the proposal to use one-third of the program funds for households to patrol and monitor forestlands; for another one-third to be used for reforestation of community forests and to support the poor, disabled children, and orphaned children in the commune; while the remaining one-third would be used for a collective village fund earmarked for infrastructure upgrades (e.g., school, roads). Another group mentioned that the program income must be distributed based on areas managed by each household. They wanted the money to be shared only among those households in the community that have forest areas. They also mentioned their lack of trust in the current village committee officers in handling the funds. Indigenous people’s rights and their voices have often been absent. This, and the role of local participation need to be addressed; these results are supported by similar findings [33,34]. It was also suggested that a committee for managing the program fund be set up and organized. Strong existing local institutions, clear land tenure, community control over land management decision making and up-front, flexible payment schemes are deemed to be vital [35].
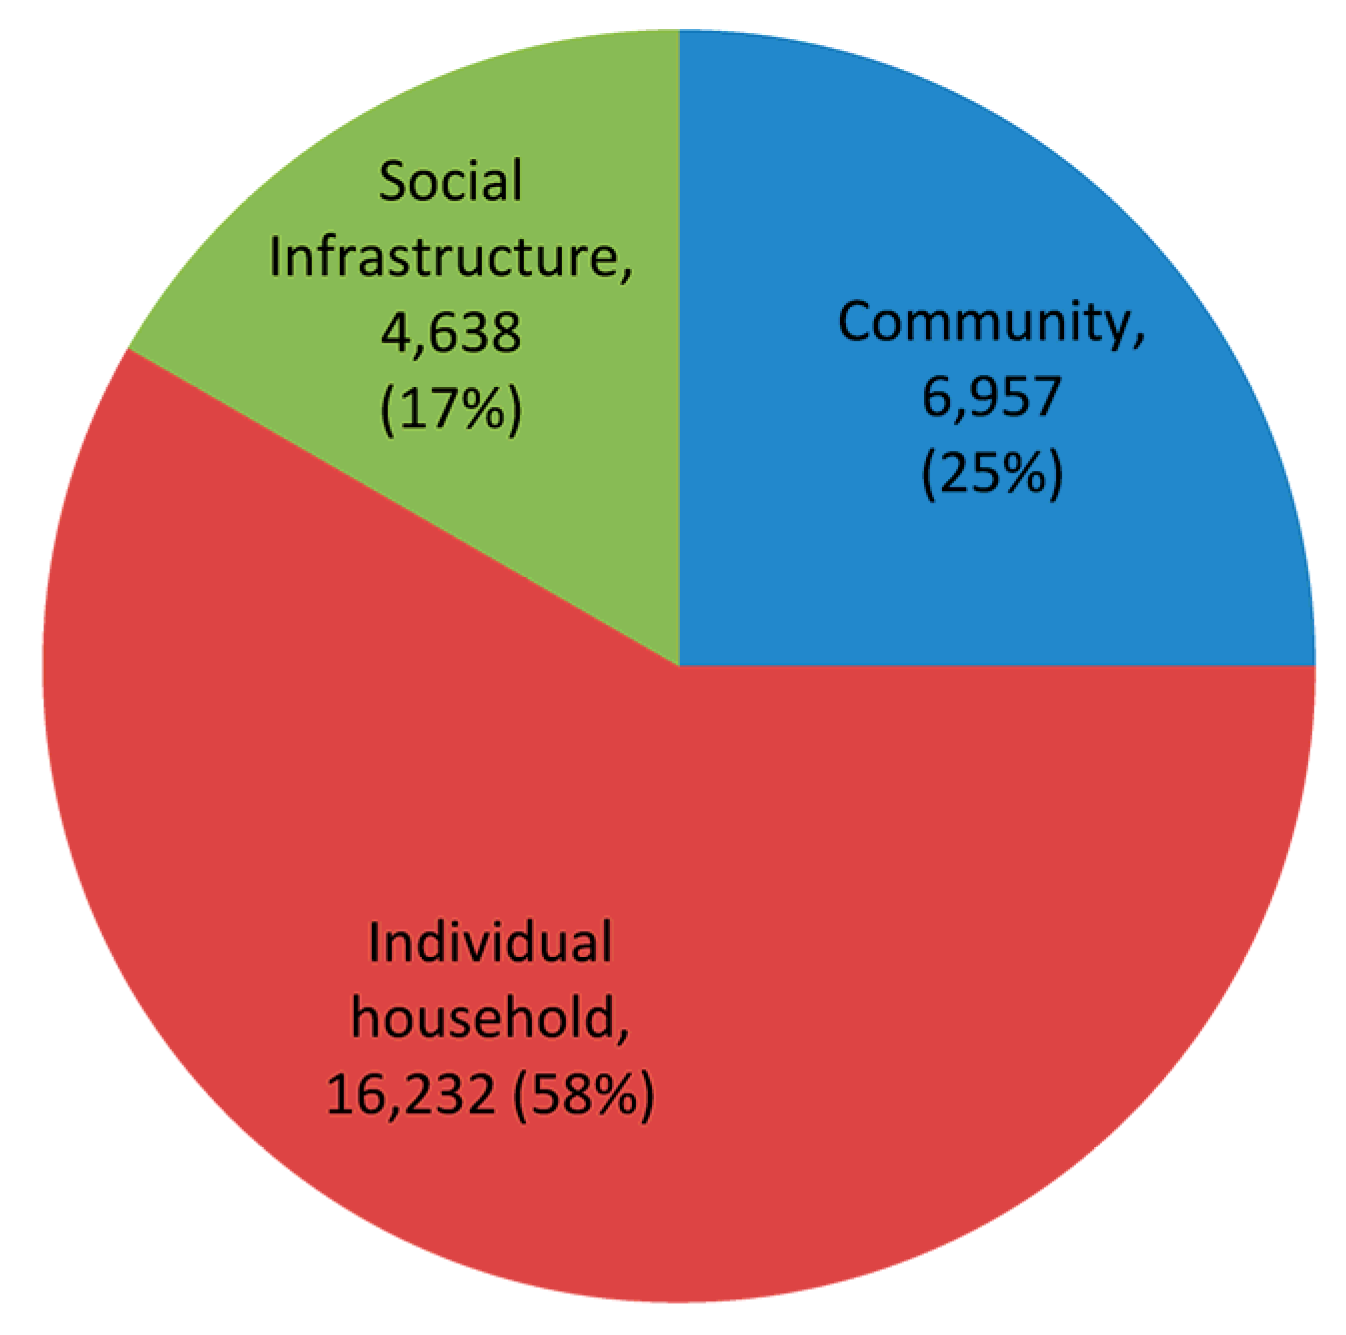
There were many opinions on how the funds should be utilized and distributed among the households. Twenty respondents suggested that only households that participate in the protection of the forests should be paid. Others suggested that payments should be made to specific groups and be allocated as follows: 58% (VND 16,232 million) as household dividend for those individual households that conserve forests, 25% of the share (VND 6957 million) as community dividends for a community fund to help the poor build better houses and support poor children in the communes, and 17% of the fund (4638 million VND) for social infrastructure including building a road connecting the villagers to the commune center, or schools for children (Figure 8).
4. Conclusions
Vietnam is on the way to developing a national REDD+ program with support from the government. The study shows positive signs of REDD+ contributing to poverty reduction in the study sites. Income from forests provides a significant contribution to the household income of poor people. Currently, there are many stakeholders involved in REDD+; however, there is a lack of representation of key actors in the decision-making processes. Our study suggests, however, that a committee organized by local villagers at the commune level be set up to manage the program fund. Transparency is important for implementing benefit sharing among households and stakeholders of the program.
The paper recommends that the issue of land tenure of individual households be addressed. While the financial benefits from the program may contribute to the incomes of some households that are able to participate in the program, it could also increase income inequality and generate conflicts with communities that are not involved in the program as well as with those who have no legal land titles.
It is suggested, therefore, that local authorities should focus on determining the land tenure rights of forestland owners within the villages and communes. In addition, a comprehensive study on the impact of the program on forest conservation and poverty reduction should be undertaken. Stakeholders in the REDD+ program should recognize and acknowledge the trade-offs between conservation and economic development or poverty reduction. Policy makers need to take into account all relevant economic, social and political issues to ensure the successful implementation of the program. A comprehensive trade-off analysis of REDD+ implementation and a business-as-usual option is needed to determine the indirect economic, political, and socials costs and benefits of the program.
Acknowledgments
This study was supported by SEAMEO Regional Center for Graduate Study and Research in Agriculture (SEARCA), College, Laguna, Philippines and Center for International Forestry Organization Research (CIFOR).
Author Contributions
Nguyen Dinh Tien, Roberto F. Rañola, Jr. and Pham Thu Thuy collected primary data and undertook analysis of these data. All authors contributed to writing the manuscript.
Conflicts of Interest
The authors declare no conflict of interest.
References
- Luca, T.; Mahanty, S.; Suich, H. (Eds.) Payments for Environmental Services, Forest Conservation and Climate Change: Livelihoods in the REDD? Edward Elgar: Cheltenham, UK; Northampton, UK, 2010; p. 267. ISBN 9781849802994. [Google Scholar]
- Gullison, R.E.; Frumhoff, P.C.; Canadell, J.G.; Field, C.B.; Nepstad, D.C.; Hayhoe, K.; Avissar, R.; Curranl, M.; Friedingstein, P.; Jones, C.D.; et al. Tropical forests and climate policy. Science 2007, 316, 985–986. [Google Scholar] [CrossRef] [PubMed]
- Ebeling, J.; Yasue, M. Generating carbon finance through avoided deforestation and its potential to create climatic, conservation and human development benefits. Philos. Trans. R. Soc. Lond. B 2008, 363, 1917–1924. [Google Scholar] [CrossRef] [PubMed]
- Pistorius, T. The Impact of International REDD+ Finance. Vietnam Case Study. 2015. Available online: http://www.climateandlandusealliance.org/wp-content/uploads/2015/08/Impacts_of_International_REDD_Finance_Case_Study_Vietnam.pdf (accessed on 3 April 2016).
- Ministry of Agricultural and Rural Develpment. Mid-Term Report Request for Additional Finance from the FCPF. Unpublished work. 2013. [Google Scholar]
- Pham, T.T.T.; Bennett, K.; Vu, T.P.; Le, N.D.; Nguyen, D.T. Payments for Forest Environmental Services in Vietnam: From Policy to Practice. Occasional Paper 93. CIFOR, 2013. Available online: http://www.cifor.org/publications/pdf_files/OccPapers/OP-93.pdf (accessed on 14 December 2016).
- UN-REDD+ Programme. Final Report: Analysis of Opportunity Cost for REDD+; UN-REDD+ Programme Vietnam: Hanoi, Vietnam, 2011. [Google Scholar]
- Con Cuong People Committee. Report on Social—Economics Development of Con Cuong; Con Cuong People Committee: Con Cuong, Vietnam, 2014. [Google Scholar]
- Con Cuong Statistic Department. Socio Demographic of Con Cuong District; Con Cuong People Committee: Con Cuong, Vietnam, 2015. [Google Scholar]
- Asian Development Bank. Basic Statistics 2017 in Economic Research and Regional Cooperation Department Development Economics and Indicators Division. ADB, 2017. Available online: https://www.adb.org/sites/default/files/publication/298061/basic-statistics-2017.pdf (accessed on 3 April 2017).
- Ministry of Labour—Invalids, and Social Affairs. Poverty Line of Vietnam for Period of 2011–2015; Publishing House: Hanoi, Vietnam, 2011. [Google Scholar]
- Dieu, D.T. “Phát Triển Lâm Nghiệp Gắn Với Xóa Đói, Giảm Nghèo ở Việt Nam”—Forest Development and Its Contribution to Poverty Reduction in Vietnam. 2014. Available online: http://lyluanchinhtri.vn/home/index.php/thuc-tien/item/1087-phat-trien-lam-nghiep-gan-voi-xoa-doi-giam-ngheo-o-viet-nam.html (accessed on 21 June 2016).
- General Statistics Office of Vietnam. Data on Forest Cover Rate in Vietnam from 2010 to 2015; Statistical Publishing House: Hanoi, Vietnam, 2016.
- Mikkel, F.; Fjalland, J.; Ravnborg, H.M.; Egelyng, H. Low Carbon Development and Poverty Alleviation Options for Development Cooperation in Energy, Agriculture and Forestry; Danish Institute for International Studies (DIIS): Copenhagen, Denmark, 2009; pp. 33–43. [Google Scholar]
- General Statistics Office of Vietnam. Data of Poverty Rate in Vietnam in 2015; Statistical Publishing House: Hanoi, Vietnam, 2015.
- Giao, N.T.B. Study on the Relationship between Forest Cover Rate and Poverty Rate in EASUP, Dak Lak Province, Vietnam. Master’s Thesis, Vietnam National University of Agriculture, Hanoi, Vietnam, Unpublished work. 2008. [Google Scholar]
- Grieg-Gran, M.; Porras, I.; Wunder, S. How can market mechanisms for forest environmental services help the poor? World Dev. 2005, 33, 16. [Google Scholar] [CrossRef]
- Beatriz, M.A.M.; Torres, A.B.; Skutsch, M. Review of Payment for Ecosystem Services Experiences for REDD+; International Union for Conservation of Nature (IUCN)-Regional Office for Mexico, Central America and the Caribbean (ORMACC): San José, Costa Rica, 2015. [Google Scholar]
- Wunder, S.; Engel, S.; Pagiola, S. Taking stock: A Comparative analysis of payments for ecosystem services programs in developed and developing countries. Ecol. Econ. 2008, 65, 834–852. [Google Scholar] [CrossRef]
- Pokorny, B.; Scholz, I.; Jong, W.D. REDD+ for the Poor or the poor for REDD+? About the Limitations of Environmental Policies in the Amazon and the Potential of Achieving Environmental Goals through Pro-Poor Policies. Ecol. Soc. 2010, 18, 3. [Google Scholar] [CrossRef]
- Government of Vietnam. The Policy on Payment for Forest Environment Services; Decree No. 99/2010/ND-CP; Dated on 24 September 2010; Goverment of Vietnam: Hanoi, Vietnam, 2010.
- Nghe An Forest Protection and Development Fund. Report on PFES Implementation of Nghe An FPDF in 2014; FPDF: Vinh, Nghe An, Vietnam, 2014. [Google Scholar]
- Nghe An People’s Committee. Decision No 2374/QD-UBND Dated 20 June 2013 on Checking and Identifying Boundary and Forest Status of Forest Owners for Payment of Environmental Services of Nghe An from 2013–2015 towards 2020; Nghe An People’s Committee: Vinh, Nghe An, Vietnam, 2013.
- Nghe An People’s Committee. Report on Social Economics of Nghe An in 2014 and Its Economic Development Planning in 2015; Nghe An People’s Committee: Vinh, Nghe An, Vietnam, 2014.
- Nghe An Forest Protection and Development Fund. Report on Payment of PFES in Nghe An Province in 2014; FPDF of Nghe An: Vinh, Nghe An, Vietnam, 2014. [Google Scholar]
- Dinh Tien, N. Data Analysis from Household Survey in Con Cuong District: Vinh, Nghe An Province, Vietnam. Unpublished work. 2016. [Google Scholar]
- Ha, M.H.; Do, T.H.; Pham, M.T.; Noordwijk, M.V.; Minang, P.A. Benefit Distribution Across Scales to Reduce Emissions from Deforestation and Forest Degradation (REDD+) in Vietnam. Land Use Policy 2013, 31, 48–60. [Google Scholar]
- Smith, J.; Mourato, S.; Veneklaas, E.; Labarta, R.; Reategui, K.; Sanchez, G. Can Global Environmental Markets Help to Control Tropical Deforestation? Evidence from the Peruvian Amazon. In Proceedings of the First World Congress on Environmental and Resource Economics, Venice, Italy, 25–27 June 1998. [Google Scholar]
- Griffiths, T. Seeing ‘REDD’? Forests, Climate Change Mitigation and the Rights of Indigenous Peoples and Local Communities; Forest Peoples Program: Moreton-in-Marsh, UK, 2008. [Google Scholar]
- Peskett, L.; Huberman, D.; Bowen-Jones, E.; Edwards, G.; Brown, J. Making REDD Work for the Poor. Prepared on Behalf of the Poverty Environment Partnership; Overseas Development Institute: London, UK, 2008. [Google Scholar]
- Hajek, F.; Scriven, J.; Castro, A.; Ventresca, M.J. Regime building for REDD+: Evidence on anatomy and proximate outcomes from a cluster of local initiatives in south-eastern Peru. Environ. Sci. Policy 2011, 14, 201–215. [Google Scholar] [CrossRef]
- Gebara, F.M. Importance of local participation in achieving equity in benefit sharing mechanisms for REDD+: A case study from the Juma Sustainable Development Reserve. Int. J. Commons 2013, 7, 473–497. [Google Scholar] [CrossRef]
- Errico, S. Opportunities and challenges to strengthen indigenous peoples’ rights and livelihoods in the context of REDD+: A study of REDD+ implementation in Vietnam. Int. For. Rev. 2016, 18, 412–428. [Google Scholar] [CrossRef]
- Pham, T.T.; Moeliono, M.; Brockhaus, M.; Le, D.N.; Wong, G.Y.; Le, T.M. Local preferences and strategies for effective, efficient, and equitable distribution of PES revenues in Vietnam: Lessons for REDD+. Hum. Ecol. 2014, 42, 885–899. [Google Scholar] [CrossRef]
- Andrew, J.; Dougill, L.C.; Stringer, J.L.; Riddell, M.; Rueff, H.; Spracklen, D.V.; Butt, E. Lessons from community-based payment for ecosystem service schemes: From forests to rangelands. Phil. Trans. R. Soc. B 2012, 367, 3178–3190. [Google Scholar]
Figure 1.
Location of the study sites in Luc Da and Chi Khe communes.

Figure 2.
Percentage of population below the national poverty line in Vietnam and other Asian countries in 2014. Source: ADB data from 2014 [10].
Figure 2.
Percentage of population below the national poverty line in Vietnam and other Asian countries in 2014. Source: ADB data from 2014 [10].
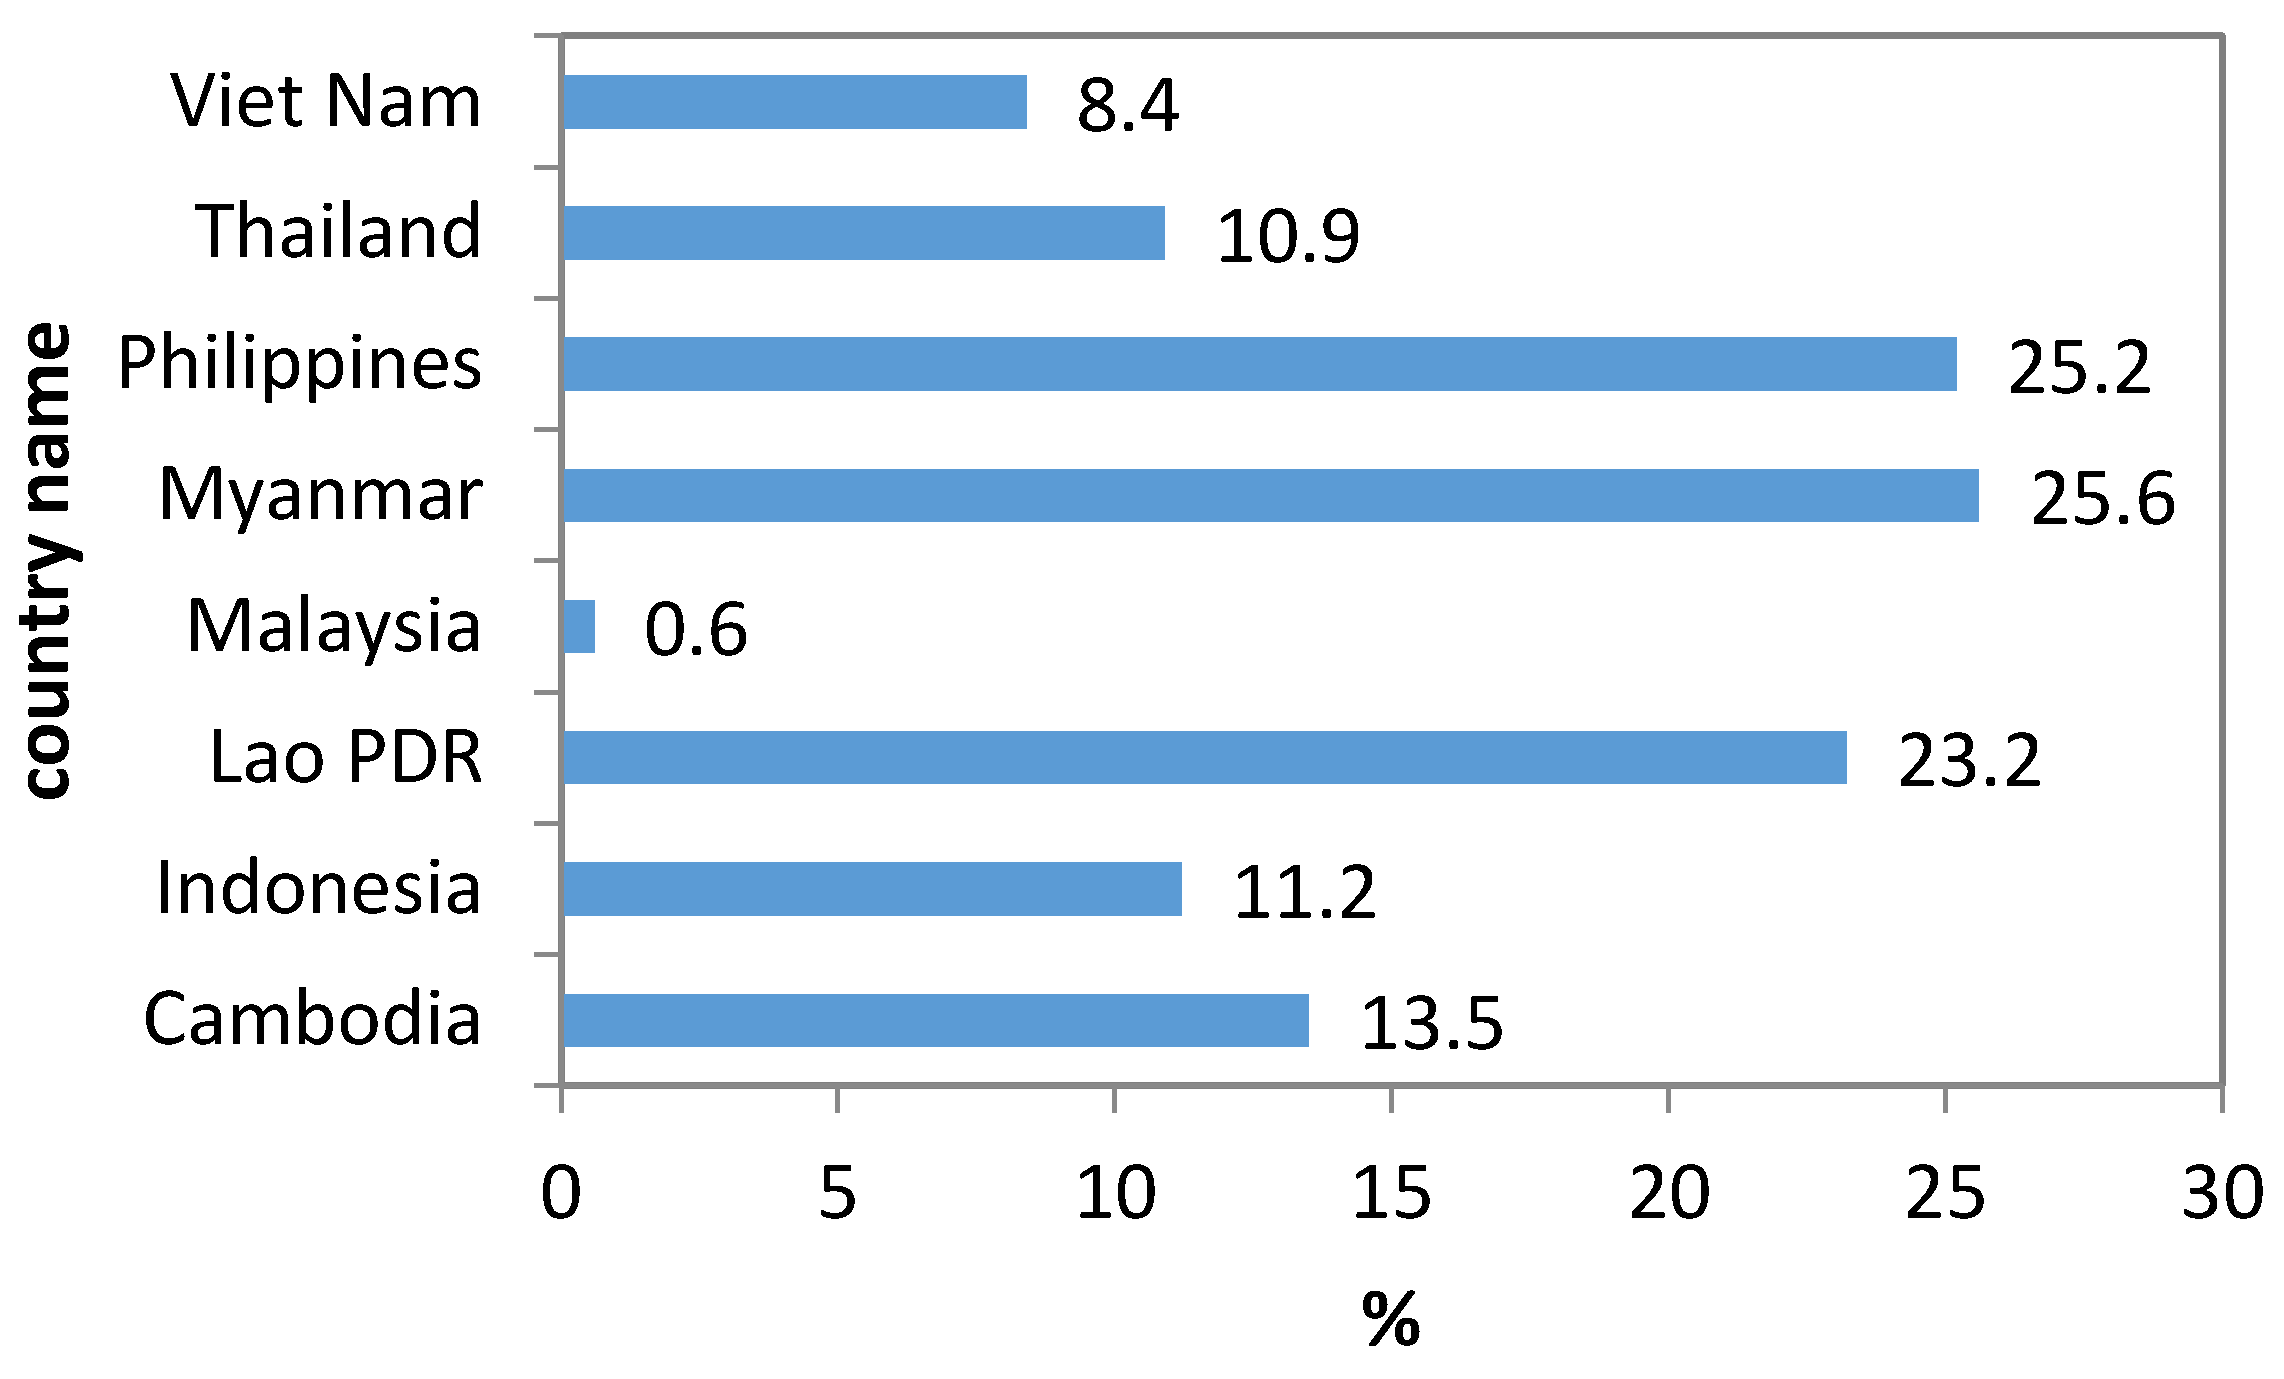
Figure 3.
Poverty trend in Nghe An Province and in the Whole country, Source: GSO data from 2016 [13].
Figure 3.
Poverty trend in Nghe An Province and in the Whole country, Source: GSO data from 2016 [13].
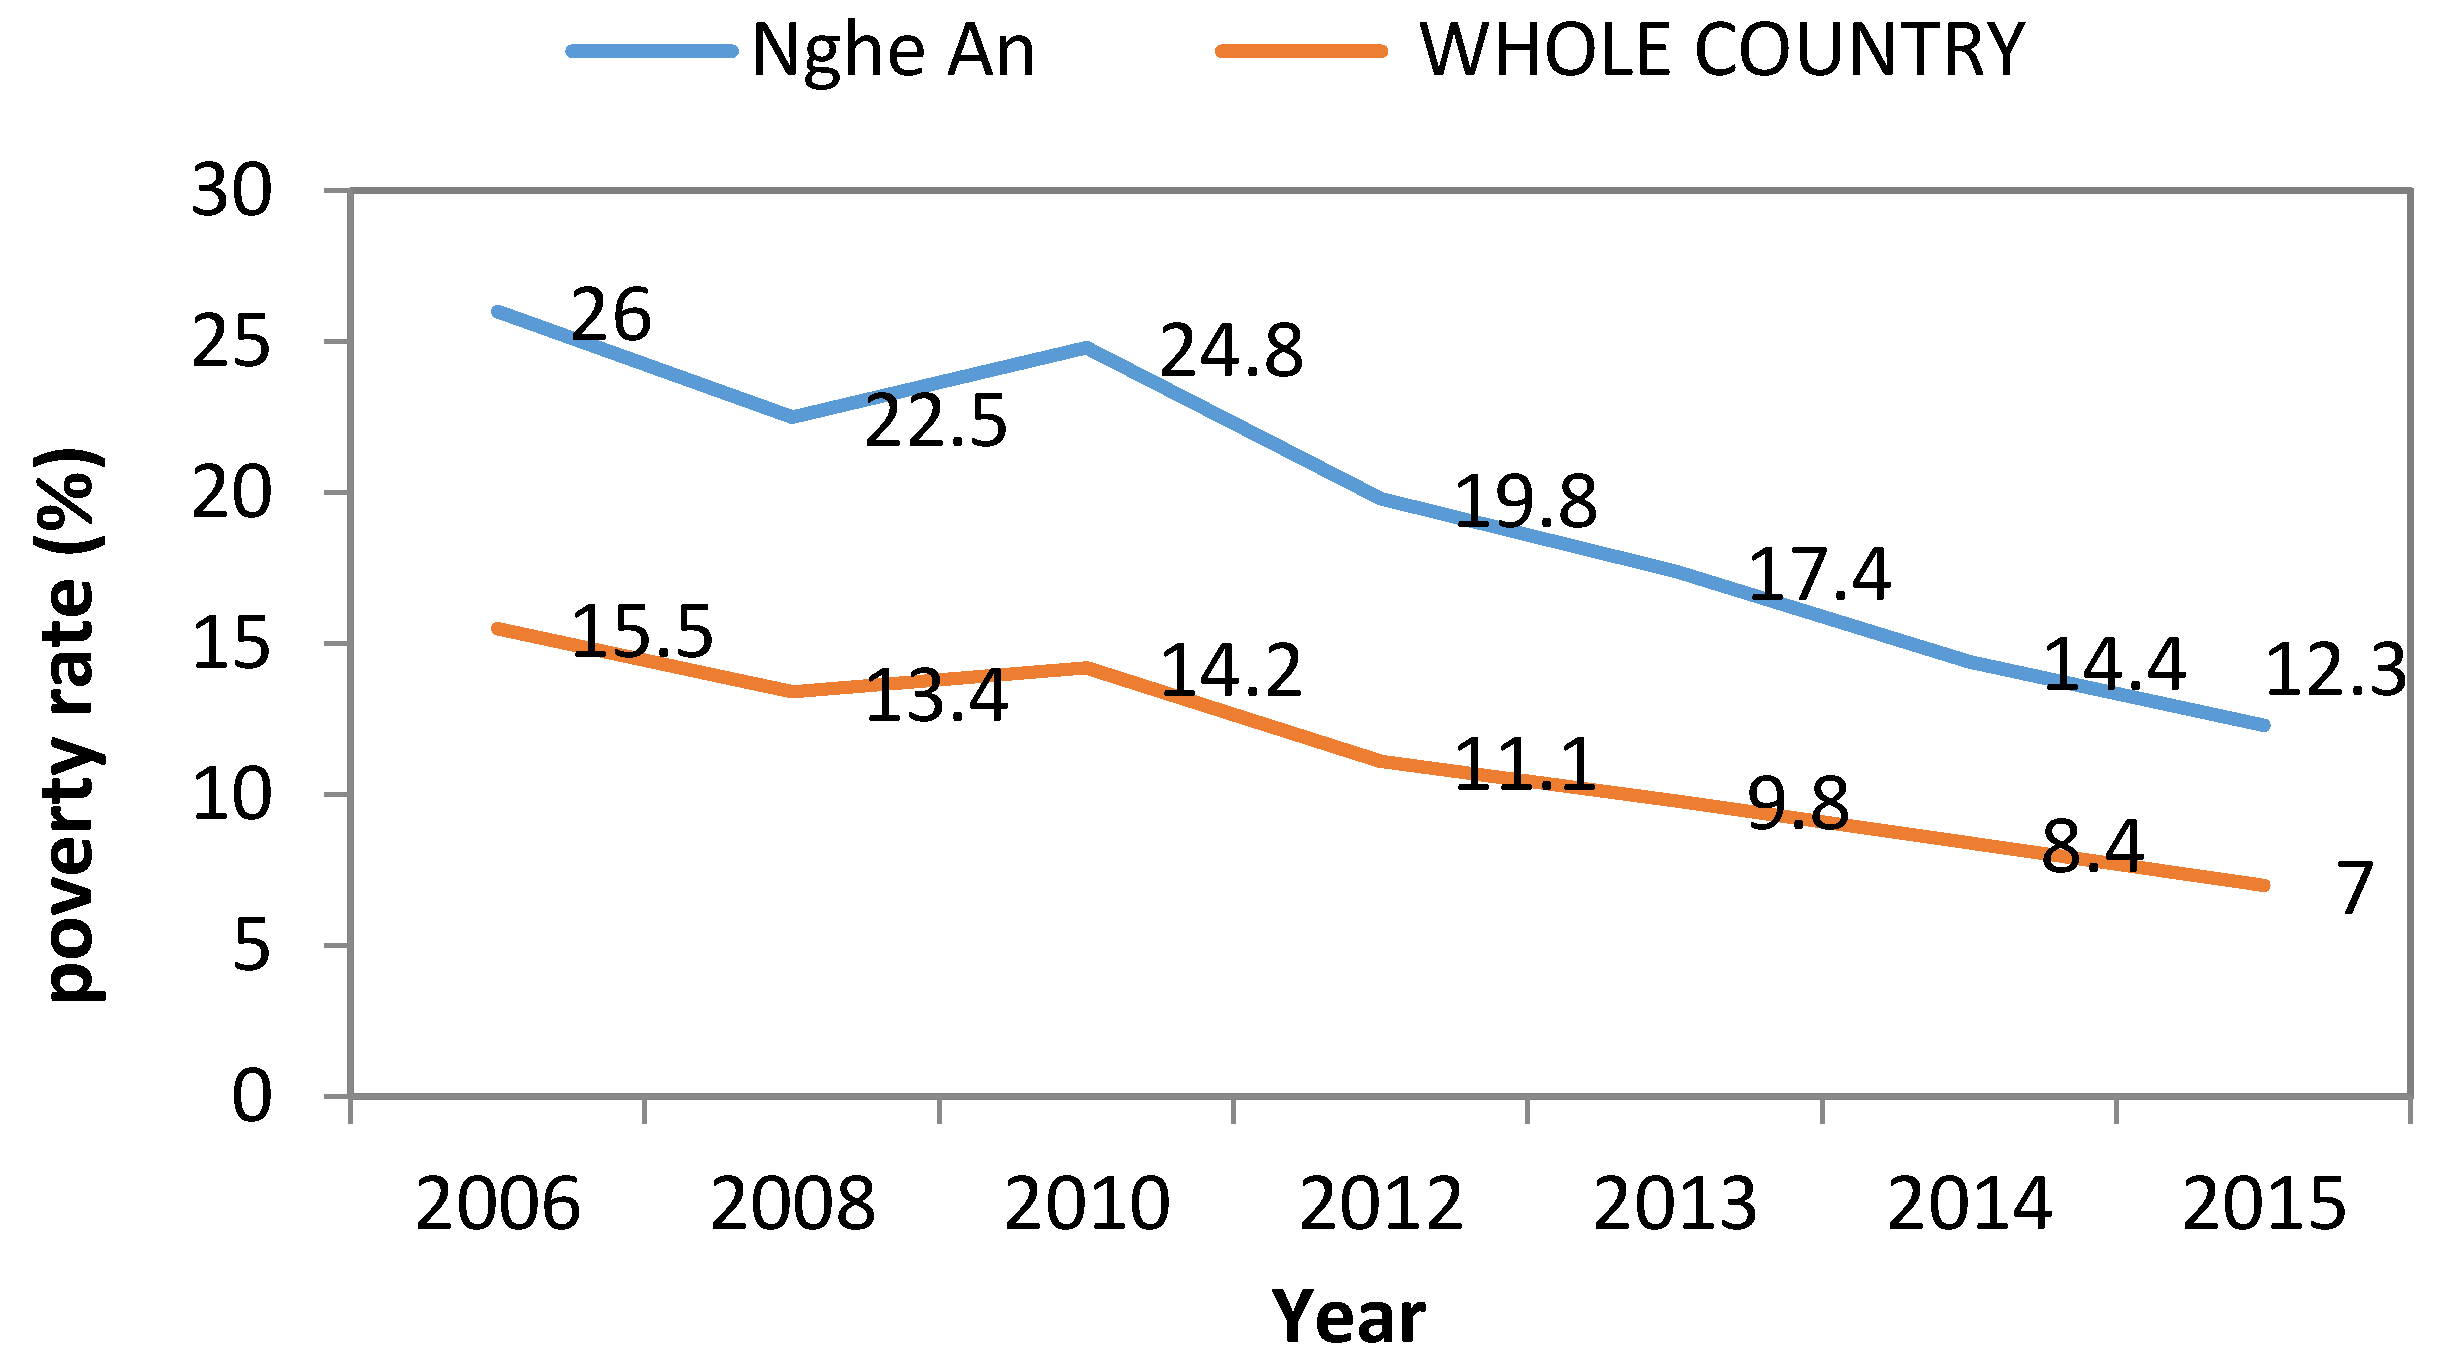
Figure 4.
Relationship between forest cover rate and poverty rate in Vietnam. Source: GSO data from 2016 [13].
Figure 4.
Relationship between forest cover rate and poverty rate in Vietnam. Source: GSO data from 2016 [13].
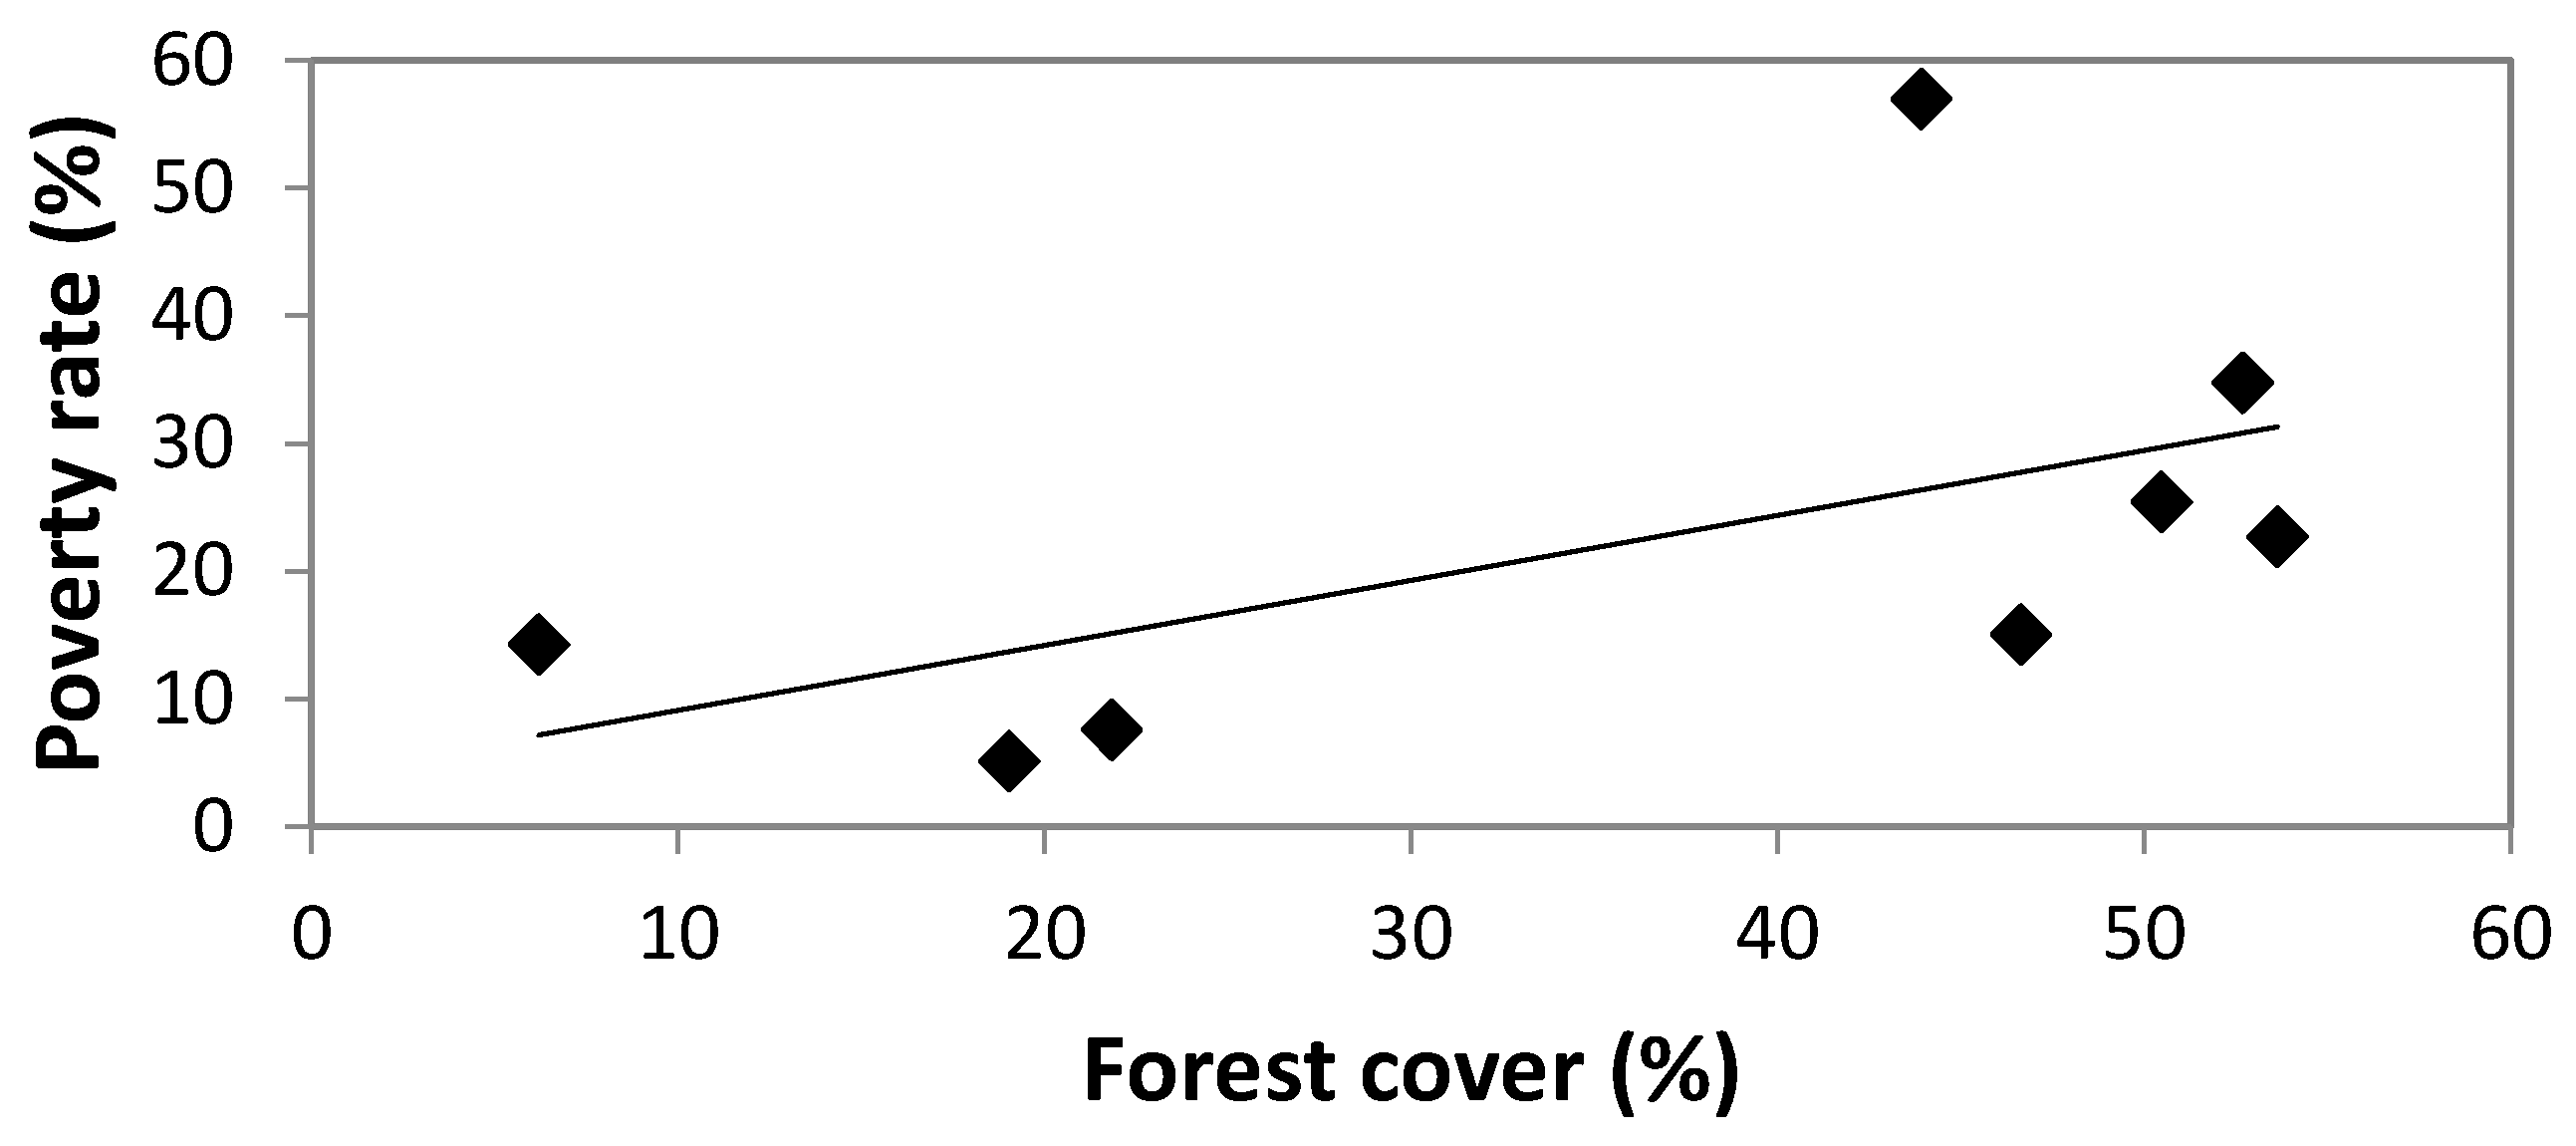
Figure 5.
Main forest users in Con Cuong District, Nghe An Province, 2016.
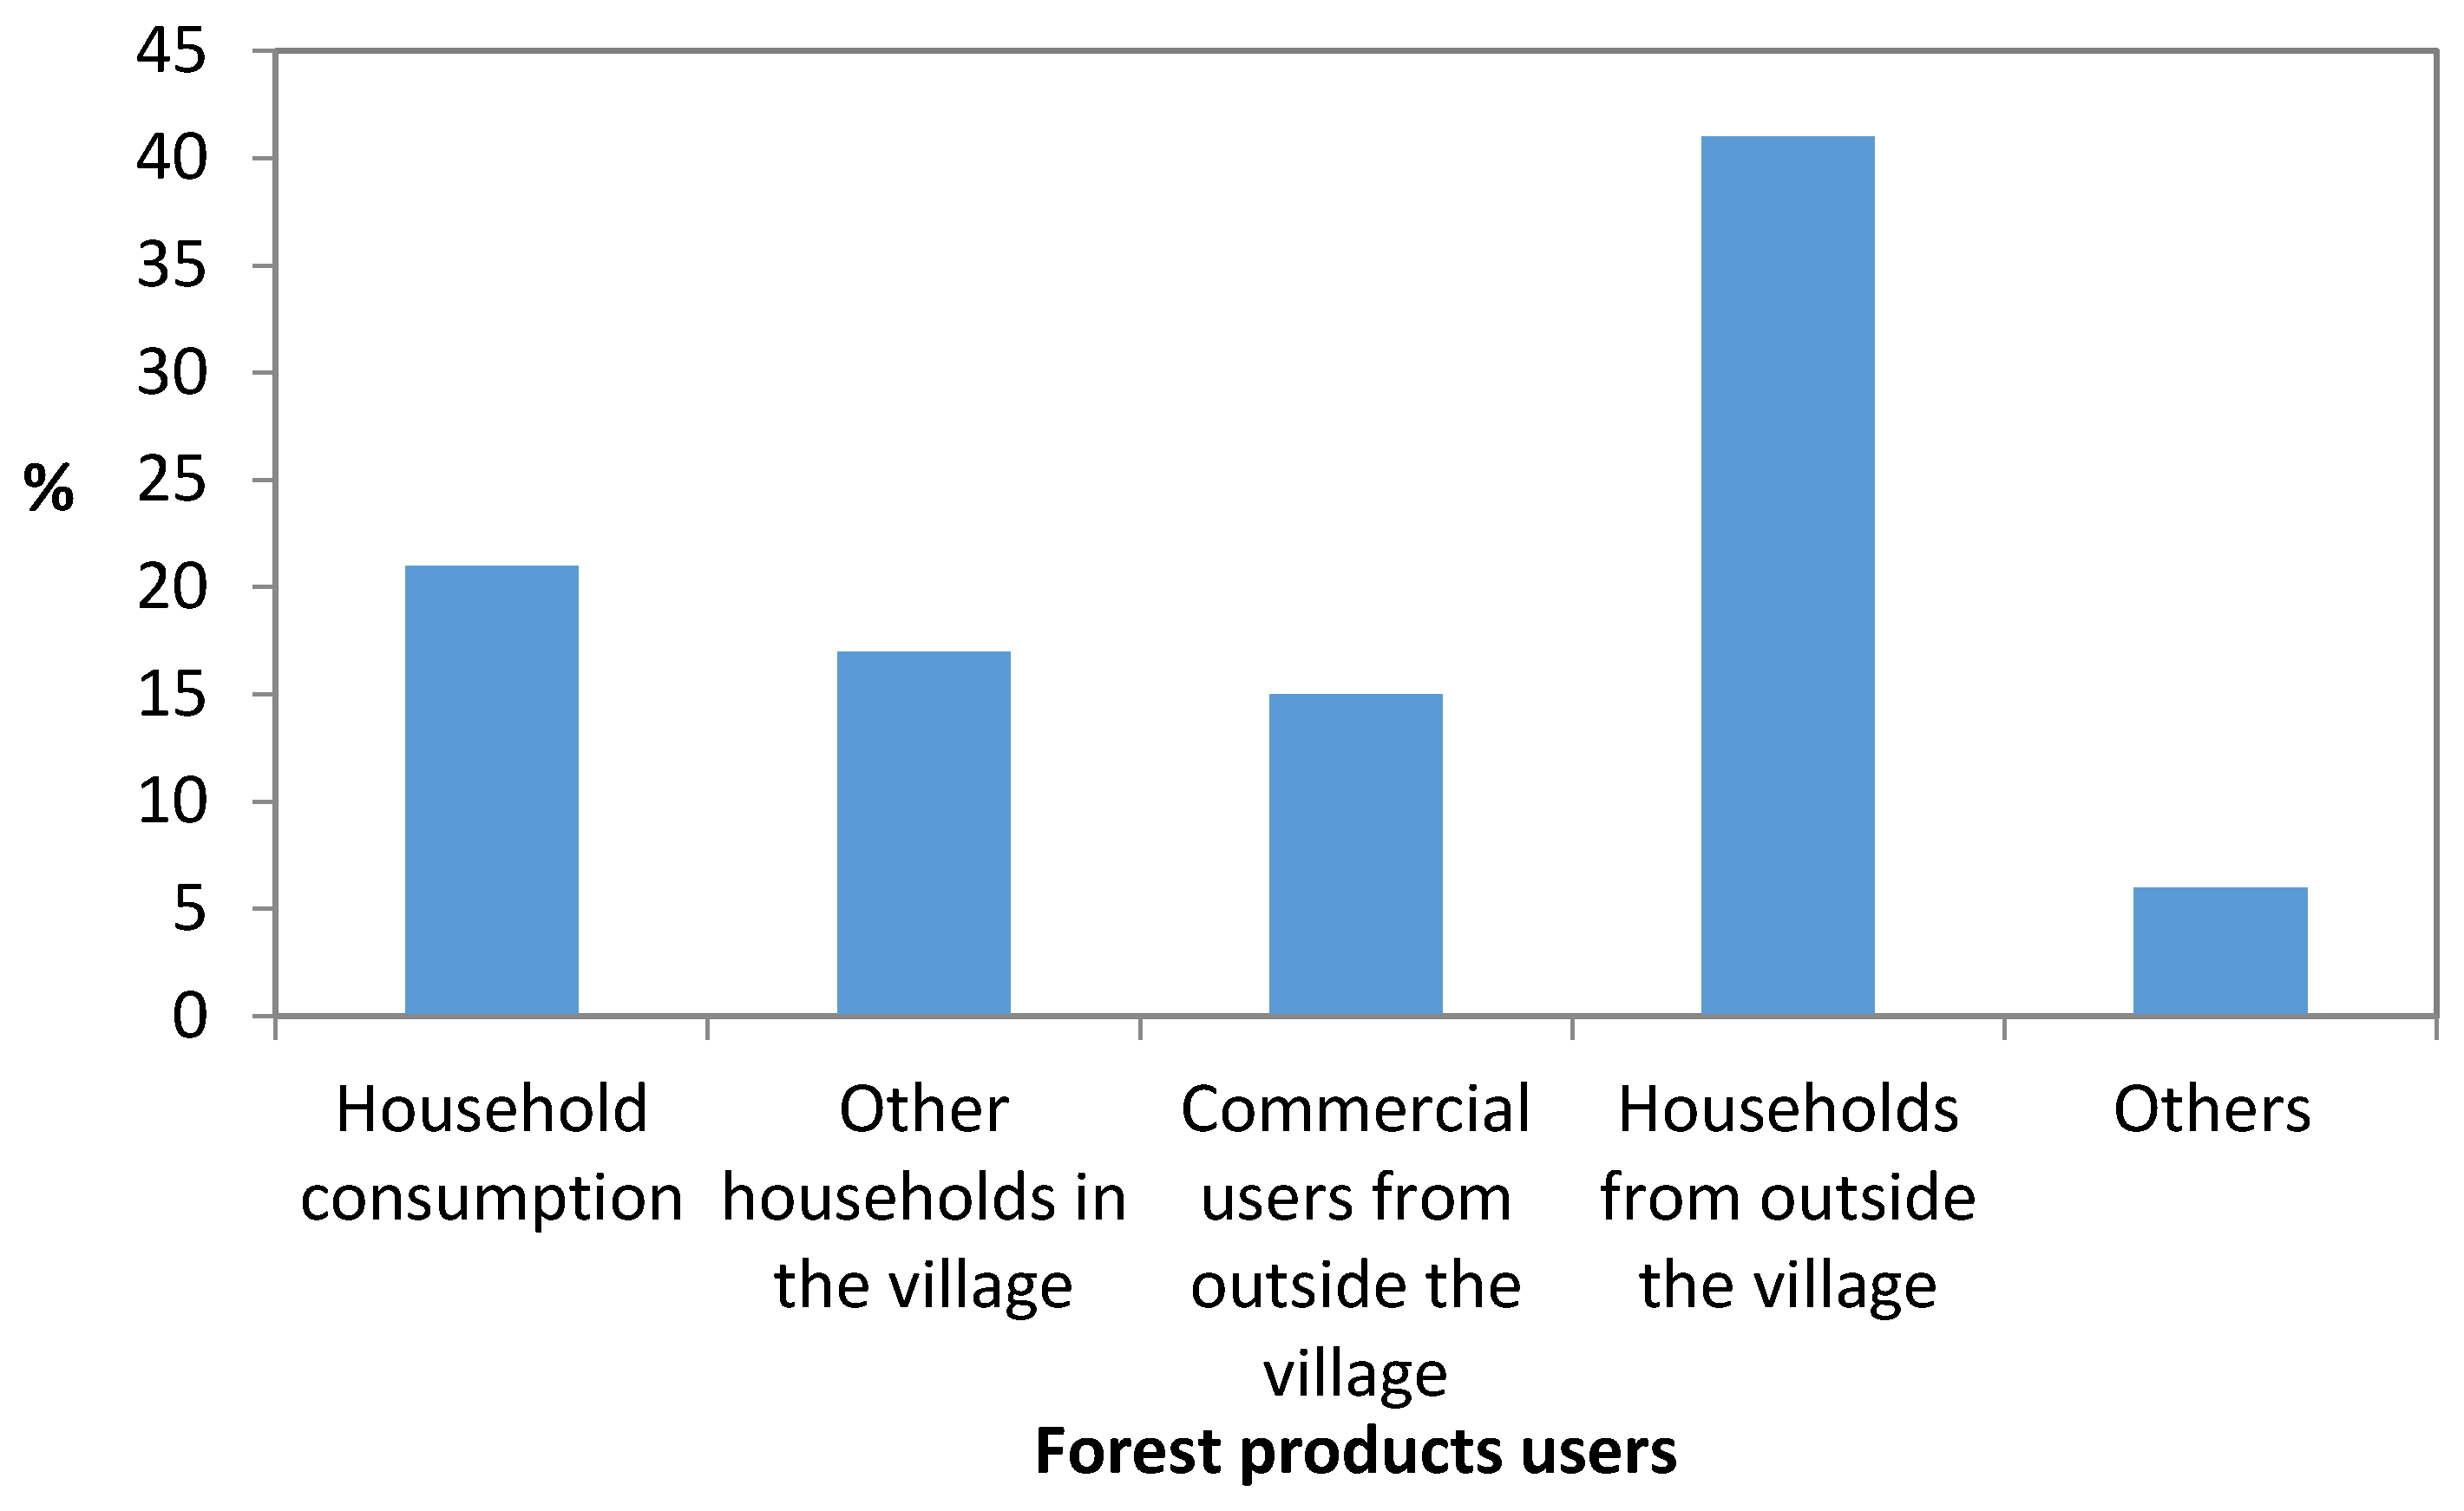
Figure 6.
Levels of awareness of REDD+ effects on climate change and the environment of respondents, Con Cuong District, Nghe An Province, 2016.
Figure 6.
Levels of awareness of REDD+ effects on climate change and the environment of respondents, Con Cuong District, Nghe An Province, 2016.
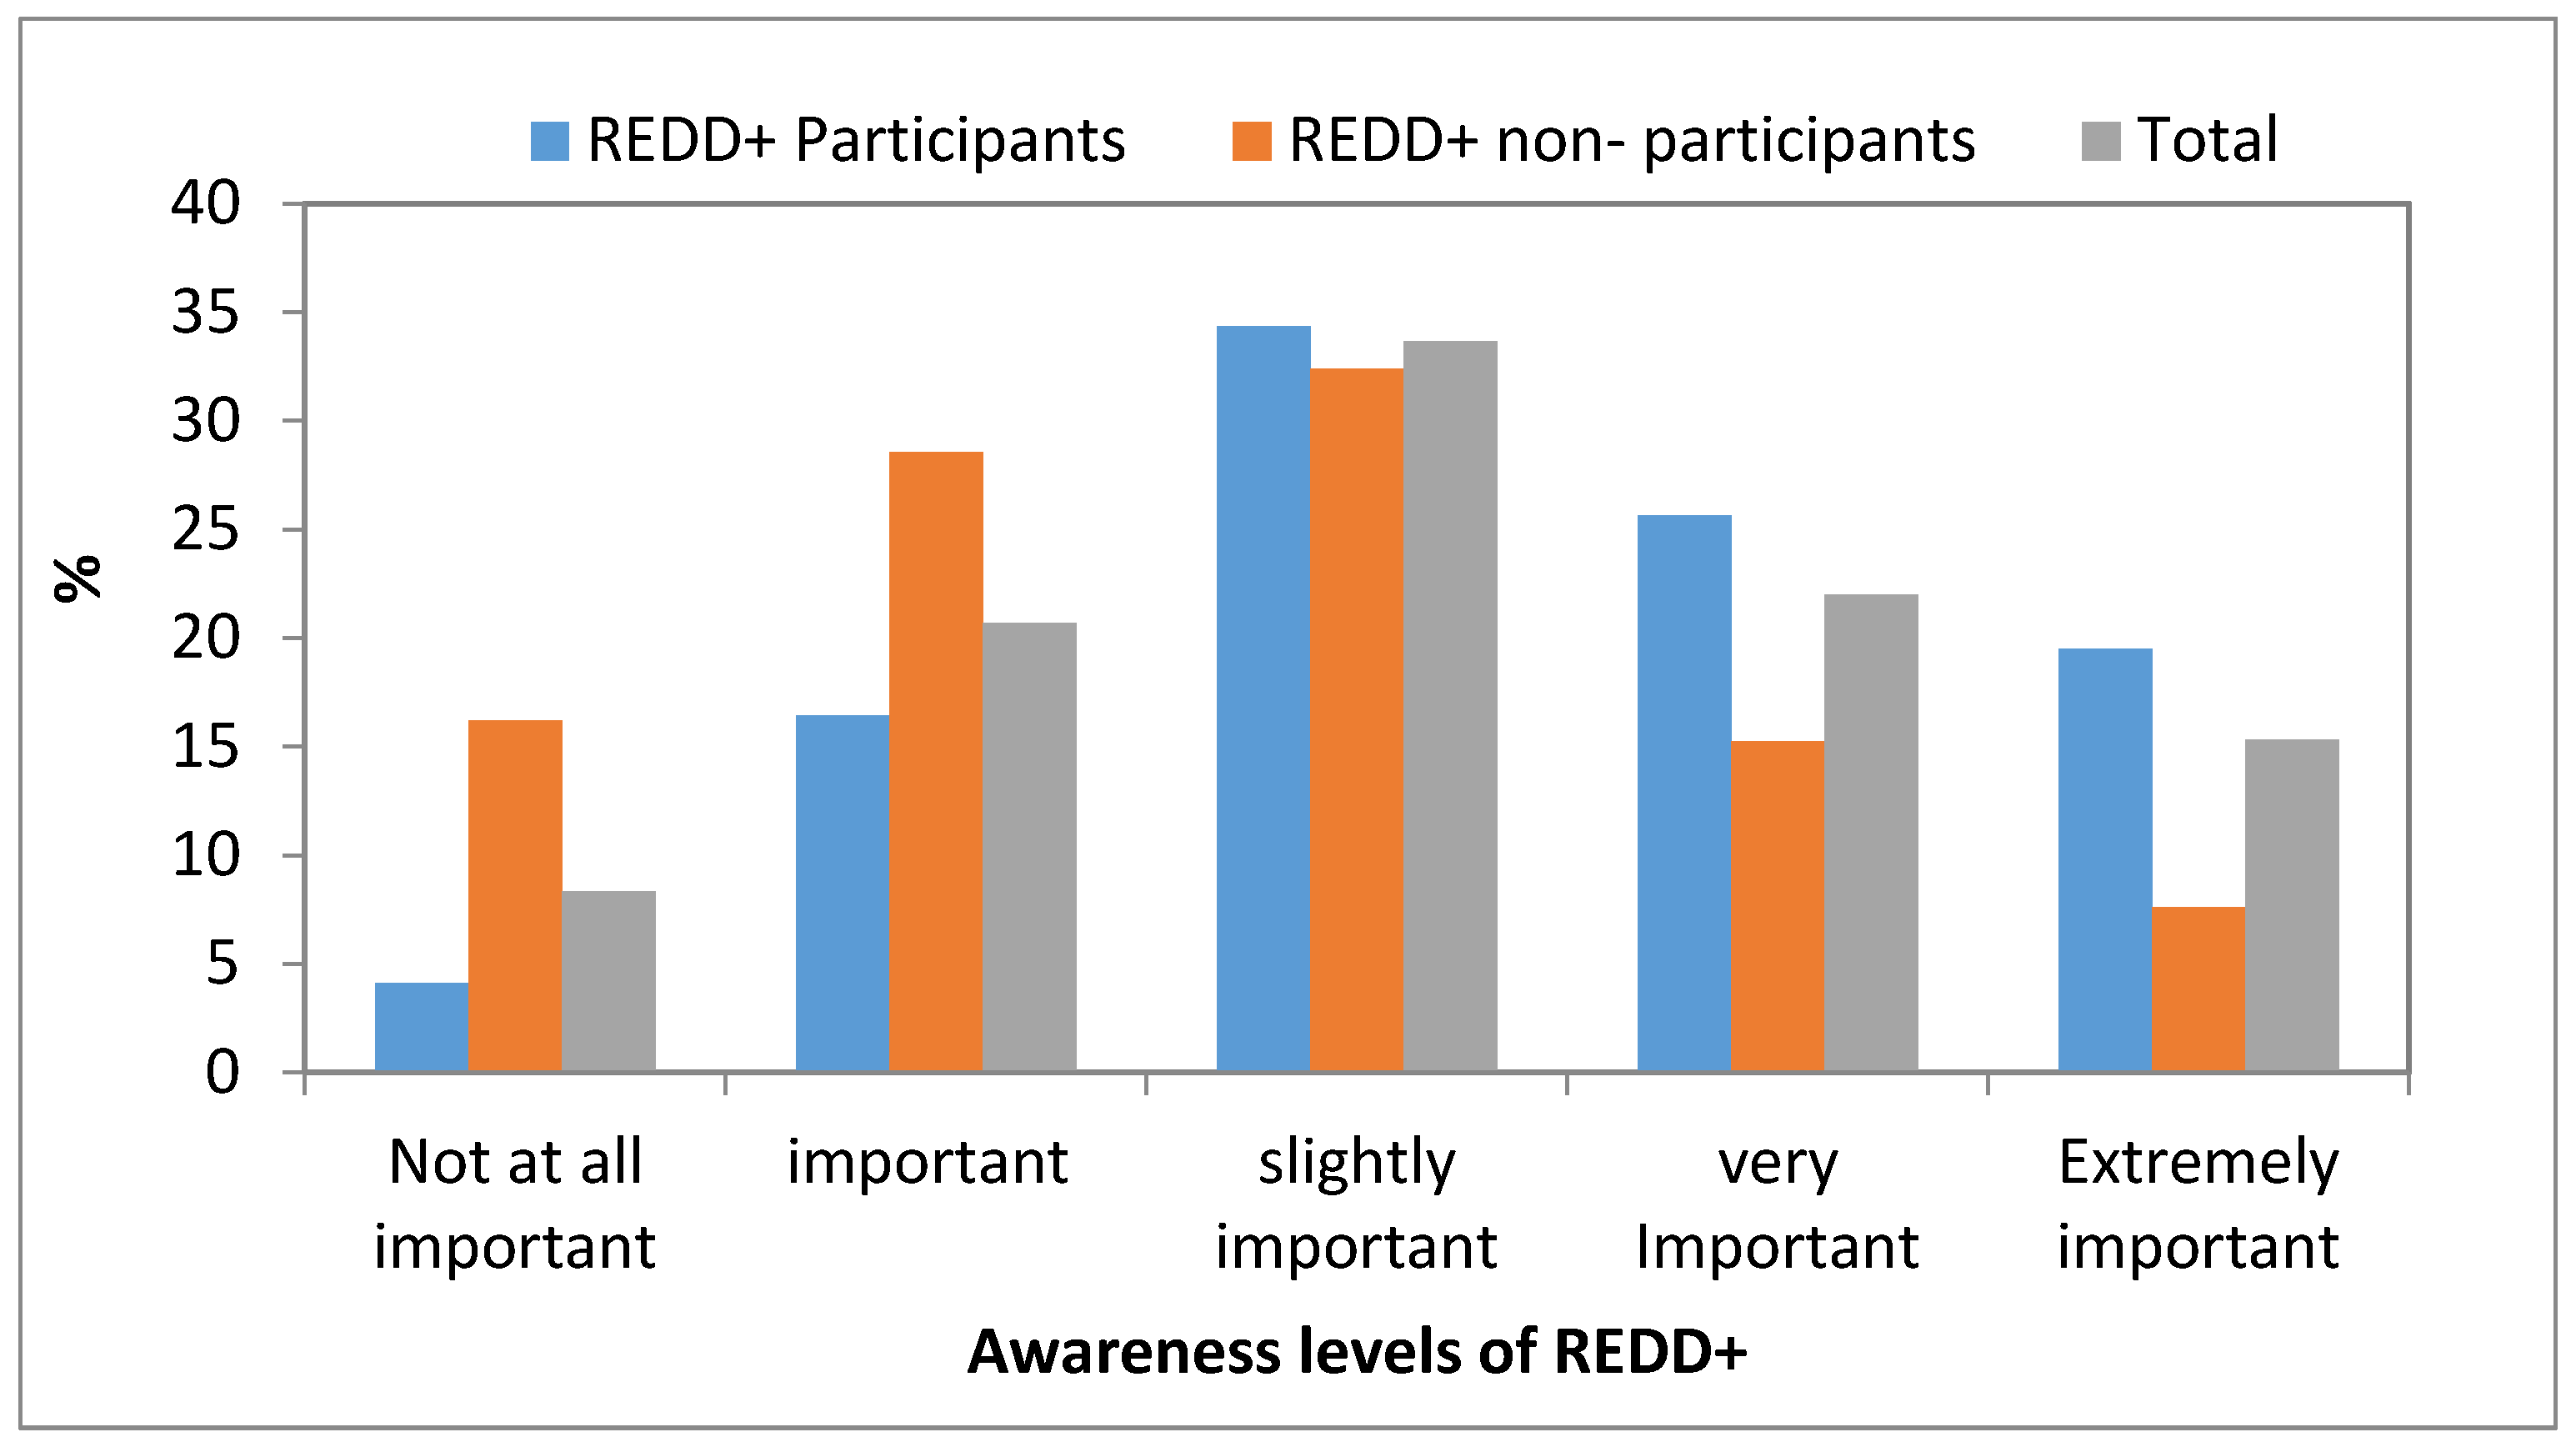
Figure 7.
Lorenz curve of farmers in Con Cuong District, Nghe An Province. (a) Without REDD+; (b) With REDD+.
Figure 7.
Lorenz curve of farmers in Con Cuong District, Nghe An Province. (a) Without REDD+; (b) With REDD+.
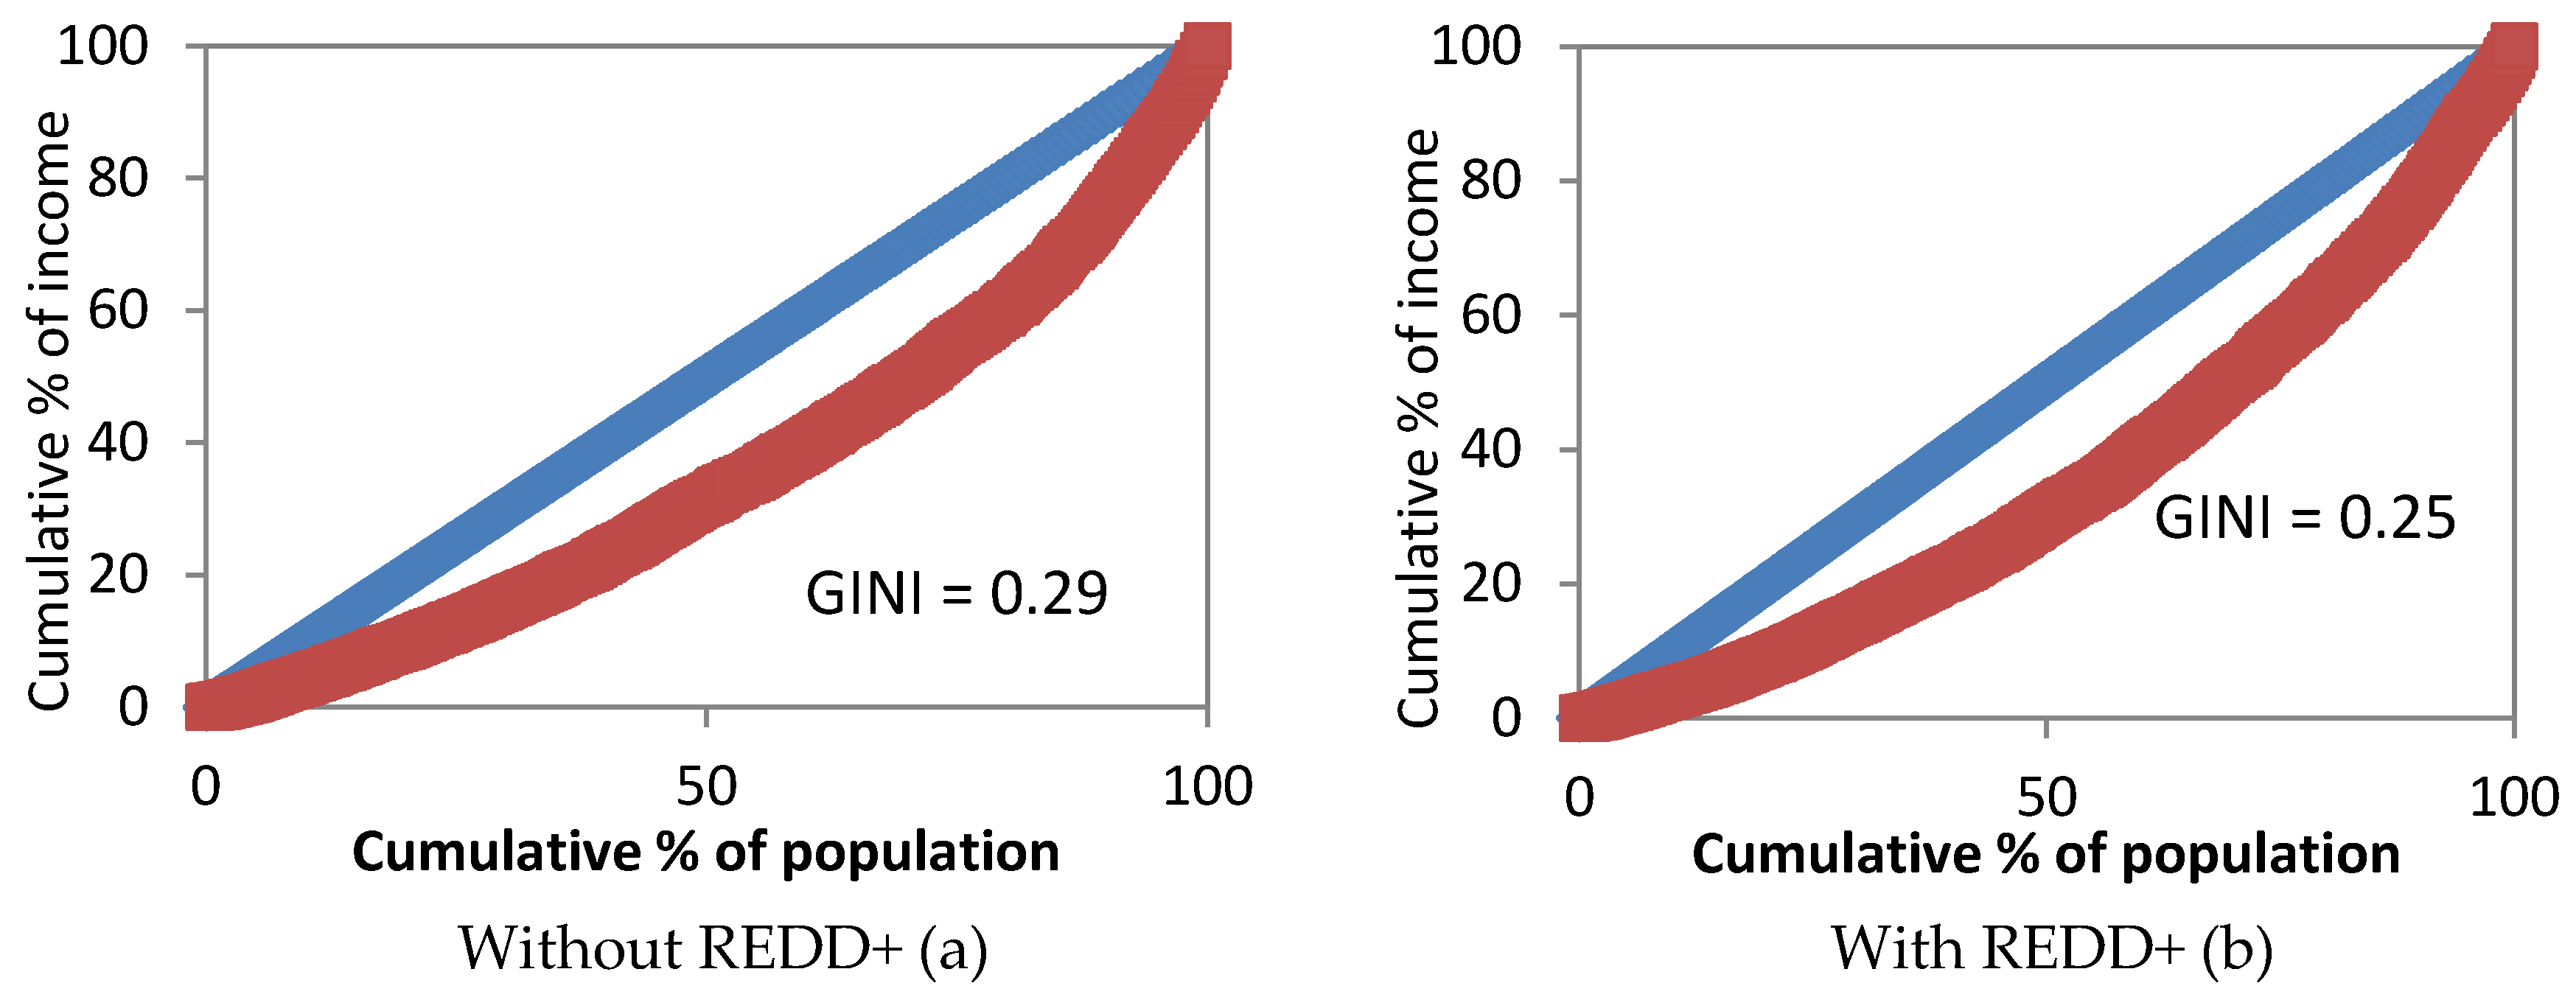
Figure 8.
Suggestions on distribution of funds of carbon payments to local villagers.

Table 1.
Socio demographic characteristics of Con Cuong District, Nghe An Province, Vietnam, 2016.
| Items | Whole District | |
|---|---|---|
| (No. of People) | (%) | |
| Total | 69,773 | 100 |
| Distribution by gender | ||
| Male | 34,852 | 49.95 |
| Female | 34,921 | 50.05 |
| Total labor | 43,734 | 100.00 |
| Distribution by gender | ||
| Male | 22,304 | 51.00 |
| Female | 21,430 | 49.00 |
| Distribution by area | ||
| Rural | 40,541 | 92.70 |
| Urban | 3193 | 7.30 |
| Total households | 15,820 | |
Source: Con Cuong Statistic Department, 2016 data [9].
Table 2.
Current land use of Con Cuong District, Nghe An Province, 2016.
| Land Use Type | Area (ha) | (%) | |
|---|---|---|---|
| Total natural land | 173,831.12 | 100 | |
| I | Agricultural land area | 164,460.42 | 94.61 |
| 1 | Agricultural production land | 10,145.38 | 6.17 |
| 1.1 | Land for annual crops | 7275.61 | 4.42 |
| 1.2 | Long-term tree plantations | 2869.77 | 1.74 |
| 2 | Forestland | 154,262.63 | 93.80 |
| 2.1 | Production land | 60,859.80 | 37.01 |
| 2.2 | Protected forest | 19,134.00 | 11.63 |
| 2.3 | Special-use forest | 74,268.83 | 45.16 |
| 3 | Aquaculture land | 52.41 | 0.03 |
| II | Nonagricultural land | 2942.98 | 1.69 |
| III | Unused land | 6427.72 | 3.70 |
Source: Con Cuong People’s Committee, data from 2016 [8].
Table 3.
Poverty line of Vietnam in rural and urban areas.
| Income per Capita per Month | ||
|---|---|---|
| Rural Areas | Urban Areas | |
| Poor | ≤VND 400,000 (≤USD 19) | ≤VND 500,000 (≤USD 24) |
| Near poor | VND 401,000–520,000 ($20 to $25) | VND 501,000–650,000 (USD 25–31) |
Source: MOLISA data from 2011 [11].
Table 4.
Linkage of forest cover and poverty in Vietnam, 2000 to 2014.
| Region | 2000 | 2012 | 2014 | |||
|---|---|---|---|---|---|---|
| Forest Cover Rate (%) | Poverty Rate (%) | Forest Cover Rate (%) | Poverty Rate (%) | Forest Cover Rate (%) | Poverty Rate (%) | |
| Northeast | 52.5 | 37.7 | 56.2 | 33.5 | 49.36 | 31.2 |
| Northwest | 42.2 | 60.1 | 44.6 | 58.7 | 44.95 | 53.2 |
| Red River Delta | 20.6 | 11.4 | 21.2 | 7.4 | 23.7 | 4 |
| North Central | 54.4 | 28.4 | 56 | 21.2 | 50.5 | 18.5 |
| South Central Coast | 43.3 | 18.1 | 44.7 | 15.3 | 51.9 | 11.8 |
| Central Highlands | 52.5 | 32.8 | 53.1 | 29.7 | 45.8 | 13.8 |
| Southeast | 17.2 | 8.6 | 20 | 5.8 | 19.9 | 1 |
| Mekong Delta | 6.6 | 18.7 | 6.1 | 16.2 | 5.9 | 7.9 |
| National | 39.5 | 20.7 | 40.7 | 11.2 | 40.4 | 8.4 |
Source: Authors’ calculation using GSO data from 2015 [15].
Table 5.
Demographic characteristics of respondent households in Con Cuong District, Nghe An Province, 2016.
Table 5.
Demographic characteristics of respondent households in Con Cuong District, Nghe An Province, 2016.
| Items | Chi Khe | Luc Da | Total | ||||||
|---|---|---|---|---|---|---|---|---|---|
| R | N-R | DIFF | R | N-R | DIFF | R | N-R | DIFF | |
| Age of respondents (years) | 46.4 | 47.6 | 1.21 ns | 41.2 | 45.97 | 4.78 * | 43.94 | 46.70 | 2.76 * |
| Educational level of respondents (year) | 4.7 | 4.8 | 0.01 ns | 6.4 | 6.19 | 0.24 ns | 5.52 | 5.56 | 0.04 ns |
| Household sizes (person) | 4.8 | 4.8 | 0.00 ns | 4.7 | 4.52 | 0.21 ns | 4.79 | 4.67 | 0.12 ns |
| Labor supply (persons) | 2.7 | 2.3 | 0.45 *** | 2.6 | 2.48 | 0.14 ns | 2.68 | 2.39 | 0.29 ** |
| Income per capita/year (1000 VND) | 3598 | 3212 | 386 ns | 3495 | 3507 | 12 ns | 3549 | 3375 | 174 ns |
Note: R: REDD+ participants; N-R: Non-REDD+ participants, *, **, *** are statistically significant at 10%, 5% and 1%, respectively; ns: nonsignificant.
Table 6.
Income sources of respondent households in Con Cuong District, Nghe An Province, 2016 (Unit: million VND/year).
Table 6.
Income sources of respondent households in Con Cuong District, Nghe An Province, 2016 (Unit: million VND/year).
| Sources of Income | Chi Khe | Luc Da | Total | ||||||
|---|---|---|---|---|---|---|---|---|---|
| R | N-R | DIFF | R | N-R | DIFF | R | N-R | DIFF | |
| Annual crop income | 4.55 | 5.59 | 1.04 ns | 4.45 | 3.8 | 0.64 ns | 4.5 | 4.6 | 0.09 ns |
| Livestock income | 4.72 | 4.25 | 0.47 ns | 5.00 | 4.77 | 0.22 ns | 4.85 | 4.54 | 0.3 ns |
| Income from forest | 4.35 | 2.76 | 1.73 *** | 3.29 | 2.85 | 0.46 * | 3.85 | 2.81 | 1.13 *** |
| Off-farm income | 3.01 | 2.4 | 0.60 ns | 2.68 | 3.06 | 0.38 ns | 2.85 | 2.77 | 0.08 ns |
| Total income | 16.63 | 15.01 | 1.62 ns | 15.42 | 14.48 | 0.94 ns | 16.06 | 14.72 | 1.34 ns |
Note: R: REDD+ participants; N-R: Non-REDD+ participants; *, **, *** are statistically significant at 10%, 5% and 1%, respectively; ns: non-significant.
Table 7.
Source of income by household type, Con Cuong District, Nghe An Province, 2016.
| Items | Household Status | ||||
|---|---|---|---|---|---|
| Non-Poor (Million VND) | % | Poor (Million VND) | % | DIFF | |
| Crop income | 5.719 | 26.8 | 3.449 | 33.2 | 2.27 *** |
| Livestock income | 6.385 | 29.9 | 3.224 | 31.0 | 3.16 *** |
| Income from forest | 4.151 | 19.4 | 2.989 | 28.8 | 1.16 *** |
| Off-farm income | 5.087 | 23.8 | 0.731 | 7.0 | 4.33 *** |
| Total income | 21.27 | 100.0 | 10.34 | 100.0 | 10.94 *** |
Source: Primary Survey in Con Cuong District, Nghe An Province, 2016 [26]; Note: *** are statistically significant at 1%.
Table 8.
Correlation between income from forest products and household type, Con Cuong District, Nghe An Province, 2016.
Table 8.
Correlation between income from forest products and household type, Con Cuong District, Nghe An Province, 2016.
| Poor | Income from Forests | ||
|---|---|---|---|
| Poor | Pearson Correlation | 1 | −0.234 |
| Sig. (2-tailed) | 0.000 | ||
| Income from forest | Pearson Correlation | −0.234 | 1 |
| Sig. (2-tailed) | 0.000 |
Note: Correlation is significant at the 1% probability level.
Table 9.
Contribution of REDD+ to household income, Con Cuong District, Nghe An Province, 2016.
| With REDD+ | Without REDD+ | ||||
|---|---|---|---|---|---|
| Amount (Million VND) | % | Amount (Million VND) | % | DIFF | |
| Crop income | 4.5 | 21.76 | 4.6 | 31.25 | 0.09 ns |
| Livestock income | 4.85 | 23.45 | 4.54 | 30.84 | 0.31 ns |
| Income from forest | 3.85 | 18.62 | 2.81 | 19.09 | 1.04 *** |
| Off-farm income | 2.85 | 13.78 | 2.77 | 18.82 | 0.08 ns |
| REDD+ payment | 7.83 | 37.86 | 0 | 0 | 7.80 *** |
| Total income | 20.68 | 100 | 14.72 | 100 | 5.96 *** |
Note: ***, ** and * are significant at the 1%, 5% and 10% levels of probability, respectively; ns: is non-significant. Source: Primary Survey, 2016 [26].
Table 10.
Comparison of REDD+ program income by poor and non-poor households, Con Cuong District, Nghe An Province, 2016.
Table 10.
Comparison of REDD+ program income by poor and non-poor households, Con Cuong District, Nghe An Province, 2016.
| with REDD+ | without REDD+ | |||
|---|---|---|---|---|
| Non-Poor (n = 201) | Poor (n = 99) | Non-Poor (n = 182) | Poor (n = 118) | |
| Crop income | 5.72 | 3.45 | 5.72 | 3.45 |
| Livestock income | 6.38 | 3.22 | 6.38 | 3.22 |
| Income from forest | 9.38 | 7.84 | 4.08 | 2.94 |
| Off-farm income | 5.09 | 0.73 | 5.09 | 0.73 |
| Total income | 26.57 | 15.25 | 21.27 | 10.34 |
Source: Primary Survey, 2016 [26].
Table 11.
Contribution of REDD+ to the poverty rate reduction of 300 respondents in Con Cuong District, Nghe An Province, 2016.
Table 11.
Contribution of REDD+ to the poverty rate reduction of 300 respondents in Con Cuong District, Nghe An Province, 2016.
| With REDD+ | Without REDD+ | |||
|---|---|---|---|---|
| No. | % | No. | % | |
| Poor households | 99 | 33 | 118 | 39.4 |
| Non-poor households | 201 | 67 | 182 | 60.6 |
| Total of respondents | 300 | 100 | 300 | 100 |
Source: Primary Survey, 2016 [26].
© 2017 by the authors. Licensee MDPI, Basel, Switzerland. This article is an open access article distributed under the terms and conditions of the Creative Commons Attribution (CC BY) license (http://creativecommons.org/licenses/by/4.0/).
Share and Cite
MDPI and ACS Style
Dinh Tien, N.; Rañola, R.X., Jr.; Thu Thuy, P. Potential Impact of the REDD+ Program on Poverty Reduction in Nghe An Province, Vietnam. Forests 2017, 8, 376. https://doi.org/10.3390/f8100376
AMA Style
Dinh Tien N, Rañola RX Jr., Thu Thuy P. Potential Impact of the REDD+ Program on Poverty Reduction in Nghe An Province, Vietnam. Forests. 2017; 8(10):376. https://doi.org/10.3390/f8100376
Chicago/Turabian StyleDinh Tien, Nguyen, Roberto X. Rañola, Jr., and Pham Thu Thuy. 2017. "Potential Impact of the REDD+ Program on Poverty Reduction in Nghe An Province, Vietnam" Forests 8, no. 10: 376. https://doi.org/10.3390/f8100376
Note that from the first issue of 2016, this journal uses article numbers instead of page numbers. See further details here.