Assessing Forest Cover Dynamics and Forest Perception in the Atlantic Forest of Paraguay, Combining Remote Sensing and Household Level Data

 ,
,
Abstract
:1. Introduction
2. Data and Methods
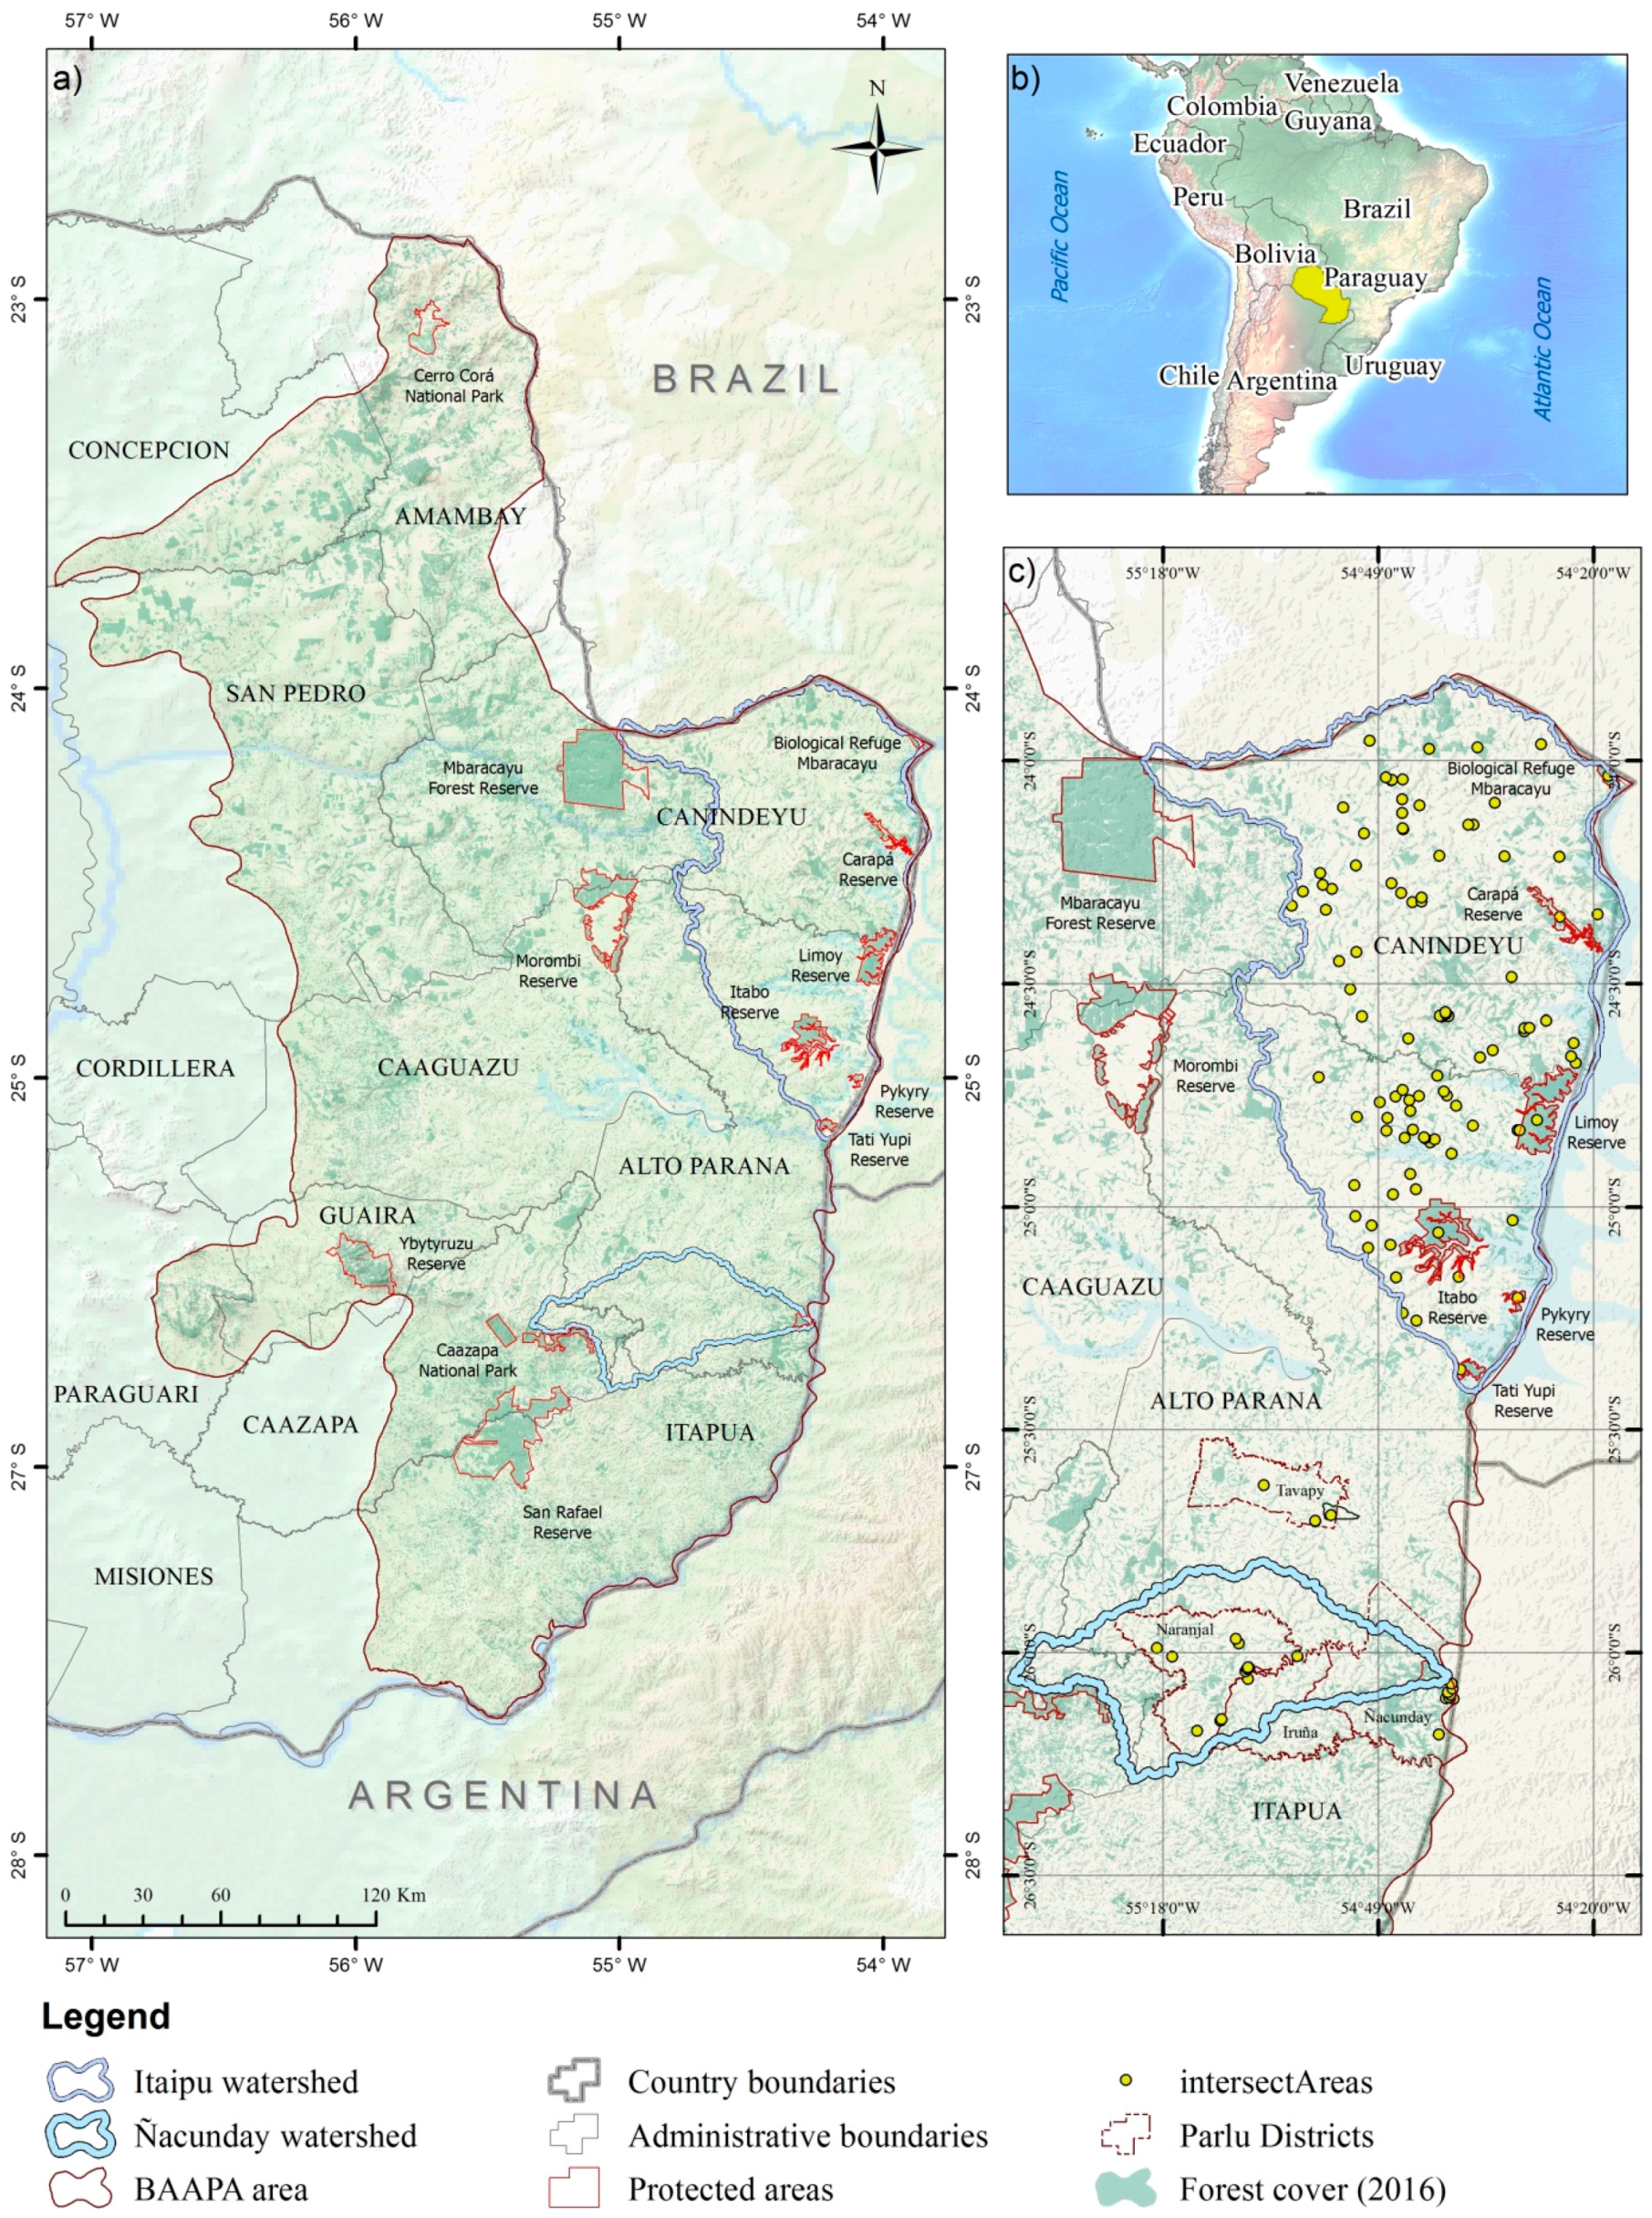
2.1. Study Area
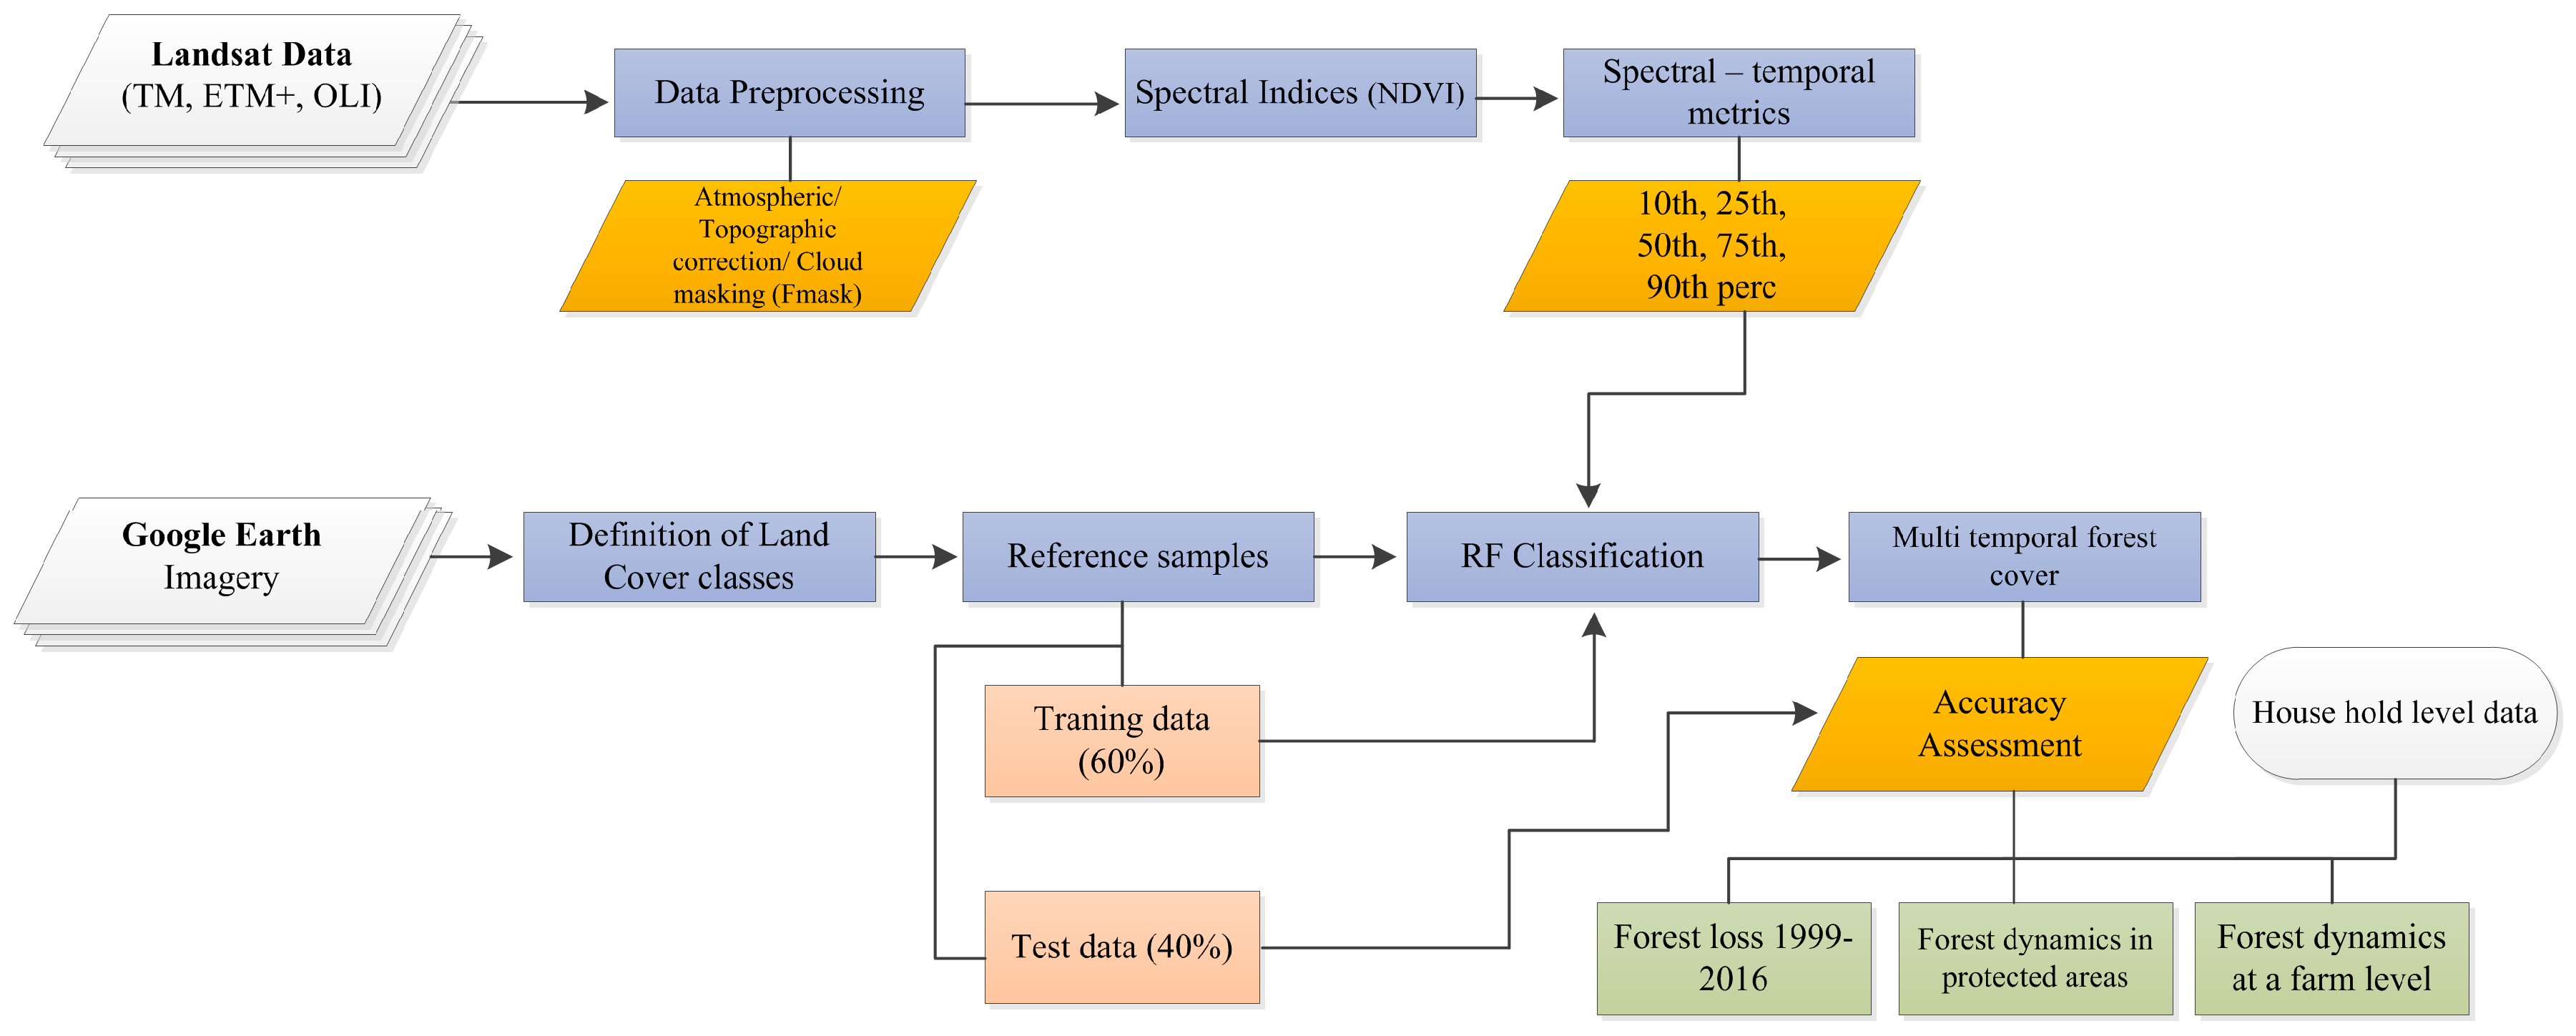
2.2. Landsat Image Acquisition and Pre-Processing
2.3. Spectral-Temporal Landsat Time-Series Metrics
2.4. Estimation of Forest Cover between Years 1999–2016
2.5. Household Survey Data
2.6. Combining Household and Remote Sensing Data
3. Results
3.1. Forest Classification Accuracy
3.2 Forest Loss Rates
3.3. Forest Cover Change and Household Survey
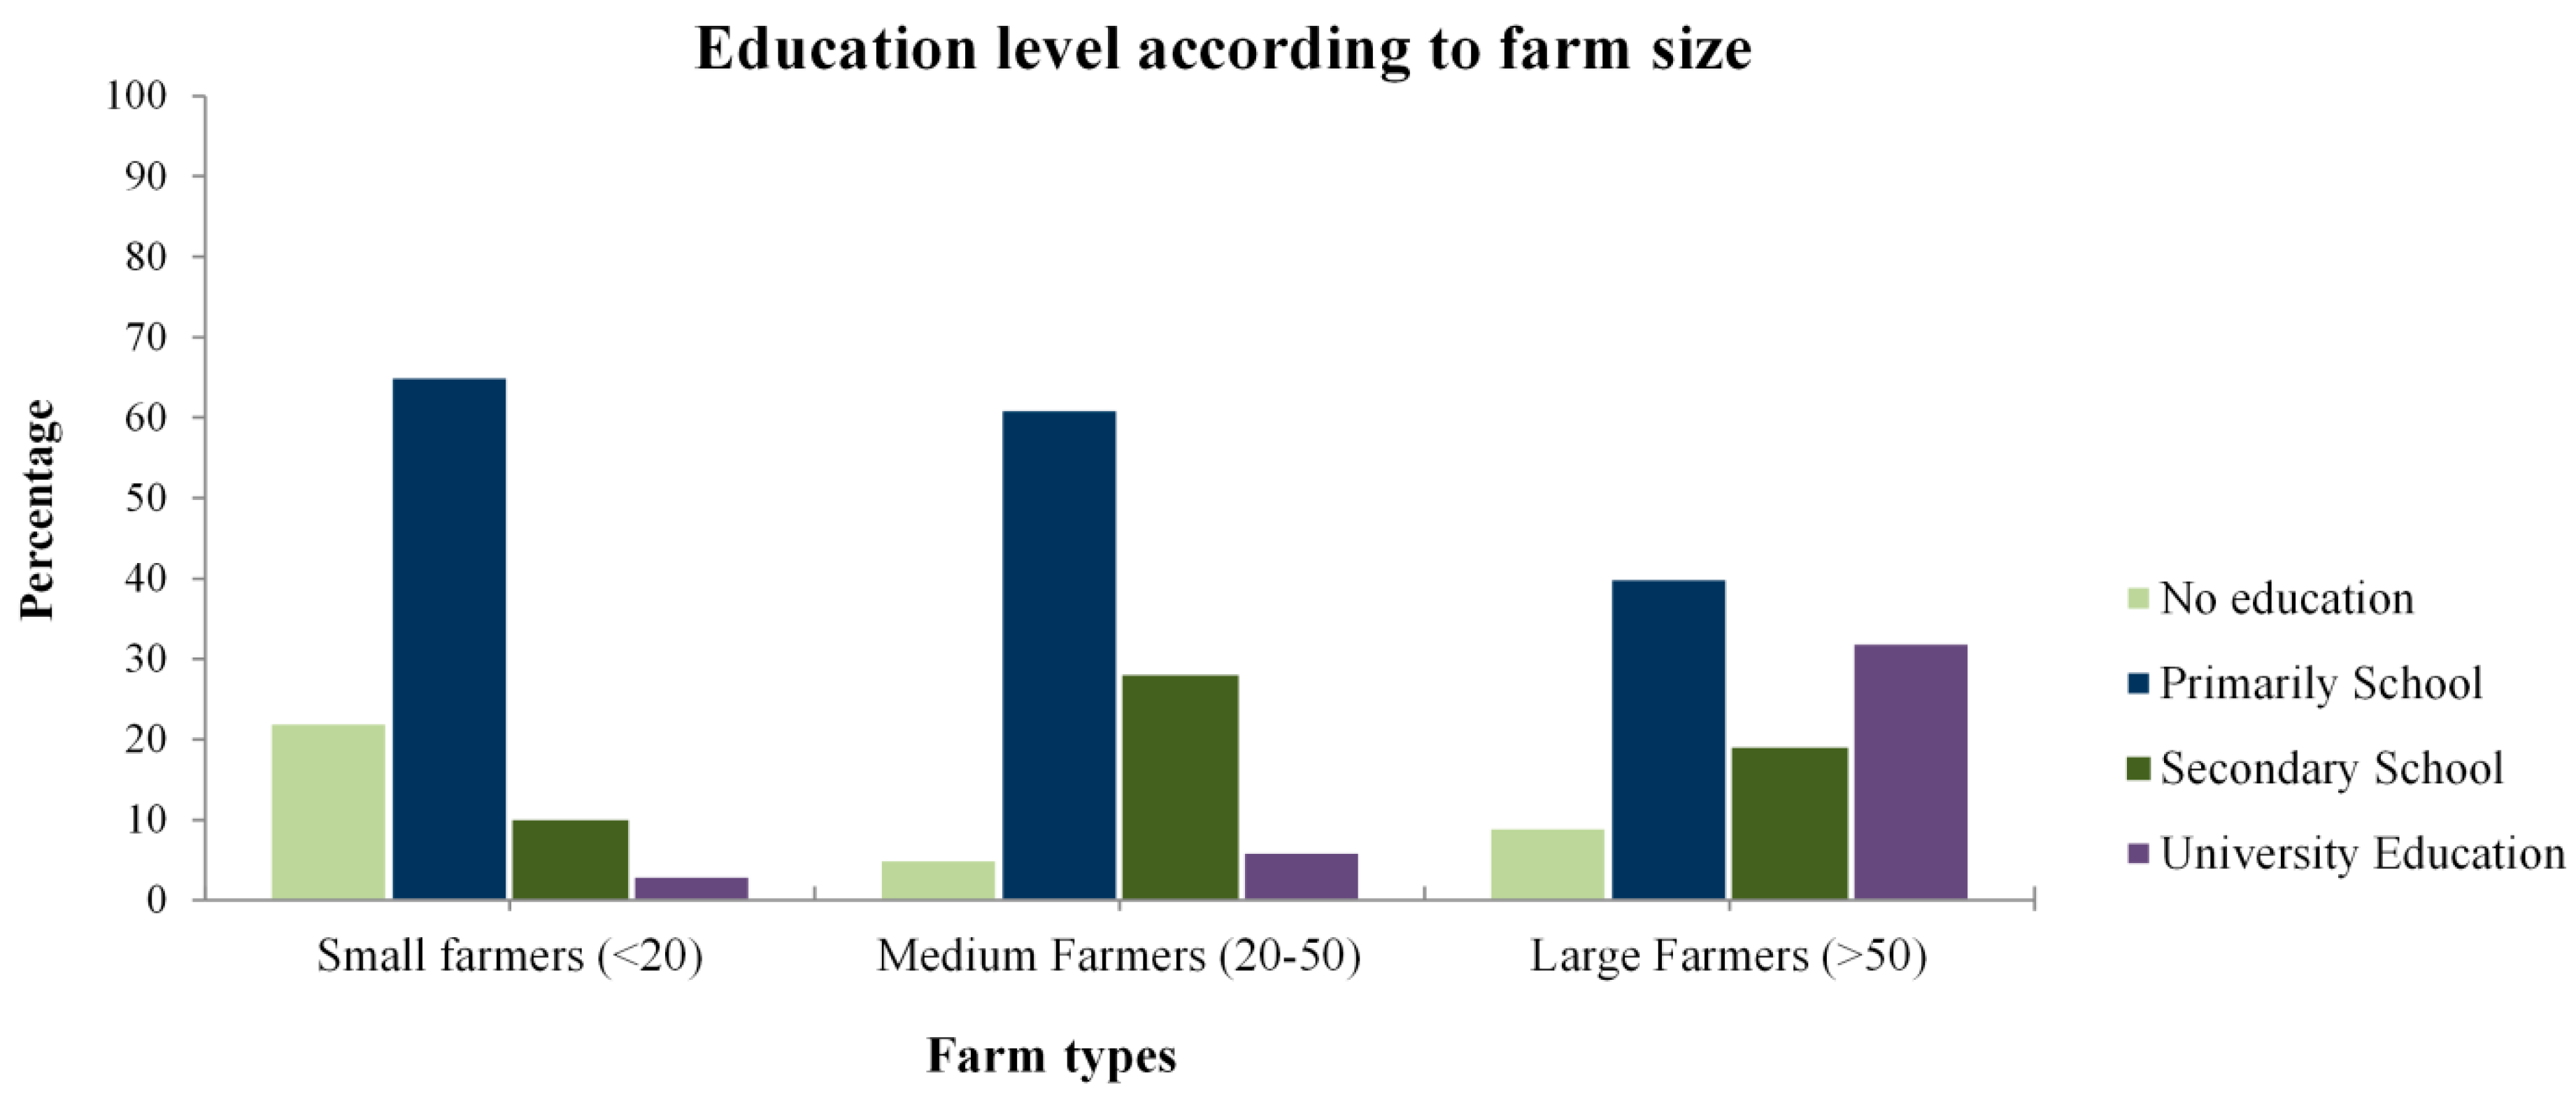
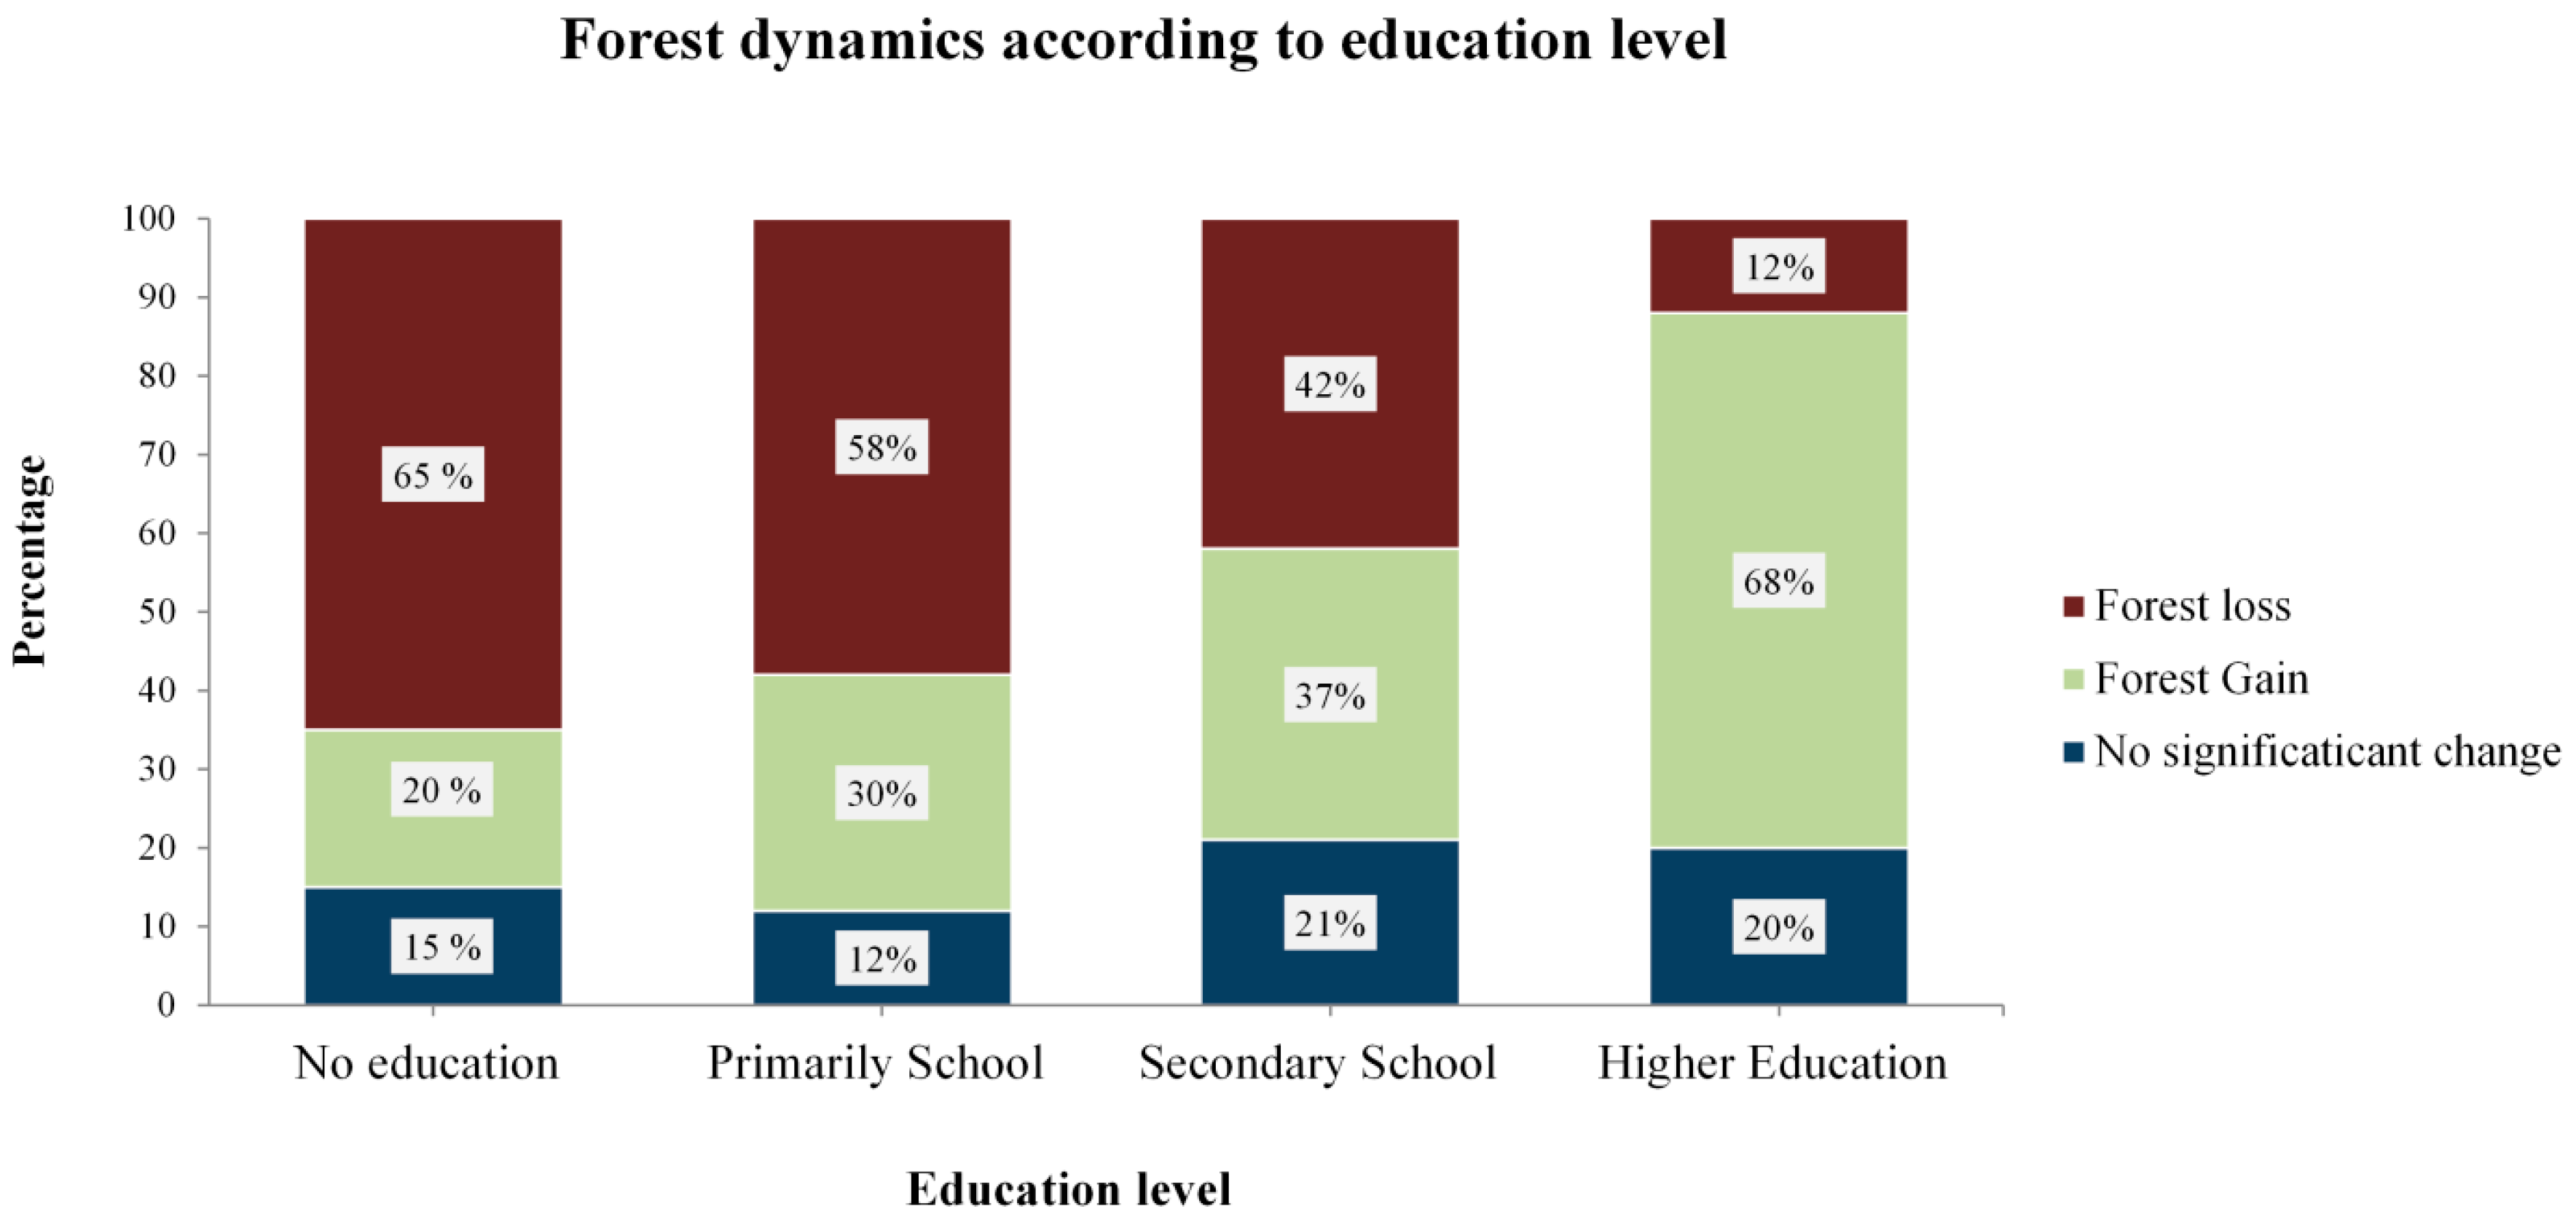
3.3.1. Demography and Influence on Forest Dynamics
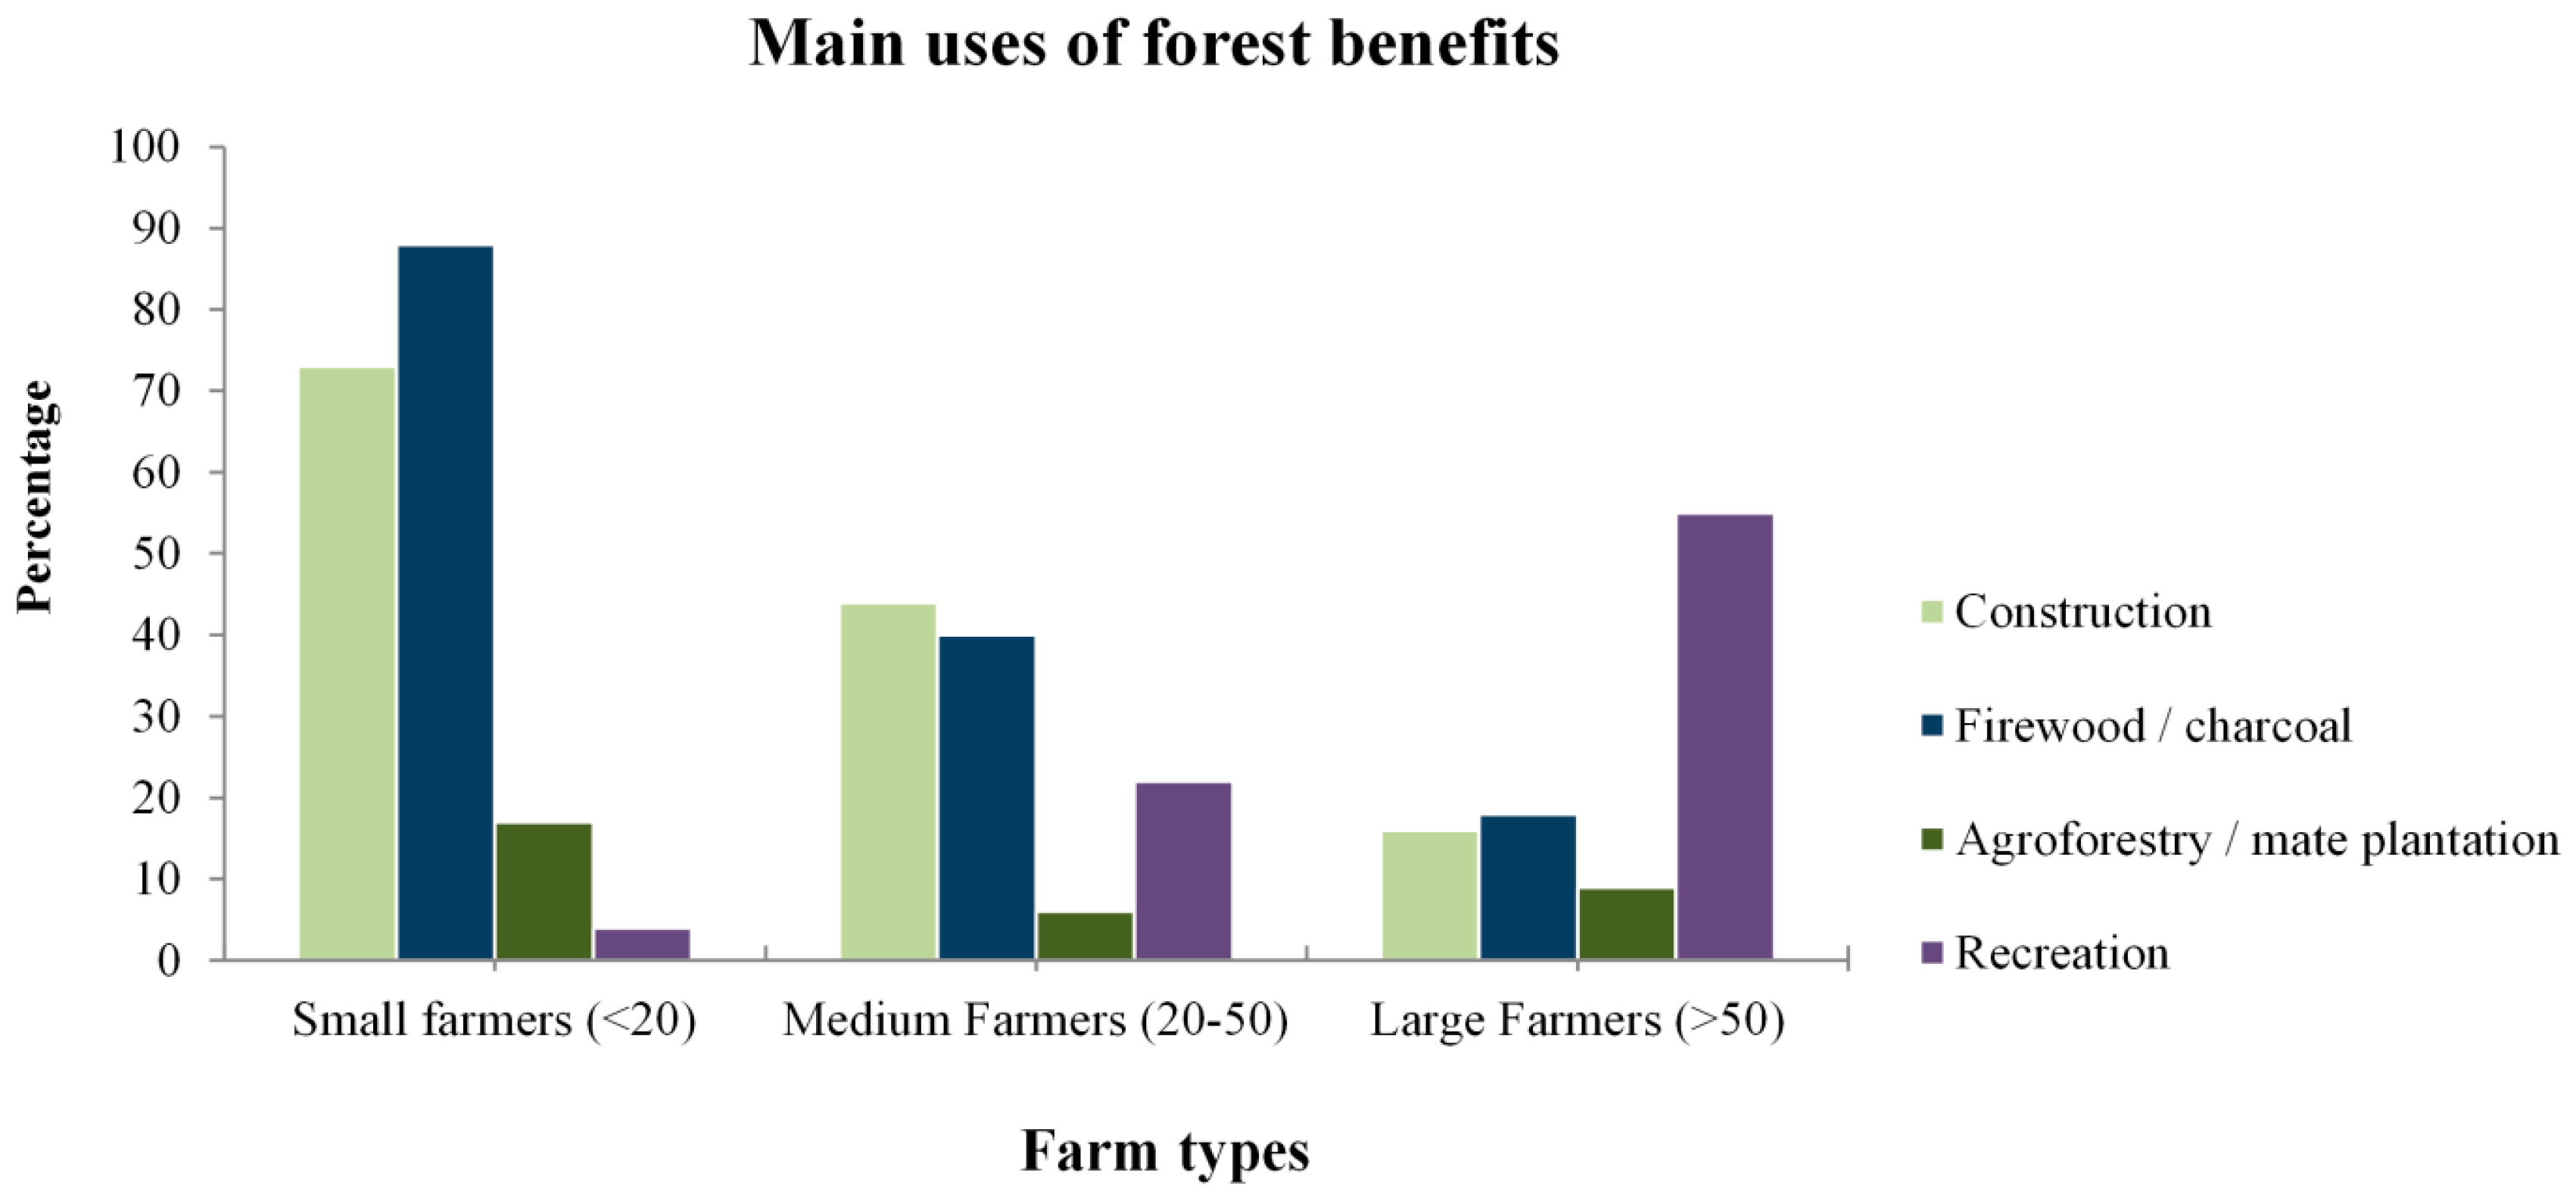
3.3.2. Uses of Forest Benefits and Influence on the Forest Cover
3.3.3. Conservation Programs and Forest Cover Change
4. Discussion
4.1. Forest Cover Change Analysis
4.2. Household Survey and Remote Sensing Data
5. Conclusions
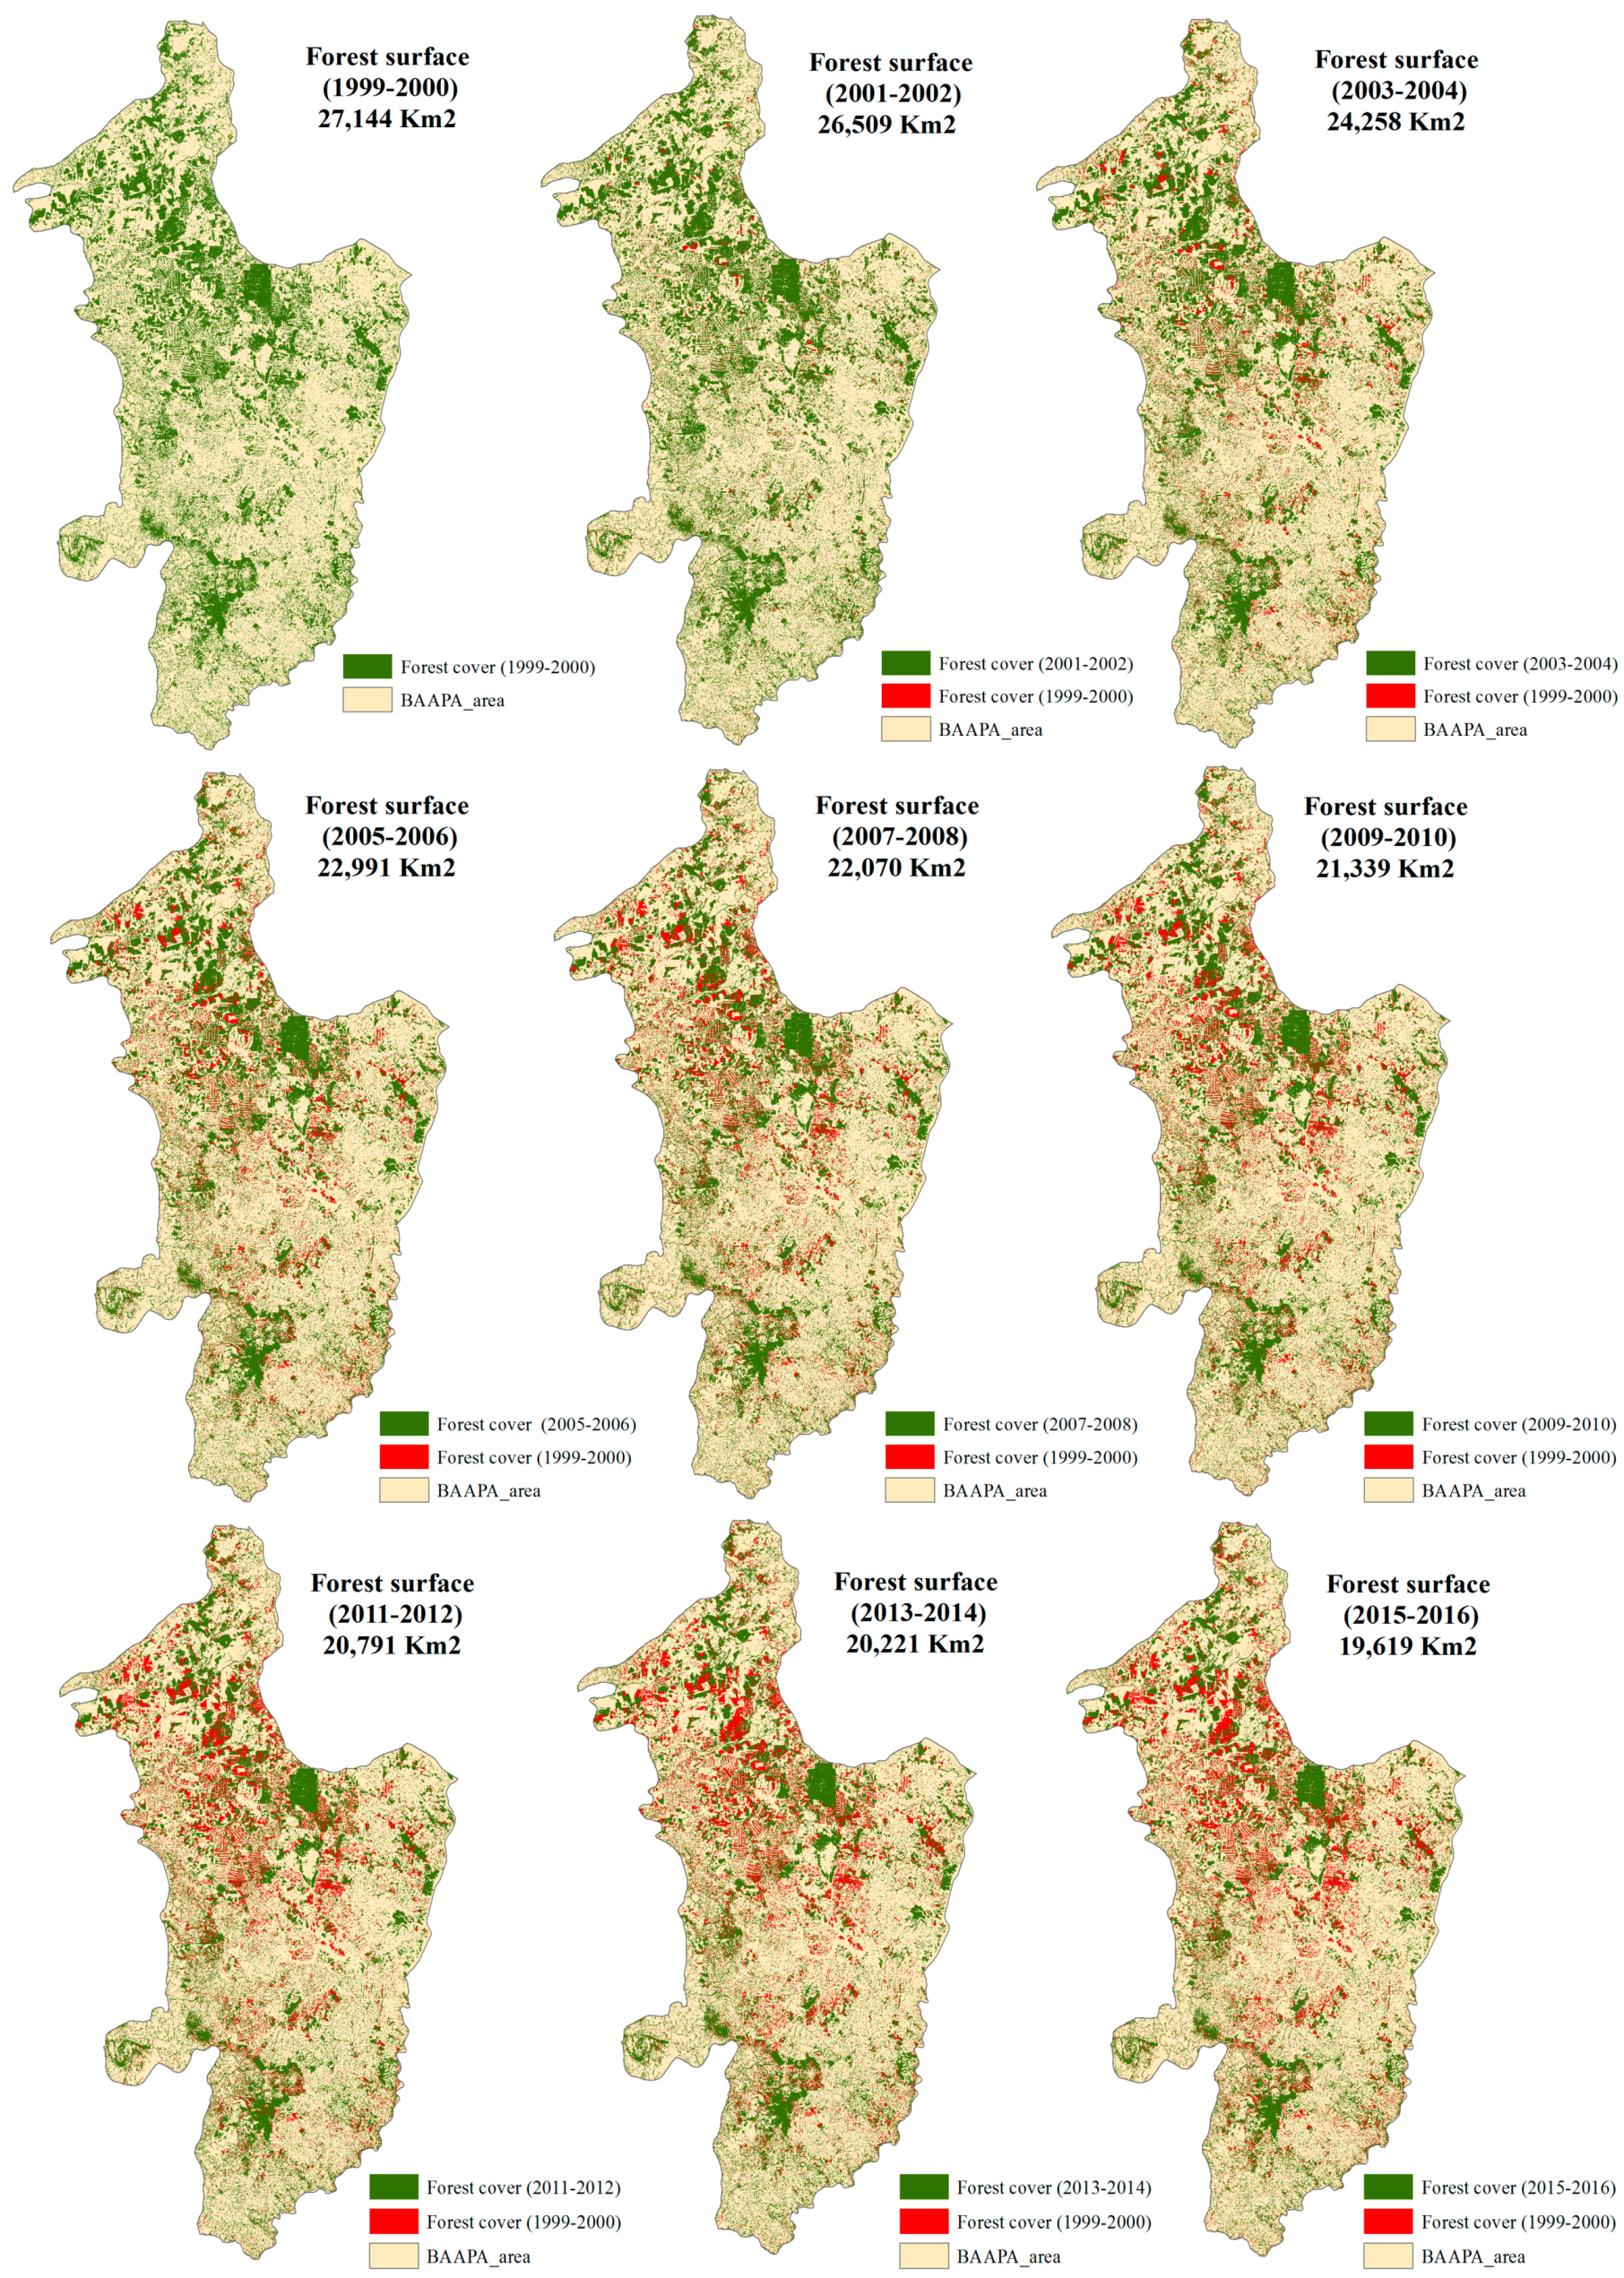
- Results of the forest change detection analysis based on Landsat imagery revealed a total forest cover loss of almost 7500 km2 between the years 1999 and 2016, which represents almost 27% of its cover.
- The outcomes of the time series analysis presented a drastic increase in deforestation rates between the years 2001–2002 and 2003–2004, almost four times the deforestation rates observed for previous years (2300 km2). According to local farmers, the present trend could be attributed to the upcoming Zero Deforestation Law in the country, which influenced the rapid deforestation before the law was applied.
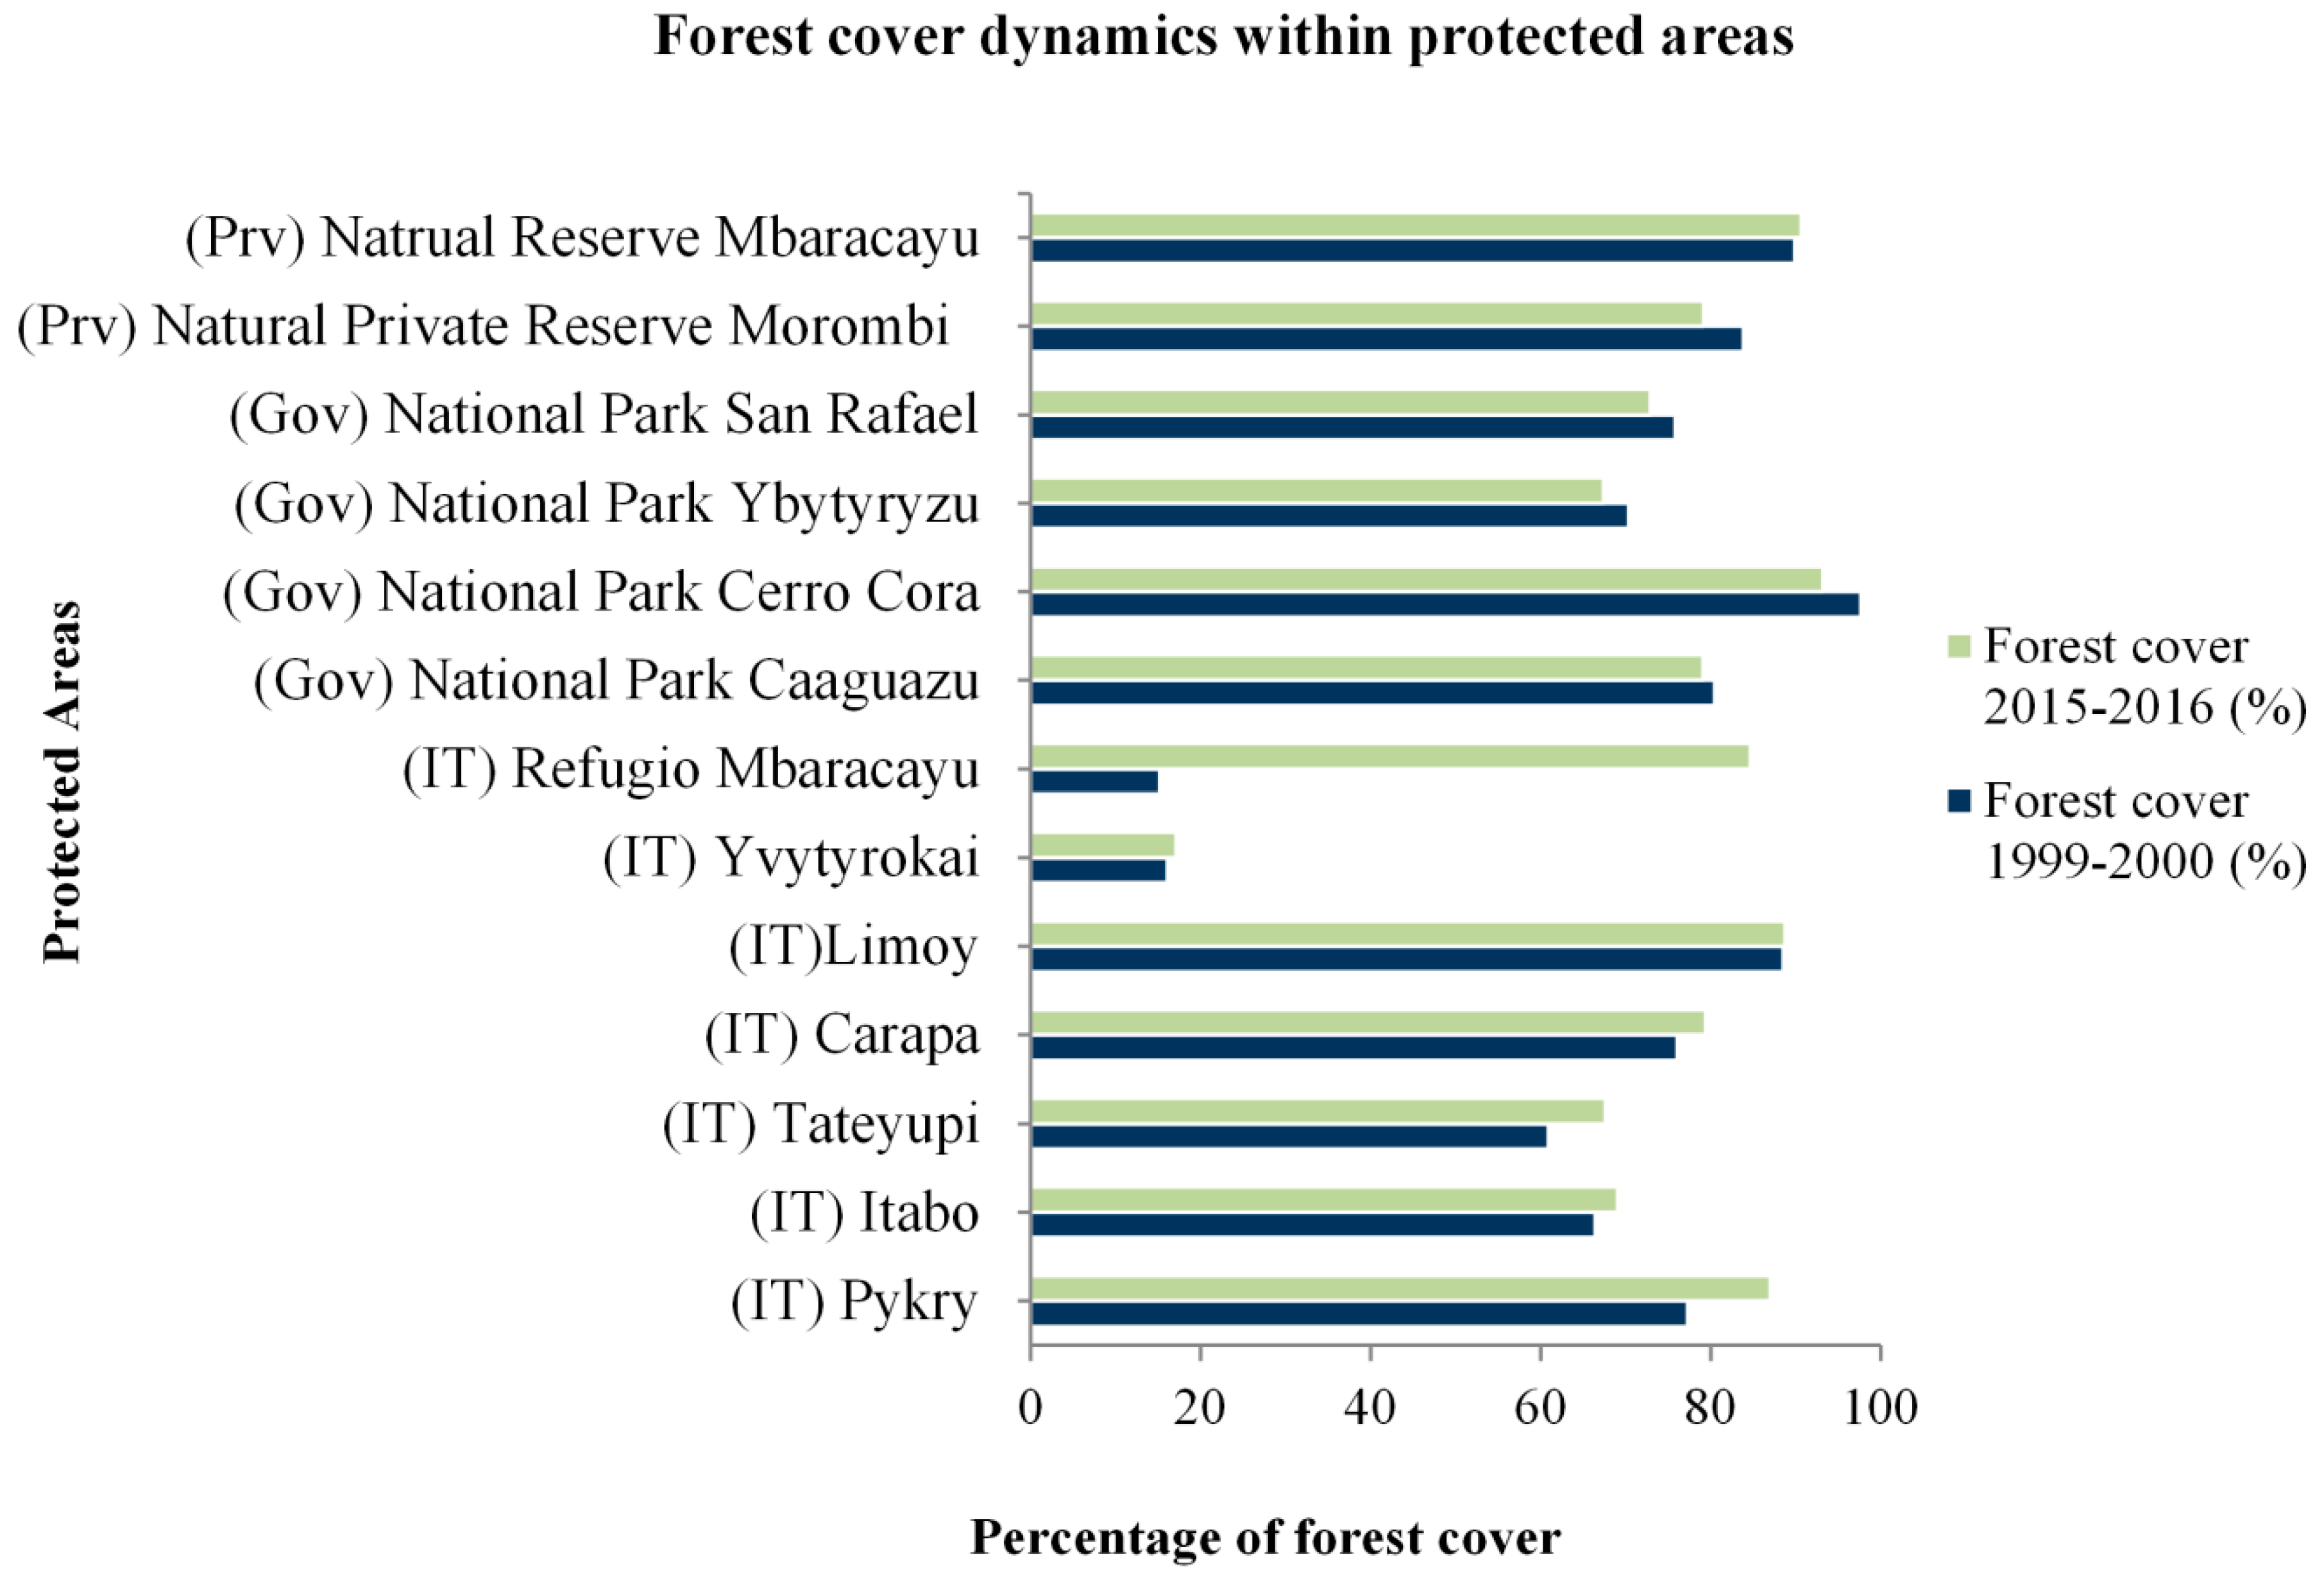
- Forest cover change analysis in protected areas demonstrated a clear difference between their effectiveness. Whereas protected areas under the ITAIPU hydroelectric management regime presented increases in forest cover, protected areas managed by the Government, on the contrary, showed a decrease in their forest cover in each of the reserves.
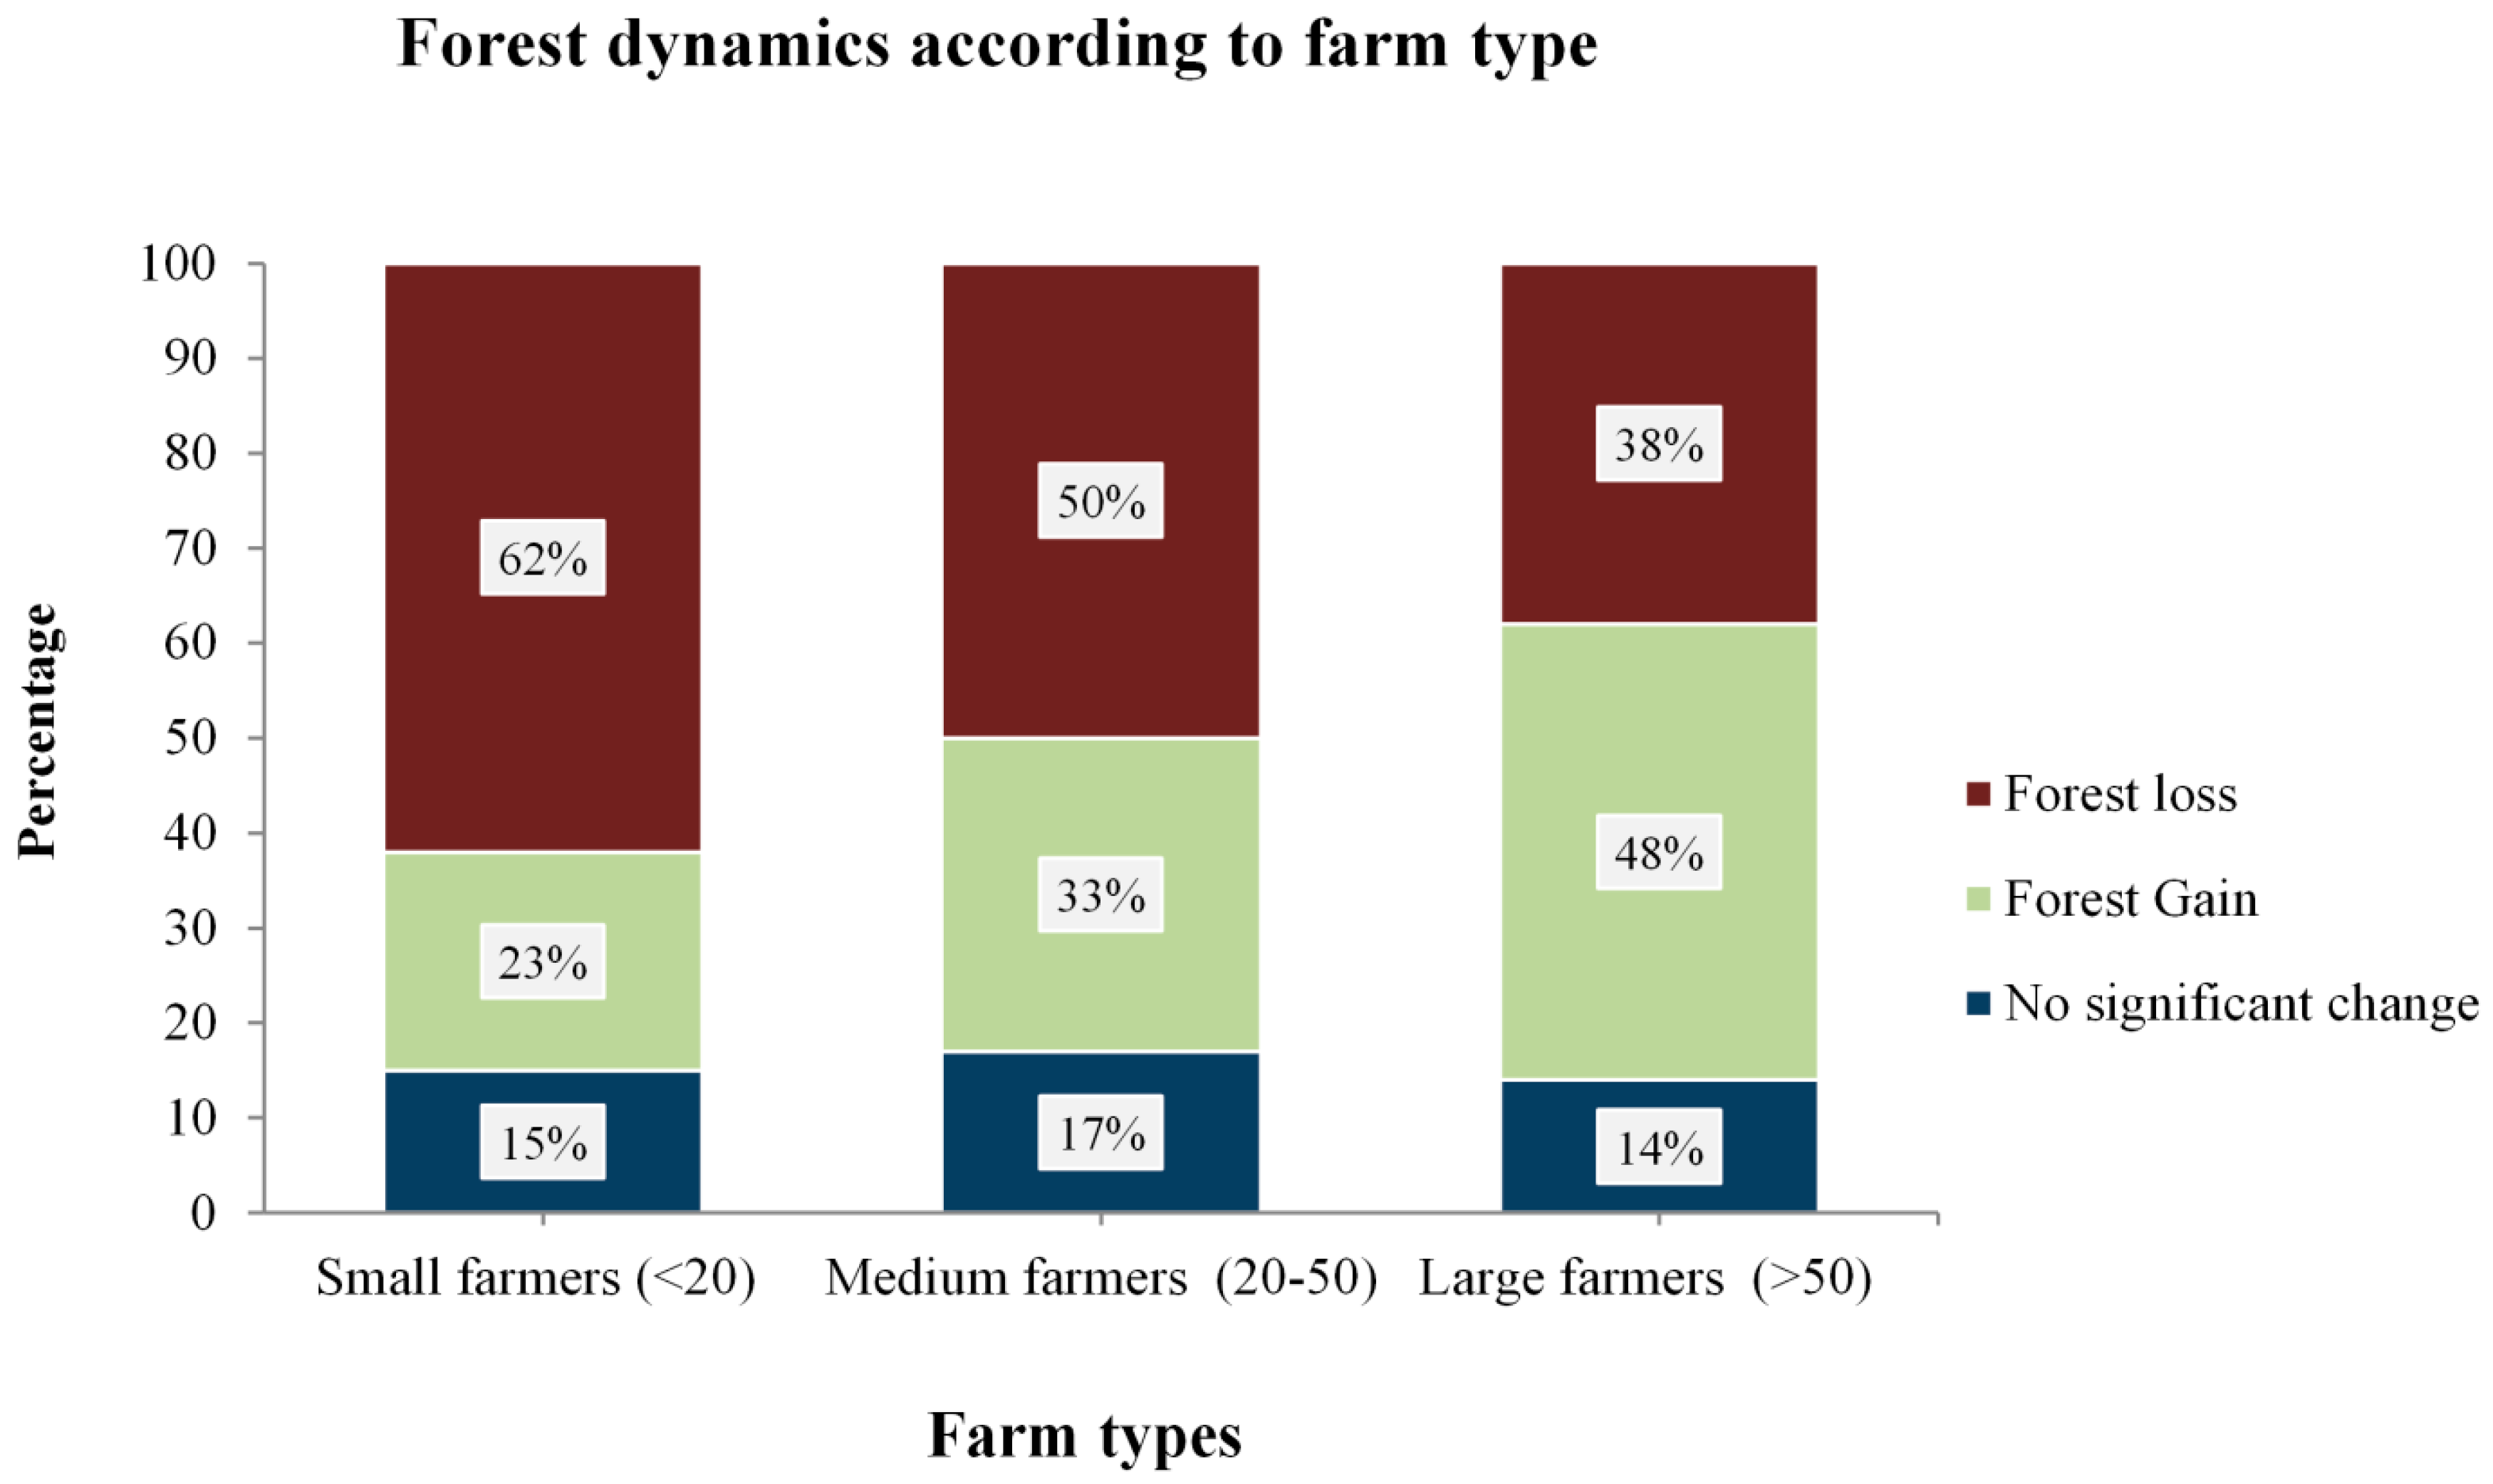
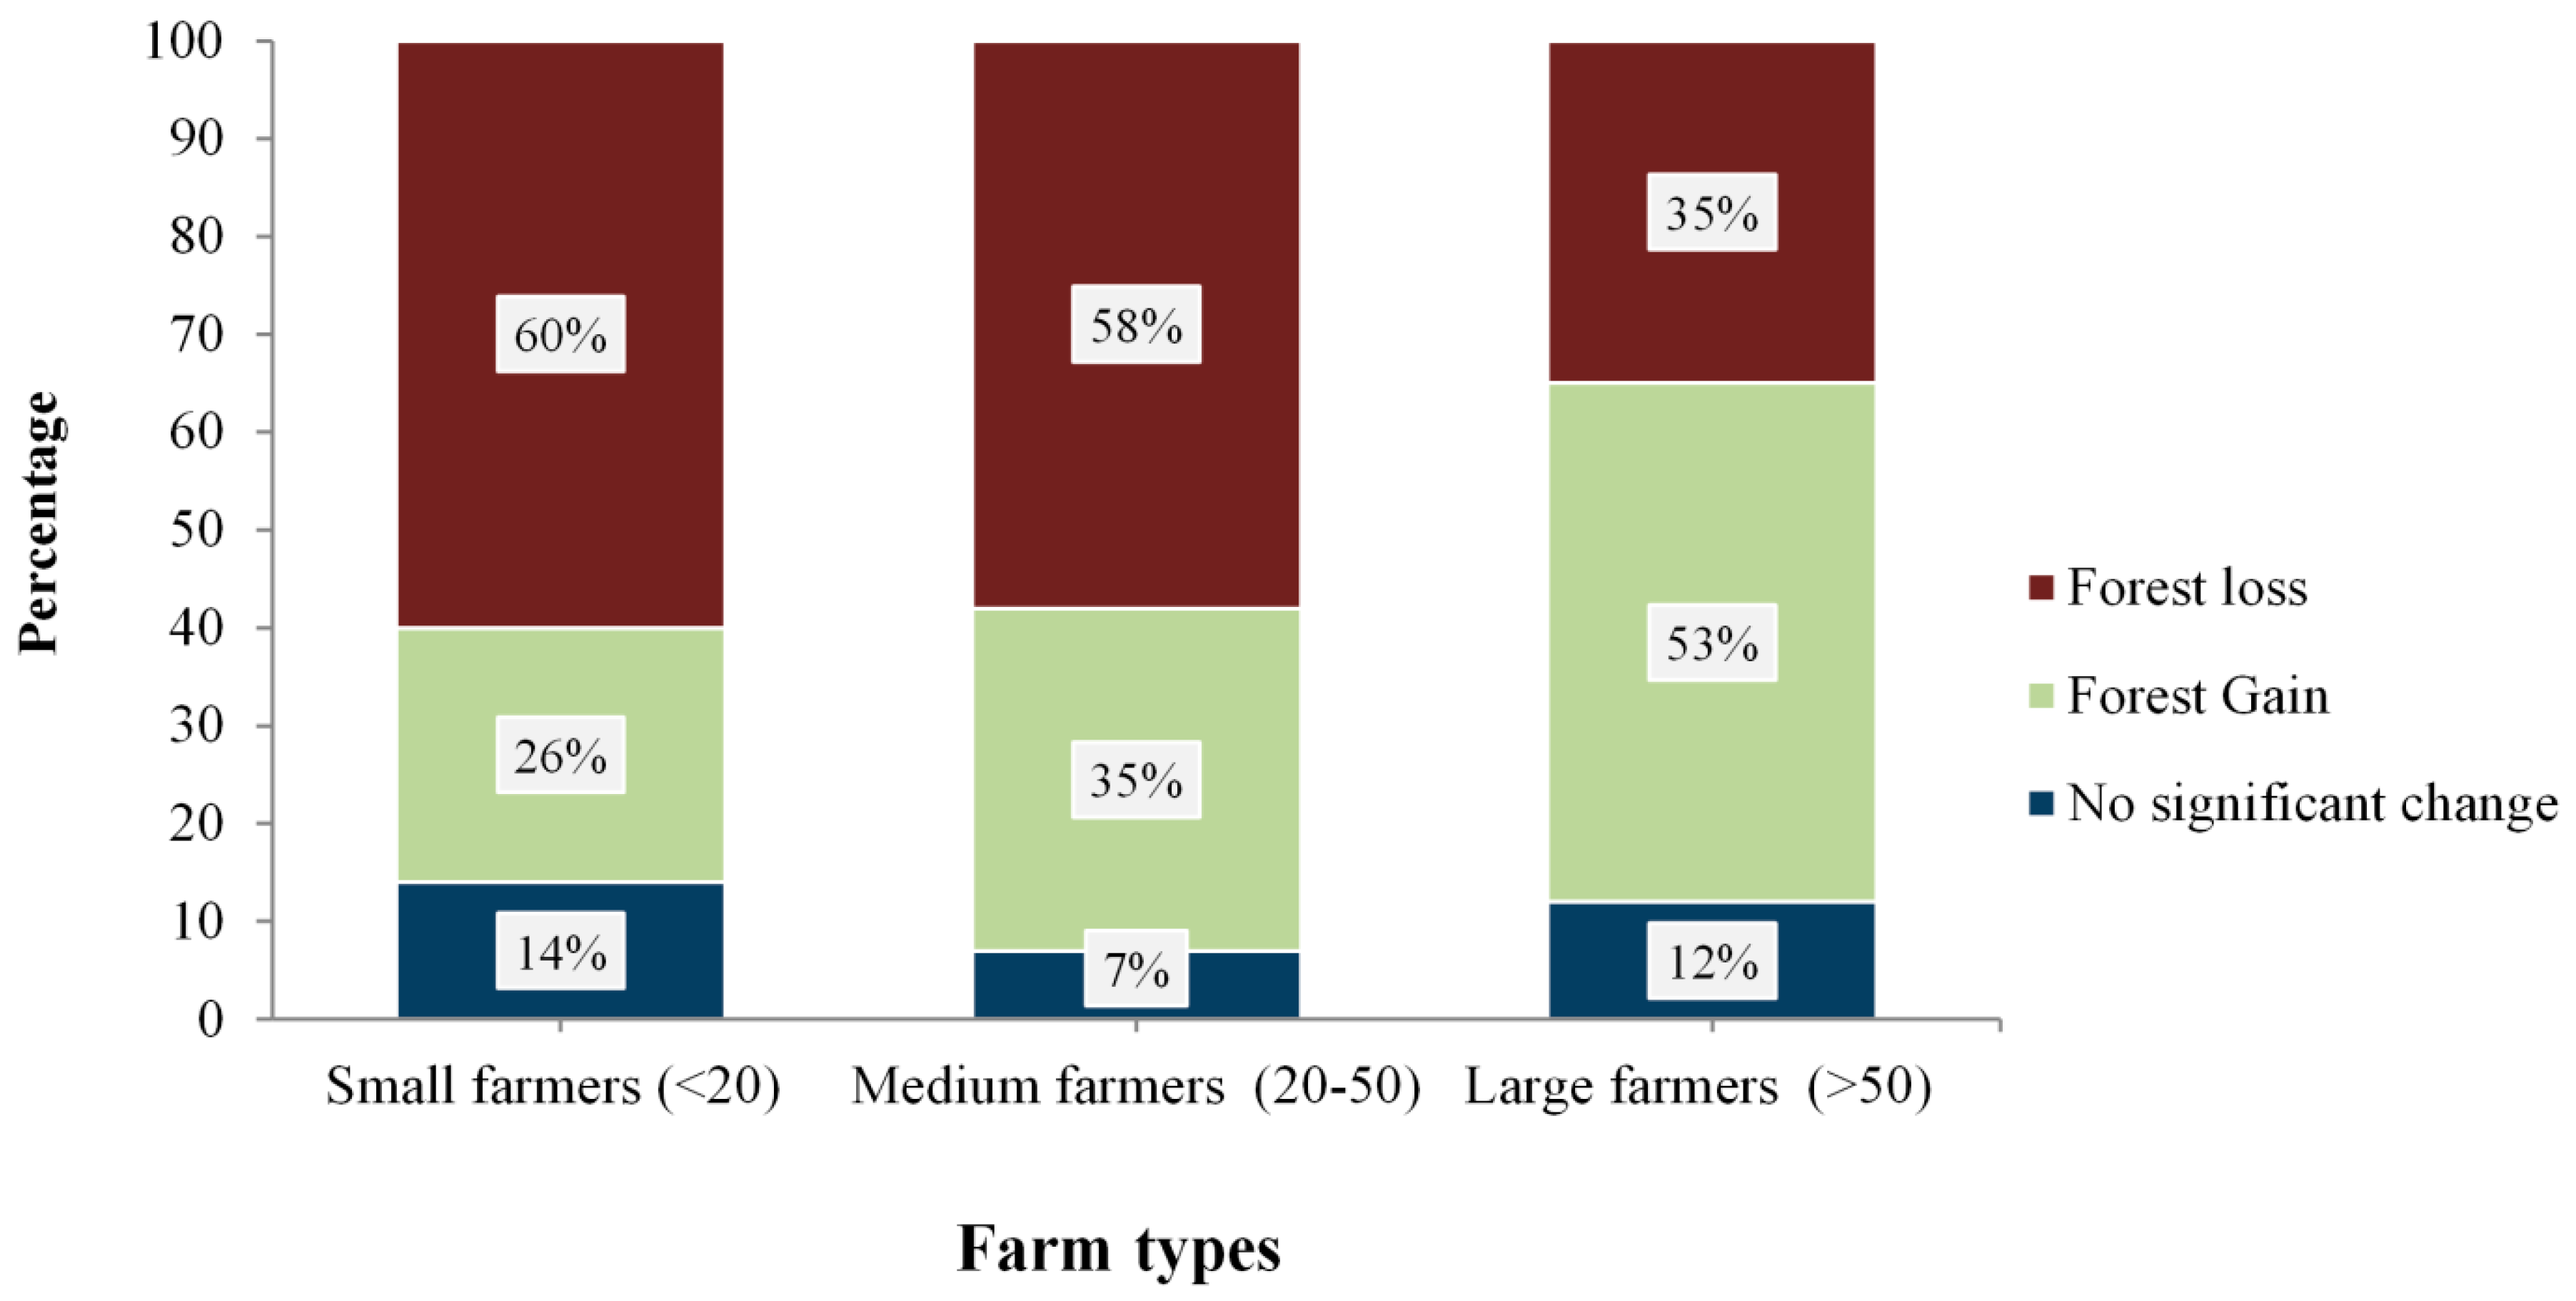
- According to the 145 households interviewed, forest dynamics at the farm level is related to farm types. While the frequency of farmers presenting forest loss increases as farm sizes decreases, forest gains, on the contrary, increase as farm sizes increases as well.
- Education level has been shown to have an influence on the dynamics of the forest at the farm level. Overall, results demonstrated that, as education level increases, the percentage of famers exhibiting forest loss decreases. When considering forest gain, on the other hand, a higher percentage of farms with increases in forest cover can be found among the group with higher education.
- The level of dependency on forest products by different farm groups affects the status of their forest. Higher levels of dependency resulted in a higher percentage of farmers presenting forest cover loss.
- Environmental programs provide a certain degree of influence on changes in the forest cover at the farm level. Among the groups participating in environmental programs and workshops, a lower percentage of respondents showed forest loss on their properties than for comparable groups that did not attend the workshops.
Acknowledgments
Author Contributions
Conflicts of Interest
References
- Carlson, M.J.R.; Mitchell, L.R. Scenario analysis to identify viable conservation strategies in Paraguay’s imperiled Atlantic forest. Ecol. Soc. 2011, 16, 8. [Google Scholar]
- Tejaswi, G. FAO Manual on Deforestation, Degradation, and Fragmentation Using Remote Sensing and GIS; Forestry Department, Food and Agriculture Organization of the United Nations: Rome, Italy, 2007; Available online: www.fao.org/forestry/18222-045c26b711a976bb9d0d17386ee8f0e37.pdf (accessed on 29 August 2017).
- WWF Paraguay Extends Zero Deforestation Law to 2018. Available online: http://wwf.panda.org/?210224/Paraguay-extends-Zero-Deforestation-Law-to-2018 (accessed on 29 August 2017).
- Hansen, M.C.; Stehman, S.V.; Potapov, P.V. Quantification of global gross forest cover loss. Proc. Natl. Acad. Sci. USA 2010, 107, 8650–8655. [Google Scholar] [CrossRef] [PubMed]
- Hansen, M.C.; Potapov, P.V.; Moore, R.; Hancher, M.; Turubanova, S.A.; Tyukavina, A.; Thau, D.; Stehman, S.V.; Goetz, S.J.; Loveland, T.R.; et al. High-Resolution Global Maps of 21st-Century Forest Cover Change. Science 2013, 342, 850–853. [Google Scholar] [CrossRef] [PubMed]
- Fleytas, C. Cambios en el paisaje. Evolución de la cobertura vegetal en la Región Oriental del Paraguay. In Biodiversidad del Paraguay: Una imacion a Sus Realidades, 1st ed.; Salas-Deunas, D., Facetti, J., Eds.; Fundacion Moises Bertoni, USAID, GEF/BM.: Asuncion, Paraguay, 2007; pp. 77–88. Available online: https://de.scribd.com/document/225612694/Cambios-en-El-Paisaje-Evolucion-de-La-Cobertura-Vegetal-en-La-Region-Oriental-Del-Paraguay (accessed on 4 April 2017).
- Bitetti Di, M.S.; Placci, G.; Alves, D. Vision de la Biodiversidad de la Ecorregión Bosque Atlántico del Alto Paraná: Diseño de un Paisaje para la Conservación de la Biodiversidad y prioridades para las acciones de conservación; World Wildlife Fund: Washington, DC, USA, 2003; pp. 29–135. Available online: http://assets.wwf.org.br/downloads/altoparana_version_completa.pdf (accessed on 15 April 2017).
- Mayers, N. Threatened biotas: “Hot spots” in tropical forests. Environmentalist 1988, 8, 187–208. [Google Scholar] [CrossRef]
- Mittermeier, R.A.; Myers, N.; Mittermeier, C.G. Hotspots: Earth’s Biologically Richest and Most Endangered Terrestrial Ecoregions; Graphic Arts Center Publishing Company: Washington, DC, USA, 1999; pp. 1–431. [Google Scholar]
- Myers, N.; Mittermeier, R.A.; Mittermeier, C.G.; Da Fonseca, G.A.; Kent, J. Biodiversity hotspots for conservation priorities. Nature 2000, 403, 853–858. [Google Scholar] [CrossRef] [PubMed]
- Olson, D.M.; Dinerstein, E. The Global 200: Priority ecoregions for global conservation. Ann. Missouri Bot. Gard. 2002, 89, 199–224. [Google Scholar] [CrossRef]
- Catterson, T.M.; Fragano, F.V. Tropical Forestry and Biodiversity Conservation in Paraguay: A Report to USAID/Paraguay. 2004. Available online: https://rmportal.net/library/content/1/118_paraguay/at_download/file (accessed on 29 August 2017).
- Huang, C.; Kim, S.; Altstatt, A.; Townshend, J.R.G.; Davis, P.; Song, K.; Tucker, C.J.; Rodas, O.; Yanosky, A.; Clay, R.; et al. Rapid loss of Paraguay’s Atlantic forest and the status of protected areas–A Landsat assessment. Remote Sens. Environ. 2007, 106, 460–466. [Google Scholar] [CrossRef]
- Hutchison, S.; Aquino, L. Making a Pact to Tackle Deforestation in Paraguay. International Tree Foundation, 2011. Available online: internationaltreefoundation.org/wp-content/.../Paraguay-FINAL-30-march-2011.pdf (accessed on 29 August 2017).
- Grossman, J.J. A case study of smallholder eucalyptus plantation silviculture in Eastern Paraguay. For. Chron. 2012, 88, 528–534. [Google Scholar] [CrossRef]
- Kernan, B.S.; Cordero, W.; Macedo Sienra, A.M.; Marín, J.V. Report on Biodiversity and Tropical Forests in Paraguay; USAID: Asuncion, Paraguay, 2010; pp. 1–99. Available online: https://www.usaid.gov/sites/default/files/documents/1862/paraguay_biodiversity_tropical_forest_report.pdf (accessed on 29 August 2017).
- Valiente, E.; Gerard, F. Fortalecimiento de las políticas agroambientales en los países de américa latina y el caribe. Diagnostico Nacional de Politica Agroambiental Paraguay, 2016. Available online: http://www.fao.org/in-action/programa-brasil-fao/proyectos/politicas-agroambientales/es/ (accessed on 29 August 2017).
- Da Ponte, E.; Kuenzer, C.; Parker, A.; Rodas, O.; Oppelt, N.; Fleckenstein, M. Forest cover loss in Paraguay and perception of ecosystem services: A case study of the Upper Parana Forest. Ecosyst. Serv. 2017, 24, 200–212. [Google Scholar] [CrossRef]
- Da Ponte, E.; Fleckenstein, M.; Leinenkugel, P.; Parker, A.; Oppelt, N.; Kuenzer, C. Tropical forest cover dynamics for Latin America using Earth observation data: A review covering the continental, regional, and local scale. Int. J. Remote Sens. 2015, 36, 37–41. [Google Scholar] [CrossRef]
- Huang, C.; Kim, S.; Song, K.; Townshend, J.R.G.; Davis, P.; Altstatt, A.; Rodas, O.; Yanosky, A.; Clay, R.; Tucker, C.J.; et al. Assessment of Paraguay’s forest cover change using Landsat observations. Glob. Planet. Chang. 2009, 67, 1–12. [Google Scholar] [CrossRef]
- Da Ponte, E.; Roch, M.; Leinenkugel, P.; Dech, S.; Kuenzer, C. Paraguay’s Atlantic Forest cover loss—Satellite-based change detection and fragmentation analysis between 2003 and 2013. Appl. Geogr. 2017, 79, 37–49. [Google Scholar] [CrossRef]
- Bragayrac, E. Proyecto Conservación de Bosques del Paraguay—REDD BAAPA; Monitoreo Social de la Colonia Amistad: Asuncion, Paraguay, 2014; pp. 1–46. Available online: http://www.worldlandtrust.org/documents/annexe_1_-_social_monitoring_results_in_spanish.pdf (accessed on 29 August 2017).
- DGEEC (Dirección Nacional de Censos y Estadisticas), Atlas censal del Paraguay. Available online: http://www.dgeec.gov.py/ (accessed on 29 August 2017).
- MAG (Ministerio de Agricultura y Ganaderia). Informer sector Agropecuario ISA. Available online: http://www.mag.gov.py/index.php/noticias/logros-del-sector-agropecuario-en-el-pais (accessed on 29 August 2017).
- Gonzales, R.; Rivadeneira, M. Estudio de tendencias y perspectivas del Sector Forestal en America Latina Documento de Trabajo. Informe nacional Paraguay; FAO: Rome, Italy, 2004; Volume 9, pp. 1–98. Available online: http://www.fao.org/forestry/outlook/2406/es/ (accessed on 29 August 2017).
- Patterson, T.; Kelso, V.N. Earth Natural Free Vector and Raster Map Data. Available online: http://www.naturalearthdata.com/downloads (accessed on 10 March 2017).
- Mittermeier, R.A.; Robles-Gil, P.; Hoffman, M.; Pilgrim, J.D.; Brooks, T.B.; Mitterneier, C.G.; Lamoreux, J.L.; Fonseca, G.A. Biodiversity Hotspots Revisited, Conservation International 2004. Databasin, 2004. Available online: http://www.biodiversityhotspots.org/xp/Hotspots/resources/maps.xml (accessed on 3 April 2017).
- Wohlfart, C.; Mack, B.; Liu, G.; Kuenzer, C. Multi-faceted land cover and land use change analyses in the Yellow River Basin based on dense Landsat time series: Exemplary analysis in mining, agriculture, forest, and urban areas. Appl. Geogr. 2017, 85, 73–88. [Google Scholar] [CrossRef]
- Knauer, K.; Gessner, U.; Fensholt, U.; Kuenzer, C. Agricultural Expansion in Burkina Faso over 14 Years with 30 m Resolution Time Series: The Role of Population Growth and Implications for the Environment. Remote Sens. 2017, 9, 132. [Google Scholar] [CrossRef]
- Gebhardt, S.; Wehrmann, T.; Ruiz, M.A.M.; Maeda, P.; Bishop, J.; Schramm, M.; Kopeinig, R.; Cartus, O.; Kellndorfer, J.; Ressl, R.; et al. MAD-MEX: Automatic wall-to-wall land cover monitoring for the mexican REDD-MRV program using all landsat data. Remote Sens. 2014, 6, 3923–3943. [Google Scholar] [CrossRef]
- Zhu, Z.; Woodcock, C.E. Object-based cloud and cloud shadow detection in Landsat imagery. Remote Sens. Environ. 2012, 118, 83–94. [Google Scholar] [CrossRef]
- Richter, R.; Schläpfer, D. Atmospheric/Topographic Correction for Satellite Imagery (ATCOR-2/3 User Guide); ReSe Applications Schläpfer: Langeggweg, Switzerland, 2016; pp. 13–250. Available online: www.rese.ch/pdf/atcor3_manual.pdf (accessed on 29 August 2017).
- Mack, B.; Leinenkugel, P.; Kuenzer, C.; Dech, S. A semi-automated approach for the generation of a new land use and land cover product for Germany based on Landsat time-series and Lucas in-situ data. Remote Sens. Lett. 2017, 8, 244–253. [Google Scholar] [CrossRef]
- Franklin, S.E.; Ahmed, O.S.; Wulder, M.A.; White, J.C.; Hermosilla, T.; Coops, N.C. Large area mapping of annual land cover dynamics using multitemporal change detection and classification of Landsat time series data. Can. J. Remote Sens. 2015, 41, 293–314. [Google Scholar] [CrossRef]
- Griffiths, P.; Kuemmerle, T.; Baumann, M.; Radeloff, V.C.; Abrudan, I.V.; Lieskovsky, J.; Munteanu, C.; Ostapowicz, K.; Hostert, P. Forest disturbances, forest recovery, and changes in forest types across the Carpathian ecoregion from 1985 to 2010 based on Landsat image composites. Remote Sens. Environ. 2014, 151, 72–88. [Google Scholar] [CrossRef]
- Hansen, M.C.; Egorov, A.; Potapov, P.V.; Stehman, S.V.; Tyukavina, A.; Turubanova, S.A.; Roy, D.P.; Goetz, S.J.; Loveland, T.R.; Ju, J.; et al. Monitoring conterminous United States (CONUS) land cover change with Web-Enabled Landsat Data (WELD). Remote Sens. Environ. 2014, 140, 466–484. [Google Scholar] [CrossRef]
- Müller, H.; Griffiths, P.; Hostert, P. Long-term deforestation dynamics in the Brazilian Amazon—Uncovering historic frontier development along the Cuiabá–Santarém highway. Int. J. Appl. Earth Obs. Geoinf. 2016, 44, 61–69. [Google Scholar] [CrossRef]
- Breiman, L. Random forests. Mach. Learn. 2001, 45, 5–32. [Google Scholar] [CrossRef]
- Congalton, R.G.; Green, K. Assessing the Accuracy of Remotely Sensed Data: Principles and Practices; Second Edition (Mapping Science); CRC Press: Boca Raton, FL, USA, 2008. [Google Scholar]
- Wohlfart, C.; Liu, G.; Huang, C.; Kuenzer, C. A River Basin over the course of time: Multi-temporal analyses of land surface dynamics in the Yellow River Basin (China) based on medium resolution remote sensing data. Remote Sens. 2016, 8, 186. [Google Scholar] [CrossRef] [Green Version]
- Paraguayan Atlantic Forest. 24°58′31.38″ S and 55°03′27.73″ W. Google Earth. 1999–2016. Available online: https://earth.google.com/web/@-24.58598683,-55.12783014,432.7883121a,308634.30743907d,35y,11.83507172h,7.24129773t,0r (accessed on 12 April 2017).
- Pal, M. Random forest classifier for remote sensing classification. Int. J. Remote Sens. 2005, 26, 217–222. [Google Scholar] [CrossRef]
- Gislason, P.O.; Benediktsson, J.A.; Sveinsson, J.R. Random Forests for land cover classification. Pattern Recognit. Lett. 2006, 27, 294–300. [Google Scholar] [CrossRef]
- Schneider, A. Monitoring land cover change in urban and peri-urban areas using dense time stacks of Landsat satellite data and a data mining approach. Remote Sens. Environ. 2012, 124, 689–704. [Google Scholar] [CrossRef]
- R Core Team. R, 3.3.1; R Foundation for Statistical Computing: Vienna, Austria, 2016. [Google Scholar]
- Liaw, A.; Wiener, M. Classification and regression by randomForest. R News 2002, 2, 18–22. [Google Scholar]
- Lillesand, T.; Kiefer, R.W.; Chipman, J. Remote Sensing and Image Interpretation, 6th ed.; Flahive, R., Kelleher, L., Hong, S., Eds.; Wiley: New York, NY, USA, 2008; Volume 6. [Google Scholar]
- FAO. Global Forest Resources Assessment 2010; FAO: Rome, Italy, 2010; pp. 1–193. [Google Scholar]
- PNUD Sector rural paraguayo: una visión general para un dialogo informado; Mercurio S.A.: Asuncion, Paraguay, 2010; Volume 7, pp. 8–109.
- Yamane, T. Statistics: An Introductory Analysis; Harper and Row: New York, NY, USA, 1967. [Google Scholar]
- Sodhi, N.S.; Lee, T.M.; Sekercioglu, C.H.; Webb, E.L.; Prawiradilaga, D.M.; Lohman, D.J.; Pierce, N.E.; Diesmos, A.C.; Rao, M.; Ehrlich, P.R. Local people value environmental services provided by forested parks. Biodivers. Conserv. 2009, 19, 1175–1188. [Google Scholar] [CrossRef]
- Casado-Arzuaga, I.; Madariaga, I.; Onaindia, M. Perception, demand and user contribution to ecosystem services in the Bilbao Metropolitan Greenbelt. J. Environ. Manag. 2013, 129, 33–43. [Google Scholar] [CrossRef] [PubMed]
- Rajelaga, L.; Guerrero, N.; Cabrera, L.; Hirata, Y.; Takahashi, M.; Vega, L. Mapa de Cobertura de la Tierra Paraguay 2011. In Facultad de Ciencias Agrarias y Forestry and Forest Products Research Institute (Japon); SIG/CIF/FCA/UNA: San Lorenzo, Paraguay, 2013; pp. 1–24. [Google Scholar]
- Ravikumar, A.; Sears, R.R.; Cronkleton, P.; Menton, M.; Pérez-Ojeda del Arco, M. Is small-scale agriculture really the main driver of deforestation in the Peruvian Amazon? Moving beyond the prevailing narrative. Conserv. Lett. 2017, 10, 170–177. [Google Scholar] [CrossRef]
- Godoy, R.; Groff, S.; O’Neill, K. The role of education in neotropical deforestation: Household evidence from Amerindians in Honduras. Hum. Ecol. 1998, 26, 649–675. [Google Scholar] [CrossRef]
- Turner, B.L., II; Geoghegan, J.D. Integrated Land-Change Science and Tropical Deforestation in the Southern Yucatan; OUP Oxford: Oxford, UK, 2004. [Google Scholar]


| Sensor | Path/Row | Acquisition Dates | Number of Scenes | Total |
|---|---|---|---|---|
| Landsat 5 TM | 224/77 | 07/1999–11/2011 | 116 | 930 |
| 224/78 | 04/1999–11/2011 | 108 | ||
| 224/79 | 01/1999–11/2011 | 106 | ||
| 225/76 | 01/1999–11/2011 | 112 | ||
| 225/77 | 01/1999–11/2011 | 118 | ||
| 225/78 | 01/1999–11/2011 | 121 | ||
| 225/79 | 01/1999–9/2011 | 127 | ||
| 226/76 | 02/1999–10/2011 | 122 | ||
| Landsat 7 ETM+ | 224/77 | 08/1999–07/2016 | 190 | 1514 |
| 224/78 | 08/1999–08/2016 | 177 | ||
| 224/79 | 09/1999–08/2016 | 188 | ||
| 225/76 | 07/1999–07/2016 | 198 | ||
| 225/77 | 07/1999–08/2016 | 197 | ||
| 225/78 | 07/1999–08/2016 | 194 | ||
| 225/79 | 10/1999–08/2016 | 179 | ||
| 226/76 | 08/1999–08/2016 | 191 | ||
| Landsat 8 OLI | 224/77 | 05/2013–08/2016 | 43 | 331 |
| 224/78 | 05/2013–08/2016 | 40 | ||
| 224/79 | 07/2013–08/2016 | 42 | ||
| 225/76 | 04/2013–07/2016 | 44 | ||
| 225/77 | 04/2013–07/2016 | 41 | ||
| 225/78 | 04/2013–07/2016 | 45 | ||
| 225/79 | 04/2013–07/2016 | 43 | ||
| 226/76 | 04/2013–08/2016 | 33 |
| Time Period | Overall | KAPPA | Producers Accuracy Forest | Users Accuracy Forest | Producers Accuracy Non-Forest | Users Accuracy Non-Forest |
|---|---|---|---|---|---|---|
| 1990/2000 | 89.04% | 0.85 | 90.15% | 89.12% | 89.87% | 88.10% |
| 2001/2002 | 93.06% | 0.91 | 94.13% | 92.28% | 92.86% | 93.18% |
| 2003/2004 | 85.71% | 0.82 | 86.74% | 85.95% | 84.67% | 85.13% |
| 2005/2006 | 92.86% | 0.90 | 93.75% | 92.67% | 92.88% | 91.43% |
| 2007/2008 | 91.69% | 0.89 | 93.09% | 90.43% | 91.15% | 92.24% |
| 2009/2010 | 91.03% | 0.87 | 91.15% | 91.08% | 89.87% | 91.02% |
| 2011/2012 | 92.35% | 0.89 | 94.88% | 93.45% | 90.72% | 91.23% |
| 2013/2014 | 92.13% | 0.89 | 92.78% | 92.52% | 91.36% | 91.75% |
| 2015/2016 | 87.36% | 0.83 | 88.40% | 87.78% | 87.04% | 86.26% |
| Department | Forest Cover (1999–2000 km2) | % | Forest Cover (2001–2002 km2) | % | Forest Cover (2003–2004 km2) | % | Forest Cover (2005–2006 km2) | % | Forest Cover (2007–2008 km2) | % |
| Alto Paraná | 3336 | 12.3 | 3210 | 11.8 | 2856 | 10.5 | 2747 | 10.1 | 2709 | 10.0 |
| Amambay | 2414 | 8.9 | 2371 | 8.7 | 2353 | 8.7 | 2144 | 7.9 | 1998 | 7.3 |
| Caaguazú | 3113 | 11.5 | 3069 | 11.3 | 2801 | 10.3 | 2658 | 9.8 | 2649 | 9.7 |
| Caazapá | 2172 | 8.0 | 2169 | 8.0 | 1901 | 7.0 | 1801 | 6.6 | 1787 | 6.6 |
| Canindeyú | 5812 | 21.4 | 5602 | 20.6 | 5036 | 18.5 | 4889 | 18.0 | 4692 | 17.3 |
| Concepción | 1246 | 4.6 | 1236 | 4.5 | 1084 | 4.0 | 1027 | 3.8 | 940 | 3.5 |
| Guairá | 916 | 3.4 | 891 | 3.3 | 862 | 3.2 | 860 | 3.2 | 856 | 3.1 |
| Itapúa | 3086 | 11.4 | 3084 | 11.3 | 2833 | 10.4 | 2802 | 10.3 | 2730 | 10.0 |
| Paraguarí | 357 | 1.3 | 324 | 1.2 | 347 | 1.3 | 335 | 1.2 | 327 | 1.2 |
| San Pedro | 4735 | 17.4 | 4570 | 16.8 | 4124 | 15.2 | 3728 | 13.7 | 3383 | 12.4 |
| Total | 27,187 | 100 | 26,526 | 24,197 | 22,991 | 22,071 | ||||
| Department | Forest Cover (2009–2010 km2) | % | Forest Cover (2011–2012 km2) | % | Forest Cover (2013–2014 km2) | % | Forest Cover (2015–2016 km2) | % | Total Forest Loss (km2) | % |
| Alto Paraná | 2664 | 9.8 | 2609 | 9.6 | 2598 | 9.6 | 2528 | 9.3 | 808 | 24.2 |
| Amambay | 1946 | 7.2 | 1911 | 7.0 | 1827 | 6.7 | 1808 | 6.7 | 606 | 25.1 |
| Caaguazú | 2548 | 9.4 | 2487 | 9.1 | 2434 | 9.0 | 2322 | 8.5 | 791 | 25.4 |
| Caazapá | 1768 | 6.5 | 1768 | 6.5 | 1732 | 6.4 | 1639 | 6.0 | 533 | 24.5 |
| Canindeyú | 4427 | 16.3 | 4278 | 15.7 | 4091 | 15.0 | 3904 | 14 | 1908 | 32.8 |
| Concepción | 916 | 3.4 | 901 | 3.3 | 890 | 3.3 | 876 | 3.2 | 370 | 29.7 |
| Guairá | 834 | 3.1 | 816 | 3.0 | 806 | 3.0 | 805 | 3.0 | 111 | 12.1 |
| Itapúa | 2705 | 9.9 | 2700 | 9.9 | 2678 | 9.9 | 2634 | 9.7 | 452 | 14.6 |
| Paraguarí | 328 | 1.2 | 358 | 1.3 | 360 | 1.3 | 348 | 1.3 | 9 | 2.4 |
| San Pedro | 3204 | 11.8 | 2963 | 10.9 | 2804 | 10.3 | 2754 | 10 | 1981 | 41.8 |
| Total | 21,340 | 20,791 | 20,220 | 19,618 | 7569 | 27.8 |
© 2017 by the authors. Licensee MDPI, Basel, Switzerland. This article is an open access article distributed under the terms and conditions of the Creative Commons Attribution (CC BY) license (http://creativecommons.org/licenses/by/4.0/).
Share and Cite
Da Ponte, E.; Mack, B.; Wohlfart, C.; Rodas, O.; Fleckenstein, M.; Oppelt, N.; Dech, S.; Kuenzer, C. Assessing Forest Cover Dynamics and Forest Perception in the Atlantic Forest of Paraguay, Combining Remote Sensing and Household Level Data. Forests 2017, 8, 389. https://doi.org/10.3390/f8100389
Da Ponte E, Mack B, Wohlfart C, Rodas O, Fleckenstein M, Oppelt N, Dech S, Kuenzer C. Assessing Forest Cover Dynamics and Forest Perception in the Atlantic Forest of Paraguay, Combining Remote Sensing and Household Level Data. Forests. 2017; 8(10):389. https://doi.org/10.3390/f8100389
Chicago/Turabian StyleDa Ponte, Emmanuel, Benjamin Mack, Christian Wohlfart, Oscar Rodas, Martina Fleckenstein, Natascha Oppelt, Stefan Dech, and Claudia Kuenzer. 2017. "Assessing Forest Cover Dynamics and Forest Perception in the Atlantic Forest of Paraguay, Combining Remote Sensing and Household Level Data" Forests 8, no. 10: 389. https://doi.org/10.3390/f8100389