Ecosystem Service Supply and Capacity on U.S. Family Forestlands


1
Family Forest Research Center, University of Massachusetts Amherst, Amherst, MA 01003, USA
2
USDA Forest Service, Northern Research Station, Amherst, MA 01003, USA
*
Author to whom correspondence should be addressed.
Forests 2017, 8(10), 395; https://doi.org/10.3390/f8100395
Submission received: 15 September 2017
/
Revised: 11 October 2017
/
Accepted: 14 October 2017
/
Published: 17 October 2017
Abstract
:Individuals and families collectively own more than 118 million ha of forestland in the USA. Using data from the USDA Forest Service’s National Woodland Owners Survey (NWOS), we characterize ecosystem services being produced on family forests as well as the beneficiaries who enjoy them. Approximately half of family forest owners provide one or more provisioning services. With the exception of logs, the provisioning services provided by the majority of owners are enjoyed directly by owners or their close associates (i.e., family, friends, and neighbors). Similarly, while more than half of family forest owners have provided recreational opportunities, a cultural service, to their close associates, fewer than 6% of owners have sold or provided recreational services to the general public. Regulating and supporting services are linked to the maintenance of long-term forest cover. Greater than 80% of family forest owners desire to maintain the forested condition of their land, whereas a much smaller percentage of these owners have entered into conservation easements or have collected money for conservation purposes. In addition, many owners have engaged in activities expected to increase the future capacity of their land to provide multiple ecosystem services, both excludable and non-excludable.
1. Introduction
Forests and woodlands owned by individuals, families, and trusts (hereafter called family forests) constitute the largest group of forest ownerships in the United States [1]. Of the 330 million ha of forest and woodland across the U.S., 118 million ha (35.6%) qualify as family forests (Figure 1). Approximately 4 million family forest ownerships (FFOs) each own 4 or more ha of forest or woodland, with collective holdings of nearly 109 million ha (32.9% of all forests and woodlands and 92.5% of all family forests). By and large, family forests are concentrated in the eastern U.S.A., with smaller area in the western regions—where public and corporate ownership is predominant.
FFOs own land for a multitude of reasons, with non-consumptive and amenity values such as beauty, privacy, and stewardship of nature being especially important; comparatively few FFOs own land for the express purpose of producing timber, firewood, or other forest products [2]. Regardless of FFOs’ reasons for owning their land, family forests are a valuable source of ecosystem services to society. Fisher et al. [3] define ecosystem services as “…the aspects of ecosystems utilized (actively or passively) to produce human well-being.” Ecosystem services emerge from natural capital and interact with other forms of capital—social, built, and human—to provide benefits to individuals and communities [4,5]. There are many ways of defining and categorizing ecosystem services [6]. One useful typology is the one established in the Millennium Ecosystem Assessment [7]; in that publication, services are categorized as provisioning services, the production of useful materials such as food and building materials; regulating services, which maintain and stabilize water flows, climate, and other aspects of the human environment; or cultural services that provide recreational, aesthetic, or spiritual benefits. A fourth type, supporting services (sometimes called intermediate or indirect services) includes those ecological functions which underpin the other three categories—functions such as soil formation, primary productivity, pollination, and nutrient cycling. Within this conceptualization, biodiversity itself does not constitute an ecosystem service—rather, it is the foundational resource upon which all ecosystem services are ultimately based [8].
Ecosystem services are often measured or reported in terms of actual or estimated market value [9], but services need not necessarily be distributed through formal market channels—as long as they directly or indirectly contribute to the well-being of one or more beneficiaries. Regardless of whether economic or biophysical units are used, services are often quantified in terms of demand, supply, and capacity [10,11,12]. The demand for ecosystem services refers to the quantity of potential services demanded by beneficiaries—for example, beneficiaries’ demand for dry tons of woody biomass or gallons of fresh water. Supply refers to the actual flow of services from an ecosystem to one or more beneficiaries. In contrast, capacity refers to the systems’ potential to provide services regardless of whether or not beneficiaries exist to actually take advantage of those services. In other words, an ecosystem may have an inherent capacity to produce a specific quantity of timber or volume of clean water, even if demand (and consequently supply) of those services is non-existent.
All ecosystem services can be located on spectra defined by the “rivalness” and “excludability” of those services [3,6,13]. Rival goods and services are those which cannot easily be shared among multiple beneficiaries; they are “used up” or bound to a particular beneficiary in the process of improving that person’s wellbeing (e.g., wild foods). Non-rival services, on the other hand, can benefit multiple beneficiaries simultaneously without significant diminishment. Congestible services are services which are non-rival in normal conditions, but can become rival when ecosystem capacity is low or when use becomes intense (e.g., hiking is usually a non-rival benefit, but can become rival at high intensity when trails become eroded or when crowded conditions reduce the value of the experience). To contrast with rivalness, services can be excludable or non-excludable. If potential beneficiaries of a service can easily be restricted (i.e., “excluded”) from the enjoyment of that service, the service is considered to be excludable. Since it is easy in principal (although not always in practice) for owners and managers to restrict access to land and harvesting of materials, many provisioning services (e.g., timber and non-timber forest products) and cultural services (e.g., recreation) are by nature excludable. On the other hand, many regulating services (e.g., climate stabilization), support services (e.g., pollination), and some cultural services (e.g., the ‘existence value’ of iconic species) are usually non-excludable. The fact that they are difficult to restrict to specific beneficiaries is one of the key reasons why non-excludable services are difficult to sell in the conventional marketplace. However, policy innovations can provide means of marketing these services to private individuals (e.g., carbon markets) or selling services to the public sector (e.g., conservation payments). Costanza [6] observed that, whereas rivalness is largely a function of service demand, excludability is chiefly determined by the cultural, legal, and technological constraints on service supply—in other words, by the extent to which land owners and managers are able and willing to exclude potential beneficiaries.
In this paper, we analyze data from the National Woodland Owners Survey (NWOS) pertaining to the role of FFOs in supplying valuable ecosystem services in the USA. In Parts 1 and 2 of our discussion, we look at the services supplied by family forests as well as the beneficiaries of those services. Without having information on the magnitude of service demand, we cannot unambiguously determine the rivalness of services (i.e., congestibility); instead, we frame our discussion around the excludability of services as supplied by FFOs. In part 3, we look at the management behaviors of FFOs that are likely to affect the capacity—the potential—of their forests and woodlands to supply ecosystem services in the future. Understanding what ecosystem services are provided by family forests and who enjoys those services is essential to the design of effective and appropriate assistance programs, conservation strategies, and overall forest policy.
2. Materials and Methods
Our data come from the USDA Forest Service’s National Woodland Owner Survey (NWOS). Part of the USDA Forest Inventory and Analysis (FIA) program, the NWOS is a longitudinal survey of private forest and woodland owners. It has been developed to improve understanding of owner demographics as well as owners’ attitudes, motivations, and behaviors.
The NWOS is conducted on a recurring basis. The most recent iteration of the survey was implemented over 2011–2013. Overall cooperation rate was 52%. The sample frame included all private ownerships (a group of one or more landowners jointly owning one or more wooded parcels) owning at least 0.4 ha of forest or woodland. Potential respondents were selected using the same stratified (by state) random, probability-proportional-to-size survey design developed for the FIA biophysical inventory [14]. In this design, individual states are divided into approximately 2428-ha hexagons and a random point is selected within each hexagon. Using a combination of remote sensing and field observations, it is determined whether or not plots located at each of the randomly-selected points fall on forested land. If they do, ownership information for plot center is recorded. This ownership information constituted the base sample of the NWOS. Where the target sample size of 250 respondents per state was not reached using the base sample, the sample was supplemented—where possible—using a similar methodology and ownership information derived from publically-available GIS products. Approval for human subjects research was obtained through the University of Massachusetts Amherst Institutional Review Board (No. 2011-1070) and the federal Office of Management and Budget (No. 0596-0078). Additional information on the 2011–2013 NWOS methods (including estimation) and non-response bias assessment are available in Butler et al. [2,15]. Tables containing the complete set of estimated data used in this article have been published and are freely available as Butler et al. [1].
In this article, we focus on FFOs owning 4 or more ha (n = 8756)—a subset of the complete sample frame (all private forest landowners owning at least 0.4 ha). Analyses of NWOS data have tended to exclude FFOs owning less than 4 ha because smaller parcels commonly consist of wooded residential lots and are rarely suitable for traditional forestry activities or programs [2]. We acknowledge, however, that small parcels may provide important cultural, regulating, and supporting services (as well as, for that matter, some provisioning services). We summarize responses to 12 of the 37 questions included in the NWOS survey. The selected questions pertain to the provision of multiple ecosystem services, the beneficiaries of those services, and landowner attitudes and behaviors relevant to understanding the capacity for future service production. We report our results in terms of the estimated number of ownerships, estimated acreage owned by those ownerships, and the proportion of total ownerships [15] at the national or regional level. Due to insufficient data, estimates do not include the states of Alaska, Nevada or Wyoming. These states represent less than 0.2% of all FFOs [1], however, so their exclusion is not expected to substantially affect national or regional-level estimates.
3. Results and Discussion
3.1. Excludable Benefits
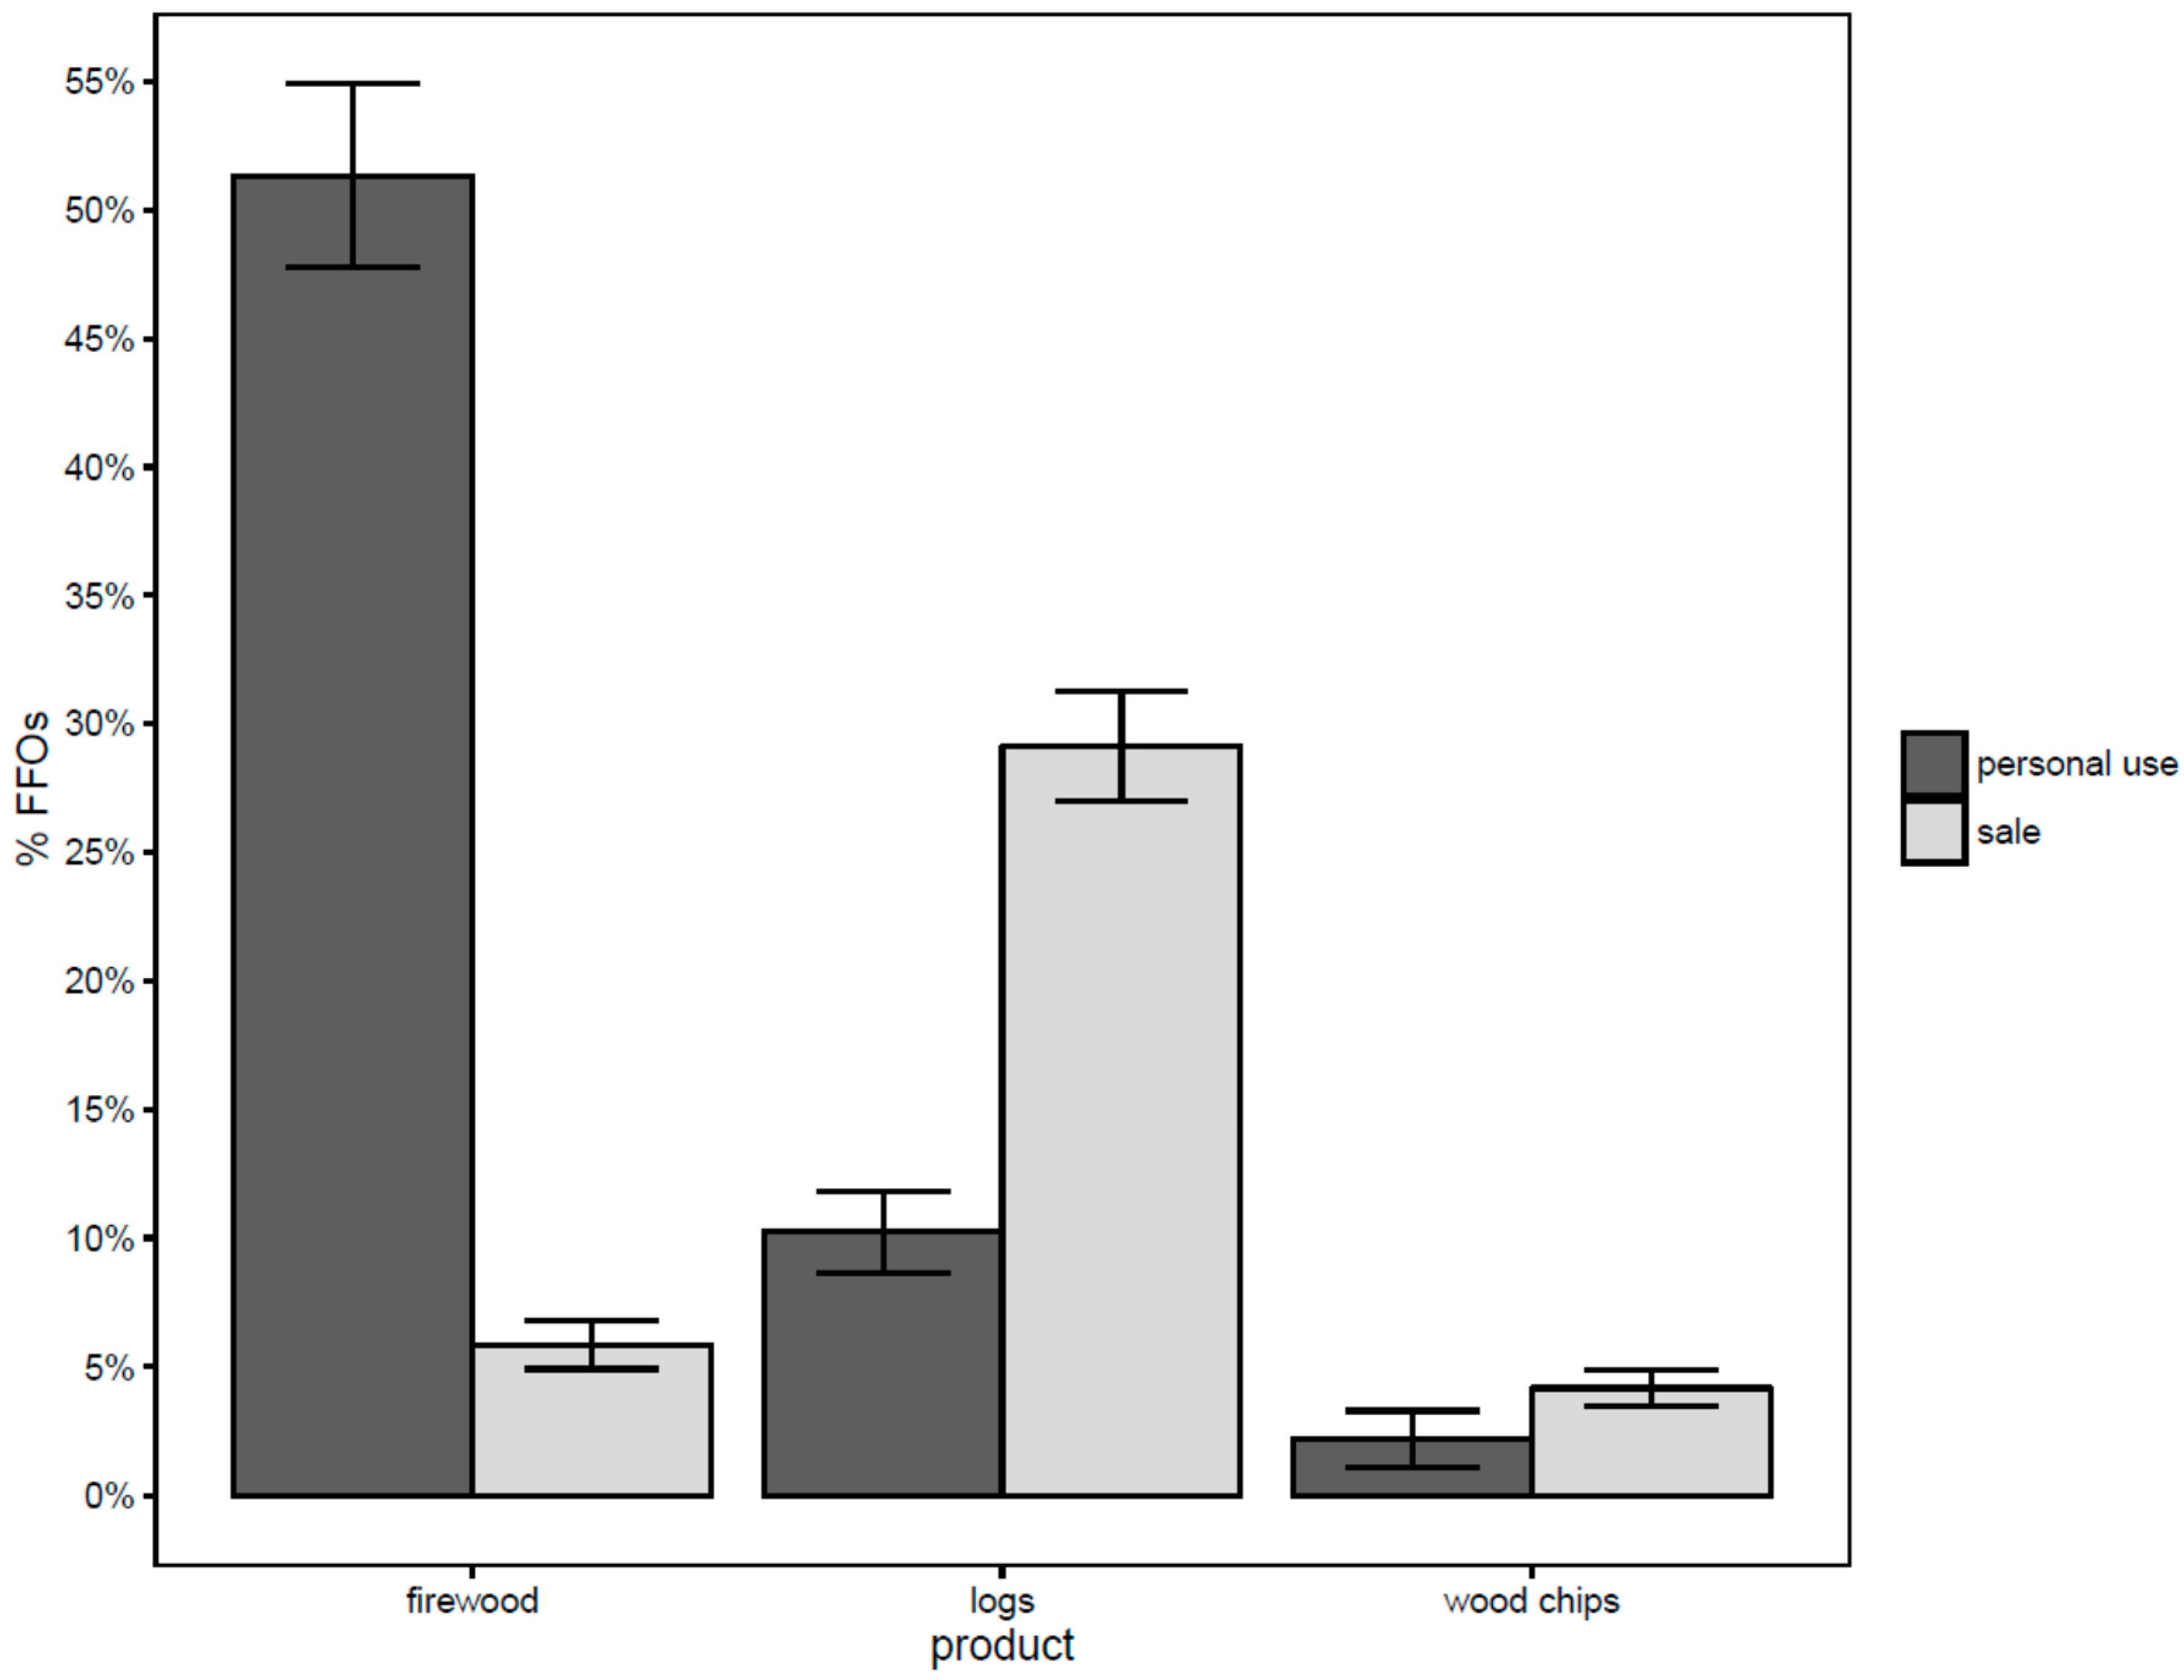
Provisioning services, including harvested goods, are among the most tangible and visible ecosystem services provided by forests and woodlands. FFOs commonly harvest multiple types of wood products and non-timber forest products (NTFP) for personal use or sale from their land. Of the two, the harvesting of wood products is more common. In fact, the provision of firewood is one of the most common ecosystem services provided by FFO lands. Out of an estimated total 4023 thousand FFOs (SE = 72.3 thousand FFOs) in the USA, collectively owning 107,438 thousand ha (SE = 490 thousand ha), slightly more than half (51.3%, SE = 1.8%) of FFOs harvest firewood for personal use, while only 5.8% (SE = 0.5%) produce firewood for sale (Figure 2). It is important to note here that we distinguish between personal use and sale in order to better understand the beneficiaries of services; where services are sold through traditional markets, benefits accrue to widely scattered individuals across larger (in some cases, global) spheres. Ecosystem services do not need to be sold to provide benefits and, in fact, the relationships among ecosystem services, revenues, and welfare vary from case to case and service to service. In contrast to firewood, which primarily benefits landowners themselves, logs and wood chips are generally produced for the marketplace. Nearly a third (29.1%, SE = 1.1%) and 4.2% (SE = 0.4%) of FFOs engage in the production and sale of logs and wood chips, respectively. Fewer owners produced logs (10.2%, SE = 0.8%) and wood chips (2.2%, SE = 0.5%) for personal use.
Fewer landowners harvest NTFPs (Figure 3) than traditional wood products. The largest proportion have collected products for personal use, especially edibles (25.4%, SE = 1.2%), landscaping materials (12.5%, SE = 0.9%), and decorative goods (12.1%, SE = 0.9%). Fewer than 1.2% of landowners harvest these products for sale. The collection of medicinal products was rare among FFOs either for personal use (1.9%, SE = 0.2%) or for sale (0.7%, SE = 0.1%). The small proportion of landowners producing NTFPs for sale suggests that enjoyment of NTFPs is largely a privilege limited to landowners and their close associates. Alternatively, most of the demand may be satisfied by other lands (public, corporate, non-forest, etc.), or only a small area, owned by a few private owners, is necessary to saturate market demand.
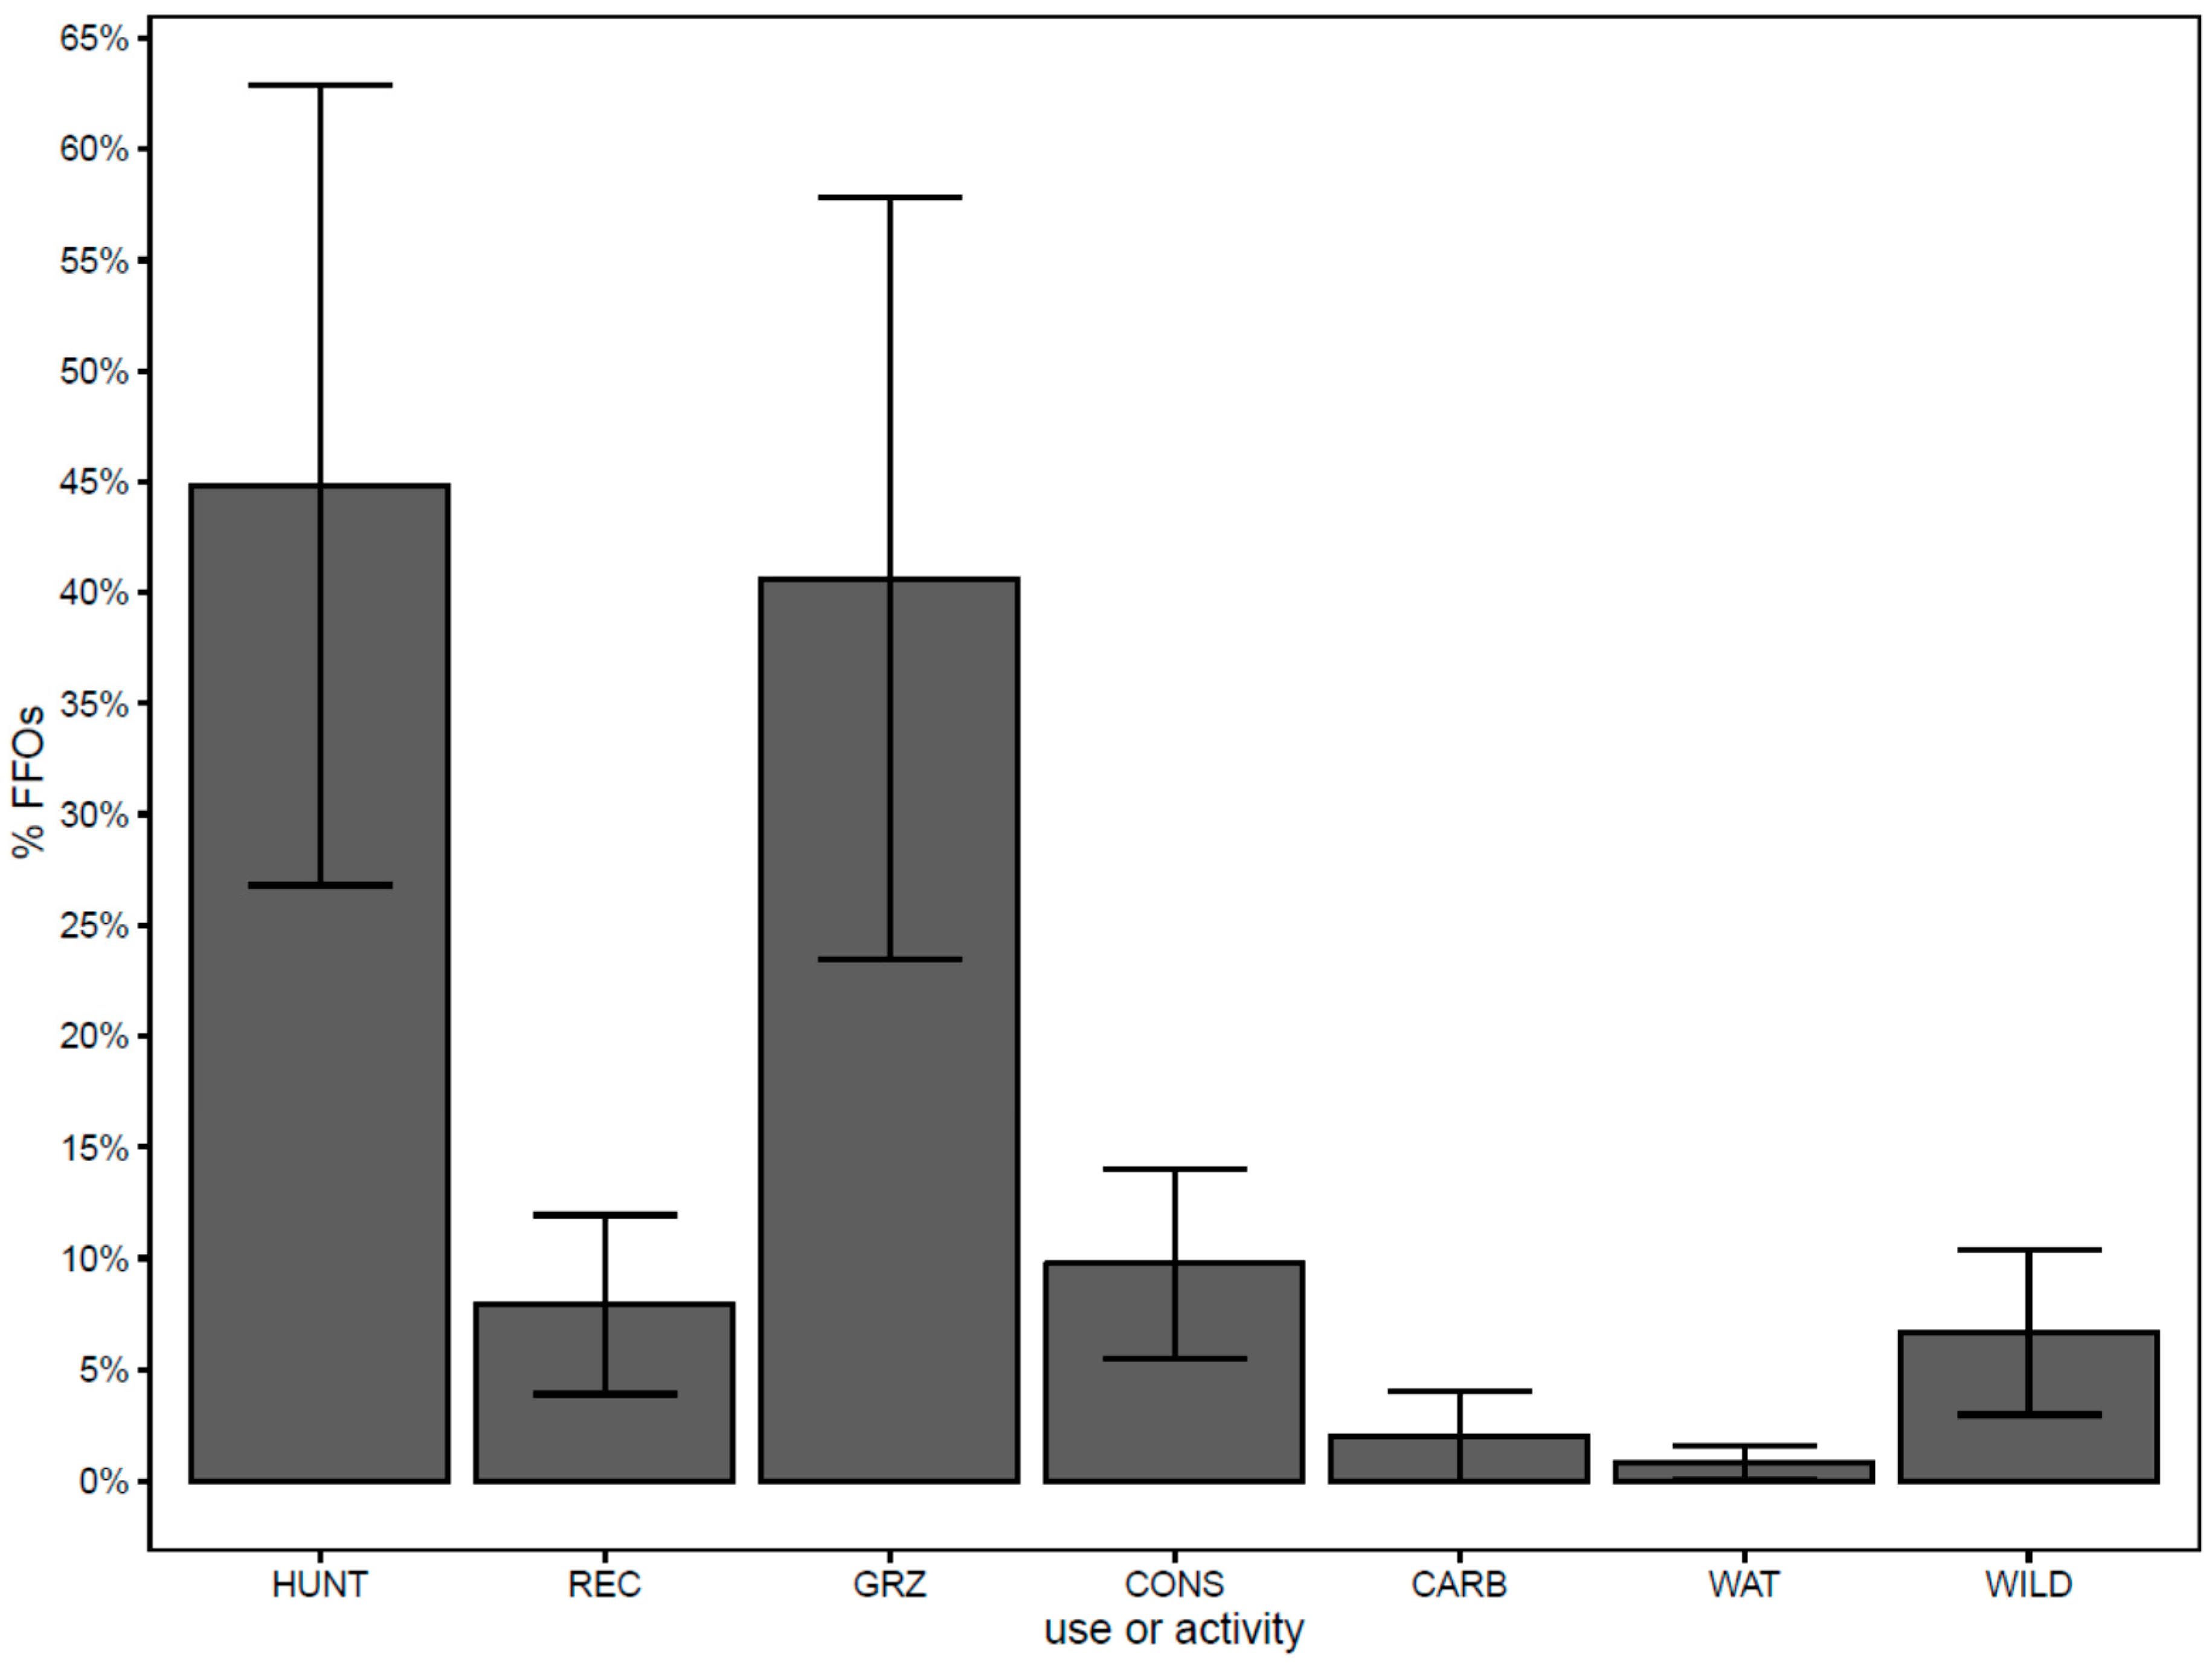
Animal fodder is another important NTFP provided by family forests. Twenty percent (SE = 1.0%) of FFOs, or 774 thousand ownerships (SE = 38 thousand ownerships), grazed their woods in the 5 years prior to the survey. This includes those owners who collected money for grazing privileges and those who enjoyed these privileges themselves (i.e., ranchers and livestock producers) or allowed others to enjoy them without formally charging a fee (e.g., neighbors, friends, family). Of the 541 thousand FFOs (SE = 29 thousand FFOs) who have leased or otherwise generated revenue (other than from logging) from their land at some point during their land tenure, 40.6% (SE = 8.6%) leased their land for grazing or pasturage (Figure 4). This equates to less than one third the number of FFOs who have actually grazed their woodlands. Therefore, it seems likely that this ecosystem service, like provision of firewood and NTFPs, primarily benefits landowners and their close associates. Regardless of who enjoys grazing privileges, however, production of fodder can be thought of as an intermediate (or indirect) service—a supporting service—underpinning a larger agricultural system that produces animal products such as milk, meat, fiber or recreational animals—products that ultimately provide the final (or direct) benefits to human beneficiaries. In contrast to the fodder itself, these final products are much more likely to be sold through formal market mechanisms and, consequently, to reach beneficiaries well outside the sphere of landowners and their immediate associates.
Although less tangible than provisioning services, cultural services in their many forms make clear and valuable contributions to the health and well-being of many people [16,17]. Many cultural services (such as spiritual, heritage, and those providing ‘existence value’) are generally non-excludable. Two important exceptions are recreation and ecotourism. These services are among the most commonly studied and quantified of cultural services [18], and are often included in trade-off analyses or other analyses of multiple services (e.g., [19,20,21]). In fact, it is not uncommon for recreational services to be the sole representative of cultural services in these analyses (e.g., [22]).
FFOs responding to the NWOS reported a wide variety of recreational activities occurring on their land in the five years prior to the survey (Figure 5). The most widespread of these was hunting; 78.8% (SE = 2.6%) of FFOs allow hunting on their land. This represents more landowners providing this service than any other individual ecosystem service that we assessed. Hiking/walking (63.6%, SE = 2.4%), off-roading (35.4%, SE = 1.6%), and fishing (24.2% SE = 1.1%) were also associated with large numbers of owners. Other forms of recreational services were each individually associated with less than 10% of owners.
The benefits of recreation are excludable, both directly through the enforcement of property laws and indirectly by the regulation of access to land. We found that recreational services on family forests were primarily enjoyed by owners (66.7%, SE = 2.0%) and their close associates—children (56.7%, SE = 1.8%), other family (43.2%, SE = 1.5%), and friends (52.9%, SE = 1.7%). Fewer owners provided recreational services to their neighbors (32.6%, SE = 1.3%). Even fewer provided recreational services to the general public, whether that use was free (5.2%, SE = 0.4) or whether landowners charged for the opportunity (1.2%, SE = 0.2%). Fees were more commonly charged for hunting than for other types of recreation (Figure 4). Of those FFOs who had leased land or collected money, 44.8% of landowners (SE = 9.0%) collected money from hunters sometime during their land tenure as compared to 7.9% of landowners (SE = 2.0%) who collected fees for other types of recreation (Figure 4). In contrast to owners providing recreational services to the general public, 58.7% of landowners (SE = 1.8%), collectively owning 76,605 thousand ha (SE = 753) have posted their land to one or more activities, most commonly trespassing (91.3% of landowners who post, SE = 4.6%), hunting (72.9%, SE = 3.7%) and use of motorized vehicles (42.4%, SE = 2.5%).
The provision of excludable services varied little among regions (Figure 6). In general, provision was associated with the greatest proportion of owners in the North, followed by the Rocky Mountains, the Pacific Coast, and the South (see [23] for specific regional boundaries). Exceptions were free public recreation, which was associated with the greatest proportion of owners in the Rocky Mountains (8.7%, SE = 2.7%); sold wood products, which was highest in the South (19.8%, SE = 1.5%); and grazing, which was associated with the fewest owners in the North (12.8%, SE = 0.9%).
3.2. Non-Excludable Benefits
Many non-excludable services are supporting and regulating services [7] that are challenging to quantify—or sometimes even to identify. Many non-excludable services (e.g., water regulation, carbon regulation) are provided to some extent on all forested properties, regardless of management [24]. In fact, many Payments-for-Ecosystem-Services programs are based entirely on the conservation status of enrolled lands, without any attempts made to assess ecosystem dynamics or service supply on individual parcels enrolled in these programs [25]. To understand whether family forests will continue to provide non-excludable ecosystems services into the future depends in large part on understanding whether or not (and for how long) this land will remain forested. Currently, an estimated 85.6% of FFOs (SE = 2.2%), collectively owning 86,349 thousand ha (SE = 1045 thousand ha), agree or strongly agree with the statement “I want my wooded land to stay wooded”. Unfortunately, intentions are not necessarily good predictors of landowner actions (e.g., [26]) and only small proportions of landowners have taken advantage of formal programs aimed at retaining forested land. These programs include cost-share or assistance programs (8.2% of FFOs, SE = 0.4%) and forest tax programs (15.2%, SE = 0.8%). Even fewer FFOs have leased land or collected payments for conservation. Of those FFOs who have leased land or collected money, only 9.8% (SE = 2.1%), owning 5760 thousand ha (SE = 421) have collected money for land conservation (Figure 4). Conservation easements are arguably the most permanent and most enforceable of the mechanisms for keeping forest forested, but they are also the least commonly adopted. Only 2.8% (SE = 0.3%) of FFOs, collectively owning 4831 thousand ha (SE = 341 ha), have enrolled some or all of their land in a conservation easement. Of those who have not taken this step, only a small percentage (2.0%, SE = 0.3%) stated that they are ‘likely’ or ‘extremely likely’ to obtain an easement in the future, whereas 63.9% are ‘extremely unlikely’ to do so (SE = 2.4%). It is important to note here that is difficult (if not impossible) to estimate the extent to which any of these programs will result in long-term, let alone permanent, maintenance of forest cover. Changes in laws and policies, natural disturbance, and changes in climate regimes all have significant potential to result in changes in forest cover despite the existence of formal protections. Furthermore, even if forest cover is maintained, the actual provision of services will vary with changes in forest structure and composition as well as with human values (i.e., demand) and technology (e.g., [11]).
FFOs have reported provision of some specific non-excludable services. One of these is carbon storage/sequestration—sometimes called climate or greenhouse gas regulation (or mitigation). Based on the results of the NWOS, an estimated 2.0% (SE = 1.0%) of FFOs who have leased land or collected money have been paid for providing this service on their land (Figure 4). This is likely to be a tiny fraction of the area that is actually providing the service, however. Although belowground emissions may render some forests net GHG sources (e.g., [27]), all forests store carbon to some extent in aboveground and belowground biomass and many—if not most—are likely to be net GHG sinks. Moreover, more than half of FFOs produce timber and/or bioenergy feedstocks, i.e., firewood and wood chips (Figure 2). Production of wood products—especially long-lived wood products—can significantly improve the potential for forested land to positively impact climate regulation services, by providing low-carbon substitutes for fossil fuels and other high-carbon materials [24,28].
Water regulation services—both regulation of water quantity and water quality—is another category of ecosystem benefits that is rarely monetized or quantified. Although forests and woodlands are important sources of these services, the relationship between service provision and forest structure, composition, or management is relatively weak and difficult to unravel [29]. Of those FFOs who have leased land or collected money, 0.8% of landowners (SE = 0.4%) have leased land or collected money for protection of public water supply (Figure 4).
By harboring populations of native bees and other pollinators, forests and other natural and semi-natural ecosystems can provide important pollination regulation services to farmers [30,31,32]. More than a third (32.1%, SE = 1.3%) of FFOs own a farm within 1.6 km of their woodlands. If they are growing insect-pollinated crops, these particular owners may be receiving benefits from the pollination regulation services originating on their own land. Unfortunately, we have no information on how many additional beneficiaries may also be benefitting from this service. It seems reasonable to assume, however, that, in general, FFOs do not own the majority of farmland in the vicinity of their forests. If true, this service—unlike many of the other excludable services discussed above—is likely to provide most benefit to people other than woodland landowners and their close associates.
Cultural services include a wide variety of valuable non-excludable services; the Millennium Ecosystem Assessment [7] specifically lists “…cultural diversity, spiritual and religious values, knowledge systems, educational values, inspiration, aesthetic values, social relations, sense of place, [and] cultural heritage values…” These are largely non-excludable and benefit a wide sphere beyond landowners and those with direct access to land. Unfortunately, many—if not most—of these services are given little attention in the literature [16]. The NWOS does not include any questions that specifically address the production of non-recreational cultural services. However, FFOs acknowledge a number of additional cultural services as important reasons for why they own forested land, services such as aesthetics (beauty/scenery) and privacy; these reasons are consistently identified as being of greater importance than timber production or revenue generation [2]. Consequently, policies and programs intended to improve flows of provisioning (e.g., wood production), regulating (e.g., carbon sequestration, watershed protection), and supporting services (e.g., wildlife habitat) may result in unintended (and unmeasured) tradeoffs between cultural services and other types of benefits. For example, prior research has demonstrated that government programs (and social constructs more generally) can conflict with cultural values such as community or personal identity (e.g., [33,34]). Tradeoffs such as these not only carry the potential to degrade many of the important human benefits provided by cultural services (such as those associated with identity values), but they may also lead to reduced participation in government programs when landowners recognize such tradeoffs (even if policymakers do not) and implicitly value cultural benefits more highly than program objectives. Similarly, since most non-excludable cultural services are currently non-marketable, economic incentives (like government programs), may favor those ecosystem services with revenue potential over cultural services that resist monetization. Future research would benefit by exploring the relationship between cultural values, economic incentives, and participation in government programs aimed at increasing service flows. Currently, we cannot say more about the supply of non-excludable cultural services, the benefits they provide, or the beneficiaries who enjoy them.
3.3. Ecosystem Service Capacity
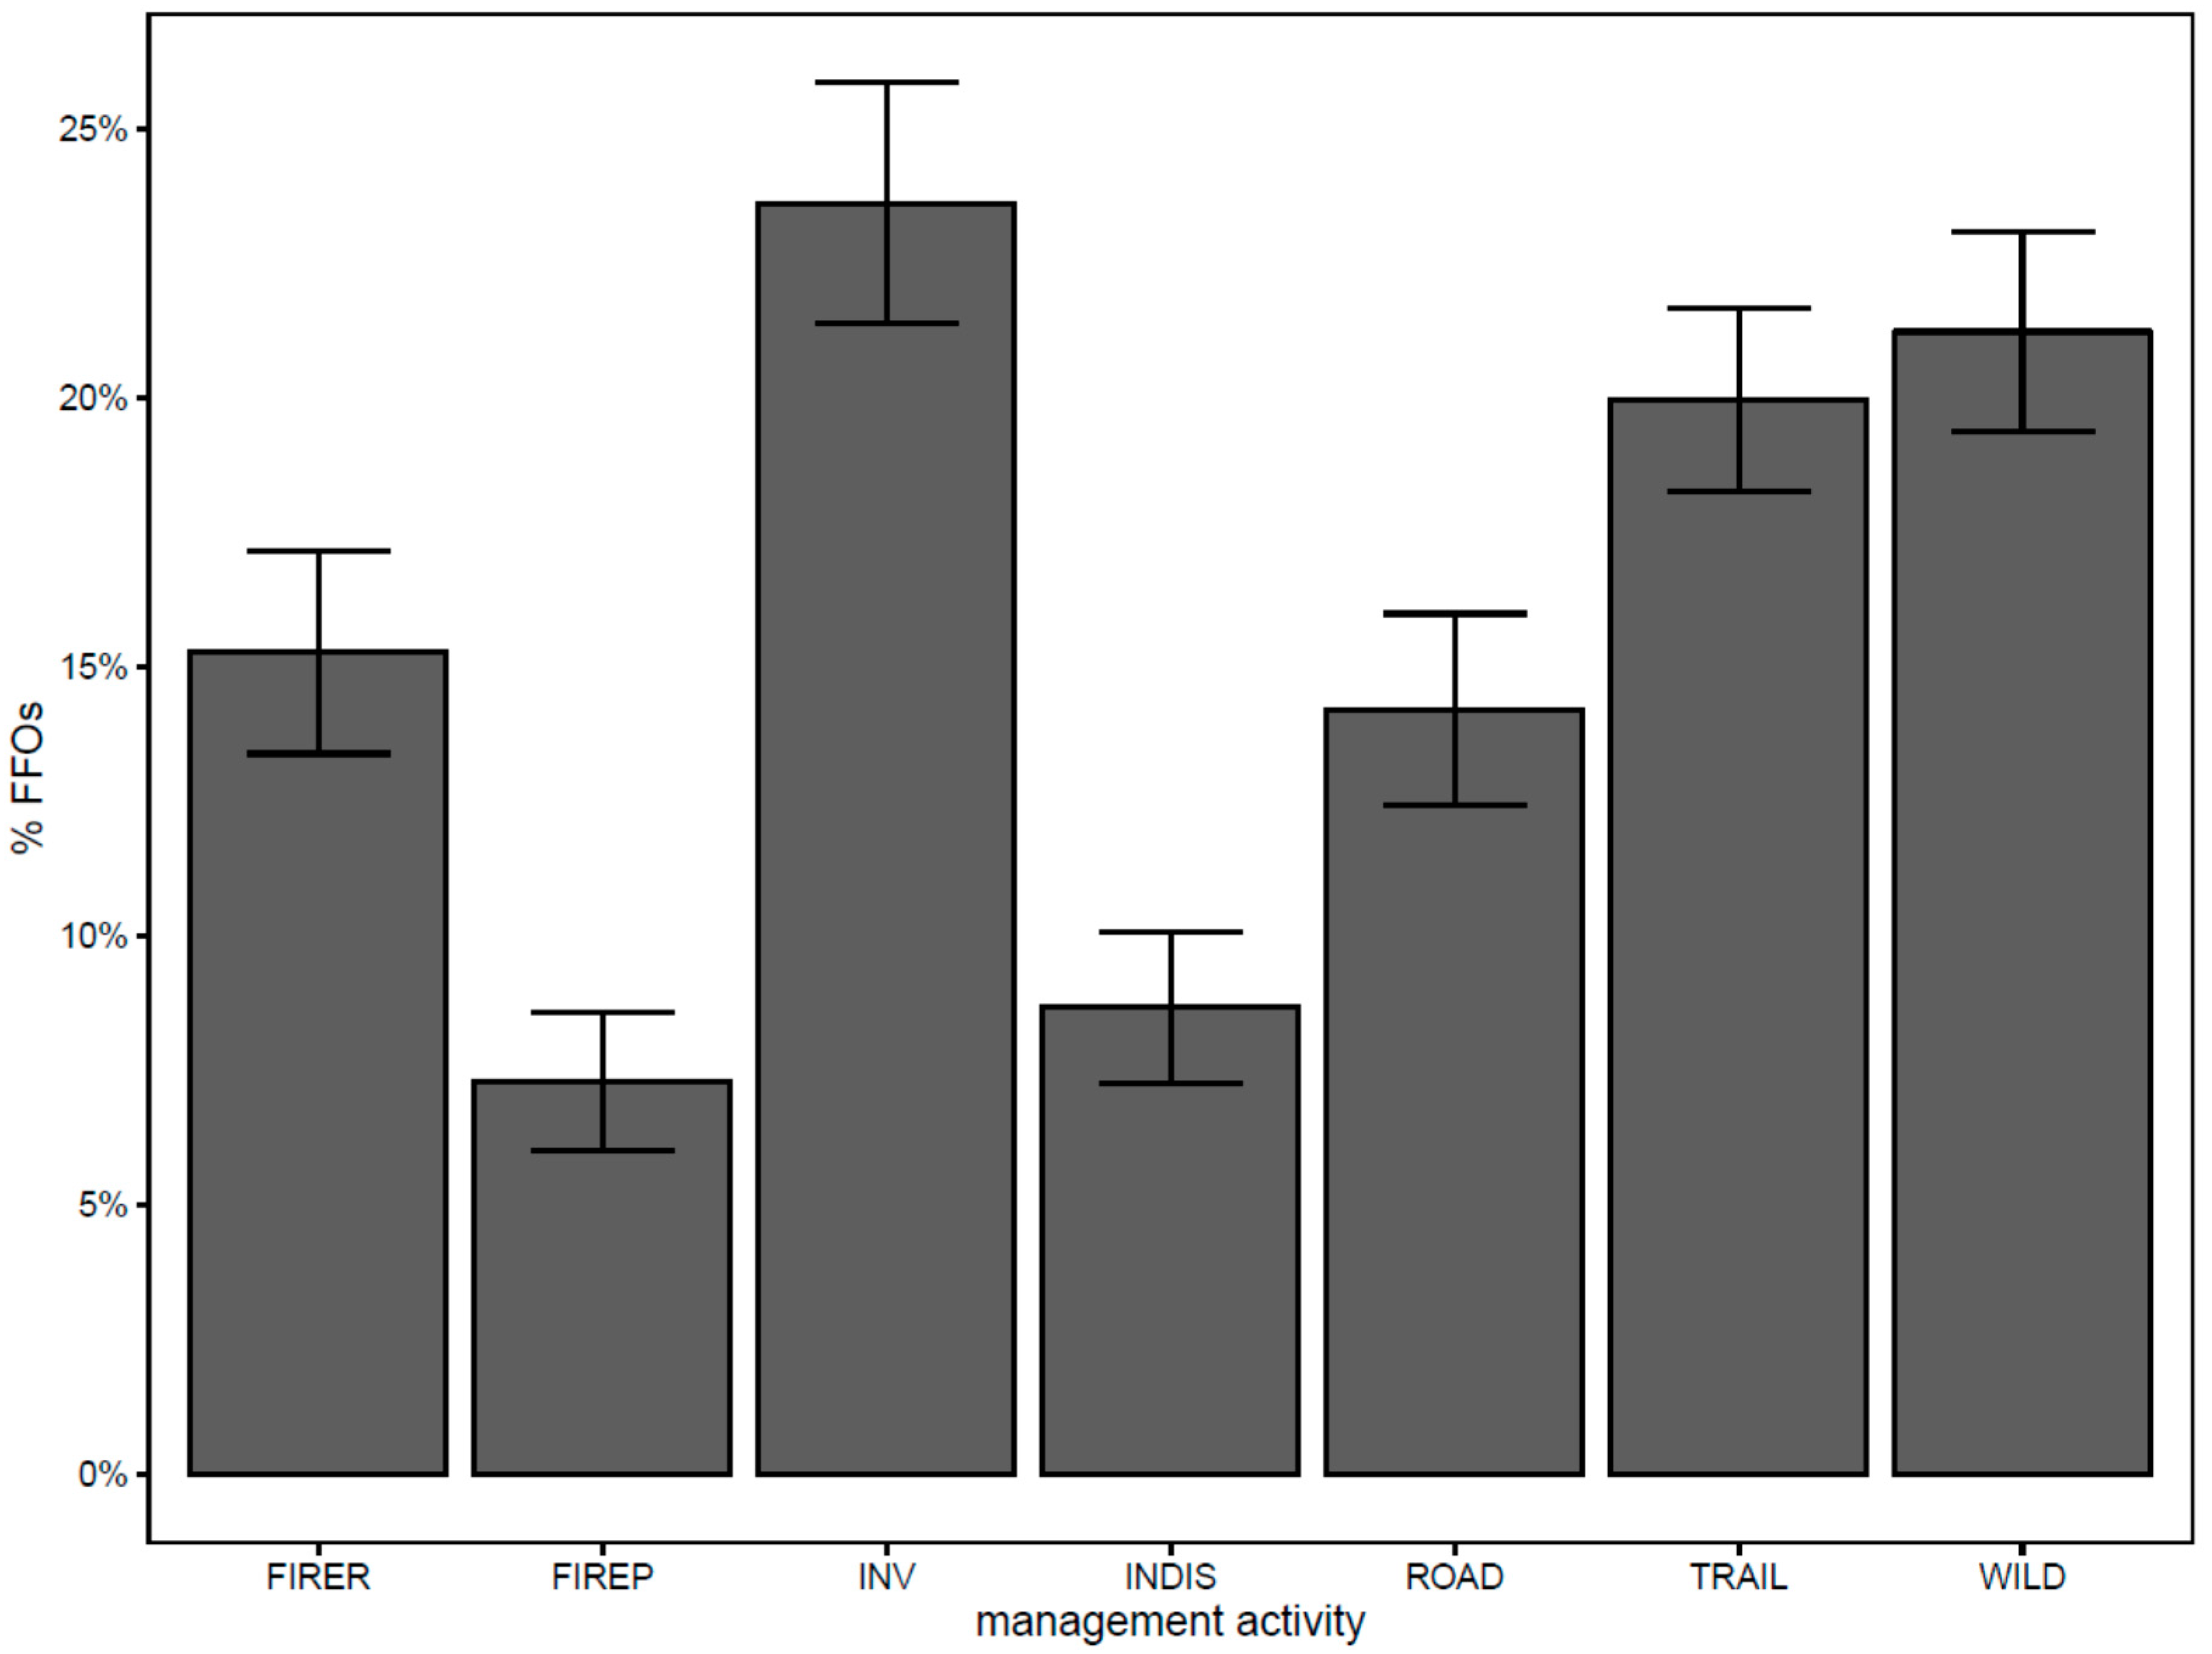
Many FFOs report undertaking activities intended or expected to improve the capacity of the land to provide multiple benefits, excludable and non-excludable alike. Such activities will not necessarily increase flows of benefits to beneficiaries, but they do increase the likelihood that services will be maintained or improved in the future. Almost one third of FFOs have taken part in at least one such activity in the past 5 years (Figure 7), including removing invasive plants (23.6%, SE = 1.1%), reducing fire risk (15.3%, SE = 0.9%), mitigating insects/diseases (8.7%, SE = 0.7%), and/or doing controlled burns (7.3%, SE = 0.6%). All of these activities are intended to modify ecosystem structure, composition, or function (i.e., natural capital) to increase flows of provisioning, cultural, or regulating services. These services include better or more certain yields of wood products and NTFPs, improved aesthetics and recreational opportunities, climate regulation, fire regulation (i.e., human safety), water regulation, and cultural services associated with stewardship [35]. Additionally, many FFOs engaged in actions to improve built capital—such as trail (20.0%, SE = 0.8%) and road maintenance (14.2%, SE = 0.9%). Improvements in built capital (i.e., infrastructure) facilitate benefit flows from harvesting of wood products and NTFPs, recreation, and other ecosystem services.
In addition to other capacity-building activities, many landowners seek to improve wildlife habitat or promote biodiversity. In the past 5 years, 21.2% of FFOs (SE = 0.9%) engaged in activities aimed at improving wildlife habitat (Figure 7). Most landowners are not compensated for these activities. Of those FFOs who have leased land or collected money, only 6.7% (SE = 1.8%) have leased land for wildlife habitat or biodiversity (Figure 4). It is important to note the distinction here between wildlife habitat and biodiversity. Improving habitat for specific wildlife species may increase the forest’s capacity for provisioning services (e.g., meat from game animals) or cultural services (e.g., bird watching) that depend on those specific species. Improving overall biodiversity, on the other hand, is thought by some to improve the global capacity of an ecosystem to sustain most—if not all—ecosystem services over time [7]. This is not necessarily the case, however. Although all ecosystem services emerge from and depend upon natural capital, biodiversity per se seems to correlate positively or weakly with some ecosystem services, and negatively with others [36,37]. The relationship between biodiversity and service capacity is an important area for continued research.
Just as some activities improve service capacity, some activities carry the potential to decrease capacity. Tradeoffs between ecosystem services (supply or capacity) occur when conditions suitable (or necessary) for one service are unsuitable for another [38]. For example, the provision of bioenergy feedstocks (i.e., fuelwood) may result in short- to medium-term tradeoffs with water regulation services and GHG regulation [24,39,40]. Similar tradeoffs are likely to emerge between timber management, grazing and high-intensity recreation on the one hand and many other supporting and regulating services on the other. Understanding the relationships between ecosystem services is necessary in order to understand when management activities undertaken by FFOs and services on family forests are likely to reduce provision of other services on those lands and across the larger landscape.
4. Conclusions
Family forest ownerships own more than 35% of the forest estate in the United States, more than 118 million ha. More than half of FFOs produced one or more discrete, identifiable ecosystem services. Some of these services are sold through formal markets and some (whether sold or not) provide benefits to a wide range of beneficiaries at local, regional, and even global scales. For many ecosystem services, however (particularly recreation and NTFPs), most owners produce benefits associated with a much smaller beneficiary sphere consisting of landowners along with their families, friends and close associates.
The NWOS provides a broad insight into ecosystem service supply and capacity on family forests through the self-reported attitudes and behaviors of FFOs. It allows us to estimate the number of owners involved in the production of multiple services. In order to quantify service supply and estimate actual service flows, future research will need to look at the biophysical characteristics of forested lands, as well as beneficiary demand for those services.
Many ecosystem services—particularly non-excludable supporting and regulating services—are difficult to identify from self-reported attitudes and behaviors. In some cases, low-end estimates can be made based on landowners’ enrollment in conservation programs or Payments-For-Ecosystem-Services schemes or cases where services were sold through traditional markets. Most of these services are not sold, however, and enrollment in conservation or PES programs is relatively uncommon. We know that many of these services (e.g., aesthetics, privacy) are important to landowners—and probably to other beneficiaries as well—but we remain unable to make any reasonable estimates of service supply or capacity. Fortunately, many supporting and regulating services are relatively elastic in terms of ecosystem structure and management and, as such, are produced widely across most family forests. The challenge here is to understand whether these forests will remain forested in the future. To that end, more research is needed to better characterize FFO intentions toward their lands and—importantly—to better understand the complex relationship between landowner intentions and behaviors, in order to predict the extent to which family forests—and the ecosystem services they provide—will be conserved for future generations.
Acknowledgments
This work was funded through the USDA Forest Service, Northern Research Station, Forestry Inventory and Analysis (Agreement No. 16-JV-11242305-041).
Author Contributions
J.C. and B.B. conceived and designed the analysis; J.C. and B.B. analyzed the data; J.C. wrote the paper.
Conflicts of Interest
The authors declare no conflicts of interest. The funding sponsors had no role in the design of the study; in the collection, analyses, or interpretation of data; in the writing of the manuscript, or in the decision to publish the results.
References
- Butler, B.J.; Hewes, J.H.; Dickinson, B.J.; Andrejczyk, K.; Butler, S.M.; Markowski-Lindsay, M. USDA Forest Service National Woodland Owner Survey: National, Regional, and State Statistics for Family Forest and Woodland Ownerships with 10+ Acres, 2011–2013, Res. Bull. NRS-99; U.S. Department of Agriculture, Forest Service, Northern Research Station: Newtown Square, PA, USA, 2016.
- Butler, B.J.; Hewes, J.H.; Dickinson, B.J.; Andrejczyk, K.; Butler, S.M.; Markowski-Lindsay, M. Family forest ownerships of the United States, 2013: Findings from the U.S. Forest Service’s National Woodland Owner Survey. J. For. 2016, 114, 638–647. [Google Scholar] [CrossRef]
- Fisher, B.; Turner, R.K.; Morling, P. Defining and classifying ecosystem services for decision making. Ecol. Econ. 2009, 68, 643–653. [Google Scholar] [CrossRef]
- Boyd, J.; Banzhaf, S. What are ecosystem services? The need for standardized environmental accounting units. Ecol. Econ. 2007, 63, 616–626. [Google Scholar] [CrossRef]
- Costanza, R.; de Groot, R.; Sutton, P.; van der Ploeg, S.; Anderson, S.J.; Kubiszewski, I.; Farber, S.; Turner, R.K. Changes in the global value of ecosystem services. Glob. Environ. Chang. 2014, 26, 152–158. [Google Scholar] [CrossRef]
- Costanza, R. Ecosystem services: Multiple classification systems are needed. Biol. Conserv. 2008, 141, 350–352. [Google Scholar] [CrossRef]
- Millenium Ecosystem Assessment. Ecosystems and Human Well-Being: Synthesis; Island Press: Washington, DC, USA, 2005. [Google Scholar]
- Díaz, S.; Quétier, F.; Cáceres, D.M.; Trainor, S.F.; Pérez-Harguindeguy, N.; Bret-Harte, M.S.; Finegan, B.; Peña-Claros, M.; Poorter, L. Linking functional diversity and social actor strategies in a framework for interdisciplinary analysis of nature’s benefits to society. Proc. Natl. Acad. Sci. USA 2011, 108, 895–902. [Google Scholar] [CrossRef] [PubMed]
- Farber, S.C.; Costanza, R.; Wilson, M.A. Economic and ecological concepts for valuing ecosystem services. Ecol. Econ. 2002, 41, 375–392. [Google Scholar] [CrossRef]
- Bagstad, K.J.; Villa, F.; Batker, D.; Harrison-Cox, J.; Voigt, B.; Johnson, G.W. From theoretical to actual ecosystem services: Mapping beneficiaries and spatial flows in ecosystem service assessments. Ecol. Soc. 2014, 19, 64. [Google Scholar] [CrossRef]
- López-Hoffman, L.; Wiederholt, R.; Sansone, C.; Bagstad, K.J.; Cryan, P.; Diffendorfer, J.E.; Goldstein, J.; LaSharr, K.; Loomis, J.; McCracken, G.; et al. Market forces and technological substitutes cause fluctuations in the value of bat pest-control services for cotton. PLoS ONE 2014, 9, e87912. [Google Scholar] [CrossRef] [PubMed]
- Caputo, J.; Beier, C.M.; Luzadis, V.A.; Groffman, P.M. Integrating beneficiaries into assessment of ecosystem services from managed forests at the Hubbard Brook Experimental Forest, USA. For. Ecosyst. 2016, 3, 15. [Google Scholar] [CrossRef]
- Felipe-Lucia, M.R.; Martín-López, B.; Lavorel, S.; Berraquero-Díaz, L.; Escalera-Reyes, J.; Comín, F.A. Ecosystem services flows: Why stakeholders’ power relationships matter. PLoS ONE 2015, 10, 21. [Google Scholar] [CrossRef] [PubMed]
- Bechtold, W.A.; Patterson, P.L. The Enhanced Forest Inventory and Analysis Program—National Sampling Design and Estimation Procedures, GTR SRS-80; U.S. Department of Agriculture, Forest Service, Southern Research Station: Asheville, NC, USA, 2005.
- Butler, B.J.; Dickinson, B.J.; Hewes, J.H.; Butler, S.M.; Andrejczyk, K.; Markowski-Lindsay, M. USDA Forest Service, National Woodland Owner Survey 2011–2013: Design, Implementation, and Estimation Methods, GTR NRS-157; U.S. Department of Agriculture, Forest Service, Northern Research Station: Newtown Square, PA, USA, 2016.
- Daniel, T.C.; Muhar, A.; Arnberger, A.; Aznar, O.; Boyd, J.W.; Chan, K.M.A.; Costanza, R.; Elmqvist, T.; Flint, C.G.; Gobster, P.H.; et al. Contributions of cultural services to the ecosystem services agenda. Proc. Natl. Acad. Sci. USA 2012, 109, 8812–8819. [Google Scholar] [CrossRef] [PubMed]
- Blicharska, M.; Smithers, R.J.; Hedblom, M.; Hedenås, H.; Mikusiński, G.; Pedersen, E.; Sandström, P.; Svensson, J. Shades of grey challenge practical application of the cultural ecosystem services concept. Ecosyst. Serv. 2017, 23, 55–70. [Google Scholar] [CrossRef]
- Milcu, A.I.; Hanspach, J.; Abson, D.; Fischer, J. Cultural ecosystem services: A literature review and prospects for future research. Ecol. Soc. 2013, 18, 44. [Google Scholar] [CrossRef]
- Hendee, J.T.; Flint, C.G. Incorporating cultural ecosystem services into forest management strategies for private landowners: An Illinois case study. For. Sci. 2014, 60, 1172–1179. [Google Scholar] [CrossRef]
- Collier, M.J. Novel ecosystems and the emergence of cultural ecosystem services. Ecosyst. Serv. 2014, 9, 166–169. [Google Scholar] [CrossRef]
- Allan, J.D.; Smith, S.D.P.; McIntyre, P.B.; Joseph, C.A.; Dickinson, C.E.; Marino, A.L.; Biel, R.G.; Olson, J.C.; Doran, P.J.; Rutherford, E.S.; et al. Using cultural ecosystem services to inform restoration priorities in the Laurentian Great Lakes. Front. Ecol. Environ. 2015, 13, 418–424. [Google Scholar] [CrossRef]
- Blumstein, M.; Thompson, J.R. Land-use impacts on the quantity and configuration of ecosystem service provisioning in Massachusetts, USA. J. Appl. Ecol. 2015, 52, 1009–1019. [Google Scholar] [CrossRef]
- Oswalt, S.N.; Smith, W.B.; Miles, P.D.; Pugh, S.A. Forest Resources of the United States, 2012: A Technical Document Supporting the Forest Service update of the 2010 RPA Assessment, GTR WO-91; U.S. Department of Agriculture, Forest Service: Washington, DC, USA, 2014.
- Caputo, J.; Beier, C.M.; Groffman, P.M.; Burns, D.A.; Beall, F.D.; Hazlett, P.W.; Yorks, T.E. Effects of Harvesting Forest Biomass on Water and Climate Regulation Services: A Synthesis of Long-Term Ecosystem Experiments in Eastern North America. Ecosystems 2016, 19, 271–283. [Google Scholar] [CrossRef]
- Pagiola, S.; Bishop, J.; Landell-Mills, N. Selling Forest Environmental Services: Market-Based Mechanisms for Conservation and Development; Earthscan Publications: London, UK, 2002. [Google Scholar]
- Silver, E.J.; Leahy, J.E.; Weiskittel, A.R.; Noblet, C.L.; Kittredge, D.B. An evidence-based review of timber harvesting behavior among private woodland owners. J. For. 2015, 113, 490–499. [Google Scholar] [CrossRef]
- Gomez, J.; Vidon, P.; Gross, J.; Beier, C.; Caputo, J.; Mitchell, M. Estimating greenhouse gas emissions at the soil–atmosphere interface in forested watersheds of the US Northeast. Environ. Monit. Assess. 2016, 188, 16. [Google Scholar] [CrossRef] [PubMed]
- Lippke, B.; Oneil, E.; Harrison, R.; Skog, K.; Gustavsson, L.; Sathre, R. Life cycle impacts of forest management and wood utilization on carbon mitigation: Knowns and unknowns. Carbon Manag. 2011, 2, 303–333. [Google Scholar] [CrossRef]
- Caputo, J. Commoditization and the Origins of American Silviculture. Bull. Sci. Technol. Soc. 2012, 32, 86–95. [Google Scholar] [CrossRef]
- Ricketts, T.H.; Regetz, J.; Steffan-Dewenter, I.; Cunningham, S.A.; Kremen, C.; Bogdanski, A.; Gemmill-Herren, B.; Greenleaf, S.S.; Klein, A.M.; Mayfield, M.M.; et al. Landscape effects on crop pollination services: Are there general patterns? Ecol. Lett. 2008, 11, 499–515. [Google Scholar] [CrossRef] [PubMed]
- Nayak, G.K.; Roberts, S.P.M.; Garratt, M.; Breeze, T.D.; Tscheulin, T.; Harrison-Cripps, J.; Vogiatzakis, I.N.; Stirpe, M.T.; Potts, S.G. Interactive effect of floral abundance and semi-natural habitats on pollinators in field beans (Vicia faba). Agric. Ecosyst. Environ. 2015, 199, 58–66. [Google Scholar] [CrossRef]
- Martins, K.T.; Gonzalez, A.; Lechowicz, M.J. Pollination services are mediated by bee functional diversity and landscape context. Agric. Ecosyst. Environ. 2015, 200, 12–20. [Google Scholar] [CrossRef]
- Burton, R.J.F. Seeing through the ‘good farmer’s’ eyes: Towards developing an understanding of the social symbolic value of ‘productivist’ behaviour. Sociol. Rural. 2004, 44, 195–215. [Google Scholar] [CrossRef]
- Kreye, M.M.; Pienaar, E.F.; Adams, A.E. The Role of Community Identity in Cattlemen Response to Florida Panther Recovery Efforts. Soc. Nat. Resour. 2017, 30, 79–94. [Google Scholar] [CrossRef]
- Asah, S.T.; Blahna, D.J.; Ryan, C.M. Involving forest communities in identifying and constructing ecosystem services: Millennium assessment and place specificity. J. For. 2012, 110, 149–156. [Google Scholar] [CrossRef]
- Cardinale, B.J.; Duffy, J.E.; Gonzalez, A.; Hooper, D.U.; Perrings, C.; Venail, P.; Narwani, A.; Mace, G.M.; Tilman, D.; Wardle, D.A.; et al. Biodiversity loss and its impact on humanity. Nature 2012, 486, 59–67. [Google Scholar] [CrossRef] [PubMed]
- Harrison, P.A.; Berry, P.M.; Simpson, G.; Haslett, J.R.; Blicharska, M.; Bucur, M.; Dunford, R.; Egoh, B.; Garcia-Llorente, M.; Geamănă, N.; et al. Linkages between biodiversity attributes and ecosystem services: A systematic review. Ecosyst. Serv. 2014, 9, 191–203. [Google Scholar] [CrossRef]
- Bennett, E.M.; Peterson, G.D.; Gordon, L.J. Understanding relationships among multiple ecosystem services. Ecol. Lett. 2009, 12, 1394–1404. [Google Scholar] [CrossRef] [PubMed]
- Mika, A.M.; Keeton, W.S. Factors contributing to carbon fluxes from bioenergy harvests in the U.S. Northeast: An analysis using field data. GCB Bioenergy 2013, 5, 290–305. [Google Scholar] [CrossRef]
- Walker, T.; Cardellichio, P.; Gunn, J.S.; Saah, D.S.; Hagan, J.M. Carbon accounting for woody biomass from Massachusetts (USA) managed forests: A framework for determining the temporal impacts of wood biomass energy on atmospheric greenhouse gas levels. J. Sustain. For. 2013, 32, 130–158. [Google Scholar] [CrossRef]
Figure 1.
Estimated area of forest and woodland by ownership category, United States, 2011–2013. Error bars represent two standard errors. USDA Forest Service’s National Woodland Owner Survey (NWOS), 2016. Source: [1].
Figure 1.
Estimated area of forest and woodland by ownership category, United States, 2011–2013. Error bars represent two standard errors. USDA Forest Service’s National Woodland Owner Survey (NWOS), 2016. Source: [1].
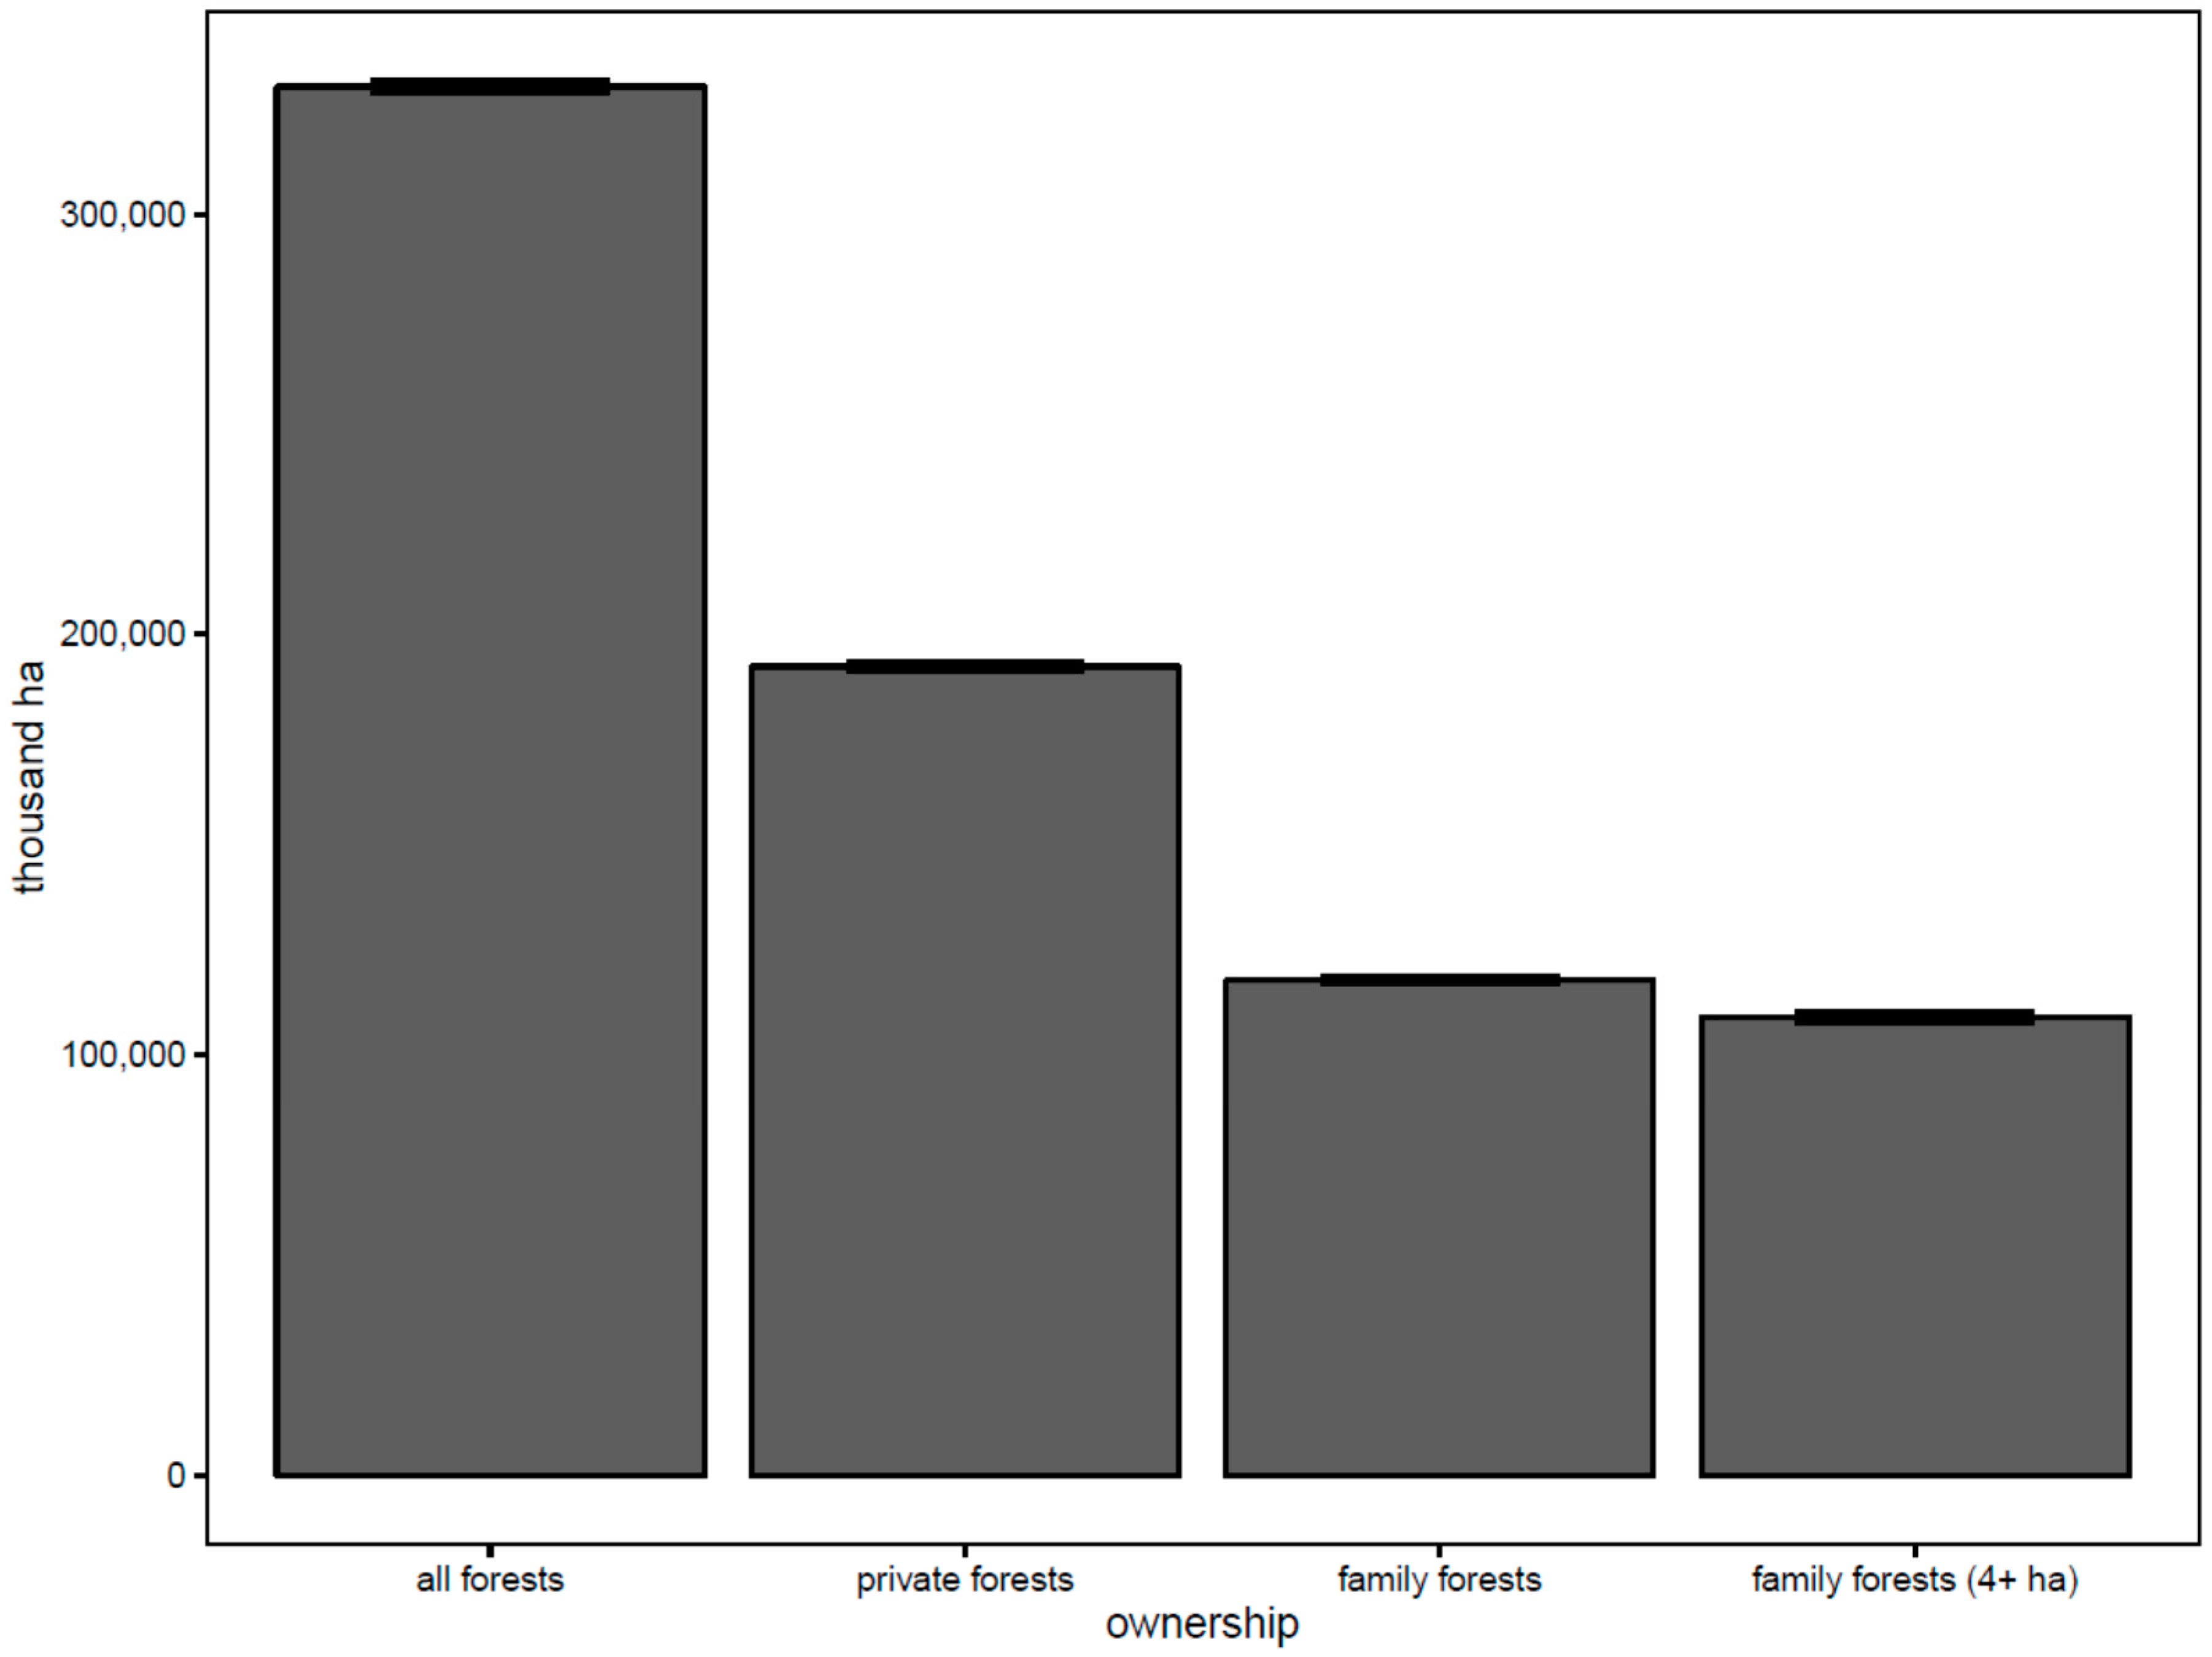
Figure 2.
Estimated proportion of family forest ownerships (4+ ha) producing wood products, by product and beneficiary, United States, 2011–2013. Error bars represent two standard errors.
Figure 2.
Estimated proportion of family forest ownerships (4+ ha) producing wood products, by product and beneficiary, United States, 2011–2013. Error bars represent two standard errors.

Figure 3.
Estimated proportion of family forest ownerships (4+ ha) producing non-timber forest products (NTFPs), by product type and beneficiary, United States, 2011–2013. Error bars represent two standard errors.
Figure 3.
Estimated proportion of family forest ownerships (4+ ha) producing non-timber forest products (NTFPs), by product type and beneficiary, United States, 2011–2013. Error bars represent two standard errors.
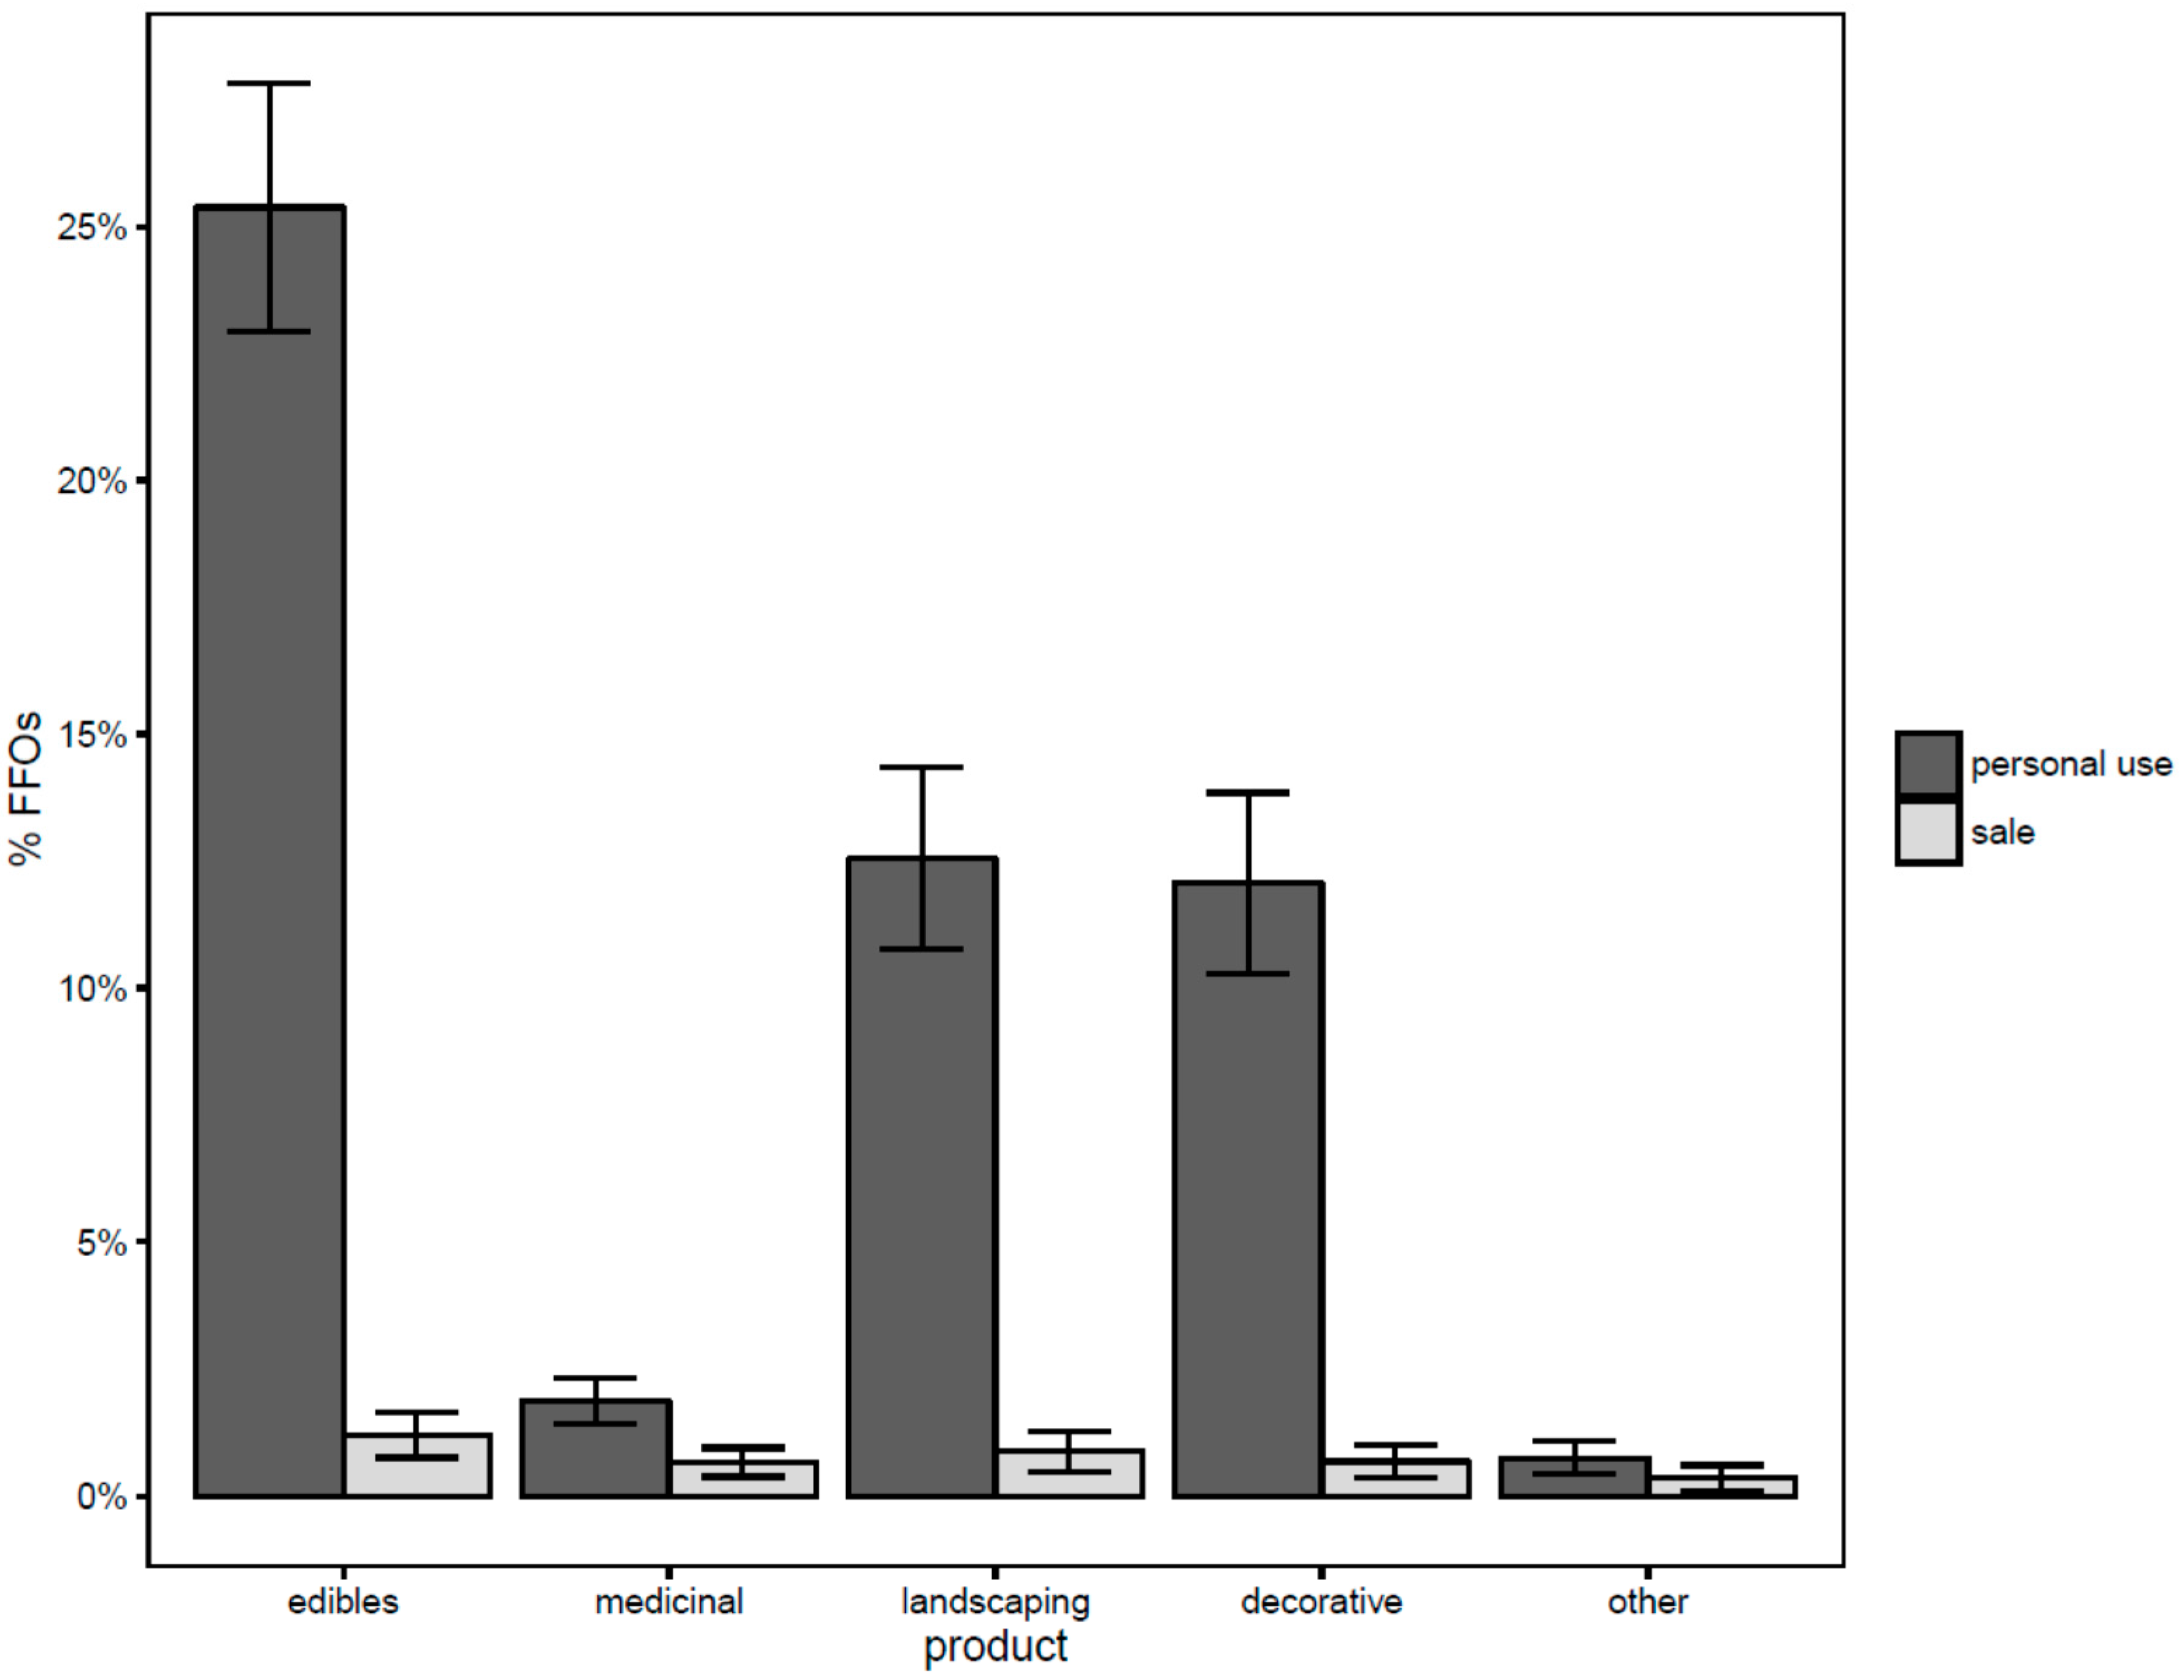
Figure 4.
Estimated proportion of family forest ownerships (4+ ha) who have leased forest land or collected money for use of forest land, by the use or activity for which lands were leased, United States, 2011–2013. Error bars represent two standard errors. HUNT = hunting, REC = recreation (other than hunting), GRZ = to graze/pasture livestock, CONS = land conservation, CARB = carbon capture/sequestration, WAT = public water supply protection, WILD = wildlife habitat/biodiversity. Proportions are relative to the total number of ownerships that have leased land or collected money.

Figure 5.
Estimated proportion of family forest ownerships (4+ ha) providing a selection of recreational services in the past 5 years by (A) recreational activity and (B) beneficiary, United States, 2011–2013. Error bars represent two standard errors. Proportions in (A) are relative to the total number of ownerships; proportions in (B) are relative to the total number of ownerships providing recreational services.
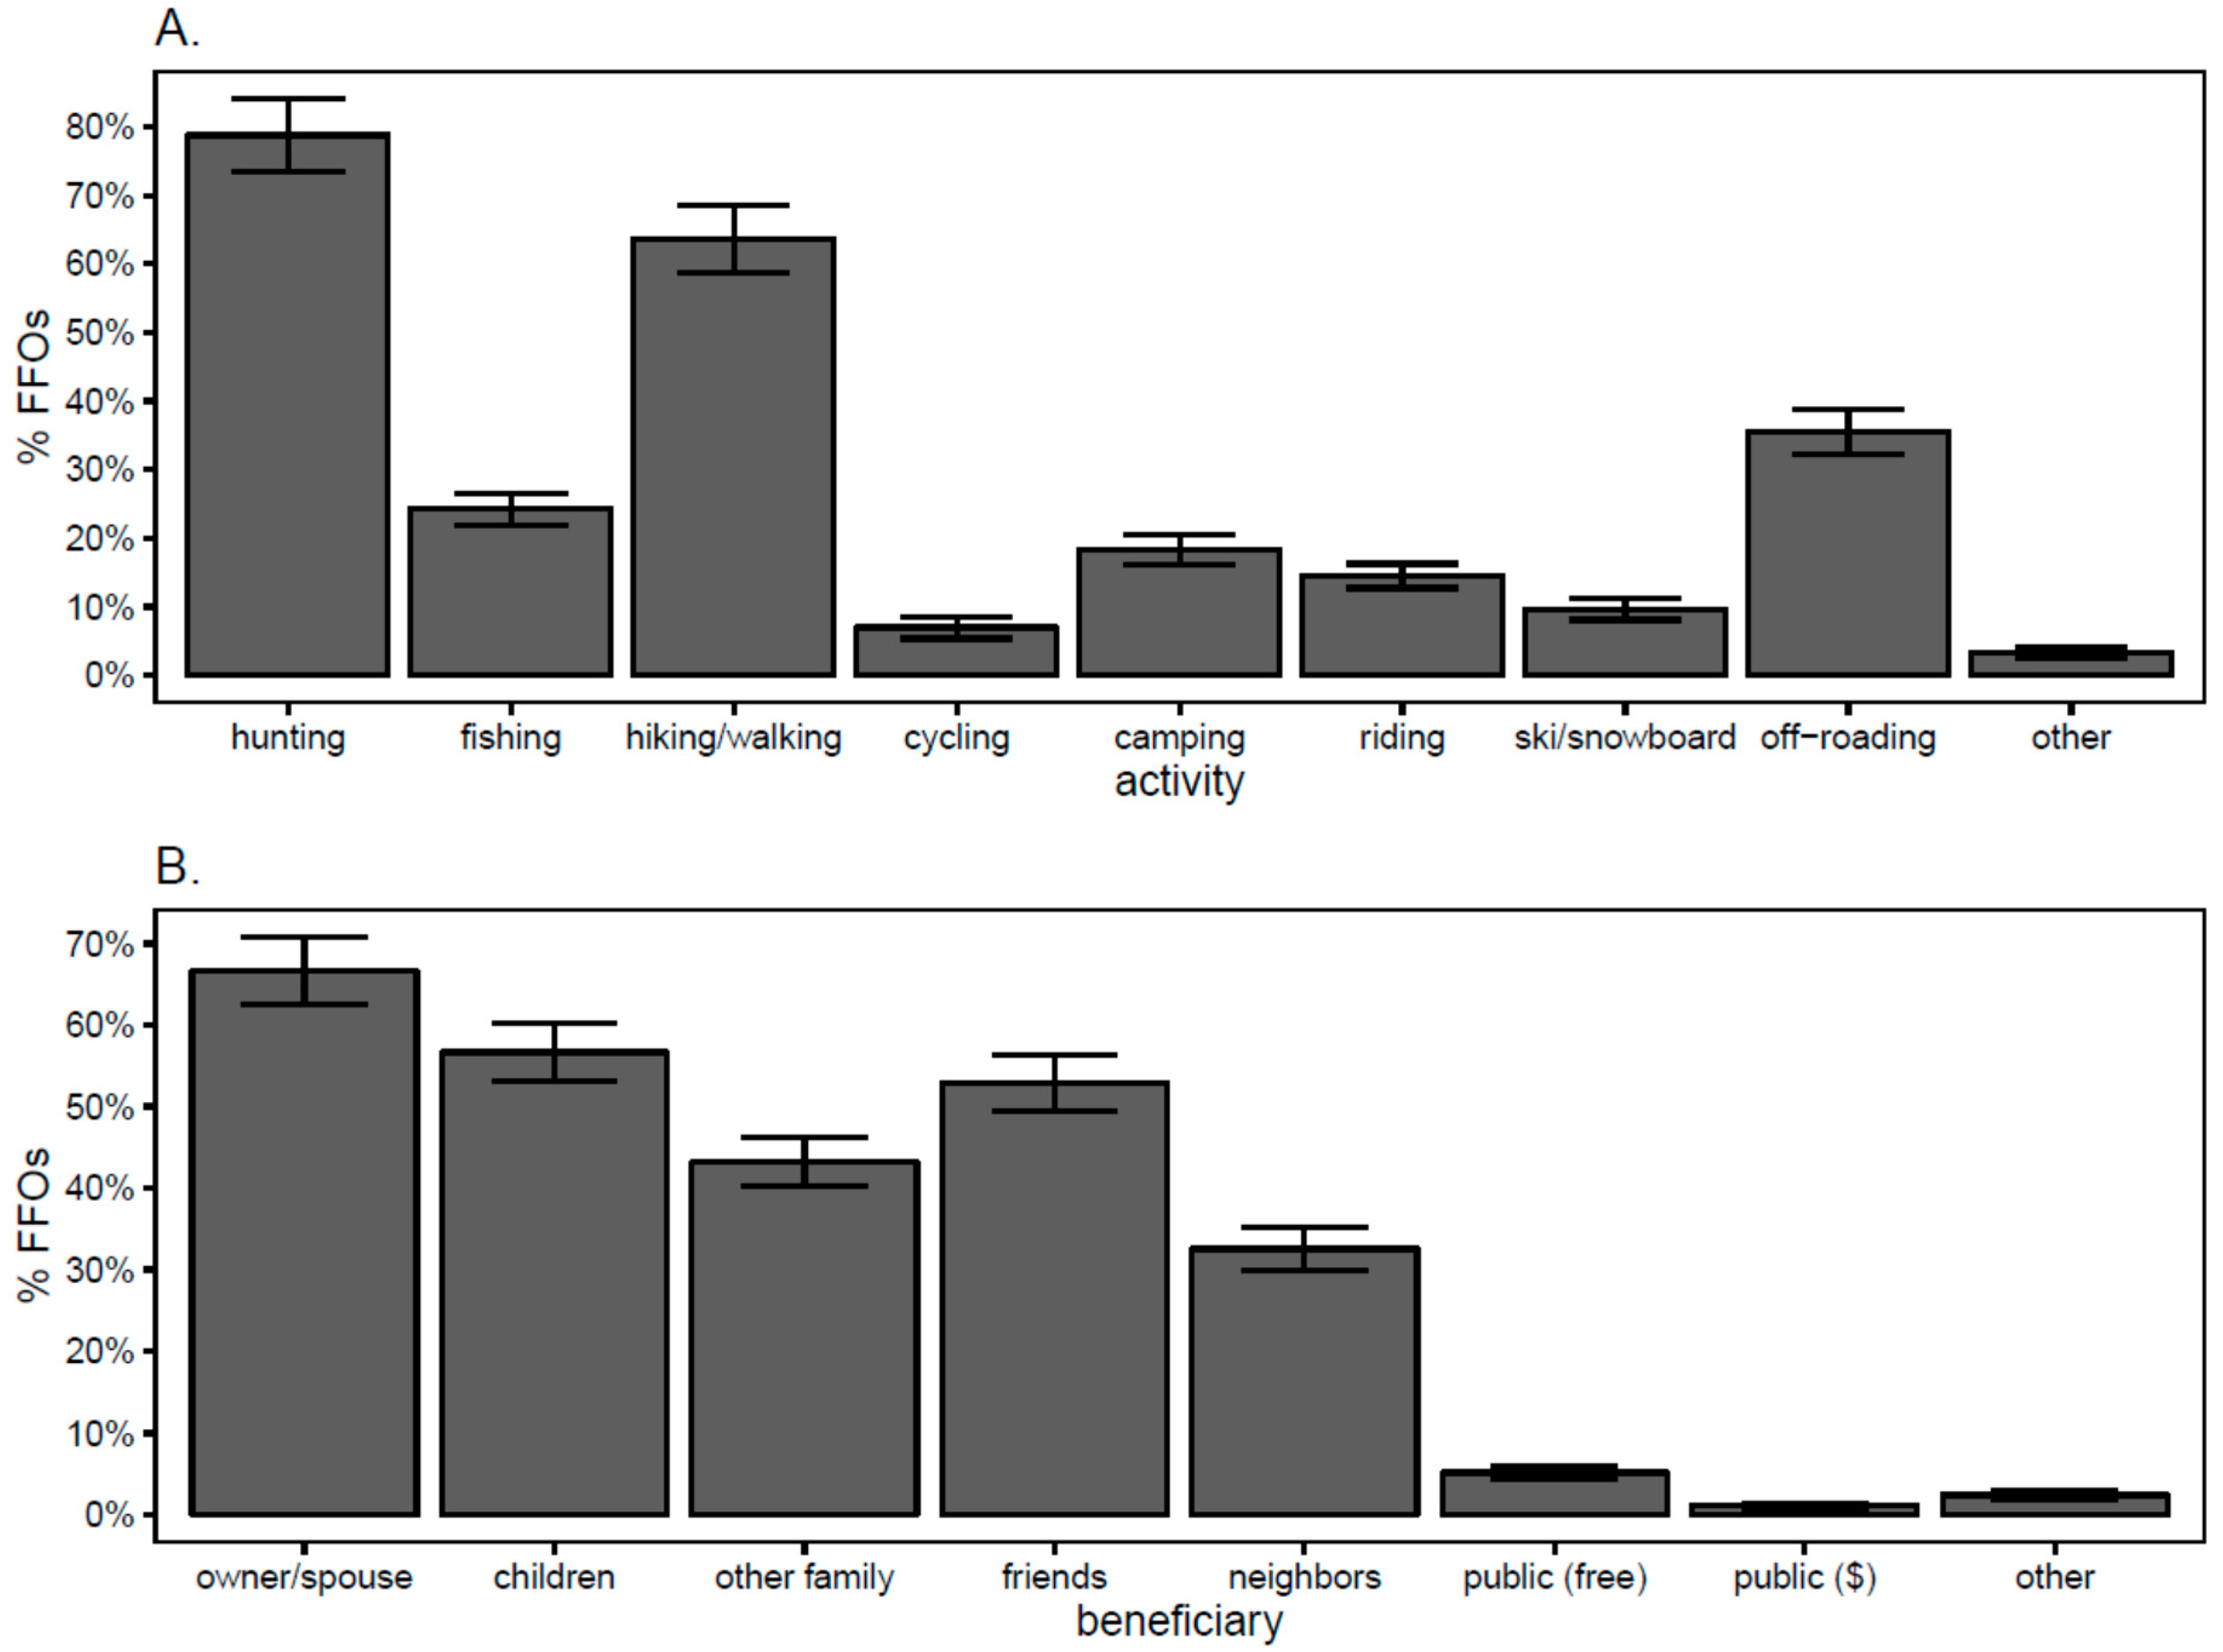
Figure 6.
Estimated proportion of family forest ownerships (4+ ha) providing a selection of ecosystem services in the past 5 years, by ecosystem service and region, United States, 2011–2013. Error bars represent two standard errors. Regional boundaries are consistent with the USDA RPA assessment regions [23]. WP_S = wood products for sale, WP_O = wood products used by owners, NTFP = non-timber forest products, GRZ = grazing, REC_O = recreation by owners, REC_P = free public recreation.
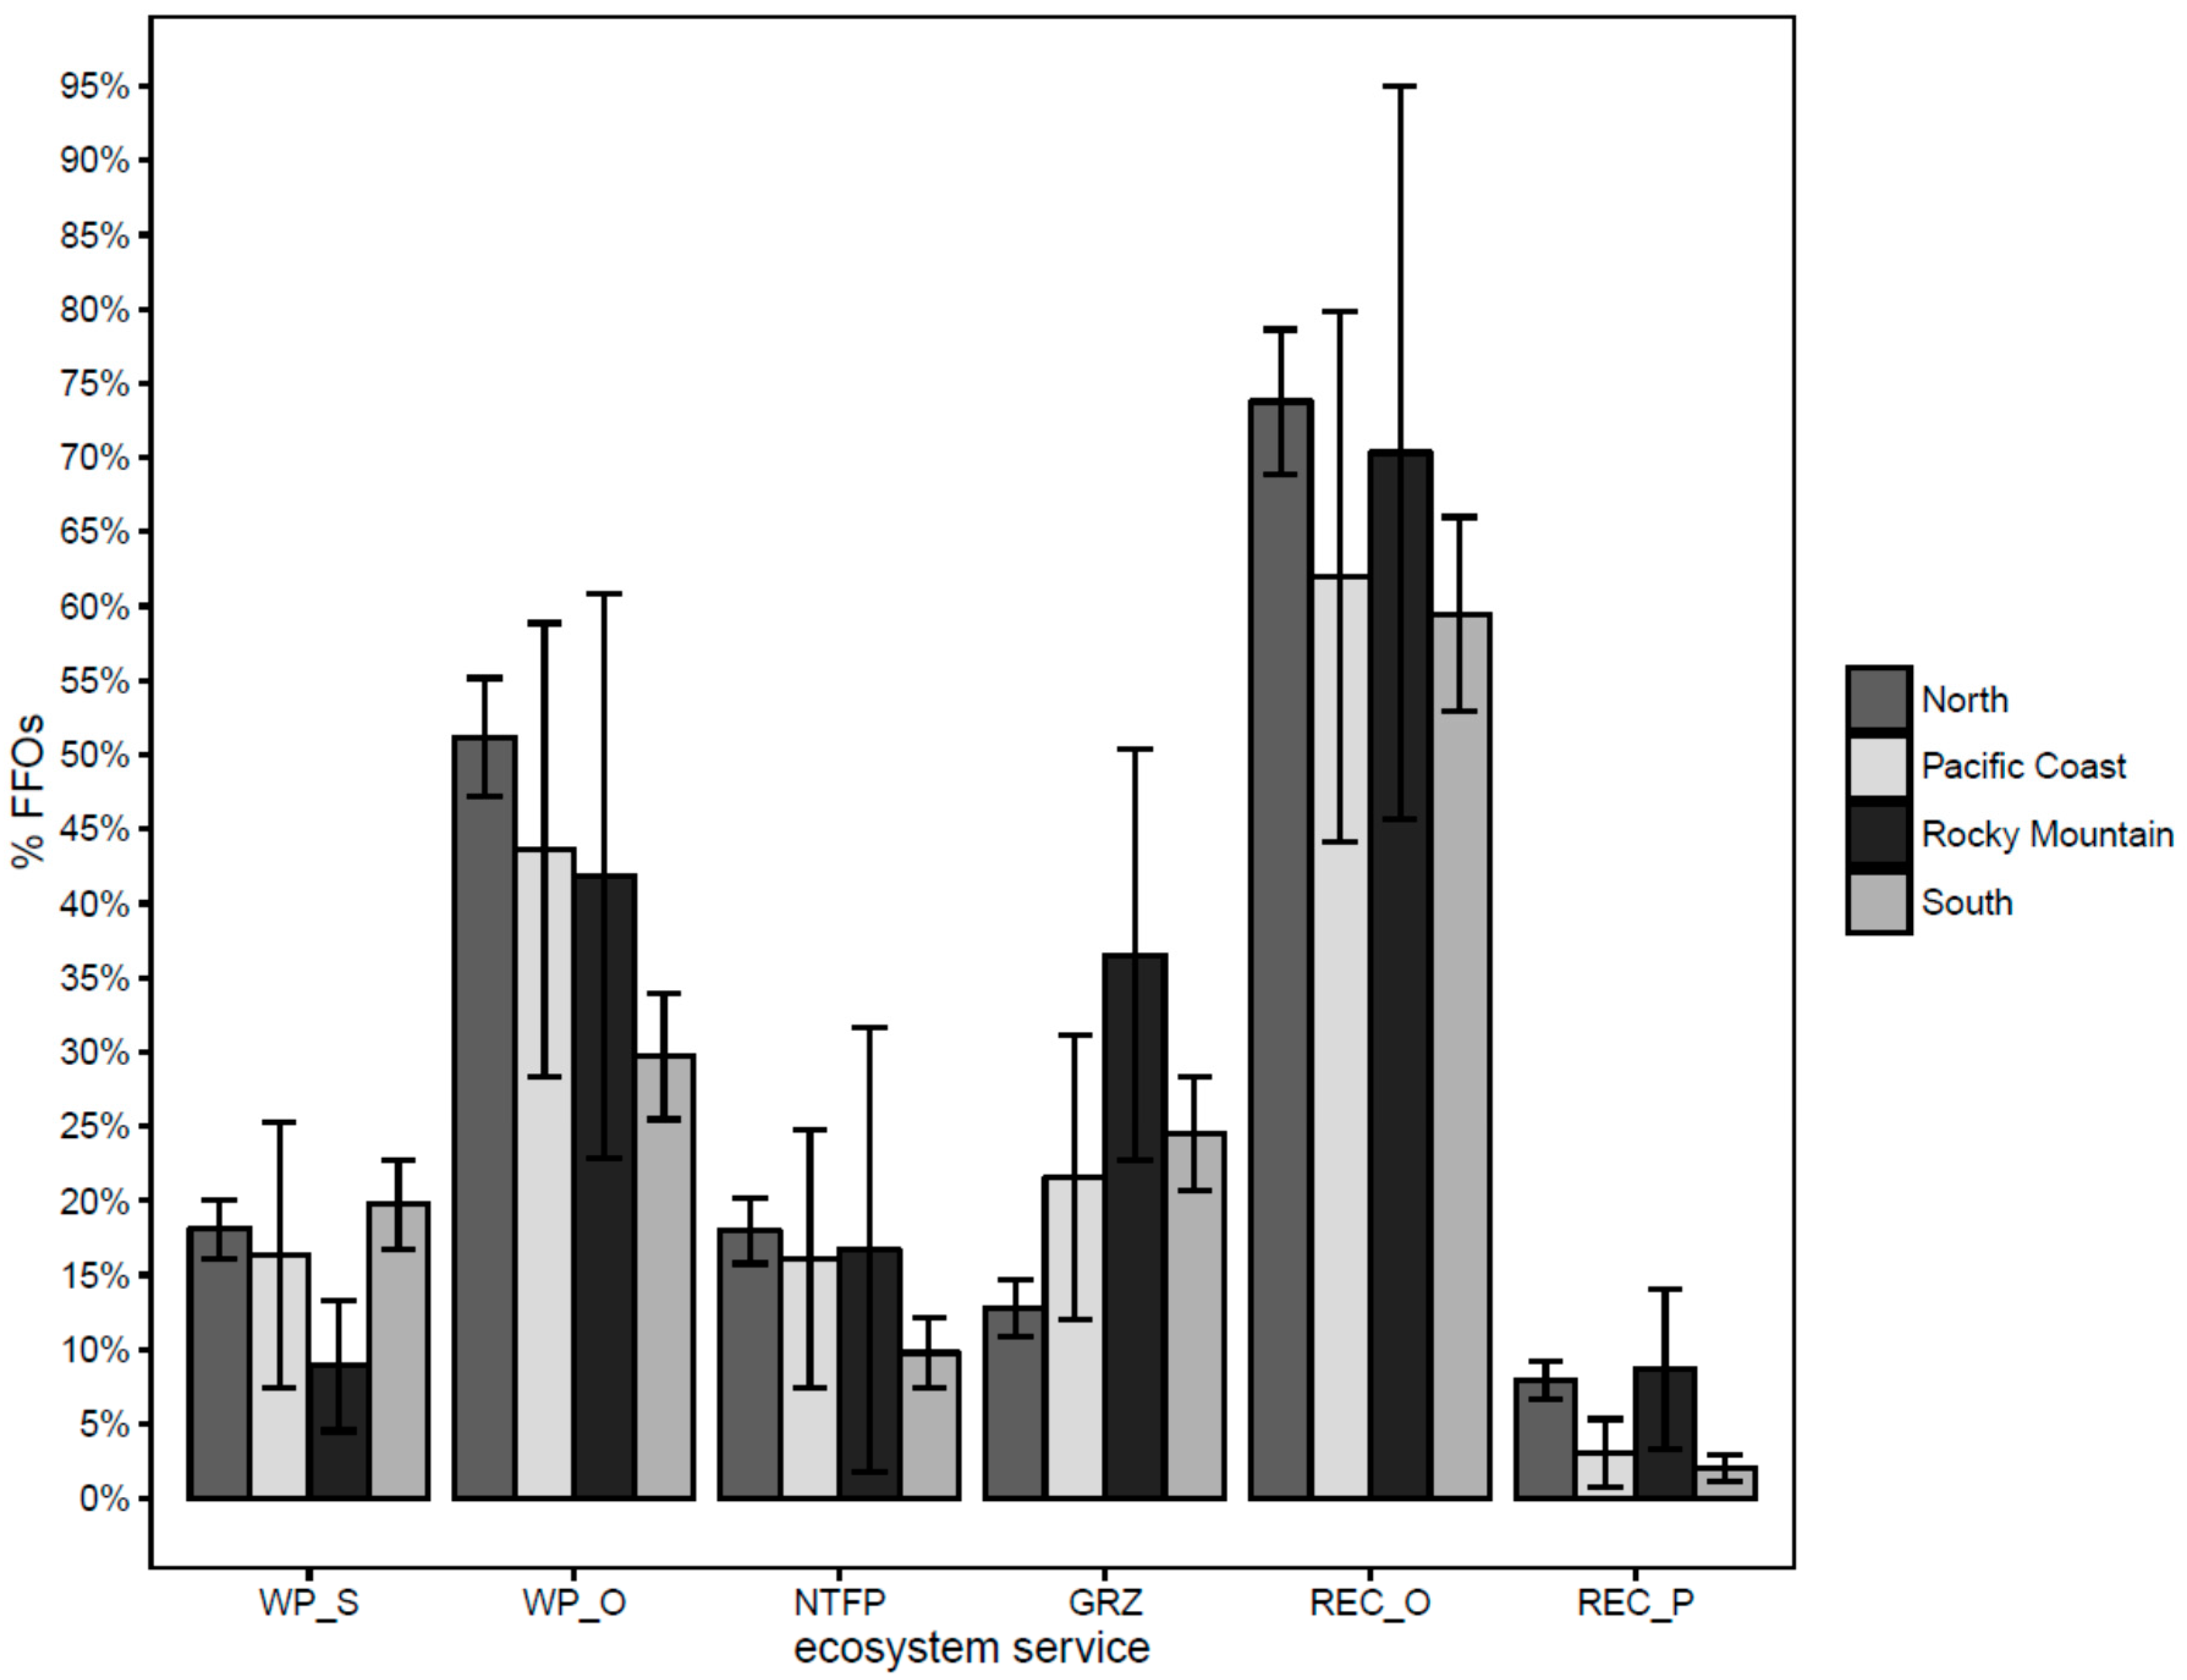
Figure 7.
Estimated proportion of family forest ownerships (4+ ha) who have engaged in activities intended to increase the capacity for ecosystem service provision, by management activity, United States, 2011–2013. Error bars represent two standard errors. FIRER = reduced fire hazard, FIREP = controlled burn/prescribed fire, INV = eliminated or reduced invasive plants, INDIS = eliminated or reduced unwanted insects or diseases, ROAD = road construction or maintenance, TRAIL = trail construction or maintenance, WILD = improved wildlife habitat.

© 2017 by the authors. Licensee MDPI, Basel, Switzerland. This article is an open access article distributed under the terms and conditions of the Creative Commons Attribution (CC BY) license (http://creativecommons.org/licenses/by/4.0/).
Share and Cite
MDPI and ACS Style
Caputo, J.; Butler, B. Ecosystem Service Supply and Capacity on U.S. Family Forestlands. Forests 2017, 8, 395. https://doi.org/10.3390/f8100395
AMA Style
Caputo J, Butler B. Ecosystem Service Supply and Capacity on U.S. Family Forestlands. Forests. 2017; 8(10):395. https://doi.org/10.3390/f8100395
Chicago/Turabian StyleCaputo, Jesse, and Brett Butler. 2017. "Ecosystem Service Supply and Capacity on U.S. Family Forestlands" Forests 8, no. 10: 395. https://doi.org/10.3390/f8100395
Note that from the first issue of 2016, this journal uses article numbers instead of page numbers. See further details here.