A Robust Productivity Model for Grapple Yarding in Fast-Growing Tree Plantations


1
Power Brite Sdn Bhd, Parkcity Commerce Square, Bintulu 97000, Sarawak, Malaysia
2
Forest Engineering Dept., Nelson Mandela Metropolitan University, Private Bag X6531, George 6530, South Africa
3
Istituto per la Valorizzazione del Legno e delle Specie Arboree, Consiglio Nazionale delle Ricerche, Via Madonna del Piano 10, Sesto Fiorentino 50019, Italy
4
Australian Forest Operations Research Alliance, University of the Sunshine Coast, Locked Bag 4, Maroochydore DC, QLD 4558, Australia
*
Author to whom correspondence should be addressed.
Forests 2017, 8(10), 396; https://doi.org/10.3390/f8100396
Submission received: 23 September 2017
/
Revised: 12 October 2017
/
Accepted: 13 October 2017
/
Published: 17 October 2017
(This article belongs to the Special Issue Forest Operations, Engineering and Management)
Abstract
:New techniques have recently appeared that can extend the advantages of grapple yarding to fast-growing plantations. The most promising technique consists of an excavator-base un-guyed yarder equipped with new radio-controlled grapple carriages, fed by another excavator stationed on the cut-over. This system is very productive, avoids in-stand traffic, and removes operators from positions of high risk. This paper presents the results of a long-term study conducted on 12 different teams equipped with the new technology, operating in the fast-growing black wattle (Acacia mangium Willd) plantations of Sarawak, Malaysia. Data were collected continuously for almost 8 months and represented 555 shifts, or over 55,000 cycles—each recorded individually. Production, utilization, and machine availability were estimated, respectively at: 63 m3 per productive machine hour (excluding all delays), 63% and 93%. Regression analysis of experimental data yielded a strong productivity forecast model that was highly significant, accounted for 50% of the total variability in the dataset and was validated with a non-significant error estimated at less than 1%. The figures reported in this study are especially robust, because they were obtained from a long-term study that covered multiple teams and accumulated an exceptionally large number of observations.
1. Introduction
Compared with natural forests, tree plantations offer many benefits, including fast growth, rationalized management and pre-defined product target [1]. Industrial tree plantations are characterized by very high yields, which result from the use of selected genotypes under favorable soil and climate conditions [2]. The fastest growing tree plantations are found in the Southern Hemisphere, and yield up to 40 m3 of solid wood per hectare per year [3]. As a result, many forest companies in Europe and North America have transferred their capital away from domestic forest ventures [4] and towards highly-productive plantations in South America, South Africa, and Australasia [5].
Plantation forestry has an enormous potential for the efficient supply of fiber and renewable fuel [6], and may already account for almost half of the global production of industrial wood [7]. In fact, experts estimate that the importance of plantations will continue to grow [8], and that by 2050 75% of the global fiber supply will be sourced from dedicated plantations established on farm land [9]. In that regard, plantation forestry offers better environmental performances than conventional agriculture and animal husbandry [10], and is widely acknowledged as a sustainable source of wood fiber [11]. Despite concerns about potential social impacts [12], plantation forestry does not seem to imply a loss of jobs compared with traditional agriculture [13], and it may create high quality jobs in underdeveloped regions [14].
Ultimately, tree plantations contribute to economic and social development, and help in offsetting the increased CO2 emission [15] resulting from the rapid development of countries in the Southern Hemisphere [16]. Of course, the environmental and social benefits of plantation forestry are only realized if proper management techniques are adopted [17]. That is especially critical for harvesting, which has the highest potential for impact. Safe, low-impact harvesting should be adopted in all cases, making use of modern equipment that is specifically designed for this purpose. Today, forestry equipment manufacturers offer new machines capable of matching the strictest specifications for environmental performance and safe operation [18]. In particular, operator stations are always enclosed in protected cabs, which mitigate the consequences of accidents and are designed to minimize the risk of long-term occupational disease [19].
Complete mechanization of harvesting work is especially difficult on steep terrain, where excessive slope gradient prevents stand access to forest vehicles [20]. Under these conditions, operators generally resort to cable yarding or to building a dense network of skid trails [21]. Unfortunately, neither solution can guarantee low-impact and safe operation at the same time. Cable logging configures as a low-impact harvesting technique, but it requires that operators are on the ground, exposed to serious hazard [22]. On the other hand, opening trail after trail certainly cannot be defined as low-impact harvesting: in fact, the building of skid trails on steep slopes is a main contributor to site impact, especially in tropical areas [23].
There is an urgent need to find cost-effective, low-impact and safe technologies for steep terrain harvesting, as flat land is monopolized by farming and rural development, and plantations can only expand to hill country [24]. For instance, experts predict that by 2020 the volume of wood harvested in New Zealand with cable technology will be larger than the volume harvested with conventional ground-based equipment [25]. Similarly, loggers in different places such as France [26] and the Pacific Northwest [27] must now tackle the challenging terrain left behind in the recent past because it was too steep for low-cost mechanized harvesting with ground-based technology.
A possible solution is offered by grapple yarders, which offer the typical environmental benefits of cable extraction while dispensing with manual assistants placed in risk areas [28]. With these machines, a mechanically-operated grapple clutches the load, removing the need for one or more operators to station at the loading site and manually hitch the loads with chain or wire slings [29]. Grapple yarders are not a new development, and their use has been documented since at least the early 1960s [30]. In fact, they were designed for logging old-growth, where loads generally consisted of one large piece. Landing the grapple on such a big target was relatively easy, and grapple yarders have remained popular in the Pacific Northwest for as long as big tree logging has been widely accepted [31]. However, plantation forestry offers much smaller trees, and optimum load size is only achieved when multiple trees are assembled into the same load, which favors choker slings over grapples [32]. Under these conditions, grapple yarders are potentially less productive because they move smaller loads or spend more time to accumulate a large enough load [33]. Fortunately, a new work technique seems able to recover the handicap and release the full potential of grapple yarding: this consists of detaching a mid-size excavator to feed the grapple with pre-bunched loads, which dramatically boosts grapple yarder production [34]. In this configuration, the grapple yarder becomes a very effective system for logging steep terrain plantations, and may compete successfully with most other options [35]. However, this system is so new that very little information is available on its performance, despite the large potential and widespread interest. To-date, all available studies on the subject consist of short-term case studies that cannot be generalized and are not capable of producing an accurate representation of downtime, as required for long term production estimates [36].
Therefore, the goal of this study is to produce a general model for the productivity of innovative grapple yarding techniques in plantation forestry, based on a large number of observations, and conducted over extended periods on multiple teams. Only in that way can one produce reliable productivity estimates for this technique, which may integrate the inherent variability introduced by terrain, machine type, individual team proficiency, and seasonal fluctuations. In particular, the study aims at (1) determining reference values for net productivity and utilization, (2) categorizing downtime, (3) discriminating between equipment options, and (4) modeling net productivity as a function of relevant independent variables. Such knowledge will allow accurate operation planning, which is crucial to precision management.
2. Materials and Methods
2.1. Site and Equipment
The opportunity for this study was provided by the massive introduction of the new system to the large plantation established and managed by the Grand Perfect Sdn Bhd consortium 45 km east of Bintulu, in Sarawak, Malaysia (Figure 1).
The Sarawak State Government tasked the consortium with planting 150,000 hectares of hill country with black wattle (Acacia mangium Willd.), in order to supply a new Kraft Pulp Mill being built in the area [37]. When the time for harvesting approached, the search was launched for a system that could guarantee high productivity, safe operation, and low impact. In particular, managers wanted to avoid the use of bulldozers and other ground-based equipment, which are especially detrimental to the red-yellow podzolic soils characterizing Sarawak forest land [38]. Furthermore, the new system had to be simple enough for operation by relatively inexperienced labor, since the rapid industrialization of Borneo is drawing specialized workers away from rural areas and into factories, as occurs in many other developing countries [39].
Within three years, the consortium commissioned 12 complete yarding operations, each consisting of four machines: an excavator-based grapple yarder for extracting whole-tree loads to the landing edge, a second excavator placed near the yarder tasked with moving loads from in front of the yarder to the stack, a third excavator stationed on the slope for feeding pre-bunched loads to the grapple carriage, and finally a fourth excavator used as a mobile tailhold, turned on only during line change—this last one being an old machine valuable for its weight more than for its power. The excavator-based yarder was equipped with a double drum hydraulic winch set, a tower extension bolted onto the boom stick, and an innovative remote-controlled grapple carriage [40]. The yarder was set up in a semi-live shotgun skyline configuration (Figure 2).
The use of an excavator as the base for the grapple yarder offers significant benefits—especially global availability, ease of operation, versatility, relatively low cost, and robustness [41]. Further, the large mass of the excavator base and the use of the boom as an outrigger allow the guylines to be dispensed with [42]. In turn, un-guyed yarders offer the main advantage of quick repositioning, which allows cost-effective operation in short corridors and reduction of corridor spacing, to the benefit of minimizing the need for time-consuming and potentially high-impact lateral yarding [43]. This is a crucial asset when extracting timber from short steep slopes and waterlogged gullies, frequently encountered in the Grand Perfect plantations. Furthermore, quick repositioning and capacity to swing incoming loads to the side facilitate better use of landing space, enabling operation directly from the forest road, as the yarder can easily move aside once the available stacking space is full [44].
Field work for this research was conducted between 4 October 2016 and 25 May 2017. In order to integrate all possible variability, the study covered all four plantation districts, namely: Anap/Tatau, Tubau, Kakus, and Kemena (Figure 3). For the same reason, the study included all 12 machine teams, which represented two slightly different set-ups (Table 1).
The compartments were all monocultural black wattle, planted between 1997 and 2003 at a 3 m × 3 m final spacing. Treatment was a clearcut at the end of rotation, without any previous thinning. At the time of cut, most compartments were aged between 10 and 15 years. The pre-harvest inventory determined the following stand characteristics: mean diameter at breast height = 18.7 ± 5.2 cm; total height = 19.5 ± 2.8 m; stocking = 225 ± 140 m3 ha−1. In fact, rotation age was longer than originally planned, but growth stagnated after the first 7–8 years and therefore conditions can be considered representative of normal black wattle plantations, and more in general of hardwood plantations in tropical and sub-tropical countries.
All compartments were felled motor-manually with chainsaws. After felling, trees were pre-bunched with a medium-size excavator, specifically modified for the purpose by mounting suitable guarding, a log grapple, and a fixed heel.
2.2. Data Collection
A data collection sheet was designed for collection of the following data on a daily basis: machine and operator ID, begin and end of shift (h:min), duration of any delays longer than 5 min (min:ss), description of the delay, duration of each extraction cycle (min:ss), number of pieces in each load (n°), and line length (m). On the same form, a separate page was designed for introducing the total length and the diameter at the top and the butt ends of all pieces in a sample load, which was to be measured four times a day at regular intervals (08:30 h, 10:30 h, 13:30 h, and 17:00 h). For the purpose of the measurements, each team supervisor was equipped with forms, a digital stopwatch, laser range-finder, inclinometer, caliper, and measuring tape. Five research days were spent to train yarder teams to record information accurately, and data sheets were regularly collected and checked by the operation manager.
A vector ruggedness measure (VRM) was determined for each compartment, using a digital elevation model (DEM) acquired from 2-m resolution LiDAR measurements. The VRM is able to estimate the heterogeneity of terrain features independently of slope values, and is considered able to differentiate smooth, steep hillsides from broken terrain with variable gradient and aspect [45].
Eventually, the complete dataset included 555 shifts, for a total of 1346 lines, 54,624 valid cycles and 3517 h of worksite time (excluding 239 h of study delays, which were removed from the dataset). The study covered the extraction of over 125,000 m3 or over 240,000 stems, with total length between 10 and 30 m.
2.3. Data Analysis
Data were analyzed both at the shift level and at the cycle level. Descriptive statistics were used for reporting the main results of the study. Then, individual variables were tested for compliance with the main statistical assumptions for a parametric test. In particular, linearity and normality were checked by observing residual plots and distribution histograms, respectively. Equality of variance was checked with Levene’s test. Normal (or normalized) data was tested through the analysis of covariance (ANCOVA), with the aim of determining the significance and the strength of all relevant effects—especially machine type, team, distance, and piece size. Eventual differences were pinned on the specific treatments using Tukey–Kramer’s test. Non-normal data were analyzed using non-parametric techniques, and treatments were separated using Scheffe’s test, which is particularly robust to violations of the normality assumption [46]. The significance of any differences between distributions was checked using classic χ2 (chi-square) analysis.
Time and productivity data were also analyzed with multiple regression techniques in order to estimate significant relationships between these variables and other relevant variables. The effect of categorical data was introduced by generating suitable indicator variables [47]. Validation is a prerequisite of production models derived from time study data [48], and it was conducted according to the same procedure recently used by Adebayo et al. [49] and Spinelli et al. [50] for similar modeling studies. The dataset was partitioned at random into two subsets: the first subset, containing 95% of the observation number was used to calculate appropriate productivity relationships through regression analysis; the second subset, with the remaining 5% of the observations (reserved data), was used to validate the regressions obtained above. To this purpose, the models were used to predict the reserved data, then a paired t-test was used to check if there were any significant differences between predicted and observed figures.
All statistical analyses were conducted with the SAS Statview 5.01 software package (SAS Institute Inc., Cary, NC, USA), for α < 0.05.
3. Results
Daily production averaged 226 m3 for a mean shift duration equal to 6.3 h (Table 2). Mean piece and load size were 0.5 m3 and 2.4 m3, respectively. Teams commonly worked 2.4 lines per shift, with a mean length of 103 m and a maximum length of 250 m. That resulted in a mean extraction density of 0.9 m3 per m of line.
Utilization averaged 63%, with small differences between teams (Table 3). Only team 7 emerged with a significantly higher utilization rate than the others, reaching 80%. While the erratic nature of delays made it difficult to find significant differences between the impact of different delay types, a χ2 analysis of the frequency of delay events showed that team 7 had significantly lower occurrences of mechanical delay and line change events, pointing at higher mechanical reliability and better organization of the harvest area as the possible reasons for the better performance of team 7. In fact, mechanical availability was high for all machines and never went below 89%. As for line change, it is possible that team 7 performed line changes when the machines were idle for some other reasons, so that line change time would be covered by some other delay event category. In all cases, the incidence of personnel delays was relatively high, which was due to the inclusion of the main lunch break within shift time (Figure 4).
Slope gradient varied from 23% to 49%, with a mean value of 33%. VRM ranged between 1 (even terrain) and 3 (moderately rugged terrain), with the average value at 2 (slightly rugged terrain). Terrain characteristics did not seem to have any strong effects on yarder performance, although there was some evidence that extraction distance increased with slope gradient and decreased with terrain ruggedness. This might be related to the practice of moving all trees to the bottom of the slope during pre-bunching in steep sites, and to the difficulty in getting enough deflection on long lines in rugged terrain. Data analysis also suggested that the frequency of line changes increased with slope, but the time required for the change decreased with it, possibly because an increase in the number of lines for the same harvest implied that the distance between two adjacent lines was shorter, and that made line change easier and faster. In any case, these relationships were quite weak, which made it difficult to estimate reliable factors for the effects of slope gradient and terrain ruggedness on line length, line change frequency, and line change duration.
The analysis of covariance showed that net work productivity in m3 per productive machine hour (PMH) was affected by piece size, yarder type (heavy or medium), and by the interaction of piece size with yarder type. All these effects were significant at the <0.0001 level, for η2 values of 10%, 1%, and 1%, respectively.
The analysis of data indicated that the two yarder types (heavy and medium) were deployed on different sites, with the heavy yarder handling larger piece sizes than the medium yarder (Table 4). On the other hand, the latter was able to accumulate a significantly larger number of pieces per load, resulting in a larger load volume—although that took a longer time. The capacity of medium yarders to collect more pieces per load was the result of these machines being equipped with wider-opening grapples than were installed on heavy yarders. Heavy yarders worked longer shifts and had higher utilization, although the differences were small. Line change was faster for the heavy yarders, likely because they worked on shorter distances. However, heavy yarders changed lines more often and the incidence of line change time over total time was the same for both yarder types. Heavy yarders experienced fewer but longer delay events, with the same outcome of no difference between yarder types for the incidence of downtime. As expected, productivity was significantly higher for heavy yarders, as the combined result of stronger winches, faster line speed, larger piece size, and shorter extraction distance. The productive edge of heavy yarders was 25% and 17%, depending on whether delays were included or not.
The net productivity of teams 1, 4, 6, and 8 was between 20% and 30% higher than the grand average, and the difference was significant. While these differences could partly depend on better working conditions, they hinted at the effect of operator skills on operation performance. Therefore, these teams were marked as “top teams”, and the group was tested as an independent variable in multiple regression analysis, in order to check if the effect of team choice was significant in addition to the effects of work conditions.
The model was highly significant, and could explain half of the variability in the data pool (Table 5). The relationships described by the model were all logical: productivity increased with piece volume and the number of pieces in a load, and decreased with both line length and stacking distance. Productivity was lower for the medium yarders, and the difference between the two yarder types increased with piece size, with heavy yarders performing increasingly better with larger trees, also because they were fitted with smaller grapples and may have encountered more difficulty when trying to accumulate many pieces in a single load. Top teams were more productive than the average, but their margin eroded with piece size, indicating that with a large piece size most operators can achieve a high productivity, and that skills are truly tested with small pieces rather than with large ones. The model was successfully validated. Reserved data were predicted with an error of 0.3%, and the difference between actual and predicted productivity figures was not significant (p = 0.6943).
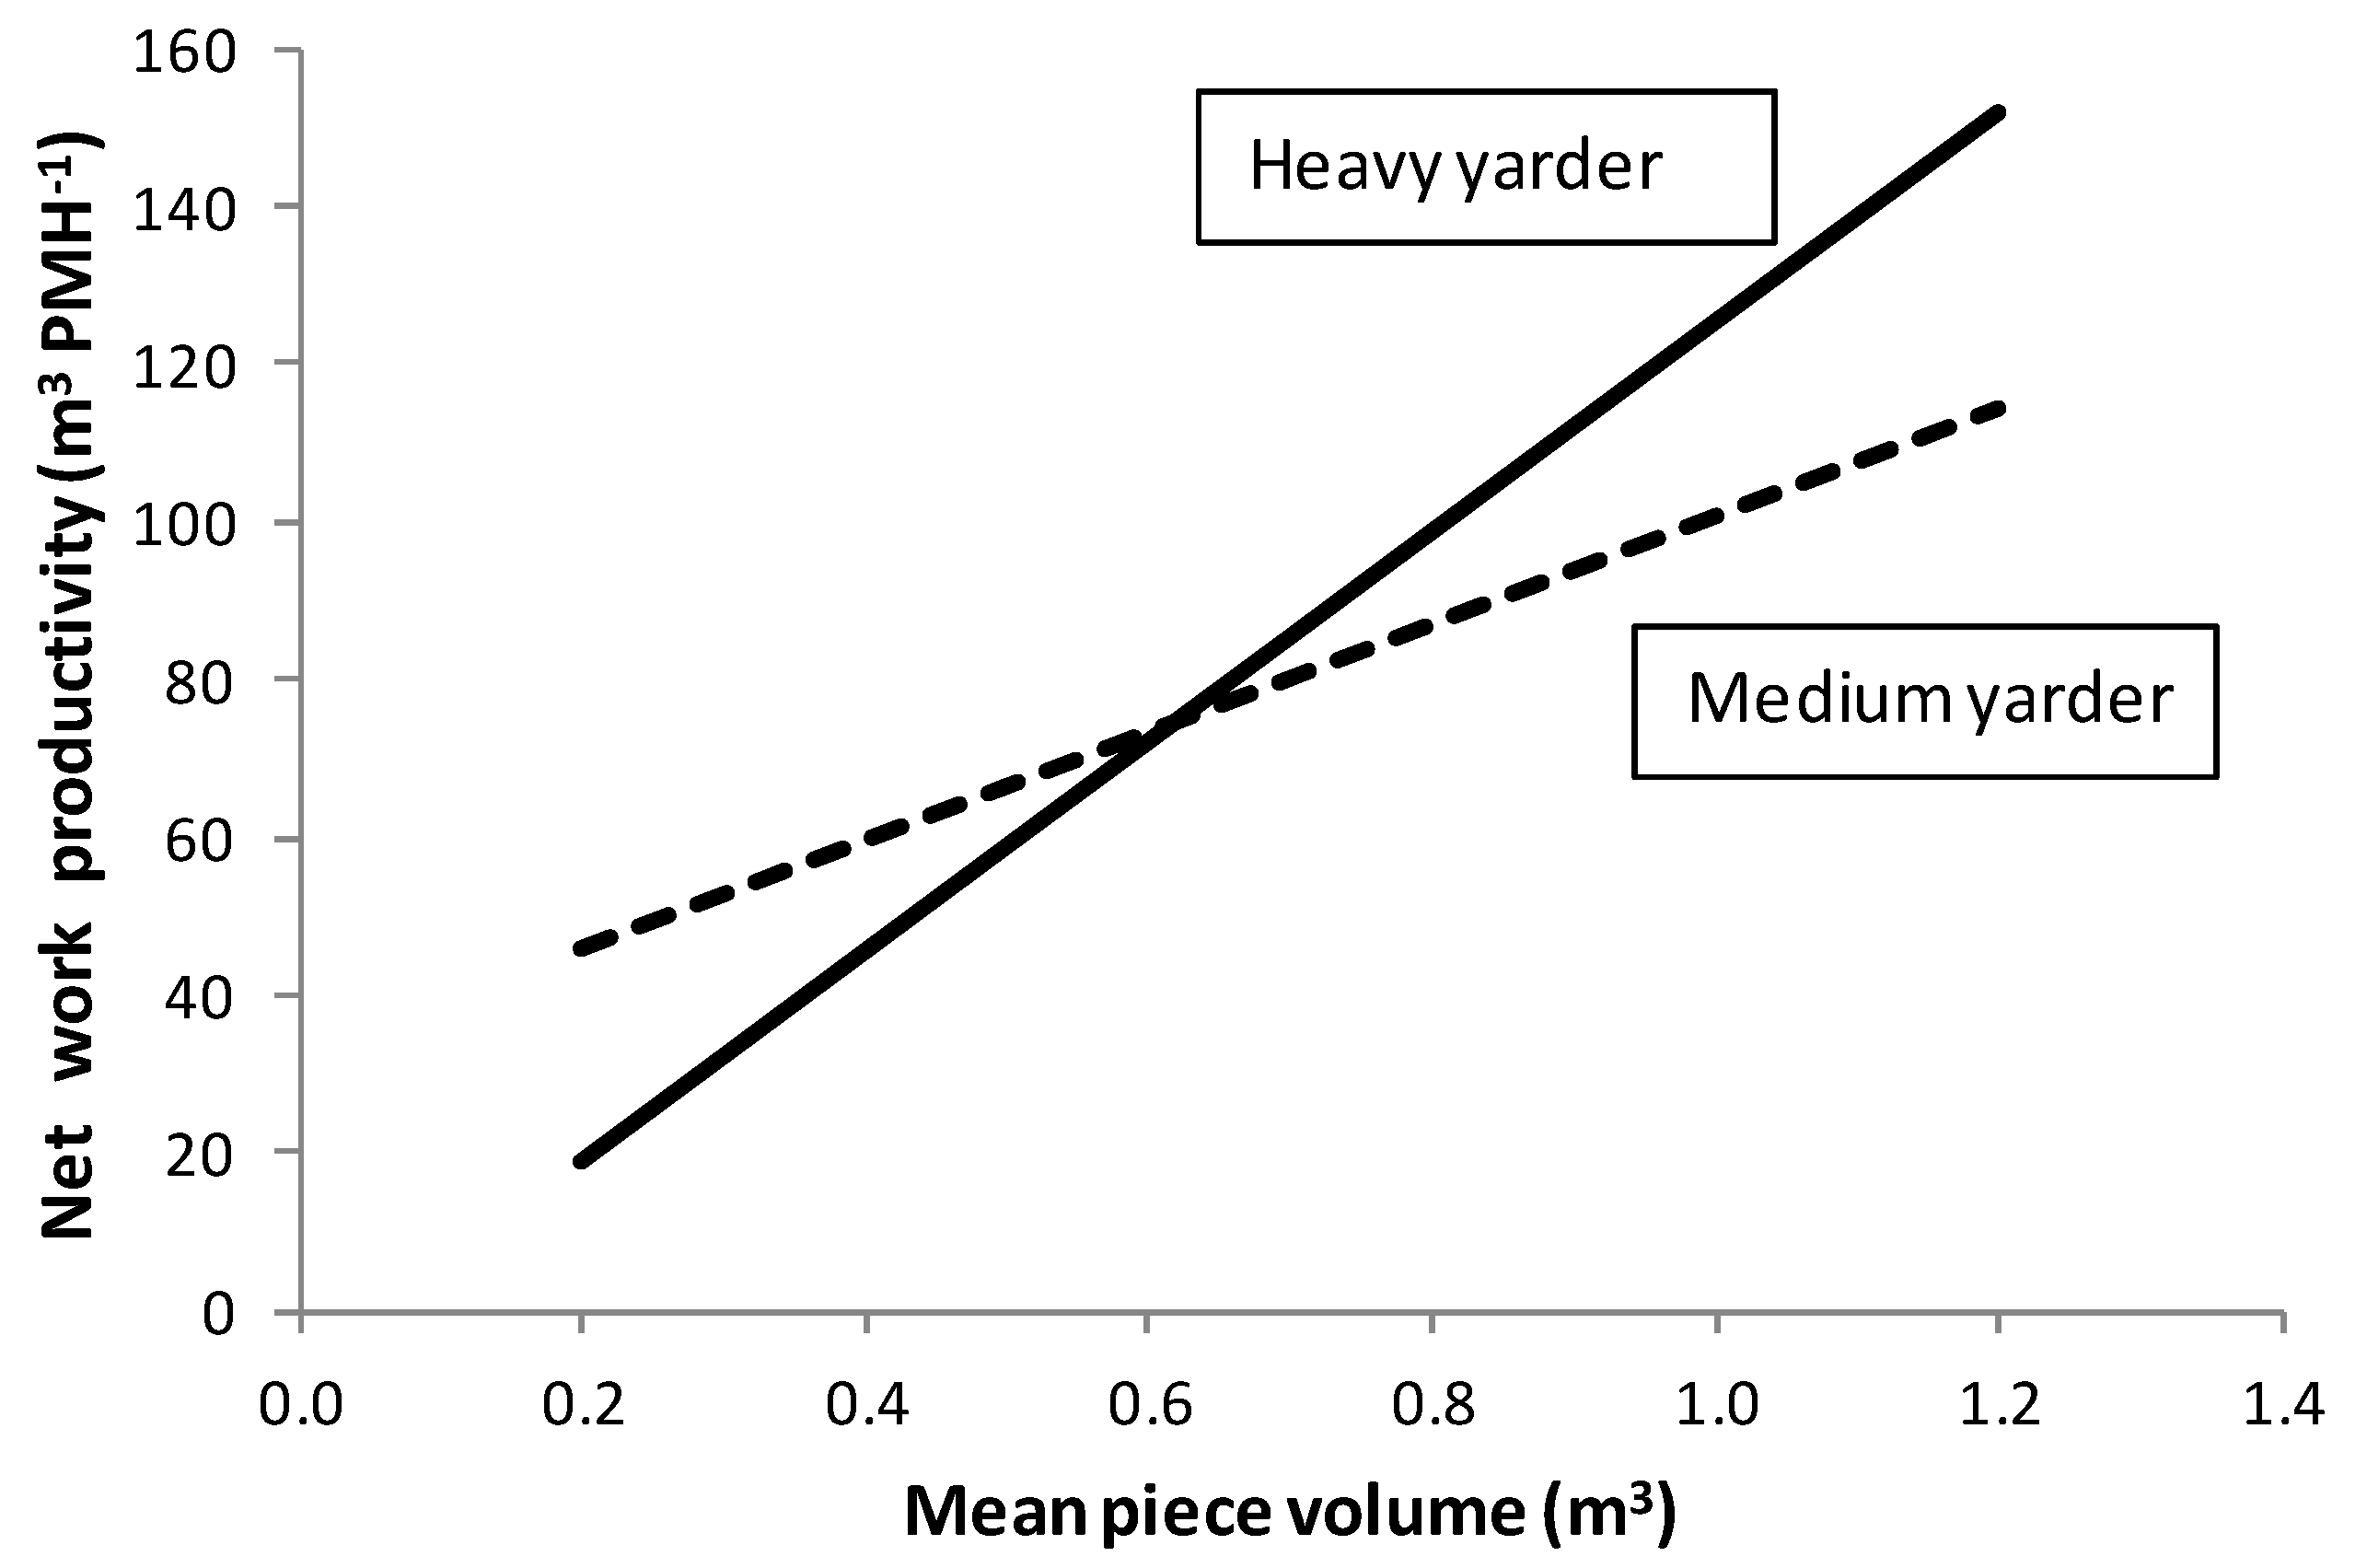
The model was used to estimate a break-even piece size between the two yarder types. The calculation was conducted under the following hypotheses: line length = 100 m, stacking distance = 20 m, use of a standard team (not a top team), and a number of pieces per load that was found to be stable at 4.1 for the heavy yarder, and varied according to the following equation for the medium yarder: n° of pieces = 6.88 – 2.73 piece volume in m3. The graph suggests that heavy yarders should be preferably deployed on those sites where mean piece volume is larger than 0.6 m3 (Figure 5). Of course, this is true for medium yarders with a larger grapple than installed on heavy yarders, and it is likely that the results will change if heavy yarders will also be equipped with a wide-opening grapple.
4. Discussion
Firstly, it is important to state the limitations of the study upfront, namely: (a) the observational character of the experiment, (b) the recording of data directly by operators, and (c) the inaccuracy inherent to some of the record types.
The observational character of the experiment is the inevitable consequence of conducting a long-term study of commercial operations, which was necessary to reflect realistic work conditions and to accumulate a very large number of observations. This study would have not been sustainable if experimental conditions had to be controlled. In fact, the very large number of observations gathered with this study is very likely to counteract the shortcomings of an unbalanced dataset, since treatment balance is especially critical with small datasets, while large datasets are less sensitive to imbalance, and in fact they are often imbalanced without much prejudice to the quality of results [51].
The recording of data directly by operators is likely to result in some loss of accuracy, because operators cannot be as skillful and motivated as professional researchers [52]. Unfortunately, it would have been too expensive to hire 12 researchers for over 6 months, and the only alternative to investing operators with data collection would have been that of resorting to automatic data collection [53]. However, automatic data collection systems cannot collect all necessary data, and still need operator input, although much reduced [54,55]. In order to limit the risk for gross inaccuracies, operators were carefully trained and supervised, and the data collection routine was simplified as much as possible [56].
The simplification of the data collection process actually brings the discussion to the third limitation, consisting of the use of inherently inaccurate indicators. That is the case of piece volume and line length. Adopting the mean piece volume of four loads and applying that figure to over 90 loads is likely to result in some error, and so does the adoption of total line length as the reference distance for all turns extracted on that given line. On the other hand, both errors are likely contained, because of the relatively homogeneous stem size characterizing most plantation compartments, and because of the general practice of moving stems downhill and towards the tail anchor during pre-bunching.
Without accepting these limitations, it would have been very difficult to study multiple teams and collect a very large number of observations. While work study theory recommends that models are built using large data pools obtained by sampling many different operators [57], the reality is that most of the available forest engineering bibliography consists of case-studies [58], with few notable exceptions [50,59]. This study fulfils both canonical requirements for producing a reliable model, and that is confirmed by the results of the statistical analysis. While data imbalance and various errors may have weakened the accuracy of the results, the study is still able to determine the effect of the most important variables that affect productivity, and offers a regression model that is highly significant, accounts for 50% of the total variability in the dataset, and is validated with a non-significant error estimated at less than 1%.
The reference figures presented in this study substantiate recent claims about the very high productivity of the new grapple yarding system. Such encouraging results confirm the inherent potential of the new technology, but depend at least in part on the short extraction distance and the benefits of pre-bunching, which has been shown to increase yarder productivity by more than 30% [33,34]. On the other hand, piece size is much smaller than reported in New Zealand or US studies, and offers a better representation of black wattle and fast-growing hardwood plantations in general [60].
The productivity levels recorded in this study compare quite well with the figures reported in other previous studies of similar grapple yarders, swing yarders, and excavator-based un-guyed yarders (Table 6). The closest match is the study by Amishev and Evanson [34], reporting a productivity of 86 m3 PMH−1. When the model developed in this study is used to calculate yarder productivity under the same line length and piece size conditions, the result is 83 and 98 m3 PMH−1 for the medium and the heavy yarders, respectively. This may support the general validity of our productivity model.
This model also includes the effect of operator proficiency, indicating that particularly skillful teams can outperform average teams by 10% to 30%, depending on piece size and yarder type. Such figures are fully compatible with those reported for Finnish harvester operators by Ovaskainen et al. [64] and Karha et al. [65], who also indicated a bracket between 20% and 40%. While it may be difficult to rate operators correctly [66], knowledge of possible variations is important when assessing between-team variability for planning purposes [67].
In that regard, it is also important to remark that the team that clearly emerged above all the others for minimum downtime was not among the teams that were rated as top teams for their high net productivity and fast work pace. This simple fact suggests that dexterity and good time management represent different skills, which may not be concurrent within the same team. In fact, any future upgrades should target time management and utilization rather than net productivity, since the latter is already in line with any of the documented figures or well above them, whereas utilization and shift duration are still relatively small and could be improved.
The model can also discriminate between yarder types, indicating preferential conditions for yarder type selection. Of course, the differences found with the model are only valid for the specific machine configurations covered with the study, and may vary if specific improvements were made on the yarders. That is specifically the case of grapple selection: the better performance of medium yarders with smaller trees is due at least in part to the wider opening grapple they received, and therefore one may improve the small-tree performance of heavy yarders by fitting them with a larger grapple.
However, the model cannot account for the effect of slope gradient and ruggedness, but that might be due to the relatively small field of variation for both factors rather than to poor model characteristics. In fact, both slope gradient and terrain ruggedness are somewhat moderate, which is the condition for effective pre-bunching. On steeper slopes, one may resort to winch-assist technology for pre-bunching, as it has already been done in other cases [35]. While terrain conditions would be suitable for the introduction of a complete winch-assist ground-based harvesting system, the need for minimizing soil impacts suggests sticking with the current grapple yarder system. In this case, a valid compromise could be reached by introducing a winch-assist feller-buncher to replace manual felling and separate pre-bunching. This measure may dramatically increase productivity and worker safety. However, winch-assist ground-based harvesting systems require highly specialized personnel, which may represent a limiting factor in developing economies [68].
5. Conclusions
The productivity models estimated in this study are especially robust, because they were obtained from a long-term study that covered multiple teams and accumulated an exceptionally large number of observations, as prescribed by the classic canons of model development. The figures and the model offered in this paper fill an urgent knowledge need, as the new grapple yarding technique is becoming increasingly popular and attracts growing attention. While gained specifically on one yarder make and plantation type, the information in this study can be extended to other similar machines and plantations, because the sheer volume of data allows cautious generalization.
Acknowledgments
Special thanks are due to the Grand Perfect Pusaka Sdn Bhd that allowed access to their operations, as part of a farseeing strategy to pursue innovation and excellence through research. We also thank all harvesting supervisors and managers at Power Brite Sdn Bhd for their commitment and dedication during the lengthy data collection process, Peter Lai Soon for helping with training yarder operators for the study, and Julia Jita for her kind assistance with data filing. This project has been partly supported by the Bio Based Industries Joint Undertaking under the European Union’s Horizon 2020 research and innovation program under grant agreement No. 720757 Tech4Effect.
Author Contributions
Riaan Engelbrecht, Andrew McEwan and Raffaele Spinelli conceived and designed the experiment; Riaan Engelbrecht collected the data in cooperation with Andrew McEwan and Raffaele Spinelli; Raffaele Spinelli and Andrew McEwan processed the data, in cooperation with Riaan Engelbrecht; Riaan Engelbrecht, Andrew McEwan and Raffaele Spinelli wrote the paper.
Conflicts of Interest
The authors declare no conflict of interest.
References
- Campinhos, E., Jr. Sustainable plantations of high-yield shape Eucalyptus trees for production of fiber: The Aracruz case. New For. 1999, 17, 129–143. [Google Scholar] [CrossRef]
- Stape, J.; Binkley, D.; Ryan, M.; Fonseca, S.; Loos, R.; Takahashi, E.; Silva, C.; Silva, S.; Hakamada, R.; Ferreira, J.; et al. The Brazil Eucalyptus Potential Productivity Project: Influence of water, nutrients and stand uniformity on wood production. For. Ecol. Manag. 2010, 259, 1684–1694. [Google Scholar] [CrossRef]
- Siry, J.; Cubbage, F.; Ahmed, M. Sustainable forest management: Global trends and opportunities. For. Policy Econ. 2005, 7, 551–561. [Google Scholar] [CrossRef]
- Lonnstedt, L.; Sedjo, R. Forestland ownership changes in the United States and Sweden. For. Policy Econ. 2012, 14, 19–27. [Google Scholar] [CrossRef]
- Laaksonen-Craig, S. Foreign direct investment in the forest sector: Implications for sustainable forest management in developed and developing countries. For. Policy Econ. 2004, 6, 359–370. [Google Scholar] [CrossRef]
- Sedjo, R. The potential of high-yield plantation forestry for meeting timber needs. New For. 1999, 17, 339–360. [Google Scholar] [CrossRef]
- Food and Agriculture Organization (FAO). Global Forest Resources Assessment 2015. Available online: http://www.fao.org/3/a-i4793e.pdf (accessed on 16 October 2017).
- Ragauskas, A.; Williams, C.; Davison, B.; Britovsek, G.; Cairney, J.; Eckert, C.; Frederick, W., Jr.; Hallett, J.; Leak, D.; Liotta, C.; et al. The path forward for biofuels and biomaterials. Science 2006, 311, 484–489. [Google Scholar] [CrossRef] [PubMed]
- Sohngen, B.; Mendelsohn, R.; Sedjo, R. Forest management, conservation, and global timber markets. Am. J. Agric. Econ. 1999, 81, 1–13. [Google Scholar] [CrossRef]
- Bremer, L.; Farley, A. Does plantation forestry restore biodiversity or create green deserts? A synthesis of the effects of land-use transitions on plant species richness. Biodivers. Conserv. 2010, 19, 3893–3915. [Google Scholar] [CrossRef]
- Berndes, G.; Hoogwijk, M.; Van den Broek, R. The contribution of biomass in the future global energy supply: A review of 17 studies. Biomass Bioenergy 2003, 25, 1–28. [Google Scholar] [CrossRef]
- Charnley, S. Industrial plantation forestry. Do local communities benefit? J. Sustain. For. 2005, 21, 35–57. [Google Scholar] [CrossRef]
- Paul, K.; Reeson, A.; Polglase, P.; Ritson, P. Economic and employment implications of a carbon market for industrial plantation forestry. Land Use Policy 2013, 30, 528–540. [Google Scholar] [CrossRef]
- Landry, J.; Chirwa, P. Analysis of the potential socio-economic impact of establishing plantation forestry on rural communities in Sanga district, Niassa province, Mozambique. Land Use Policy 2011, 28, 542–551. [Google Scholar] [CrossRef]
- Machado, R.; Conceição, S.; Leite, H.; de Souza, A.; Wolff, E. Evaluation of forest growth and carbon stock in forestry projects by system dynamics. J. Clean. Prod. 2015, 96, 520–530. [Google Scholar] [CrossRef]
- Rochedo, P.; Costa, I.; Império, M.; Hoffmann, B.; Merschmann, P.; Oliveira, C.; Szklo, A.; Schaeffer, R. Carbon capture potential and costs in Brazil. J. Clean. Prod. 2016, 131, 280–295. [Google Scholar] [CrossRef]
- Food and Agriculture Organization (FAO). Responsible Management of Planted Forests: Voluntary Guidelines. Available online: http://www.fao.org/docrep/009/j9256e/J9256E03.htm (accessed on 16 October 2017).
- Spinelli, R.; Magagnotti, N. The effects of introducing modern technology on the financial, labour and energy performance of forest operations in the Italian Alps. For. Policy Econ. 2011, 13, 520–524. [Google Scholar] [CrossRef]
- Visser, R.; Stampfer, K. Expanding ground-based harvesting onto steep terrain: A review. Croat. J. For. Eng. 2015, 36, 321–331. [Google Scholar]
- Visser, R.; Berkett, H. Effect of terrain steepness on machine slope when harvesting. Int. J. For. Eng. 2015, 26, 1–9. [Google Scholar] [CrossRef]
- Food and Agriculture Organization (FAO). Logging and Transport in Steep Terrain. Available online: http://www.fao.org/docrep/016/ap015e/ap015e00.pdf (accessed on 16 October 2017).
- Montorselli, N.; Lombardini, C.; Magagnotti, N.; Marchi, E.; Neri, F.; Picchi, G.; Spinelli, R. Relating safety, productivity and company type for motor-manual logging operations in the Italian Alps. Accid. Anal. Prev. 2010, 42, 2013–2017. [Google Scholar] [CrossRef] [PubMed]
- Pinard, M.; Barker, M.; Tay, J. Soil disturbance and post-logging forest recovery on bulldozer paths in Sabah, Malaysia. For. Ecol. Manag. 2000, 130, 213–225. [Google Scholar] [CrossRef]
- Nahuelhual, L.; Carmona, A.; Lara, A.; Echeverría, C.; González, M. Land-cover change to forest plantations: Proximate causes and implications for the landscape in south-central Chile. Landsc. Urban Plan. 2012, 107, 12–20. [Google Scholar] [CrossRef]
- Raymond, K. Innovation to increase profitability of steep terrain harvesting in New Zealand. N. Z. J. For. 2012, 57, 19–23. [Google Scholar]
- Spinelli, R.; Visser, R.; Riond, C.; Magagnotti, N. A survey of logging contract rates in the southern European Alps. Small-Scale For. 2017, 16, 179–193. [Google Scholar] [CrossRef]
- FPInnovations Steep Slope Harvesting Initiative. Available online: http://www.coastforest.org/fpinnovations-steep-slope-harvesting-initiative/ (accessed on 13 October 2017).
- WorkSafe, B.C. Grapple Yarder and Supersnorkel Handbook; Workers’ Compensation Board: Richmond, BC, Canada, 1992; 196p.
- Howard, A. Production equations for grapple yarding in Coastal British Columbia. West. J. Appl. For. 1991, 6, 7–10. [Google Scholar]
- Studier, D.; Binkley, V. Cable Logging Systems. Division of Timber Management; USDA Forest Service: Portland, OR, USA, 1974; 190p.
- De Souza, A. A Study of Production and Ergonomic Factors in Grapple Yarding Operations Using an Electronic Data Logger System. Ph.D. Thesis, University of British Columbia, Vancouver, BC, Canada, 1983; 231p. [Google Scholar]
- Helton, J. A Comparison of Grapple Yarding and Choker Yarding in British Columbia. Master’s Thesis, University of New Brunswick, Fredericton, NB, Canada, 1985; 88p. [Google Scholar]
- Acuna, M.; Skinnell, J.; Evanson, T.; Mitchell, R. Bunching with a self-levelling feller-buncher on steep terrain for efficient yarder extraction. Croat. J. For. Eng. 2011, 32, 521–531. [Google Scholar]
- Amishev, D.; Evanson, T. Innovative methods for steep terrain harvesting. In Proceedings of the FORMEC 2010 Conference “Forest Engineering: Meeting the Needs of the Society and the Environment”, Padova, Italy, 11–14 July 2010. [Google Scholar]
- Visser, R.; Raymond, K.; Harrill, H. Mechanizing steep terrain harvesting operations. N. Z. J. For. 2014, 59, 3–8. [Google Scholar] [CrossRef]
- Cavalli, R. Prospects of research on cable logging in forest engineering community. Croat. J. For. Eng. 2012, 33, 339–356. [Google Scholar]
- Chua, A. More forest plantations. Sarawak Tribune, 2 December 1996. [Google Scholar]
- Pinard, M.; Putz, F.; Tay, J.; Sullivan, T. Creating timber harvesting guidelines for a reduced-impact logging project in Malaysia. J. For. 1995, 93, 41–45. [Google Scholar]
- Hoffmann, S.; Jaeger, D.; Lingenfelder, M.; Schoenherr, S. Analyzing the efficiency of start-up cable yarding crew in southern china under new forest management perspectives. Forests 2016, 7, 33. [Google Scholar] [CrossRef]
- Alpass, P. Alpine shovel yarders go international. S. Afr. For. Mag. 2010, 10, 14–15. [Google Scholar]
- Torgersen, H.; Lisland, T. Excavator-based cable logging and processing system: A Norwegian case study. Int. J. For. Eng. 2002, 13, 11–16. [Google Scholar]
- Devlin, G.; Klvač, R. How technology can improve the efficiency of excavator-base cable harvesting for potential biomass extraction—A woody productivity resource and cost analysis for Ireland. Energies 2014, 7, 8374–8395. [Google Scholar] [CrossRef]
- Talbot, B.; Ottaviani-Aalmo, G.; Stampfer, K. Productivity analysis of an un-guyed integrated yarder-processor with running skyline. Croat. J. For. Eng. 2014, 35, 201–210. [Google Scholar]
- Talbot, B.; Stampfer, K.; Visser, R. Machine function integration and its effect on the performance of a timber yarding and processing operation. Biosyst. Eng. 2015, 135, 10–20. [Google Scholar] [CrossRef]
- Sappington, J.; Longshore, K.; Thompson, D. Quantifying landscape ruggedness for animal habitat analysis: A case study using bighorn sheep in the Mojave Desert. J. Wildl. Manag. 2007, 71, 1419–1426. [Google Scholar] [CrossRef]
- Statistical Analysis System (SAS). StatView Reference; SAS Publishing: Cary, NC, USA, 1999; 528p. [Google Scholar]
- Olsen, E.; Hossain, M.; Miller, M. Statistical Comparison of Methods Used in Harvesting Work Studies; Oregon State University, Forest Research Laboratory: Corvallis, OR, USA, 1998; 31p. [Google Scholar]
- Howard, A. Validating forest harvesting production equations. Trans. ASAE 1992, 35, 1683–1687. [Google Scholar] [CrossRef]
- Adebayo, A.; Han, H.S.; Johnson, L. Productivity and cost of cut-to-length and whole-tree harvesting in a mixed-conifer stand. For. Prod. J. 2007, 57, 59–69. [Google Scholar]
- Spinelli, R.; Hartsough, B.; Magagnotti, N. Productivity standards for harvesters and processors in Italy. For. Prod. J. 2010, 60, 226–235. [Google Scholar] [CrossRef]
- Payne, R. General balance, large data sets and extensions to unbalanced treatment structures. Comput. Stat. Data Anal. 2003, 44, 297–304. [Google Scholar] [CrossRef]
- Nuutinen, Y.; Väätäinen, K.; Heinonen, J.; Asikainen, A.; Röser, D. The accuracy of manually recorded time study data for harvester operation shown via simulator screen. Silv. Fenn. 2008, 42, 63–72. [Google Scholar] [CrossRef]
- Manner, J.; Nordfjell, T.; Lindroos, O. Automatic load level follow-up of forwarders’ fuel and time consumption. Int. J. For. Eng. 2016, 27, 151–160. [Google Scholar] [CrossRef]
- Holzleitner, F.; Kanzian, C.; Höller, N. Monitoring the chipping and transportation of wood fuels with a fleet management system. Silv. Fenn. 2013, 47, 11. [Google Scholar] [CrossRef]
- Spinelli, R.; Magagnotti, N.; Pari, L.; De Francesco, F. A comparison of tractor-trailer units and high-speed forwarders used in Alpine forestry. Scand. J. For. Res. 2015, 30, 470–477. [Google Scholar] [CrossRef]
- Spinelli, R.; Laina-Relaño, R.; Magagnotti, N.; Tolosana, E. Determining observer and method effects on the accuracy of elemental time studies in forest operations. Balt. For. 2013, 19, 301–306. [Google Scholar]
- Harstela, P. Work studies in forestry. Silv. Carelica 1991, 18, 41. [Google Scholar]
- Lindroos, O.; Cavalli, R. Cable yarding productivity models: A systematic review over the period 2000–2011. Int. J. For. Eng. 2016, 27, 79–94. [Google Scholar] [CrossRef]
- Eriksson, M.; Lindroos, O. Productivity of harvesters and forwarders in CTL operations in northern Sweden based on large follow-up datasets. Int. J. For. Eng. 2014, 25, 179–200. [Google Scholar] [CrossRef]
- Spinelli, R.; Ward, S.; Owende, P. A harvest and transport cost model for Eucalyptus spp. fast-growing short rotation plantations. Biomass Bioenergy 2009, 33, 1265–1270. [Google Scholar] [CrossRef]
- A mechanized swing yarder operation in New Zealand. Available online: http://fgr.nz/documents/download/4592 (accessed on 16 October 2017).
- Madill 122 Interlock swing yarder. Available online: http://fgr.nz/documents/download/4844 (accessed on 16 October 2017).
- Largo, S.; Han, H.S.; Johnson, L. Productivity and cost evaluation for non-guyline yarders in northern Idaho. In Proceedings of the COFE Conference “Machines and People: The Interface”, Hot Springs, AK, USA, 27–30 April 2004. [Google Scholar]
- Ovaskainen, H.; Uusitalo, J.; Väätäinen, K. Characteristics and significance of a harvester operator’s working technique in thinnings. Int. J. For. Eng. 2004, 15, 67–77. [Google Scholar]
- Kärhä, K.; Rönkö, E.; Gunne, S. Productivity and cutting costs of thinning harvesters. Int. J. For. Eng. 2004, 15, 43–55. [Google Scholar]
- Purfürst, T.; Lindroos, O. The correlation between long-term productivity and short-term performance ratings of harvester operators. Croat. J. For. Eng. 2011, 32, 509–519. [Google Scholar]
- Mola-Yudego, B.; Picchi, G.; Röser, D.; Spinelli, R. Assessing chipper productivity and operator effects in forest biomass operations. Silv. Fenn. 2010, 49, 14. [Google Scholar] [CrossRef]
- Raymond, K. Innovative harvesting solutions: A step change harvesting research programme. N. Z. J. For. 2010, 55, 4–9. [Google Scholar]
Figure 1.
Location of the study sites.
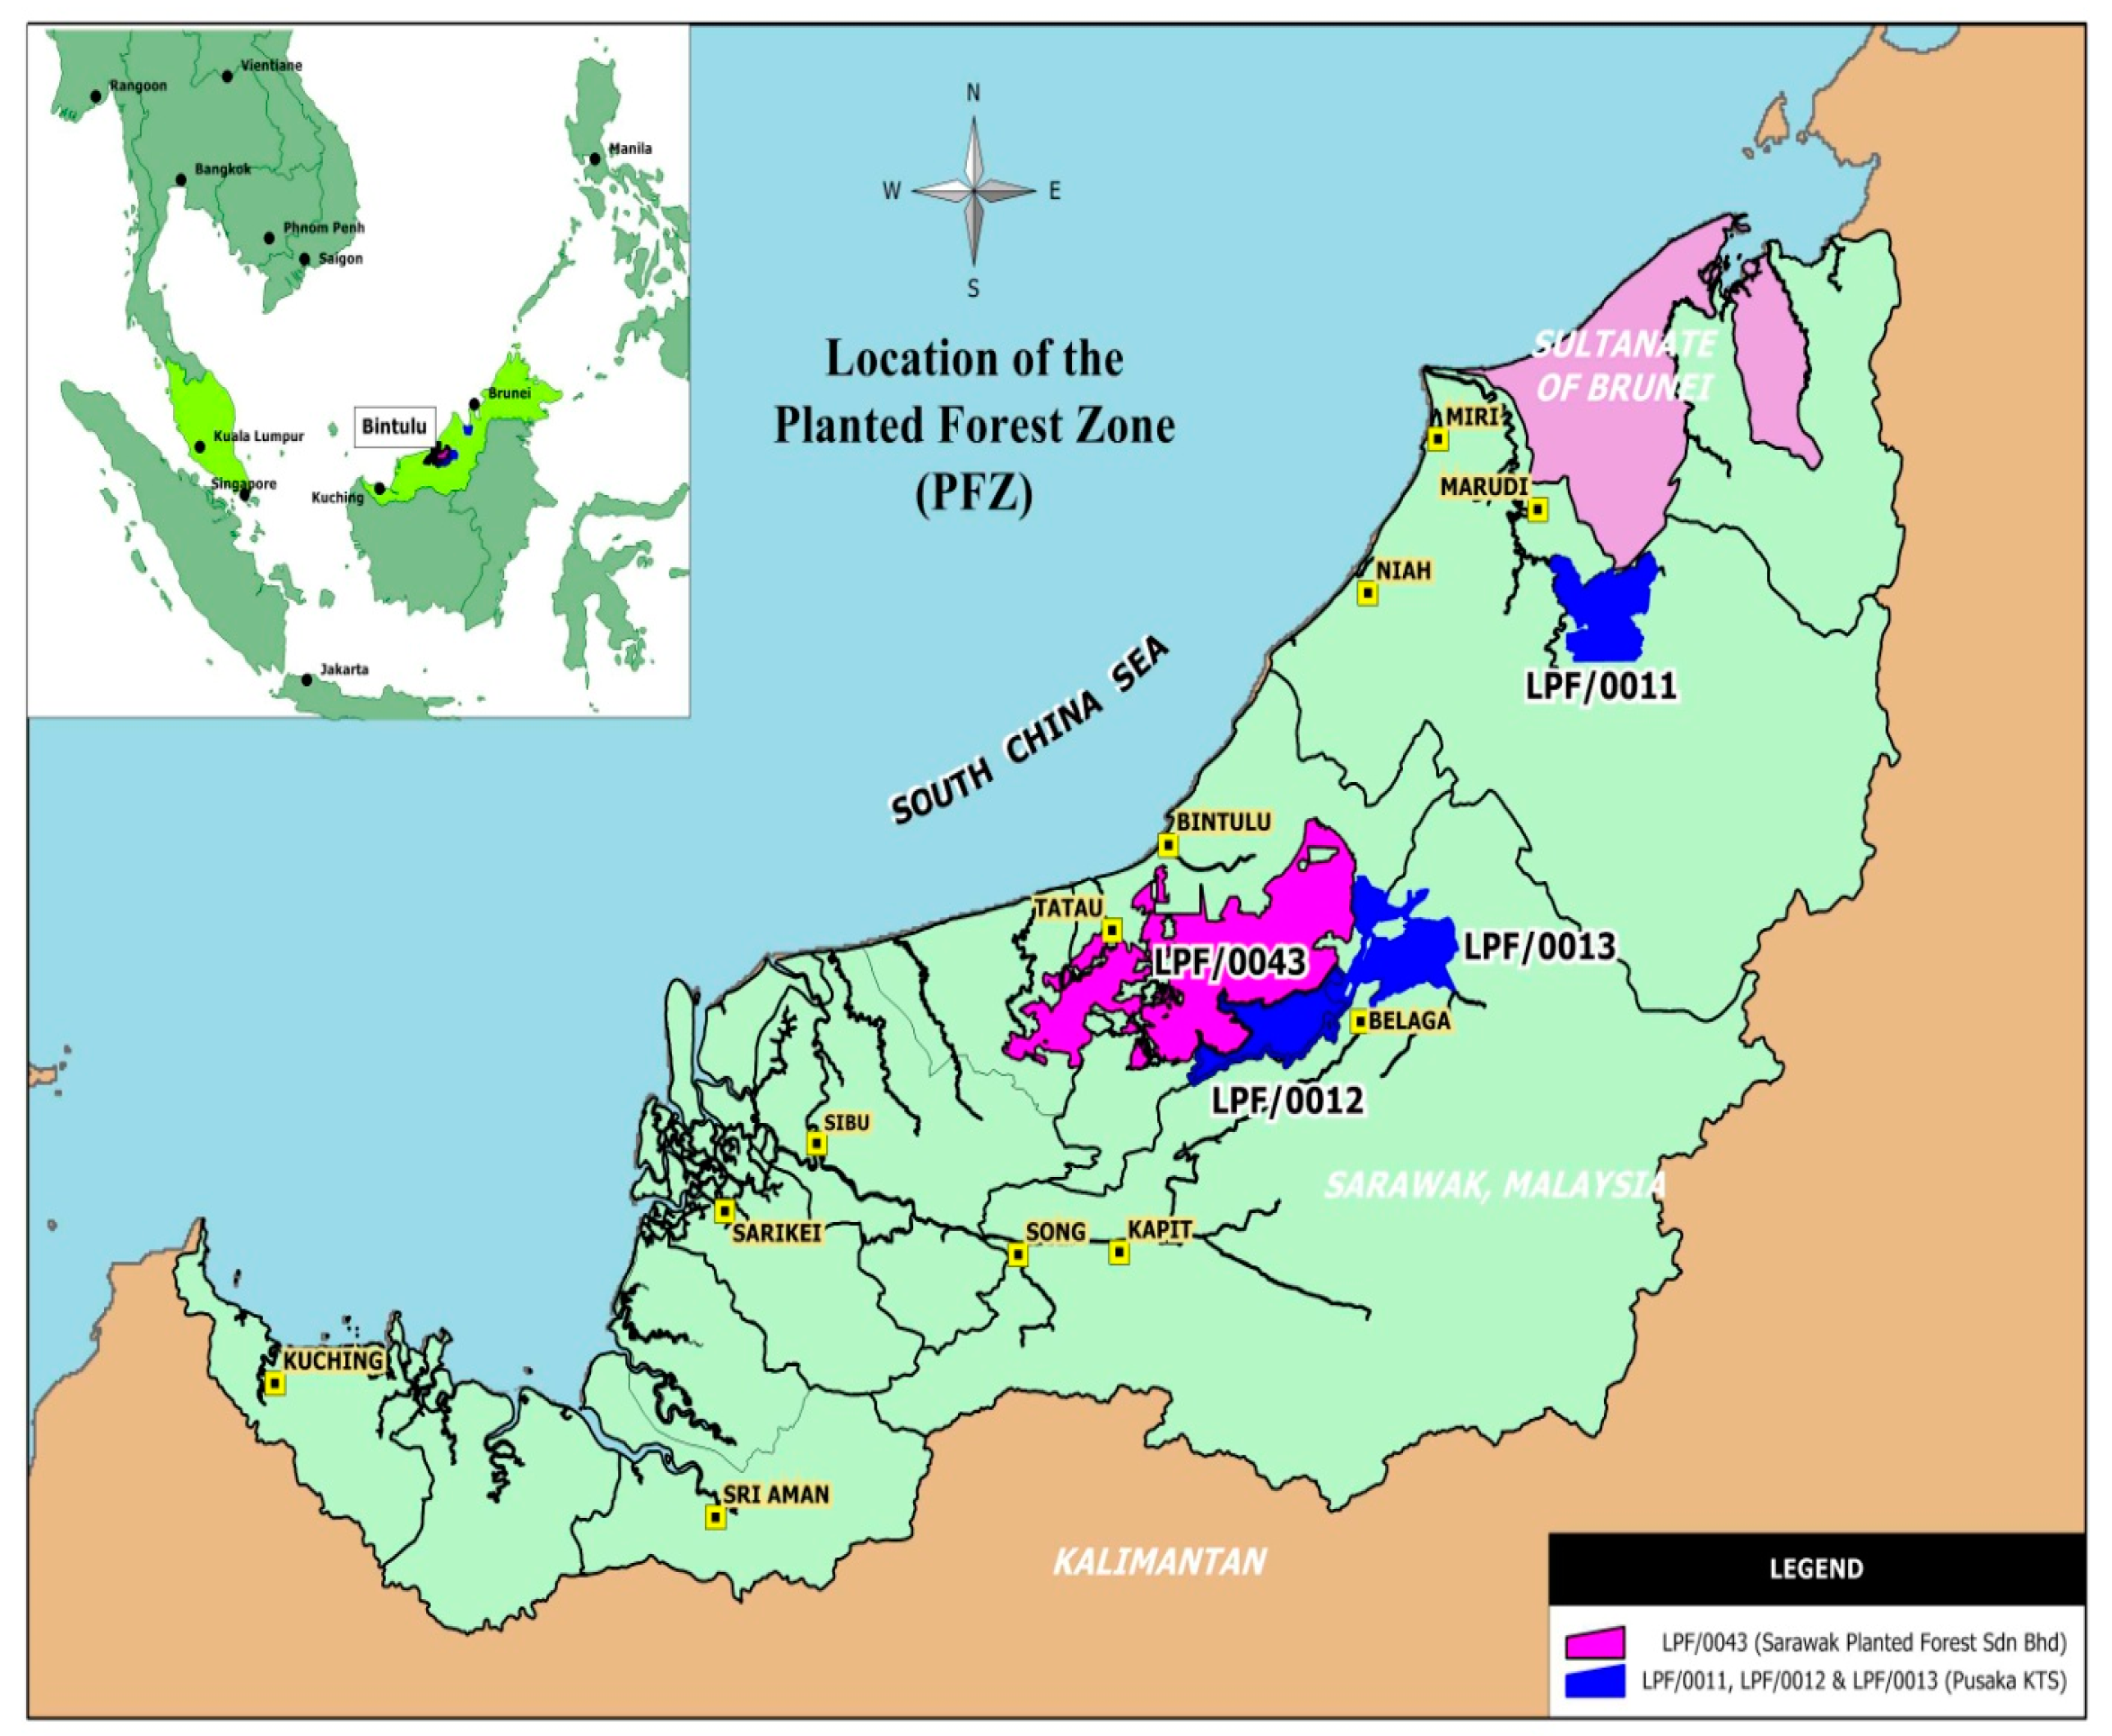
Figure 2.
One of the excavator-based un-guyed grapple yarders used in the study (shotgun configuration).
Figure 2.
One of the excavator-based un-guyed grapple yarders used in the study (shotgun configuration).
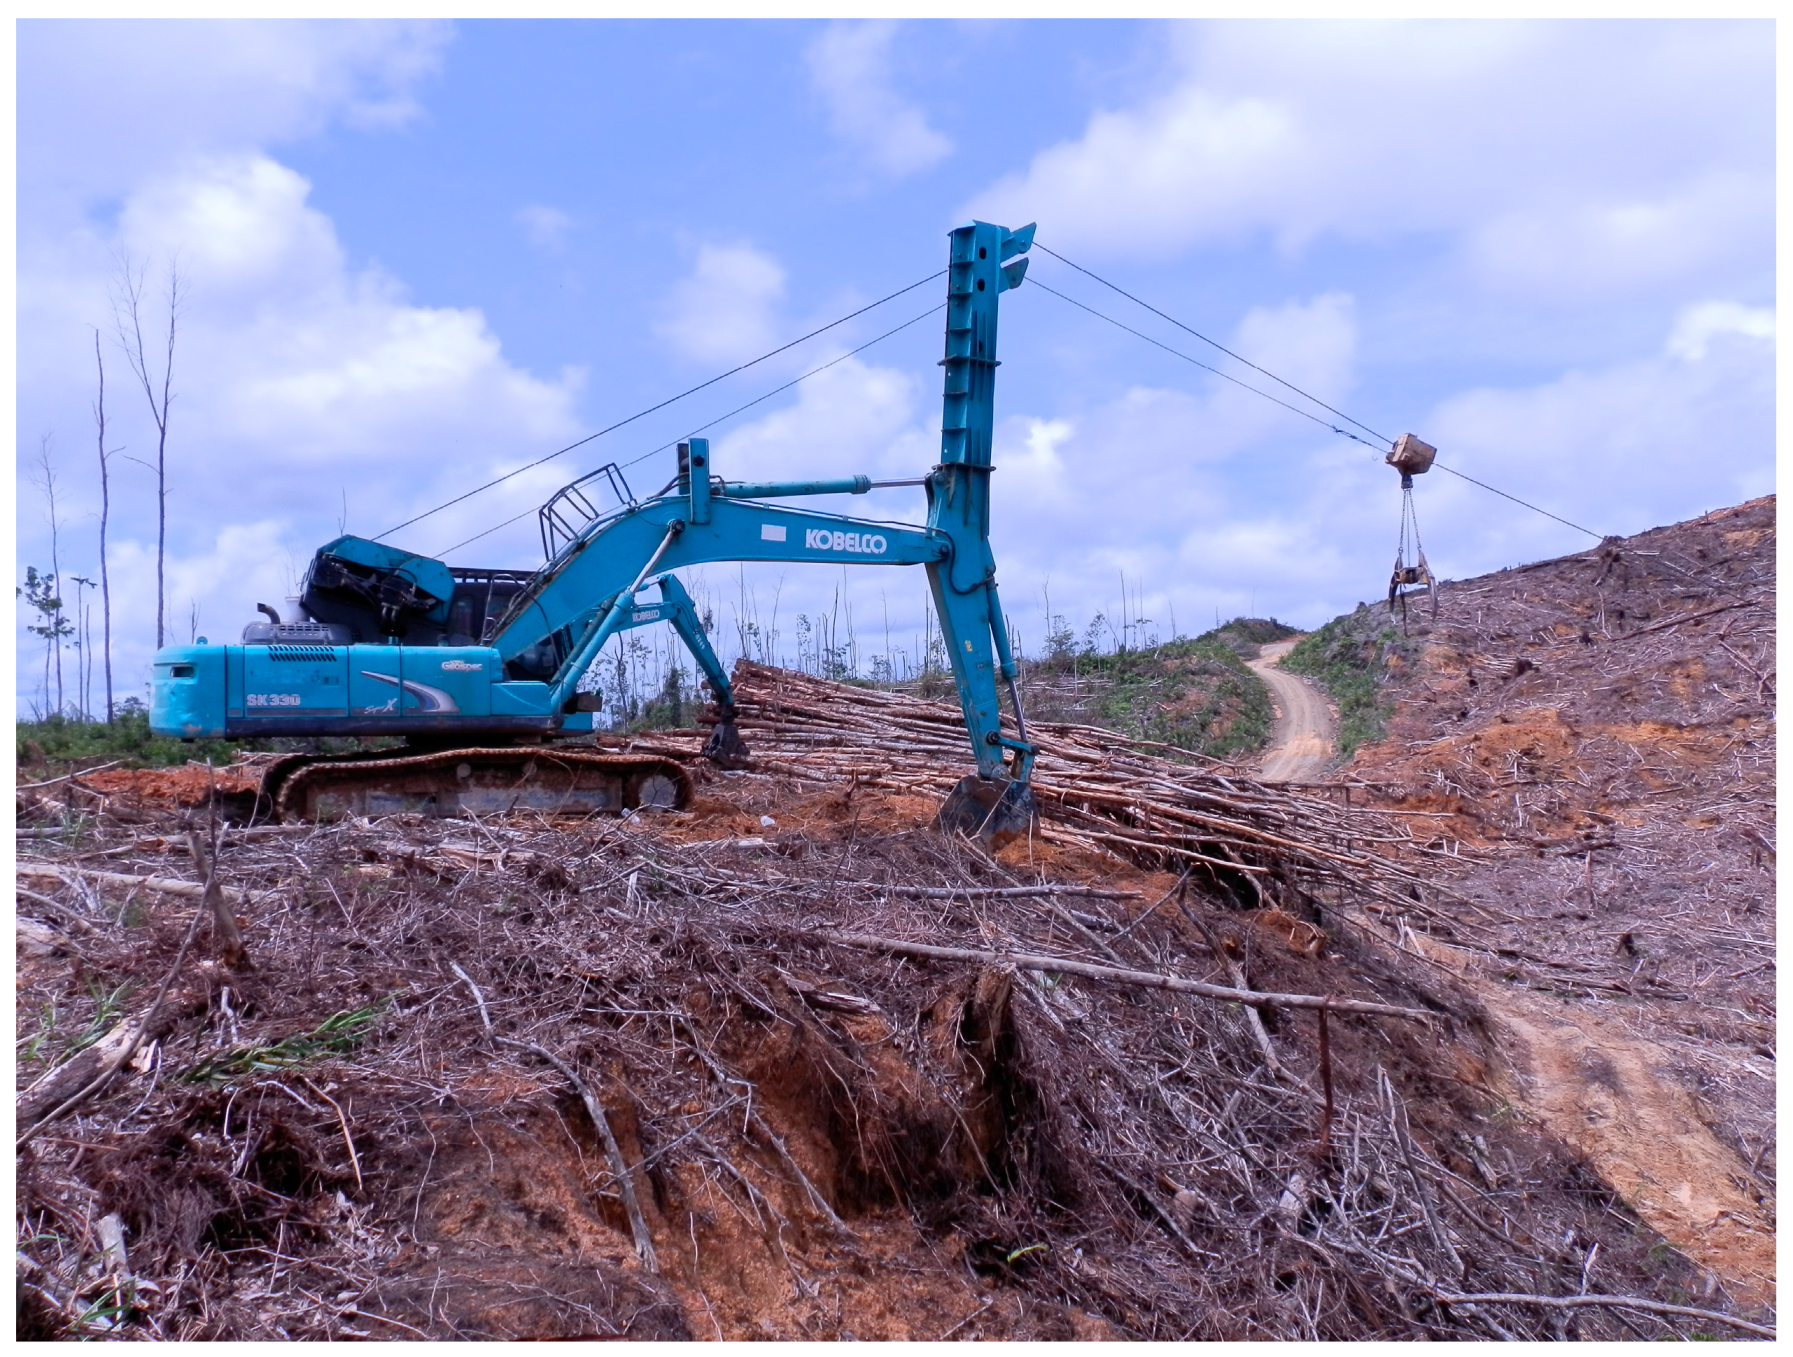
Figure 3.
Position of the study compartments and of the 12 machine teams involved with the study.
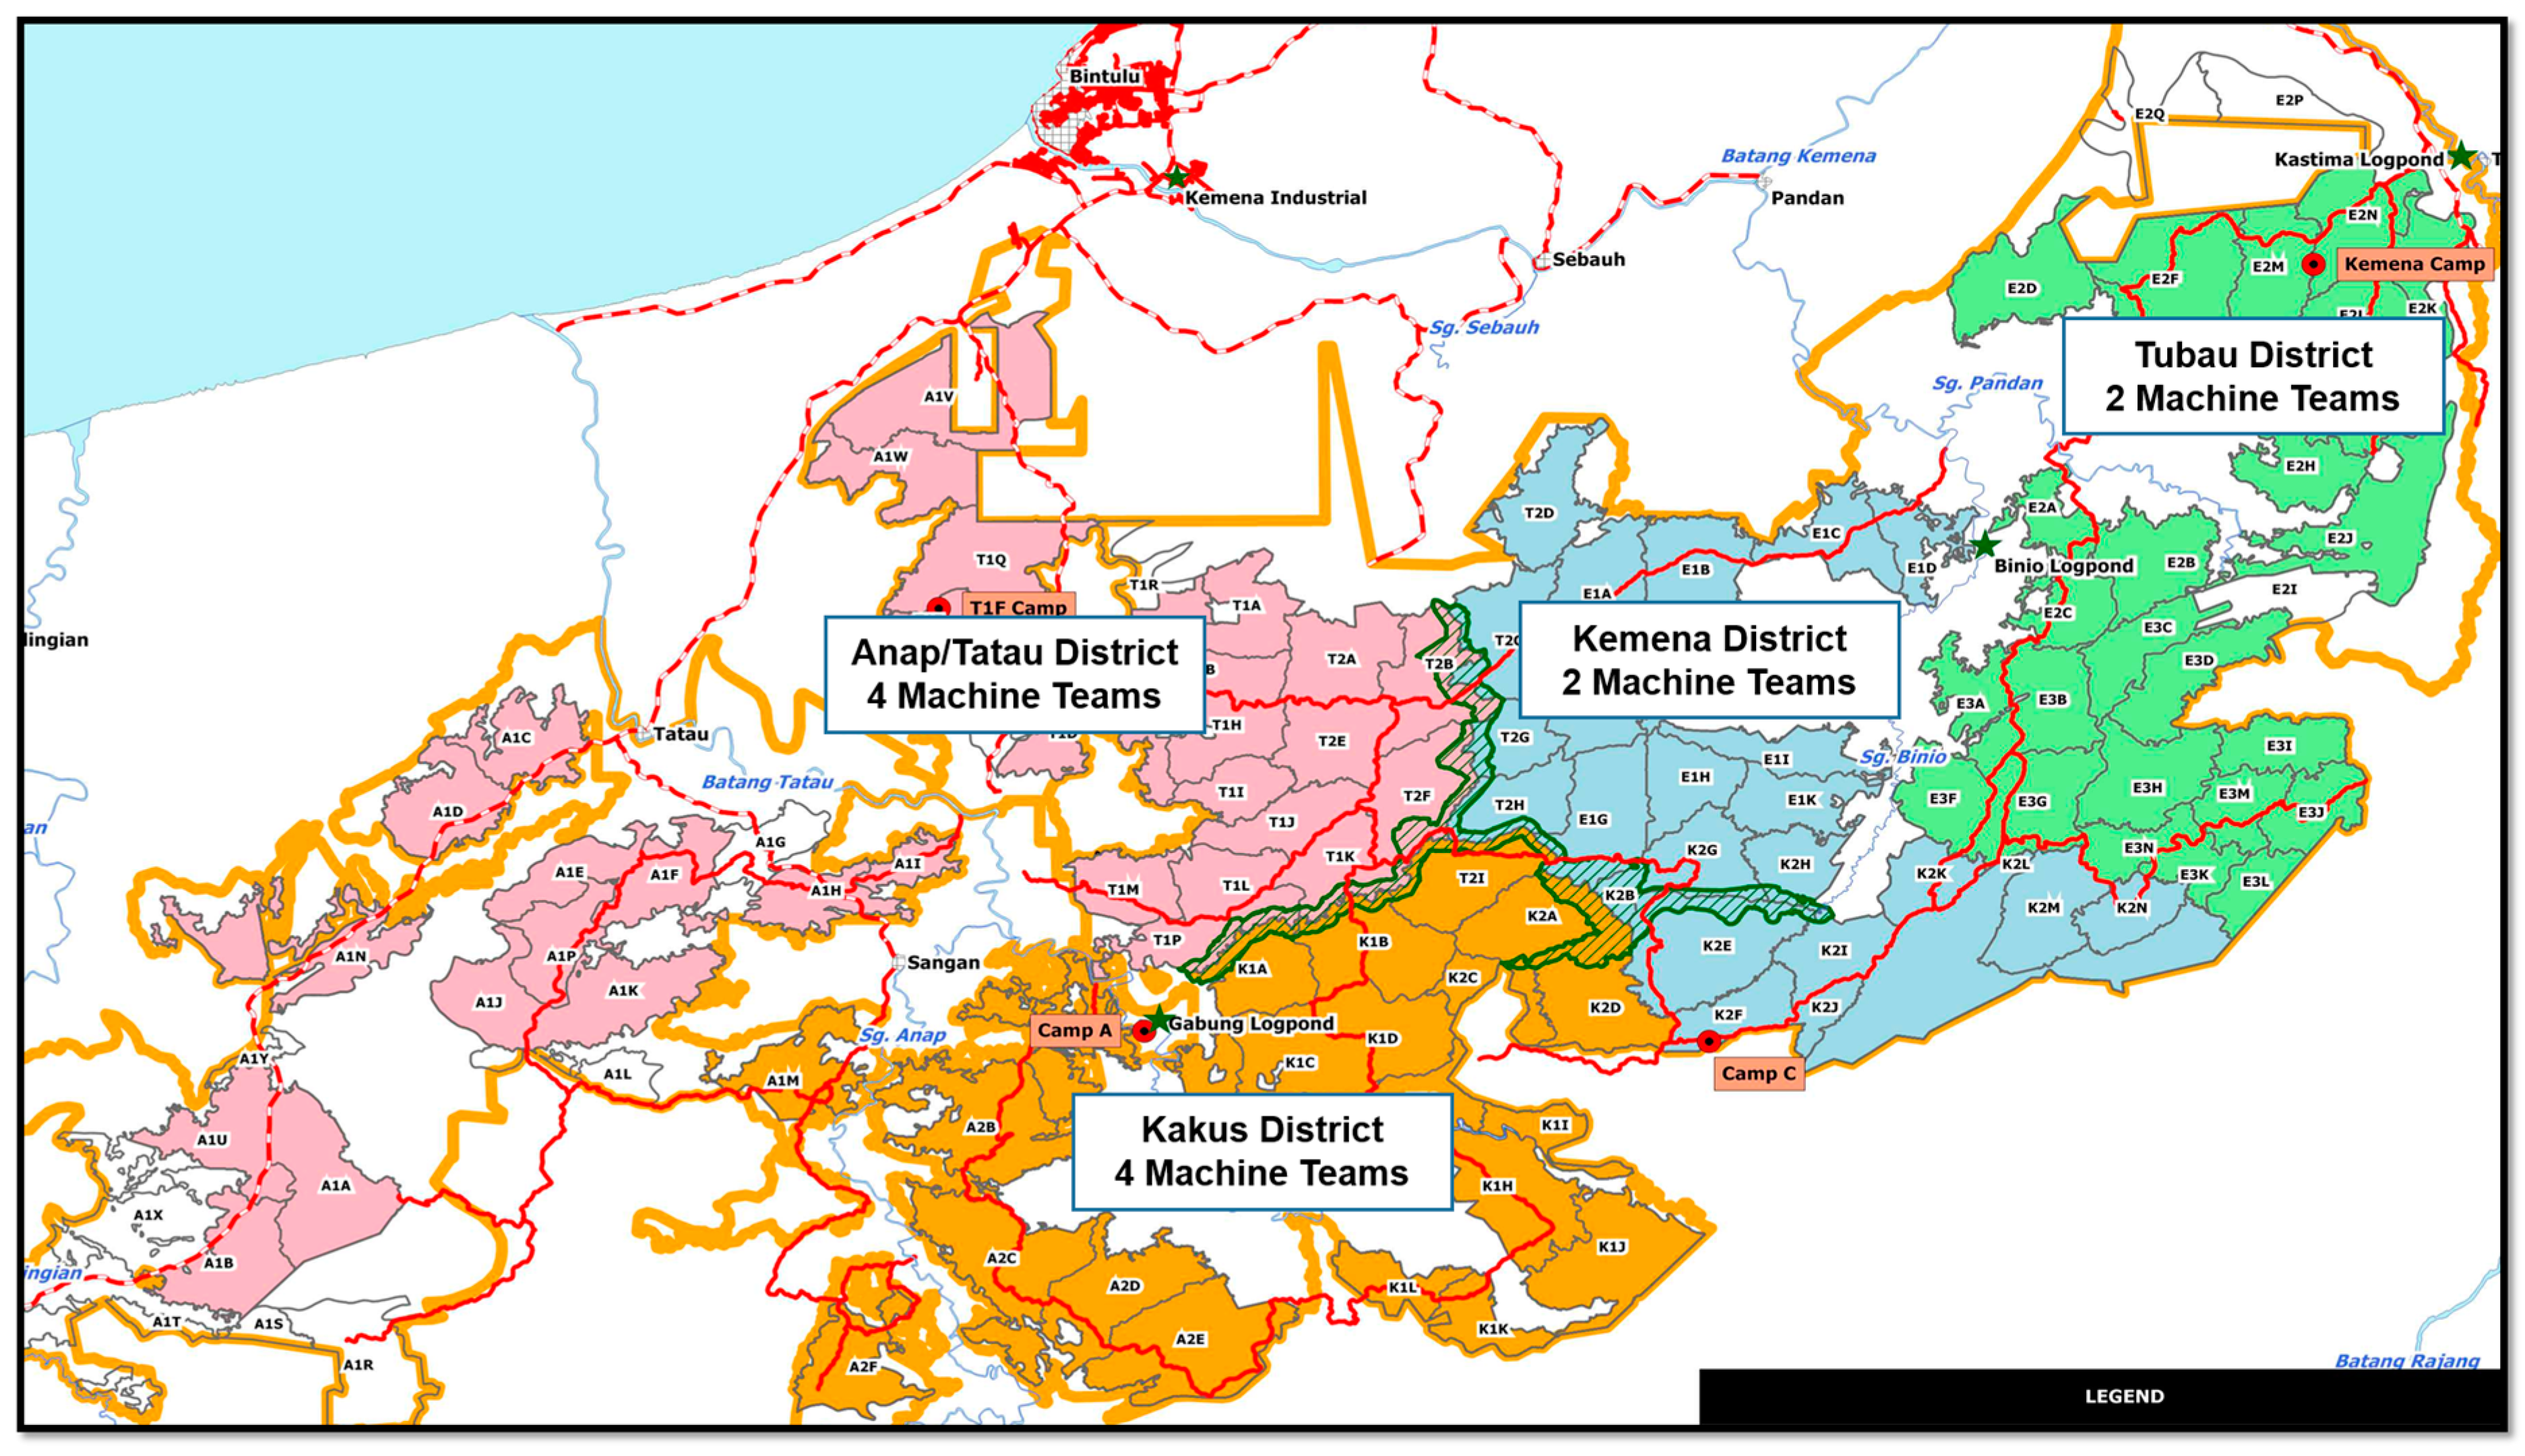
Figure 4.
Breakdown of worksite time by main work activities for the 12 grapple yarder teams in the study.
Figure 4.
Breakdown of worksite time by main work activities for the 12 grapple yarder teams in the study.
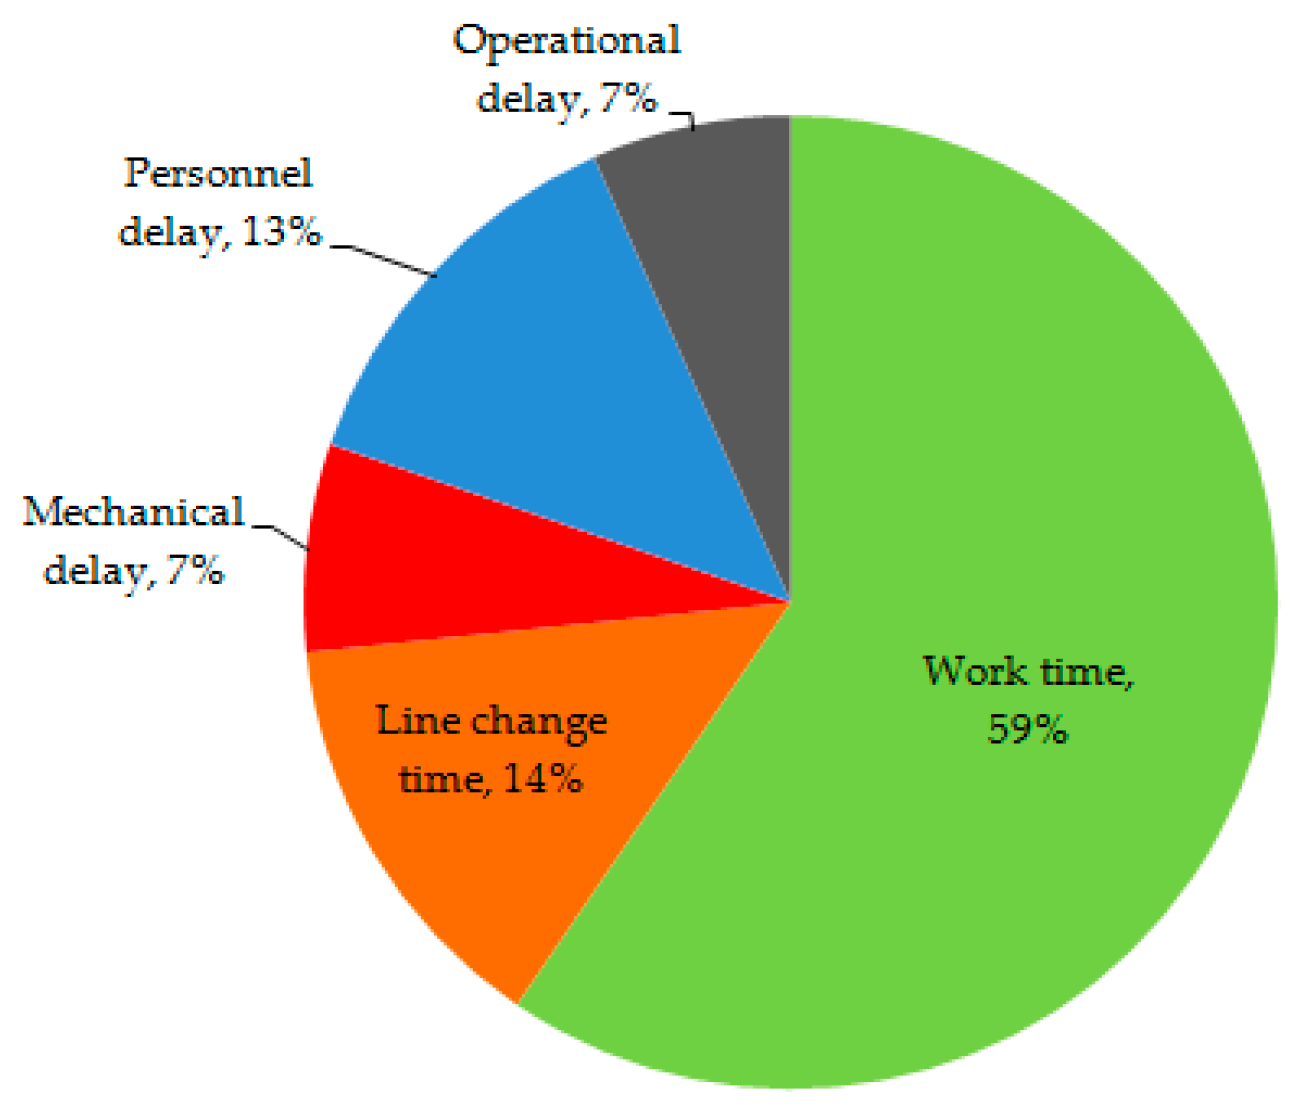
Figure 5.
Net productivity of the two excavator-based grapple yarder types as a function of piece volume, estimated using the regression models in Table 5.
Figure 5.
Net productivity of the two excavator-based grapple yarder types as a function of piece volume, estimated using the regression models in Table 5.

Table 1.
Main characteristics of the excavator-based un-guyed yarders on test.
| Operation | Type | Heavy | Medium |
|---|---|---|---|
| Teams | # | 1 to 7 | 8 to 12 |
| Base machine | Make | Kobelco | Doosan |
| Base machine | Model | SK330 | DX340 LCA |
| Base machine | kW | 209 | 184 |
| Winch | Make | Alpine | Alpine |
| Winch | Model | MDWS 12 | MDWS 10 |
| Mainline pull | kN | 120 | 100 |
| Mainline speed | m s−1 | 9.0 | 7.3 |
| Carriage | Make | Alpine | Alpine |
| Carriage | Model | Hydraulic | Hydraulic |
| Grapple open | mm | 1480 | 1900 |
| Grapple area | m2 | 1.71 | 3.48 |
Table 2.
Main results obtained from the shift level study of the grapple yarder teams.
| Mean per Shift | SD | Min | Max | ||
|---|---|---|---|---|---|
| Lines | # | 2.4 | 1.3 | 0 | 7 |
| Cycles | # | 97 | 43 | 12 | 233 |
| Delays | events | 2.8 | 4.4 | 0 | 36 |
| Mechanical delays | events | 0.4 | 0.7 | 0 | 5 |
| Personnel delays | events | 0.6 | 0.6 | 0 | 3 |
| Operational delays | events | 1.8 | 3.1 | 0 | 19 |
| Work time | h | 3.7 | 1.5 | 0.5 | 9.8 |
| Line change time | h | 0.9 | 1.2 | 0.0 | 6.6 |
| Delay time | h | 1.7 | 3.0 | 0.0 | 22.1 |
| Mechanical delays | h | 0.3 | 1.0 | 0.0 | 6.1 |
| Personnel delays | h | 0.9 | 0.9 | 0.0 | 3.7 |
| Operational delays | h | 0.5 | 0.7 | 0.0 | 7.0 |
| Production | m3 | 226 | 103 | 22 | 579 |
| Piece volume | m3 | 0.52 | 0.13 | 0.18 | 1.23 |
| Load size | pieces | 4.6 | 0.9 | 3.1 | 8.6 |
| Load volume | m3 | 2.4 | 0.6 | 1.1 | 4.5 |
| Yarding distance | m | 103 | 40 | 10 | 251 |
| Stacking distance | m | 20 | 12 | 10 | 60 |
| Productivity | m3 PMH−1 | 63 | 20 | 15 | 133 |
| Productivity | m3 SMH−1 | 39 | 17 | 8 | 117 |
Notes: m3 = cubic meters solid volume over bark; SD = Standard deviation; Stacking distance = the distance between the wood stacks and the yarder chute, covered by the stacking unit when removing incoming loads from under the yarder; PMH = productive machine hours, excluding delay and line change time; SMH = scheduled machine hours, including delays and line change time.
Table 3.
Machine utilization and distribution of the number of delay events by grapple yarder team.
| Team | Utilization | Cycles | Mechanical Delay | Personnel Delay | Operational Delay | Line Changes |
|---|---|---|---|---|---|---|
| # | % | n° | Events | Events | Events | Events |
| 1 | 58 b | 4144 | 18 | 23 | 55 | 101 |
| 2 | 60 b | 4315 | 24 | 22 | 132 | 26 |
| 3 | 63 b | 6465 | 26 | 24 | 41 | 53 |
| 4 | 62 b | 6028 | 30 | 43 | 95 | 57 |
| 5 | 68 b | 5205 | 14 | 38 | 41 | 67 |
| 6 | 60 b | 929 | 5 | 7 | 20 | 10 |
| 7 | 80 a | 5032 | 3 | 22 | 37 | 5 |
| 8 | 60 b | 8732 | 17 | 49 | 111 | 133 |
| 9 | 57 b | 5706 | 53 | 44 | 153 | 90 |
| 10 | 63 b | 3390 | 17 | 24 | 138 | 47 |
| 11 | 64 b | 2497 | 13 | 26 | 96 | 11 |
| 12 | 57 b | 1425 | 9 | 10 | 40 | 12 |
Notes: Utilization = Productive time/Worksite time; different superscript letters on the utilization figures denote a significant difference for α < 0.05; figures in bold represent a significantly higher frequency of occurrence for the event type indicated in the column; underlined figures represent a significantly lower frequency of occurrence for the event type indicated the column.
Table 4.
Comparison between medium and heavy grapple yarder types.
| Medium Yarder | Heavy Yarder | p-Value | Test | ||||
|---|---|---|---|---|---|---|---|
| Mean | SD | Mean | SD | ||||
| Piece volume | m3 | 0.47 | 0.11 | 0.55 | 0.13 | <0.0001 | t-test |
| Load size | pieces | 5.6 | 0.9 | 4.2 | 0.5 | <0.0001 | MW |
| Load volume | m3 | 2.61 | 0.59 | 2.28 | 0.59 | <0.0001 | t-test |
| Yarding distance | m | 123 | 48 | 93 | 30 | <0.0001 | MW |
| Stacking distance | m | 22 | 12 | 24 | 8 | 0.0005 | MW |
| Work time | h shift−1 | 3.42 | 1.41 | 3.87 | 1.57 | 0.0011 | t-test |
| Total time | h shift−1 | 6.13 | 2.48 | 6.42 | 2.41 | 0.0495 | MW |
| Utilization | % | 60.1 | 29.1 | 64.1 | 33.0 | 0.0065 | MW |
| Delay time | % | 27.4 | 21.5 | 23.9 | 17.1 | 0.1317 | MW |
| Line change time | % | 12.4 | 17.0 | 12.0 | 14.7 | 0.2427 | MW |
| Line change time | h line−1 | 1.16 | 1.18 | 0.78 | 0.83 | 0.0016 | MW |
| Delay events | # shift−1 | 3.4 | 3.0 | 2.4 | 2.0 | 0.0005 | MW |
| Delay events | h event−1 | 0.67 | 0.65 | 0.91 | 0.75 | <0.0001 | MW |
| Productivity | m3 PMH−1 | 56 | 18 | 66 | 21 | <0.0001 | MW |
| Productivity | m3 SMH−1 | 33 | 15 | 42 | 17 | <0.0001 | MW |
Notes: m3 = cubic meters solid volume over bark; SD = Standard deviation; p-Value = results of the unpaired comparison test; t-test = unpaired comparison test is a classic student t-test because data comply with the statistical assumptions; MW = unpaired comparison test is a non-parametric Mann–Whitney test, because data do not comply with the statistical assumptions; PMH = productive machine hours, excluding delay and line change time; SMH = scheduled machine hours, including delays and line change time.
Table 5.
Regression model for predicting net grapple yarder productivity as a function of significant independent variables.
Table 5.
Regression model for predicting net grapple yarder productivity as a function of significant independent variables.
| P = a + b Vol + c N° + d Line + e Stack + f Medium Vol + g Top Vol + h Top | ||||
|---|---|---|---|---|
| Adjusted R2 = 0.501; n = 42,927; F = 6157.6; p < 0.0001 | ||||
| Coeff | SE | t-Value | p-Value | |
| a | −50.515 | 1.163 | −43.4 | <0.0001 |
| b | 132.724 | 2.068 | 64.2 | <0.0001 |
| c | 14.222 | 0.108 | 131.6 | <0.0001 |
| d | −0.127 | 0.003 | −42.2 | <0.0001 |
| e | −0.124 | 0.012 | −10.3 | <0.0001 |
| f | −25.143 | 0.778 | −32.3 | <0.0001 |
| g | −36.148 | 2.662 | −13.6 | <0.0001 |
| h | 29.559 | 1.427 | 20.7 | <0.0001 |
Where: P = net productivity in m3 PMH−1, excluding delays; n = number of valid observations; SE = Standard error; Vol = average piece volume, m3 over bark; N° = number of pieces per load; Line = Line length in m; Stack = stacking distance in m; Medium = indicator variable for medium yarder: if yarder is medium = 1, if heavy = 0; Top = indicator variable for top team: if top team = 1, if not = 0.
Table 6.
Comparison of results between this study and previous grapple and swing yarder studies.
| Yarder | Carriage | Line Length | Piece | Productivity | Operation | Country | Cycles | Reference |
|---|---|---|---|---|---|---|---|---|
| Type | Type | m | m3 | m3 PMH−1 | Type | n | ||
| Alpine MDWS | Grapple | 103 | 0.52 | 63 | Clearcut | Malaysia | 54,624 | this study |
| Madill 124 | Grapple | 100 | 0.81 | 58 | Clearcut | Australia | 184 | [33] |
| Thunderbird 6355 | Grapple | 160 | 0.85 | 86 | Clearcut | New Zealand | 123 | [34] |
| Thunderbird 255 | Slings | 233 | 1.52 | 39 | Clearcut | New Zealand | 165 | [61] |
| Madill 122 | Slings | 267 | 0.71 | 44 | Clearcut | USA | 70 | [62] |
| Timbco T425 | Slings | 80 | 0.55 | 15 | Thinning | USA | 218 | [63] |
| CAT 315 L | Slings | 80 | 1.43 | 30 | Thinning | USA | 237 | [63] |
| Doosan DX 210W | Slings | 120 | 0.28 | 11 | Clearcut | Norway | 149 | [44] |
| Modified JCB | Slings | 130 | 0.35 | 17 | Clearcut | Ireland | 90 | [42] |
Notes: Piece = piece size; m3 = cubic meters solid volume over bark; PMH = productive machine hours, excluding delay and line change time.
© 2017 by the authors. Licensee MDPI, Basel, Switzerland. This article is an open access article distributed under the terms and conditions of the Creative Commons Attribution (CC BY) license (http://creativecommons.org/licenses/by/4.0/).
Share and Cite
MDPI and ACS Style
Engelbrecht, R.; McEwan, A.; Spinelli, R. A Robust Productivity Model for Grapple Yarding in Fast-Growing Tree Plantations. Forests 2017, 8, 396. https://doi.org/10.3390/f8100396
AMA Style
Engelbrecht R, McEwan A, Spinelli R. A Robust Productivity Model for Grapple Yarding in Fast-Growing Tree Plantations. Forests. 2017; 8(10):396. https://doi.org/10.3390/f8100396
Chicago/Turabian StyleEngelbrecht, Riaan, Andrew McEwan, and Raffaele Spinelli. 2017. "A Robust Productivity Model for Grapple Yarding in Fast-Growing Tree Plantations" Forests 8, no. 10: 396. https://doi.org/10.3390/f8100396
Note that from the first issue of 2016, this journal uses article numbers instead of page numbers. See further details here.