Stand Dynamics and Biomass Increment in a Lucidophyllous Forest over a 28-Year Period in Central Japan
by
 ,
,
Siyu Chen
1,2 ,
,
Akira Komiyama
3,
Shogo Kato
3,
Ruoming Cao
2,
Shinpei Yoshitake
4 and
Toshiyuki Ohtsuka
1,2,* 1
United Graduate School of Agricultural Science, Gifu University, 1-1 Yanagido, Gifu 501-1193, Japan
2
River Basin Research Center, Gifu University, 1-1 Yanagido, Gifu 501-1193, Japan
3
Faculty of Applied Biological Sciences, Gifu University, 1-1 Yanagido, Gifu 501-1193, Japan
4
Takayama Experimental Field Station, River Basin Research Center, Gifu University, 919-47 Takayama, Gifu 506-0815, Japan
*
Author to whom correspondence should be addressed.
Forests 2017, 8(10), 397; https://doi.org/10.3390/f8100397
Submission received: 18 August 2017
/
Revised: 12 October 2017
/
Accepted: 15 October 2017
/
Published: 17 October 2017
(This article belongs to the Collection Forests Carbon Fluxes and Sequestration)
Abstract
:Secondary lucidophyllous forest is one of the dominant forests in human-dominated subtropical/warm-temperate regions in East Asia. There were few direct monitoring techniques to elucidate the following hypotheses: (a) self-thinning may govern the stand development process and (b) wood production decline can be observed during secondary succession in a lucidophyllous forest. We conducted a long-term study at a permanent plot in central Japan, since 1989. The forest consists mainly of Castanopsis cuspidata in a canopy layer, Cleyera japonica, and Eurya japonica in a subtree layer. During the 28-year period, the basal area of the stand significantly increased due to the growth of C. cuspidata, from 29.18 ± 1.84 (87.8% of total) to 38.71 ± 2.22 m2 ha−1 (91.9%), while the stem density of C. cuspidata significantly decreased from 666 ± 13 to 404 ± 10 stems ha−1 in proportion to accumulating biomass (117.8 to 166.6 ton ha−1). The annual woody net primary production ranged from 2.40 ± 0.13 to 3.93 ± 0.33 ton ha−1 year−1 as a nearly 70-year-old forest. There was no age-related decline of woody net primary production (NPP) was found during secondary succession, and the growth of individual tree still increased when the self-thinning process governed the stand.
1. Introduction
Lucidophyllous (evergreen broad-leaved) forests are distributed widely in the subtropical and warm-temperate regions of East Asia [1]. Lucidophyllous forests are mainly dominated by evergreen species of Fagaceae, Lauraceae, Theaceae, Magnoliaceae, and Hamamelidaceae; beyond that, Castanopsis cuspidata is one of the typical dominant species from the coastal area of central Japan to southwestern Japan [2]. Ohsawa [3] suggested that the tropical lower montane forests that are mainly dominated by evergreen Fagaceae (especially Castanopsis) can be correlated to the horizontal subtropical/warm-temperate zone of East Asia as lucidophyllous forests, and the latitudinal northern limit reaches sea level at 35° N of central Japan. There have been several long-term studies that investigated the structure and the dynamics of the unique forests using large permanent quadrats in southwestern Japan; e.g., Aya Research Site from 1989 [4,5,6] or Tatera Forest reserve from 1990 [7,8,9]. These studies have revealed that diverse gap-forming processes created environmental heterogeneity in the forest floor and contributed to the maintenance of the species-rich evergreen broad-leaved forests.
However, almost all of these unique natural lucidophyllous forests distributed in human populated areas have been logged or greatly changed by human activities due to the demands for products [10]. Only remnants of evergreen forests can be found in sanctuaries around temples and shrines or lie on steep slopes which are not easy to access, and secondary forests of coppice woods or pioneer pine forests are dominant in southern and central Japan. Biomass increment in forests through secondary succession is one of the most important components of carbon sequestration of the terrestrial ecosystem [11]. Particularly, forests in the middle and high latitudes of the northern hemisphere, which are the human-dominated areas, had high potential of carbon sequestration during the end of the 20th century due to enhancement of plantations or forest recovery during secondary succession [12,13]. Moreover, it is well known that wood production declines along with ecosystem development [14]. For example, Ohtsuka et al. [11,15] studied net primary production (NPP) in a temperate deciduous coppice forest of 18 years after clear-cutting, and stand increment of wood parts reached 4.8 ton ha−1 year−1, which was more than two times higher than that of mature forest. Forest age-sequence studies revealed that NPP reached a peak during early stand development and then gradually declined by as much as 76% [16]. Magnani et al. [17] also reported that the age effects accounted for 92% of the total variability in net ecosystem production from boreal coniferous to temperate broadleaf forests. Therefore, the age-related changes of wood production are crucial for global carbon cycling in the near future.
The development process of forests is often based on the chronosequence of various stand ages, and, thus, many studies conducted on the comparisons of secondary and old-growth lucidophyllous forests [10,18,19,20]. For example, Kubota [19] investigated the structural changes and growth dynamics in lucidophyllous forests of four stands of different ages in southwestern Japan and revealed that wood production decreased with age from 7.95 (15 years old) to 4.61 (over 100 years old) ton ha−1 year−1. Moreover, self-thinning was an important factor in the development of young lucidophyllous forests, and the monopolization of Castanopsis sieboldii through secondary succession had a negative influence on species diversity [20]. However, in contrast to these chronosequence studies, there was a rare investigation directly monitoring stand development over several decades, particularly for secondary lucidophyllous forests. Therefore, the long-term investigation of changes in forest structure and the development process of secondary lucidophyllous forests were needed.
Mt. Kinka (35°26′ N, 136°47′ E, the peak is 329 m) is located in Gifu Prefecture, central Japan. Almost all areas (597 ha) of Mt. Kinka consist of secondary natural forests (93%) and artificial coniferous forests (2%). In particular, the lower slopes of Mt. Kinka are covered by secondary evergreen broad-leaved forests that predominated by Castanopsis cuspidata, which were mainly recovered after the World War II. Previous studies have showed that the canopy trees of Castanopsis in the secondary forests grew faster than other species and underwent intraspecific competition (self-thinning) due to the high sprouting capacity [19]. In addition, the changes in forest structure always accompany production decline [16]. Therefore, it can be hypothesized that self-thinning may govern the stand development process of this secondary Castanopsis forest and that age-related wood production decline can be observed due to neighborhood competitions during secondary succession. To test the hypothesis, we demarcated a permanent plot in 1989 and have studied forest dynamics since then on the lower slope of Mt. Kinka. The objectives of this paper were as follows: (1) to assess the community structural change of secondary stands spanning 28 years (1989–2017), and (2) to document temporal trends in biomass accumulation and aboveground woody NPP with special reference to stand development.
2. Materials and Methods
2.1. Study Site
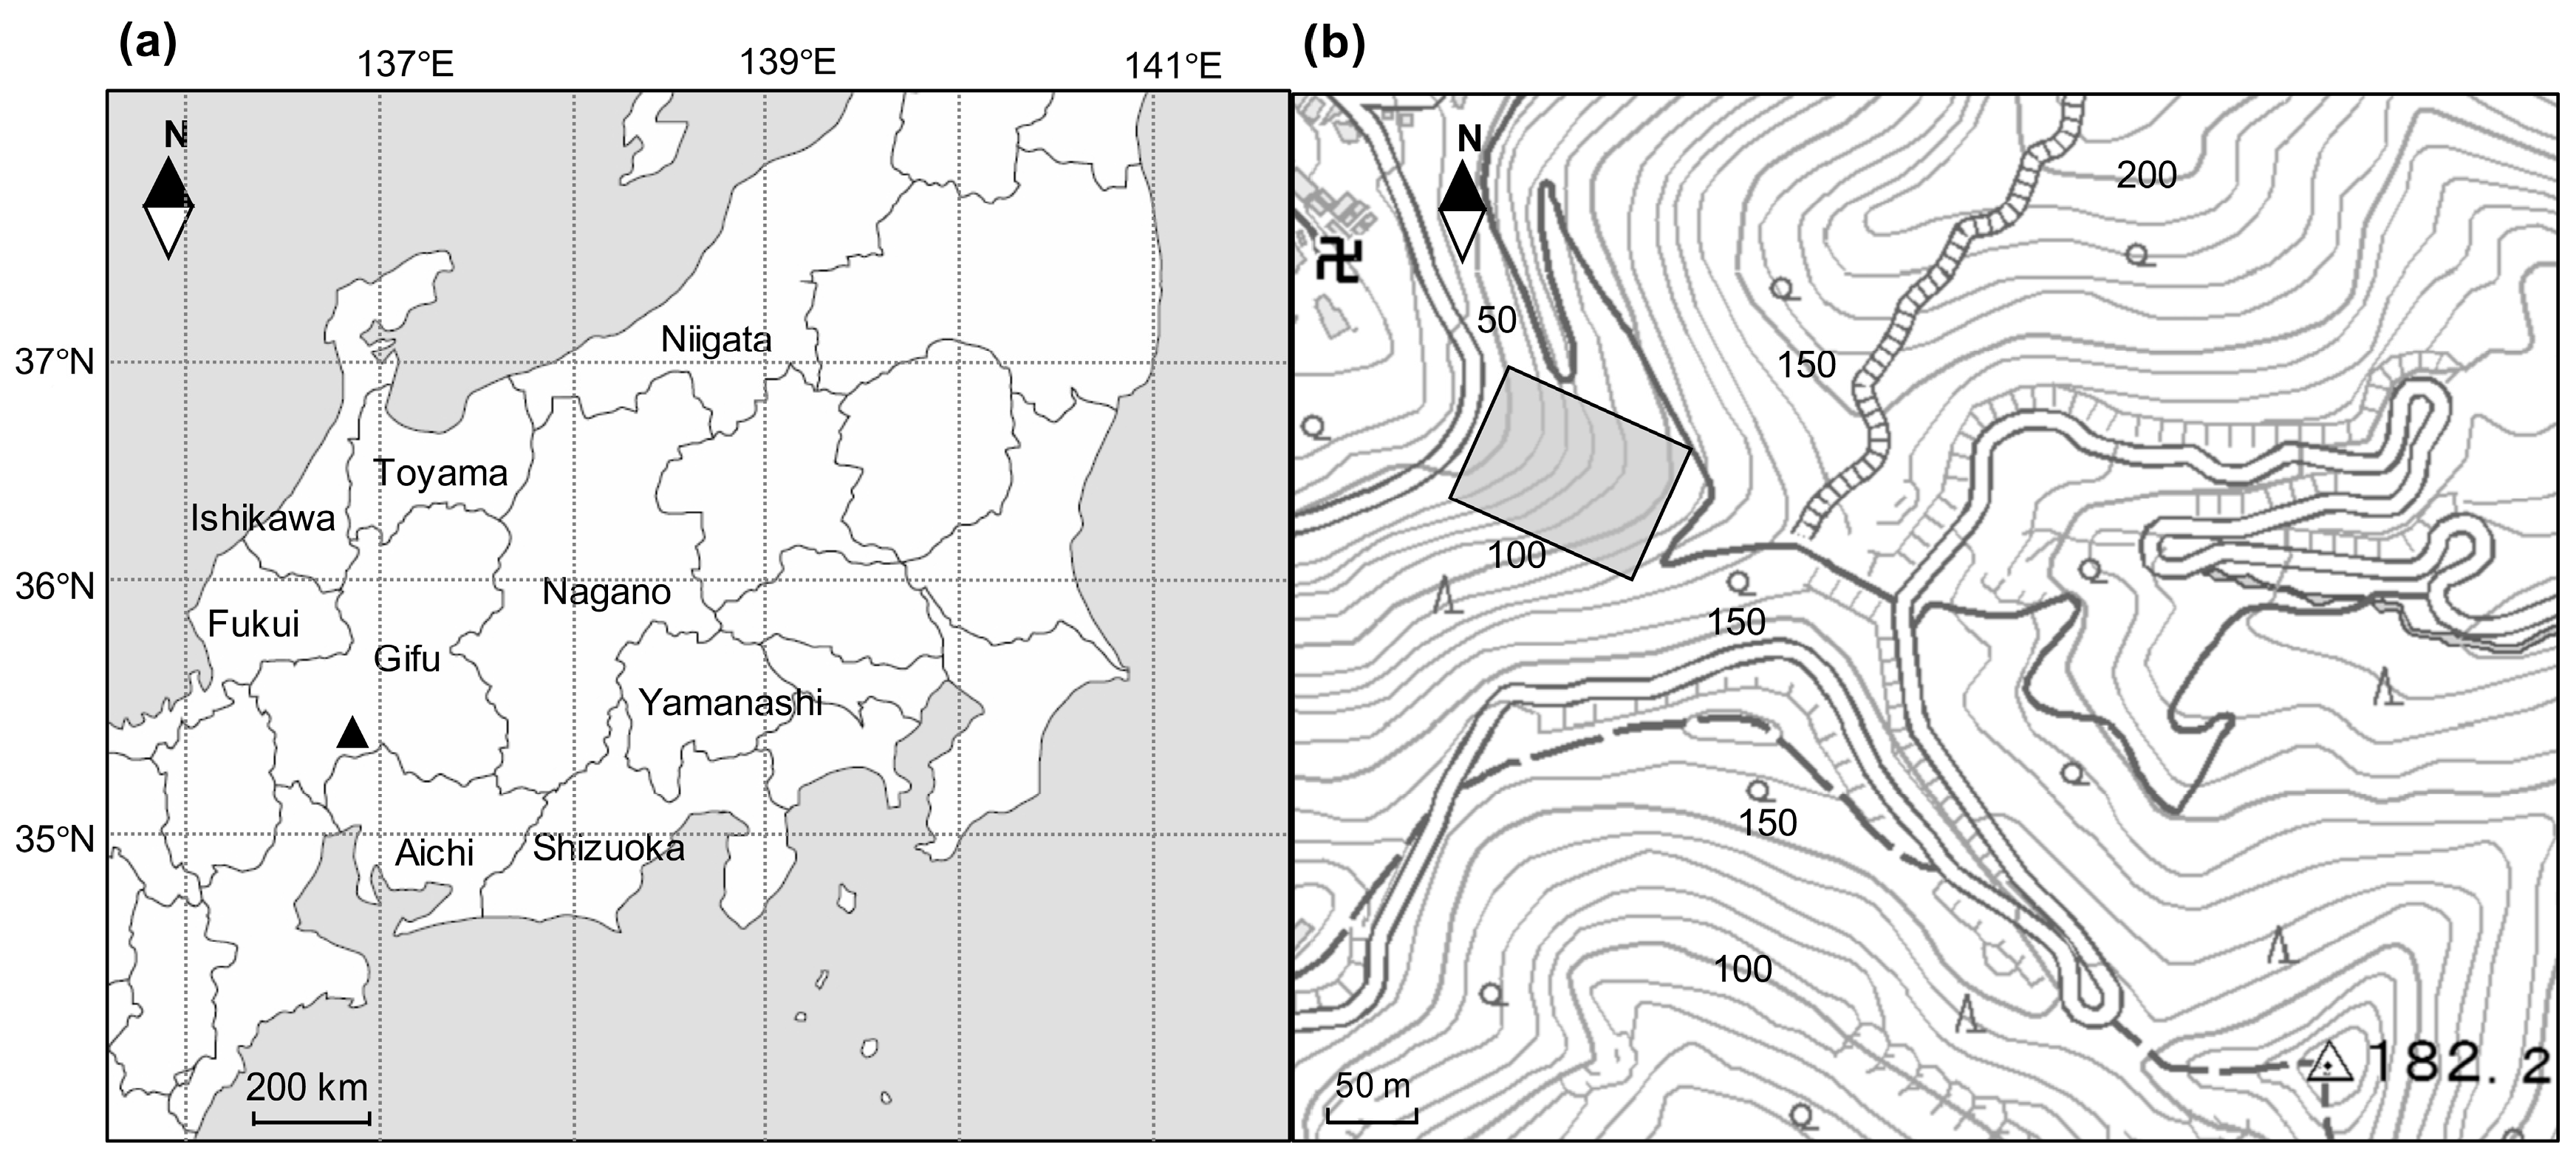
The study site is located on Mt. Kinka, central Japan (Figure 1). The area surrounding Mt. Kinka is an ancient populated town built round Gifu castle, which has sat on top of Mt. Kinka since the 11th century. Thus, a typical pioneer tree, Pinus densiflora, which was utilized as fertilizer or fuel by residents, predominated on and around this area historically. However, these forests were over-used in the 19th century and were managed as productive forests from 1889 [21]. From 1947, harvesting was prohibited and they were protected as natural secondary forests, thus most of the individual trees have been recruited as secondary forests since 1947. The topography of the area is hilly with young soil. The bedrock is composed of sedimentary rock on a chert layer [21]. The study area has a subtropical/warm-temperate climate. The annual mean temperature is 16.1 °C, and the mean temperature in the coldest month, January, and the hottest month, August, are 4.4 °C, and 28.0 °C, respectively. The average annual precipitation is 1866 mm. The climatic data was collected at a weather station situated approximately 4 km from the study plot.
2.2. Field Methods
A 0.7 ha study plot (70 m × 100 m) was established on the lower slopes of Mt. Kinka (ca. 60 m a.s.l., 35°26′ N, 136°47′ E) in 1989 (Figure 1). The study plot was divided into 70 subplots of 100 m2 using a compass survey. In May 1989, all stems of tree species with a diameter at breast height (DBH) greater than or equal to 10 cm were mapped as x–y coordinates, identified to the species level and measured for DBH. A number tag was attached to each trunk at 1.3 m height using a stapler, and the measuring position was marked using paint. The DBH of these stems were re-measured in May 1995 (six growing seasons after 1989) and October 2004 (10 growing seasons after 1995) at the same painted position of the trunks together with those of new recruited stems over 10 cm and dead stems during the intervals. In January 2017 (12 growing seasons after 2004), this 0.7 ha plot was reconstructed using the tree map and the remaining numbered of tags on trunks, and we had identified all tree stems over 10 cm in 2004. Then, all tree stems taller than 1.3 m high were re-tagged and their DBH measured together with the dead stems greater than 10 cm in 2004.
2.3. Aboveground Biomass Increments and Losses
To estimate aboveground biomass (AGB) of the forest stand at each measurement time (1989, 1995, 2004 and 2017), we used the allometric equations of an evergreen broad-leaved forest as follows [22]:
where DBH is the diameter at breast height (cm), and Wf, Ws, Wb are the dry weight (kg) of foliage, stems and branches, respectively.
log Wf = 0.885 log (DBH)2 − 1.591,
log Ws = 1.022 log (DBH)2 − 0.710,
log Wb = 1.266 log (DBH)2 − 1.852,
AGB = Wf + Ws + Wb,
Stand increment (SI) of AGB during the measurement interval were estimated as follows [23]:
where BIs represents AGB increments of surviving trees in the plot and BIi represents AGB increments of ingrowth trees that reach the minimum DBH (10 cm) during the study period. BIs was calculated as the difference between estimated AGB at the beginning and the end of measuring intervals using the allometric equations. BIi was calculated as the difference between its estimated AGB at the end of the interval and the AGB of a tree of the minimum measured diameter (10 cm). If a tree died in the measurement interval, dead necromass (D) of the tree was estimated as the AGB at the beginning of the interval. The dead trees can be assumed to have no increment during the measurement interval. Subtracting D from SI represents the change of aboveground forest biomass (ΔAGB) during the survey interval. Forest woody NPP is the increment of new organic matter that was retained by the biomass of stem and branches at the end of the interval [24]. SI of stems and branches were adapted as the woody NPP of each measuring interval.
SI = ∑ BIs + ∑ BIi,
Relative growth rate of DBH (RGRD) was calculated as shown in Equation (6):
where D1 and D2 is the DBH (cm) at the beginning (t1) and the end (t2) of the year of measuring interval, respectively. Annual recruitment rate (R) and annual mortality (M) of tree stems were calculated as follows:
where NR is the number of recruitment tree stems at the end of the year (t2) of measuring interval, N1 is the number of total tree stems at the beginning of the year (t1) of measuring interval, and NM is the number of dead tree stems in the year t2.
RGRD = (ln D2 − ln D1)/(t2 − t1),
R = NR/N1 × (t2 − t1),
M = NM/N1 × (t2 − t1),
2.4. Statistical Analysis
To assess the statistical significance of any differences among forest changes, the 70 m × 100 m permanent plot was divided into four plots (35 m × 50 m) according to spatial variation. Differences in stem numbers, basal area (BA), AGB, SI, D, woody NPP, RGRD, and mortality among the four surveys (May 1989, May 1995, October 2004, and January 2017) were assessed by univariate analysis of variance (ANOVA) and post hoc Tukey HSD (Honest Significant Difference) tests using IBM SPSS Statistics 22 (New York, NY, United States).
3. Results
3.1. Structure and Species Composition of a Lucidophyllous Forest of Mt. Kinka
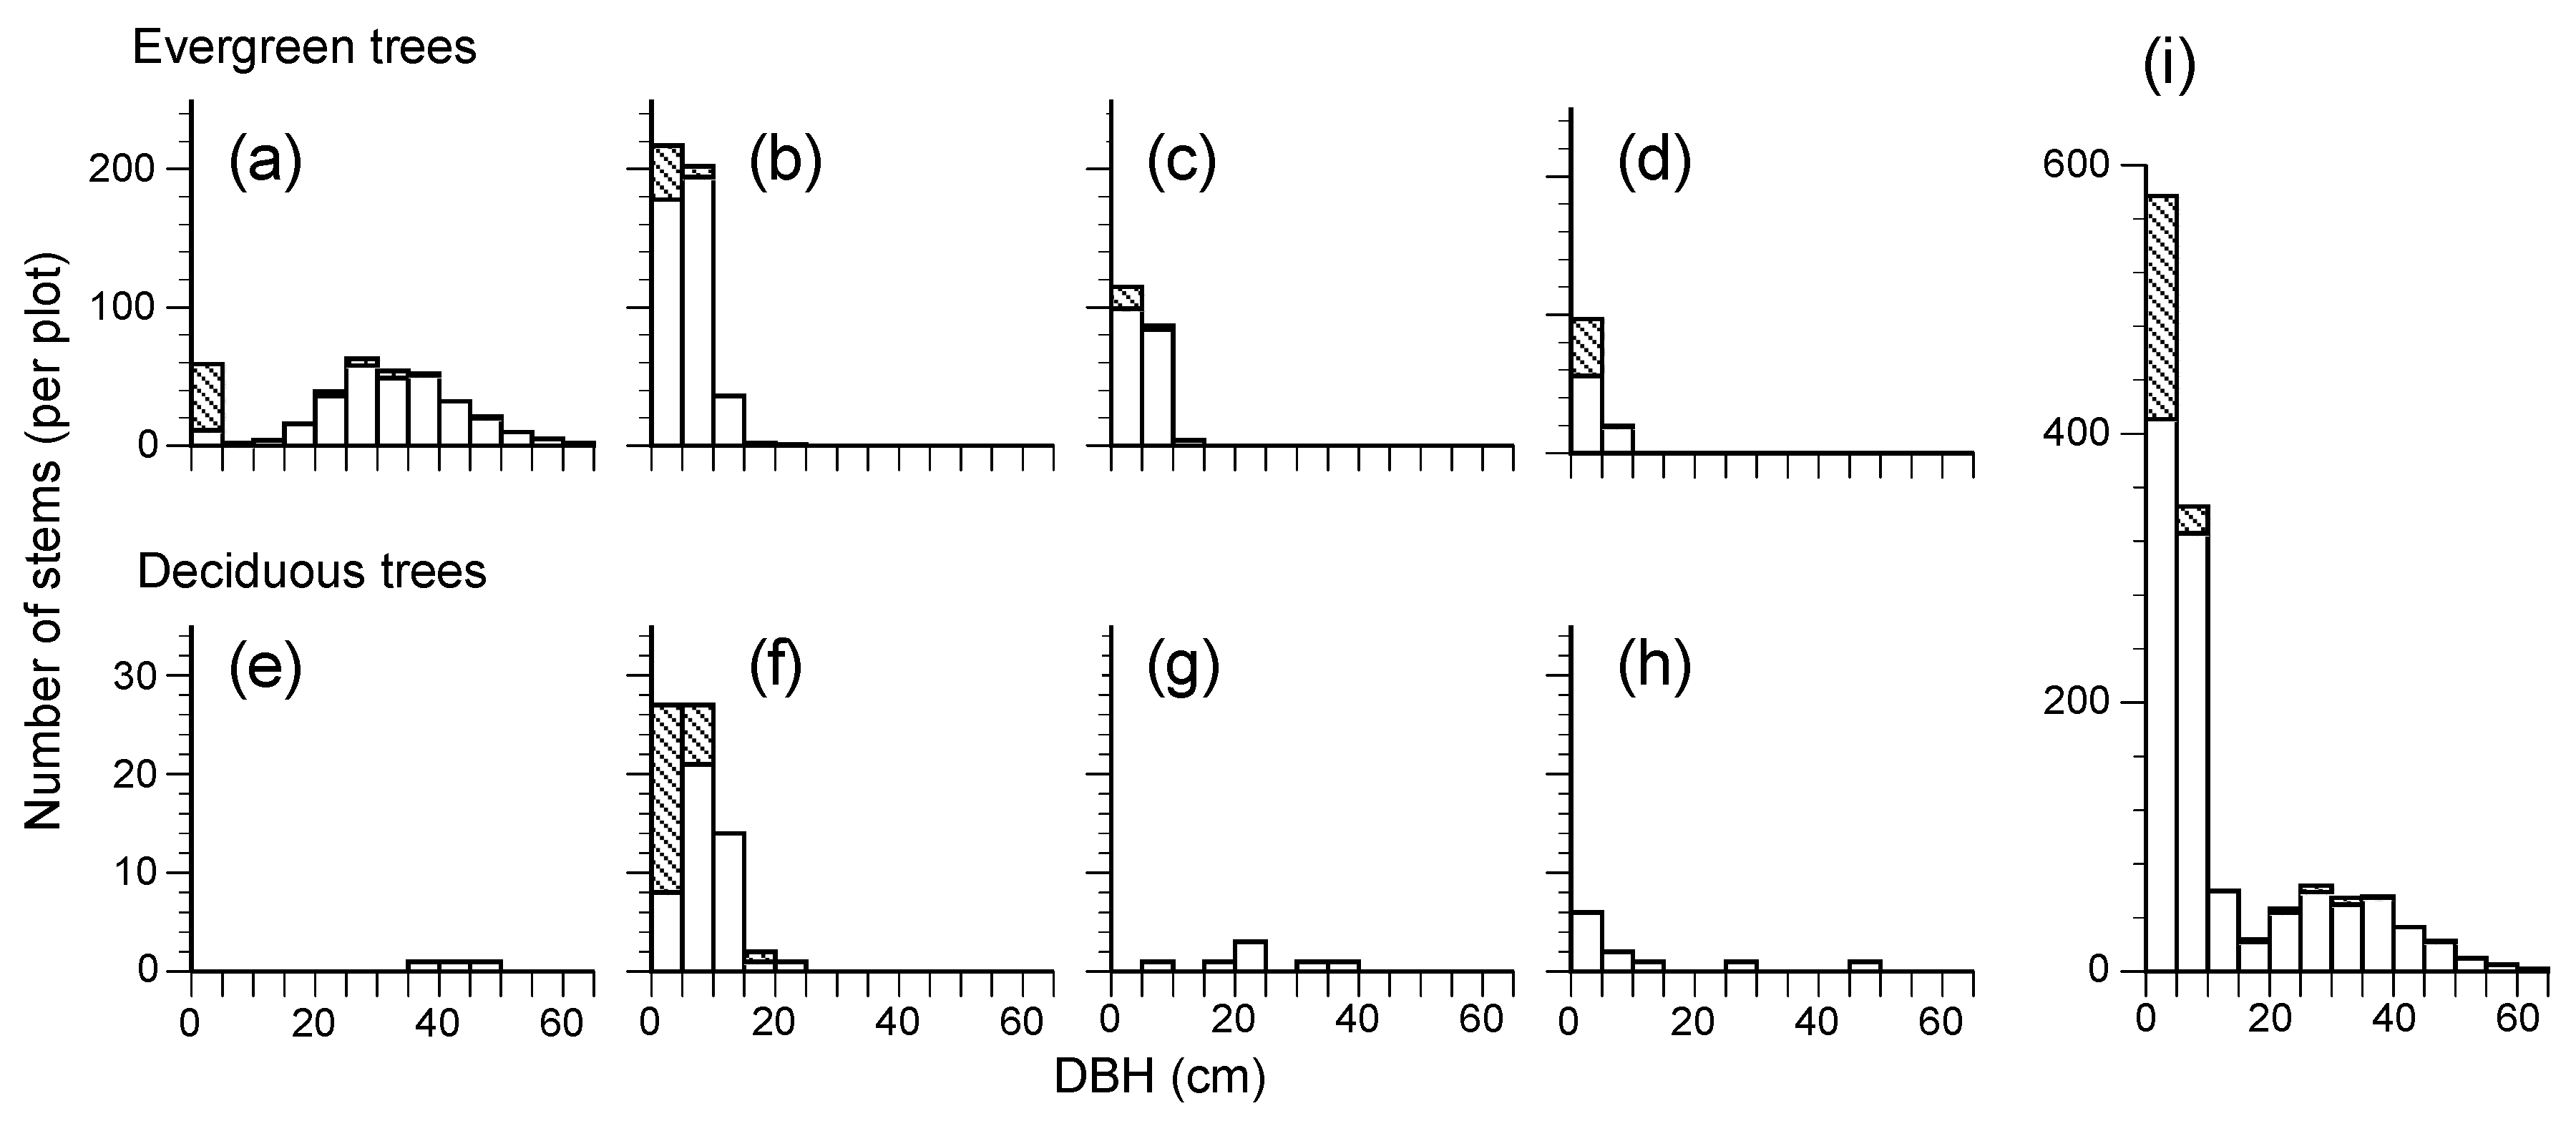
The plot contained 26 woody plant species and 1301 living stems ≥ 1.3 m of height, with a BA of 46.08 m2 ha−1 (Table 1), including evergreen broad-leaved trees (13 species) and deciduous broad-leaved trees (13 species). Evergreen broad-leaved tree species occupied 94.51% and 91.70% in the number and the BA of the total living tree stems, respectively. Castanopsis cuspidata was the most abundant overstory tree species in BA (87.76%), while Cleyera japonica was the most dominant understory subtree species based on stem number followed by Eurya japonica (Table 1, Figure 2a–c). The plot also contained some deciduous broad-leaved species (e.g., Ilex micrococca, I. macropoda and Magnolia obovata), which only comprised 5.49% in BA and 8.30% in stem number.
The distribution of the DBH of the dominant tree, C. cuspidata, showed a unimodal pattern; the peak was in the 30 cm class and few recruitment stems were observed, although there were some sprouting stems less than 5 cm (Figure 2a). Understory subtree species (C. japonica and E. japonica) showed an L-shaped pattern with multiple small stems (Figure 2b,c). Beyond that, some tiny sprouting stems and single stems were found in I. macropoda (Figure 2f), DBH distribution of the three canopy deciduous species (I. micrococca, M. obovata, and Eleutherococcus sciadophylloides) was sporadic, and no continuous distribution was found (Figure 2e,g,h).
3.2. Temporal Changes of Forest Structure
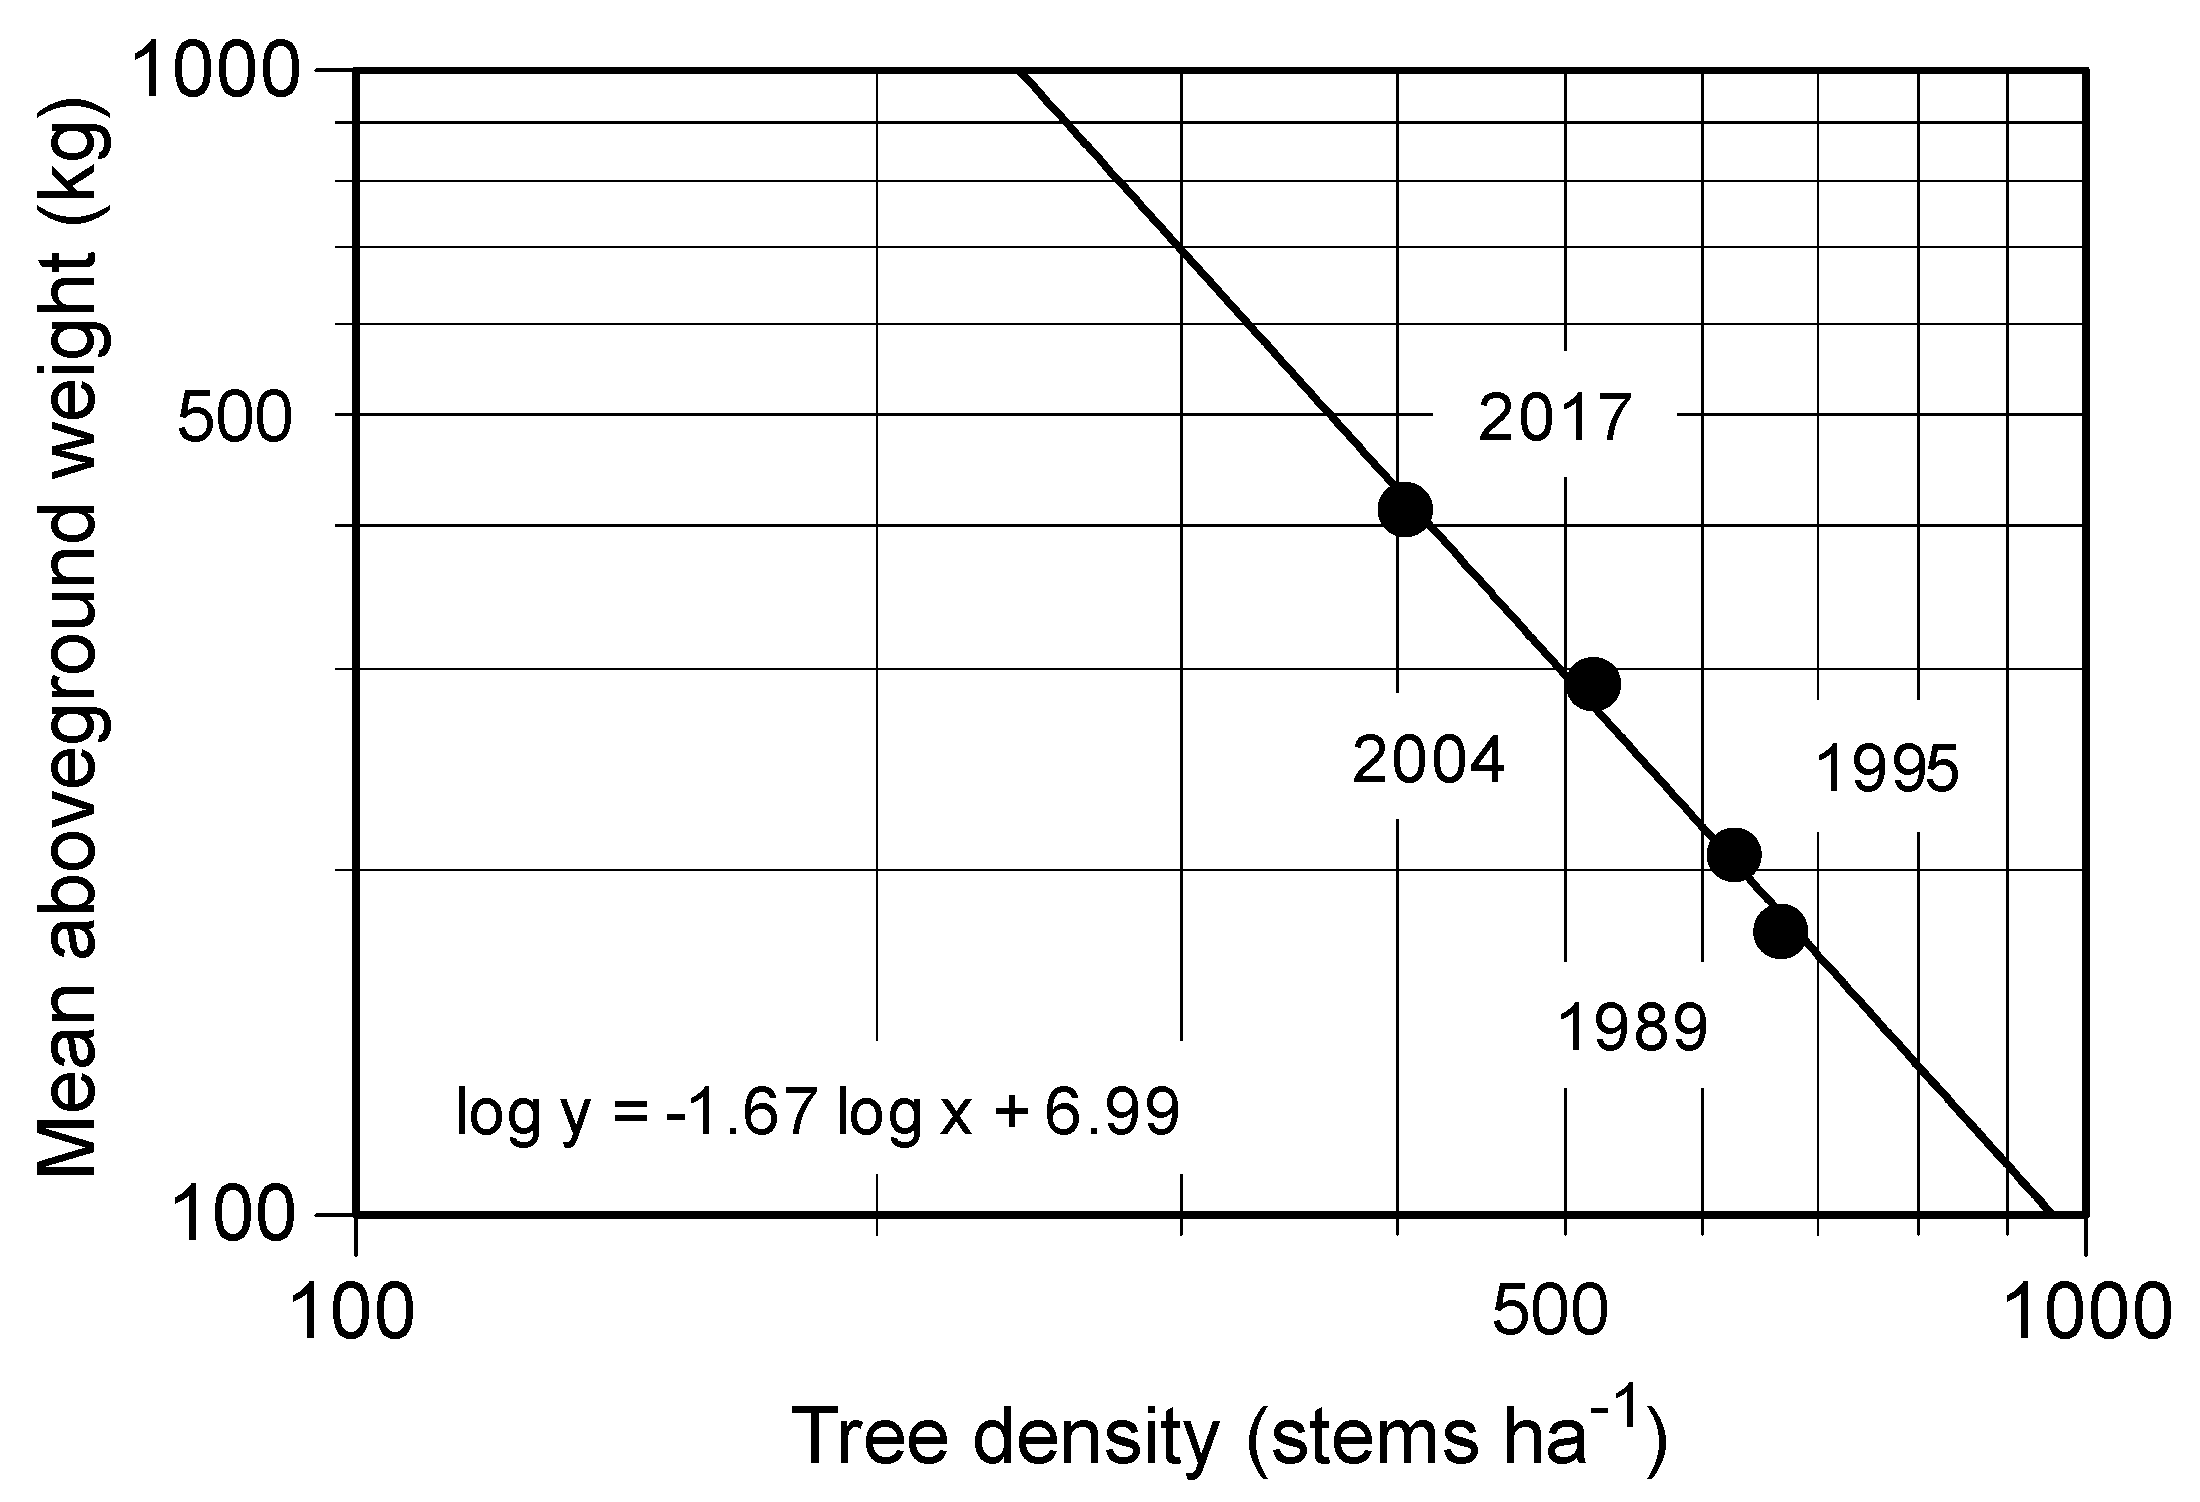
The stem density of evergreen trees significantly decreased during the 28-years from 684 ± 15 stems ha−1 to 460 ± 7 stems ha−1, while the BAs of the evergreen trees increased significantly from 29.51 ± 1.80 to 39.54 ± 2.24 m2 ha−1 (Table 2). In contrast, the stem density of deciduous trees tended to decrease at a corresponding rate to the decrease of BA, but the changes were not significant (Table 2). Moreover, the numbers of deciduous species of over 10 cm DBH decreased from 12 in 1989 to 7 in 2017 (Table 3). Overall, recruitment of tree stems was less than the mortality; the total stems decreased significantly from 1989 (779 ± 37 stems ha−1) to 2017 (510 ± 16 stems ha−1, Table 2). In contrast to decreasing stem number, the BA of the stand increased due to the growth of C. cuspidata, from 29.18 ± 1.84 (87.81% of total) to 38.71 ± 2.22 (91.88%). In this case, the stem density of C. cuspidata decreased in proportion to accumulating biomass of individual, and the slope of the regression lines on the log density to log tree biomass was −1.67 during the 28 years (Figure 3).
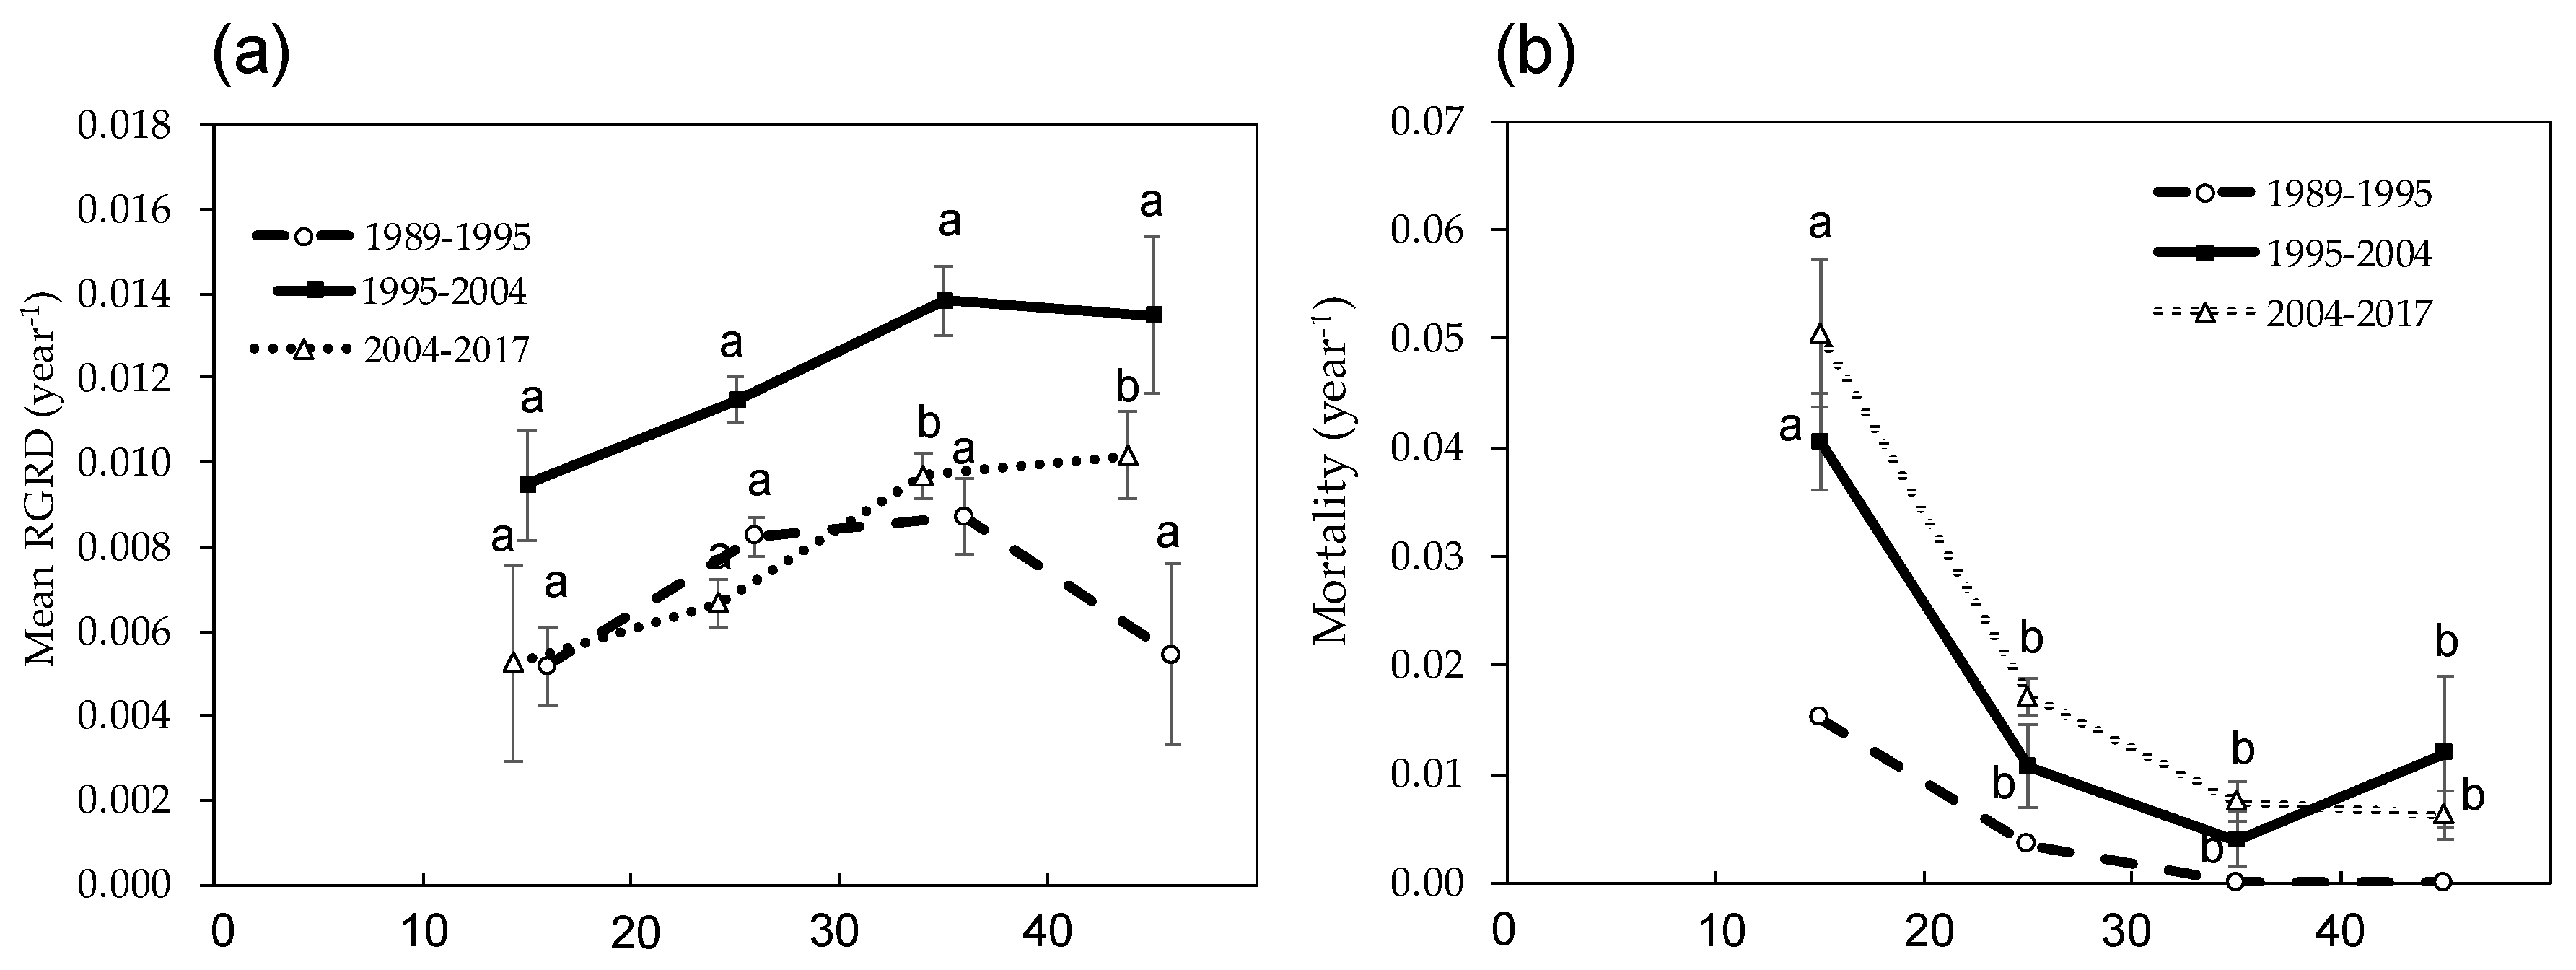
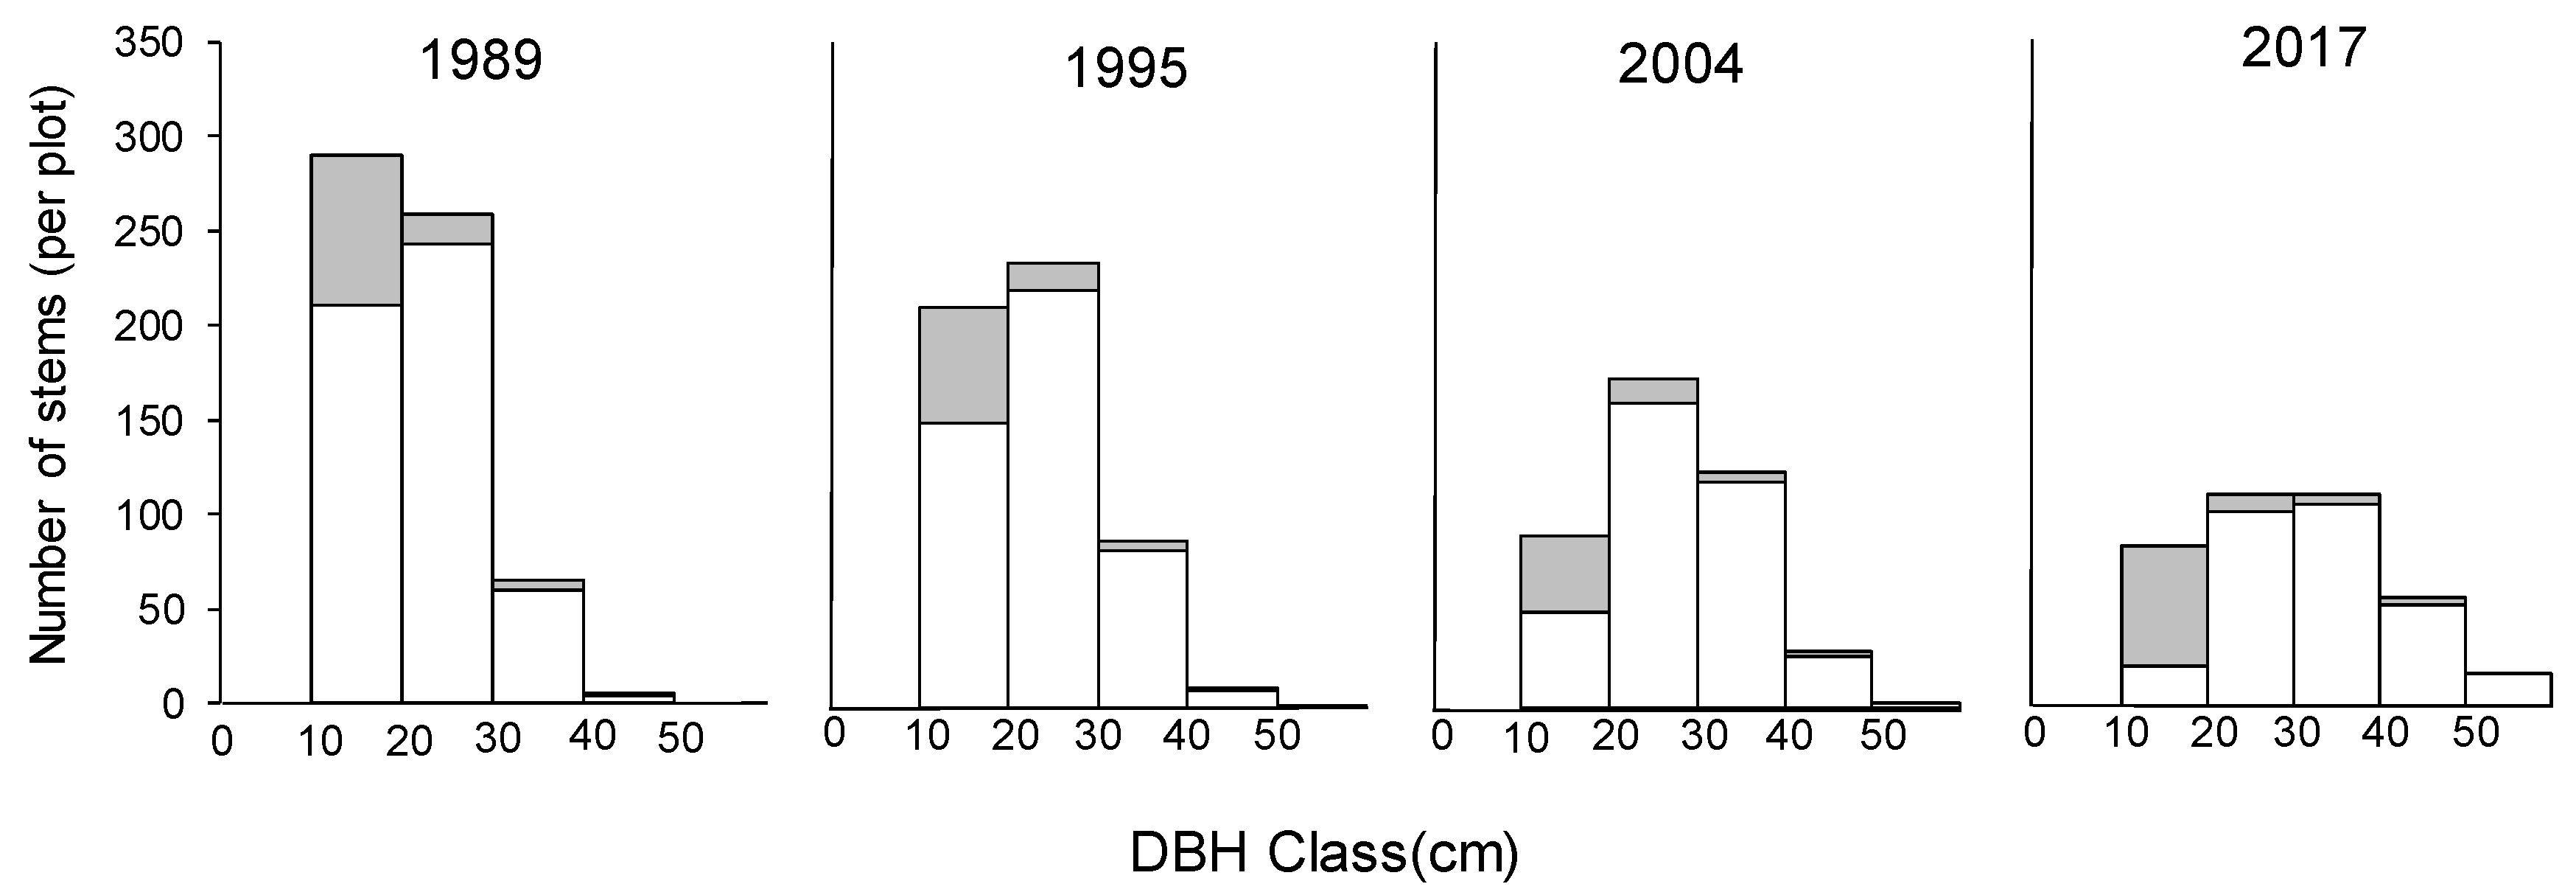
The mean annual relative growth rate of DBH (RGRD) of C. cuspidata in each survey interval was 0.007 ± 0.0009, 0.012 ± 0.0010, and 0.008 ± 0.0012, respectively, which was highest during the second interval of 1995 to 2004. However, comparing the RGRD of C. cuspidate in each DBH class, there were no significant changes of RGRD with DBH size during the first interval of 1989 to 1995 (Figure 4a). Conversely, RGRD of individuals larger than 30 cm DBH size were significantly higher for the 2004–2017 period (Figure 4a). Annual mortality of C. cuspidata showed a similar pattern during the three survey periods, and the mortality reduced significantly from the 10–20 cm class to the 20–30 cm class; then, the mortality did not show significant differences. Because of different growth and mortality pattern of C. cuspidata, with decreasing deciduous trees, the DBH class distribution changed from L shape to unimodal during the study period (Figure 5). In this case, the study forest was close to being a pure stand of C. cuspidata during the 28 years due to the large DBH size and its predominance of BA (Table 2 and Table 3).
3.3. Change in Forest Biomass and Dynamics
SI of AGB and dead necromass from tree mortality (D) were monitored in the permanent plot for 28 years (Table 4). Due to the SI of C. cuspidata being much higher than D, despite the SI of the other species being less than D, biomass of the forest stand increased gradually over 28 years (Table 5). Almost all the SI came from growth of stems and branches (woody NPP); moreover, growth of C. cuspidata contributed more than 90% of the SI in each measurement interval (Table 4). The annual woody NPP of all trees during the three survey periods: 1989–1995, 1995–2004 and 2004–2017 was 2.40 ± 0.13 ton ha−1 year−1, 3.93 ± 0.33 ton ha−1 year−1 and 3.26 ± 0.16 ton ha−1 year−1, respectively (Table 4). It was highest during the 1995–2004 period when the RGRD of C. cuspidata was relatively high (Figure 4a).
The AGB (including foliage) for all trees with DBH ≥ 10 cm was estimated to be 131.70 ± 7.17 ton ha−1, 142.67 ± 8.89 ton ha−1, 162.83 ± 8.32 ton ha−1, and 180.64 ± 8.68 ton ha−1 in the surveys of 1989, 1995, 2004 and 2017, respectively (Table 5). The major proportion of aboveground biomass was from C. cuspidata, and it gradually increased during the study period. In addition, the aboveground biomass continued to increase from 1989 to 2017, but showed different patterns among DBH size classes during the 28-year period (Table 5). Initially, the aboveground biomass of all trees at 10–30 cm classes decreased significantly and accounted for most of the total aboveground biomass in the 1989 survey (69.8%) and 1995 (60.6%). However, in the surveys of 2004 and 2017, the aboveground biomass of trees with DBH ≥ 30 cm increased significantly and accounted for most of the total aboveground biomass (64.4% and 79.2%, respectively; Table 5).
4. Discussion
This 28-year study showed us the developmental process of a secondary lucidophyllous forest. In 2017, there were few canopy trees other than Castanopsis cuspidata, with some pioneer deciduous species (Ilex micrococca, Magnolia obovata and Eleutherococcus sciadophylloides) and only one stem of an evergreen species, Quercus glauca (Figure 2d). The long-term direct monitoring illustrated that there was a simplification of species composition, with the number of species over 10 cm DBH decreasing from 17 to 11 due to the exclusion of deciduous species (Table 3). A predominance of the tree C. cuspidata also accompanied a decrease in tree density (Figure 3) during the 28-year study, which was consistent with our hypothesis. These results further support the previous studies, which suggested that the simplification of the species composition in the Castanopsis zone was caused by the lack of lucidophyllous elements in the northern limit of their distribution and strong sprouting capacity [10,18]. In addition, Kubota et al. [20] studied the biomass accumulation in proportion to decreasing tree density in young secondary lucidophyllous forests. They concluded that trees died because of self-thinning, which implied intraspecific competition following the –3/2 power low [25]. The slope of the relationship between the stem density and dry weight of C. cuspidata during the study period was nearly –3/2 (Figure 3), possibly suggesting that self-thinning governs the process of this stand’s development.
Previous studies of AGB and NPP in lucidophyllous forests are summarized in Table 6. Woody NPP means the increments of new organic matter are retained by the biomass of stems and branches [24], and is also one of the most important components of carbon sequestration in forest ecosystems [26]. Biomass and NPP of old-growth lucidophyllous forests have been well documented, especially in Japan (Table 6), and their production ecology has flourished since the 1960s within the IBP (International Biological Program), e.g., Minamata Forest [27] and Aya Research site [5]. These old-growth forests have a fairly high AGB of more than 300 ton ha−1, and have a woody NPP ranging from 3.4 to 8.8 ton ha−1 year−1 (Table 6). In contrast, AGB of young secondary lucidophyllous forests, including this study site, were less than 150 ton ha−1 under developmental stages in human populated areas, and woody NPP tended to be higher than old-growth forests, which ranged from 7.5 to 14.1 ton ha−1 year−1 (Table 6).
Age-related decline of woody NPP seems more important because only a few old-growth lucidophyllous forests occur in human populated areas. For example, Tadaki [28,29] revealed that the density depended on mortality and a change of production structure in a very young stand of C. cuspidata, which had regenerated naturally by coppice-shoots and seeds. An 11-year stand of 42,000 stems ha−1 decreased to 24,667 stems in a 14-year stand in proportion to biomass increments of 56.4 to 80.5 ton ha−1 year−1 over three years, and the woody NPP was much higher (14.1 ton ha−1 year−1) than it was in the mature lucidophyllous forests. Moreover, the woody NPP reached up to 11.8 ton ha−1 year−1 in a 12-year young stand (67.1 ton ha−1 year−1 of AGB) of C. echidnocarpa in subtropical China [30].
The AGB of the studied stand (131.7 ton ha−1 to 180.6 ton ha−1) was at a medium level compared with other lucidophyllous forests (Table 6), and it steadily accumulated during the study period (Table 5). Woody NPP ranged from 2.40 ± 0.13 ton ha−1 year−1 (1989 to 1995) to 3.93 ± 0.33 ton ha−1 year−1 (1995 to 2004) at the study site. Contrary to expectations, age-related wood production decline was not observed during the 28-year investigation. The woody NPP of C. cuspidate increased from 2.23 to 3.06 ha−1 year−1 during the 28-year period irrespective of the significant decrease in density of the species (666 ha−1 to 404 ha−1) due to self-thinning (Table 2) in our study site. One reason is that the size of dead trees concentrated on the 10–20 cm class, and the size of all tree variability increased. Therefore, bigger trees (20 cm ≤ DBH ≤ 40 cm) contributed significantly to wood production, and the growth can successfully compensate for the stem wood loss (Figure 4a,b). Moreover, age-related decline in wood production is related to intrinsic growth limitation of individual trees and/or growth reduction due to local competition among neighboring trees (e.g., self-thinning process) [31]. Berger et al. [32] studied the effects of neighborhood competition considering self-thinning and natural recruitment, which has not been considered for age-related production decline. They found that the wood production decline starts after self-thinning; it can thus be suggested that the study site was still during the self-thinning process and the growth of dominant individual tree (C. cuspidata) still increased. However, the woody NPP at the study site was relatively low while at a developmental stage with medium biomass. This may be due to the low growth of C. cuspidata because the lucidophyllous forest in this study is located near the northern limit of its distribution. Moreover, Clark et al. [23] suggested that the long intervals typical of forest production studies might result in the underestimation of woody NPP. This may be because the biomass increment of dead trees during the intervals is possibly ignored, especially with regards to the competitive exclusion of trees with high mortality during the study period in the study area (Figure 3).
5. Conclusions
Overall, the 28-year monitoring of this lucidophyllous stand showed that the development of the forest included decreasing tree stems but with increasing biomass, and also with a decreasing number of deciduous pioneer species within the monodomination of C. cuspidata. The trajectory of biomass accumulation in proportion to decreasing tree density of C. cuspidata implied that self-thinning governs the process of this stand’s development. The woody NPP of this stand was low compared with other lucidophyllous forests in East Asia. However, the woody NPP was still 3.26 ton ha−1 year−1 during the interval of 2004 to 2017 when it was nearly 70 years old. There was no age-related decline of woody NPP during secondary succession when the self-thinning process governed the study stand. Moreover, the long survey intervals for studying woody NPP with a high mortality rate of C. cuspidata may result in the underestimation of tree growth. Therefore, the secondary lucidophyllous forest has sequestered a substantial amount of carbon through woody biomass increment and will continue with its accumulation of biomass in the future. Further long-term monitoring of trends in woody NPP is needed to test the intrinsic growth limitation [32] that causes NPP decline in old-growth forests.
Acknowledgments
We thank the members of the laboratory of Forest Ecology, Faculty of Applied Biological Sciences, Gifu University, and the members of the Vegetation Function Laboratory of the River Basin Research Center, Gifu University, for their assistance with field measurements. We also would like to thank Enago (Crimson Interactive Pvt. Ltd., Mumbai, India) for the English language review.
Author Contributions
A.K. and S.K. conceived and designed the field experiment; S.C., S.K., R.C. and S.Y. performed field survey; S.C. and T.O. analyzed the data and wrote the paper.
Conflicts of Interest
The authors declare no conflict of interest.
References
- Ohsawa, M. An interpretation of latitudinal patterns of forest limits in south and East Asian mountains. J. Ecol. 1990, 78, 326–339. [Google Scholar] [CrossRef]
- Tagawa, H. Distribution of lucidophll Oak-Laurel forest formation in Asia and other areas. Tropics 1995, 5, 1–40. [Google Scholar] [CrossRef]
- Ohsawa, M. Latitudinal pattern of mountain vegetation zonation in southern and eastern Asia. J. Veg. Sci. 1993, 4, 13–18. [Google Scholar] [CrossRef]
- Tanouchi, H.; Yamamoto, S. Structure and regeneration of canopy species in an old-growth evergreen broad-leaved forest in Aya district, southwestern Japan. Plant Ecol. 1995, 117, 51–60. [Google Scholar] [CrossRef]
- Sato, T.; Kominami, Y.; Saito, S.; Niiyama, K.; Manabe, T.; Tanouchi, H.; Noma, N.; Yamamoto, S. An introduction to the Aya Research Site, a long-term ecological research site, in a warm temperate evergreen broad-leaved forest ecosystems in southwestern Japan: Research topics and design. Bull. Kitakyushu Mus. Nat. His. 1999, 18, 57–180. [Google Scholar]
- Do, T.V.; Sato, T.; Saito, S.; Kozan, O.; Yamagawa, H.; Nagamatsu, D.; Nishimura, N.; Manabe, T. Effects of micro-topographies on stand structure and tree species diversity in an old-growth evergreen broad-leaved forest, southwestern Japan. Glob. Ecol. Conserv. 2015, 4, 185–196. [Google Scholar] [CrossRef] [Green Version]
- Manabe, T.; Nishimura, N.; Miura, M.; Yamamoto, S. Population structure and spatial patterns for trees in a temperate old-growth evergreen broad-leaved forest in Japan. Plant Ecol. 2000, 151, 181–197. [Google Scholar] [CrossRef]
- Manabe, T.; Shimatani, K.; Kawasaki, S.; Aikawa, S.I.; Yamamoto, S.I. The patch mosaic of an old-growth warm-temperate forest: Patch-level descriptions of 40-year gap-forming processes and community structures. Ecol. Res. 2009, 24, 575–586. [Google Scholar] [CrossRef]
- Miura, M.; Manabe, T.; Nishimura, N.; Yamamoto, S. Forest canopy and community dynamics in a temperate old-growth evergreen broad-leaved forest, south-western Japan: A 7-year study of a 4-ha plot. J. Ecol. 2001, 89, 841–849. [Google Scholar] [CrossRef]
- Ishida, H.; Hattori, T.; Takeda, Y. Comparison of species composition and richness between primary and secondary lucidophyllous forests in two altitudinal zones of Tsushima Island, Japan. For. Ecol. Manag. 2005, 213, 273–287. [Google Scholar] [CrossRef]
- Ohtsuka, T.; Shizu, Y.; Nishiwaki, A.; Yashiro, Y.; Koizumi, H. Carbon cycling and net ecosystem production at an early stage of secondary succession in an abandoned coppice forest. J. Plant Res. 2010, 123, 393–401. [Google Scholar] [CrossRef] [PubMed]
- Fang, J.Y.; Kato, T.; Guo, Z.D.; Yang, Y.H.; Hu, H.F.; Shen, H.H.; Zhao, X.; Kishimoto-Mo, A.W.; Tang, Y.H.; Houghton, R.A. Evidence for environmentally enhanced forest growth. Proc. Natl. Acad. Sci. USA 2014, 111, 9527–9532. [Google Scholar] [CrossRef] [PubMed]
- Pan, Y.; Birdsey, R.A.; Fang, J.Y.; Houghton, R.; Kauppi, P.E.; Kurz, W.A.; Phillips, O.L.; Shvidenko, A.; Lewis, S.L.; Canadell, J.G.; et al. large and persistent carbon sink in the world’s forests. Science 2011, 333, 988–993. [Google Scholar] [CrossRef] [PubMed]
- Odum, E.P. The strategy of ecosystem development. Science 1969, 164, 262–270. [Google Scholar] [CrossRef] [PubMed]
- Ohtsuka, T.; Mo, W.; Satomura, T.; Inatomi, M.; Koizumi, H. Biometric based carbon flux measurements and net ecosystem production (NEP) in a temperate deciduous broad-leaved forest beneath a flux tower. Ecosystems 2007, 10, 324–334. [Google Scholar] [CrossRef]
- Gower, S.T.; McMurtrie, R.E.; Murty, D. Aboveground net primary production decline with stand age: Potential causes. Trends Ecol. Evol. 1996, 11, 378–382. [Google Scholar] [CrossRef]
- Magnani, F.; Mencuccini, M.; Borghetti, M.; Berbigier, P.; Berninger, F.; Delzon, S.; Grelle, A.; Hari, P.; Jarvis, P.G.; Kolari, P.; et al. The human footprint in the carbon cycle of temperate and boreal forests. Nature 2007, 447, 848–850. [Google Scholar] [CrossRef] [PubMed]
- Aiba, S.; Hill, D.A.; Agetsuma, N. Comparison between old-growth stands and secondary stands regenerating after clear-felling in warm-temperate forests of Yakushima, southern Japan. For. Ecol. Manag. 2001, 140, 163–175. [Google Scholar] [CrossRef]
- Kubota, Y. Population structure and growth dynamics of Castanopsis sieboldii in secondary and old growth subtropical forests in southern Japan. Occas. Pap. 2003, 38, 47–64. [Google Scholar]
- Kubota, Y.; Katsuda, K.; Kikuzawa, K. Secondary succession and effects of clear-logging on diversity in the subtropical forests on Okinawa Island, southern Japan. Biodivers. Conserv. 2005, 14, 879–901. [Google Scholar] [CrossRef]
- Gifu City: Preservation and Management Plan of Gifu Castle Historic Site 2012. Available online: http://www.city.gifu.lg.jp/8881.htm (accessed on 24 April 2014).
- Kawanabe, S. A subtropical broad-leaved forest at Yona, Okinawa. In Primary Productivity of Japanese Forests—Productivity of Terrestrial Communities; Shidei, T., Kira, T., Eds.; University of Tokyo Press: Tokyo, Japan, 1977; pp. 268–279. [Google Scholar]
- Clark, D.A.; Brown, S.; Kicklighter, D.W.; Chambers, J.Q.; Thomlinson, J.R.; Ni, J. Measuring net primary production in forests: Concepts and field methods. Ecol. Appl. 2001, 11, 356–370. [Google Scholar] [CrossRef]
- Ohtsuka, T.; Saigusa, N.; Iimura, Y.; Muraoka, H.; Koizumi, H. Biometric-Based Estimations of Net Primary Production (NPP) in Forest Ecosystems. In Canopy Photosynthesis: From Basics to Applications Volume 42 of the Series Advances in Photosynthesis and Respiration; Hikosaka, K., Niinemets, Ü., Anten, N., Eds.; Springer: Dordrecht, The Netherlands, 2016; pp. 333–351. [Google Scholar]
- Yoda, K.; Kira, T.; Ogawa, F.; Hozumi, K. Self-thinning in overcrowded pure stands under cultivated and natural conditions (Intraspecific competition among higher plants. XI). J. Biol. Osaka City Univ. 1963, 14, 107–129. [Google Scholar]
- Ohtsuka, T.; Saigusa, N.; Koizumi, H. On linking multiyear biometric measurements of tree growth with eddy covariance-based net ecosystem production. Glob. Chang. Biol. 2009, 15, 1015–1024. [Google Scholar] [CrossRef]
- Kira, T.; Yabuki, K. Primary production rate in the Minamata forest. In Biological production in a warm-Temperate Evergreen Oak Forest of Japan; Kira, T., Ono, Y., Hosokawa, T., Eds.; JIBP Synthesis., 18; University of Tokyo Press: Tokyo, Japan, 1978; pp. 131–138. [Google Scholar]
- Tadaki, Y. Studies on the production structure of forest (XIV) The third report on the primary production of a young stand of Castanopsis cuspidata. Jpn. J. For. Res. 1968, 50, 60–65. [Google Scholar]
- Tadaki, Y. Studies on the production structure of forest (VII) The primary production of a young stand of Castanopsis cuspidata. Jpn. J. Ecol. 1965, 15, 142–147. [Google Scholar]
- Dang, C.L.; Wu, Z.L. Studies on the net primary production for Castanopsis echidnocarpa community of monsoon evergreen broad-leaved forest. J. Yunnan Univ. 1992, 14, 108–117. [Google Scholar]
- Ryan, M.G.; Binkley, D.; Fownes, J.H. Age-related decline in forest productivity: Pattern and process. Adv. Ecol. Res. 1997, 27, 213–262. [Google Scholar]
- Berger, U.; Hildenbrandt, H.; Grimm, V. Age-related decline in forest production: Modelling the effects of growth limitation, neighbourhood competition and self-thinning. J. Ecol. 2004, 92, 846–853. [Google Scholar] [CrossRef]
- Sato, T.; Kominami, Y.; Saito, S.; Niiyama, K. Spatial variations of net primary production in an old-growth lucidophyllous forest, Aya, southwestern Japan. In Proceedings of the Japanese Forestry Society Conference, Morioka, Japan, 31 March 2003. [Google Scholar]
- Do, T.V.; Sato, T.; Saito, S.; Kozan, O. Fine-root production and litterfall: Main contributions to net primary production in an old-growth evergreen broad-leaved forest in southwestern Japan. Ecol. Res. 2015, 30, 921–930. [Google Scholar]
- Sato, T.; Kominami, Y.; Saito, S.; Niiyama, K.; Tanouchi, H.; Nagamatsu, D.; Nomiya, H. Temporal dynamics and resilience of fine litterfall in relation to typhoon disturbances over 14 years in an old-growth lucidophyllous forest in southwestern Japan. Plant Ecol. 2010, 208, 187–198. [Google Scholar] [CrossRef]
- Kimura, M. Primary production of the warm-temperate laurel forest in the southern part of Osumi peninsula, Kyushu, Japan. Misc. Rep. Res. Inst. Nat. Resour. 1960, 52–53, 36–47. [Google Scholar]
- Yang, T.H.; Song, K.; Da, L.J.; Li, X.P.; Wu, J.P. The biomass and aboveground net primary productivity of Schima superba—Castanopsis carlesii forests in east China. Sci. China Life Sci. 2010, 53, 811–821. [Google Scholar] [CrossRef] [PubMed]
- Lin, Y.M.; Lin, P.; Li, Z.J.; He, J.Y.; Liu, C.D. Biomass and productivity of Castanopsis eyrei community in Wuyi Mountains. J. Xiamen Univ. (Nat. Sci.) 1996, 35, 269–275. [Google Scholar]
- Dang, C.L.; Wu, Z.L. Studies on the net primary production of Castanopsis orthacantha community. J. Yunnan Univ. 1994, 16, 200–204. [Google Scholar]
- Dang, C.L.; Wu, Z.L. Studies on the biomass of Castanopsis orthacantha community. J. Yunnan Univ. 1994, 16, 195–199. [Google Scholar]
- Dang, C.L.; Wu, Z.L.; Zhang, Z. Studies on the biomass of Cyclobalanopsis delavayi community. J. Yunnan Univ. 1994, 16, 205–209. [Google Scholar]
- Dang, C.L.; Wu, Z.L.; Zhang, Z. Studies on the net primary production of Cyclobalanopsis delavayi community. J. Yunnan Univ. 1994, 16, 210–219. [Google Scholar]
- Dang, C.L.; Wu, Z.L. Studies on the biomass for Castanopsis echidnocarpa Community of monsoon evergreen broad-leaved forest. J. Yunnan Univ. 1992, 14, 95–107. [Google Scholar]
- Zhang, L.; Luo, T.X.; Deng, K.M.; Dai, Q.; Huang, Y.; Jiang, Z.F.; Tao, M.Y.; Zeng, K.Y. Biomass and net primary productivity of secondary evergreen broadleaved forest in Huangmian Forest Farm, Guangxi. Chin. J. Appl. Ecol. 2004, 15, 2029–2033. [Google Scholar]
- Xie, S.C.; Liu, W.Y.; Li, S.C.; Yang, G.P. Preliminary studies on the biomass of middle-mountain moist evergreen broadleaved forests in Ailao Mountain, Yunnan. Acta Phytoecol. Sin. 1996, 20, 167–176. [Google Scholar]
Figure 1.
(a) location of the study site at Mt. Kinka (▲), central Japan; (b) the square indicates the permanent plot of 70 m × 100 m at the lower slope of Mt. Kinka. The contours signify elevation (m a.s.l.).
Figure 1.
(a) location of the study site at Mt. Kinka (▲), central Japan; (b) the square indicates the permanent plot of 70 m × 100 m at the lower slope of Mt. Kinka. The contours signify elevation (m a.s.l.).

Figure 2.
Diameter at breast height (DBH) class distributions of the main four evergreen and deciduous broad-leaved species and all tree stems in the permanent plot in 2017, (a): Castanopsis cuspidata; (b): Cleyera japonica; (c): Eurya japonica; (d): Quercus glauca; (e): Ilex micrococca; (f): Ilex macropoda; (g): Magnolia obovata (h): Eleutherococcus sciadophylloides; (i): Total. Hatched areas represent sprouting stems from root suckers (the area of per plot was 0.7 ha).

Figure 3.
Relationships between tree density (stems ha−1) and mean aboveground weight (kg) of Castanopsis cuspidata in the permanent plot during the study period. The number shows the measuring year of the forest biomass.
Figure 3.
Relationships between tree density (stems ha−1) and mean aboveground weight (kg) of Castanopsis cuspidata in the permanent plot during the study period. The number shows the measuring year of the forest biomass.

Figure 4.
(a) mean relative growth rate of DBH (RGRD) of Castanopsis cuspidata in each measuring interval; (b) mortality of each DBH class of C. cuspidata in each measuring interval. The DBH class of the stems is the beginning of each measuring interval (the DBH ≥ 40 cm class includes several stems of DBH ≥ 50 cm.). Error bars indicate SE (Stand Error) of the means and the letters indicate significant differences among DBH classes in each measuring interval (p < 0.05). Because the tree map was made during 1995, we could not check the location of some trees that dies during 1989–1995; therefore, the statistical difference of mortality during the 1989–1995 period was not assessed.

Figure 5.
Change of diameter at breast height (DBH) class distributions in the permanent plot during the measuring period. Open bars represent stems of Castanopsis cuspidata, and shaded area stems of other tree species (the area of per plot was 0.7 ha).
Figure 5.
Change of diameter at breast height (DBH) class distributions in the permanent plot during the measuring period. Open bars represent stems of Castanopsis cuspidata, and shaded area stems of other tree species (the area of per plot was 0.7 ha).


Table 1.
Species composition of trees (stems ≥1.3 m of height) in the permanent plot (0.7 ha) in January 2017, DBH: Diameter at breast height.
Table 1.
Species composition of trees (stems ≥1.3 m of height) in the permanent plot (0.7 ha) in January 2017, DBH: Diameter at breast height.
| Species | Basal Area | DBH (cm) | No. of Stems | |||
|---|---|---|---|---|---|---|
| cm2 ha–1 | % | Mean | Maximum | Per Plot | % | |
| Evergreen trees | ||||||
| Castanopsis cuspidata | 404,424 | 87.76 | 28.0 | 63.9 | 359 | 27.6 |
| Cleyera japonica | 20,592 | 4.47 | 5.6 | 23.0 | 458 | 35.2 |
| Eurya japonica | 6580 | 1.43 | 5.0 | 12.6 | 206 | 15.8 |
| Quercus glauca | 3321 | 0.72 | 3.3 | 37.4 | 118 | 9.1 |
| Ilex rotunda | 350 | 0.08 | 3.2 | 9.7 | 23 | 1.8 |
| Prunus spinulosa | 78 | 0.02 | 3.0 | 4.8 | 6 | 0.5 |
| Illicium anisatum | 56 | 0.01 | 4.9 | 6.1 | 2 | 0.2 |
| Aucuba japonica | 54 | 0.01 | 1.9 | 3.7 | 10 | 0.8 |
| Ilex latifolia | 18 | < 0.01 | 2.2 | 3.0 | 3 | 0.2 |
| Cinnamomum tenuifolium | 16 | < 0.01 | 3.8 | 3.8 | 1 | 0.08 |
| Gardenia jasminoides | 13 | < 0.01 | 1.9 | 2.2 | 3 | 0.2 |
| Photinia glabra | 6 | < 0.01 | 1.3 | 1.8 | 3 | 0.2 |
| Ligustrum japonicum | 5 | < 0.01 | 2.2 | 2.2 | 1 | 0.08 |
| Subtotal | 435,514 | 94.51 | - | - | 1193 | 91.7 |
| Deciduous trees | ||||||
| Ilex micrococca | 6213 | 1.35 | 42.7 | 48.4 | 3 | 0.2 |
| Ilex macropoda | 5974 | 1.30 | 7.2 | 25.0 | 71 | 5.5 |
| Magnolia obovata | 4716 | 1.02 | 22.9 | 38.7 | 7 | 0.5 |
| Eleutherococcus sciadophylloides | 3585 | 0.78 | 10.2 | 46.2 | 11 | 0.8 |
| Rhus sylvestris | 2283 | 0.50 | 15.8 | 22.6 | 7 | 0.5 |
| Quercus serrata | 1618 | 0.35 | 38.0 | 38.0 | 1 | 0.08 |
| Padus grayana | 696 | 0.15 | 24.9 | 24.9 | 1 | 0.08 |
| Clethra barbinervis | 95 | 0.02 | 5.5 | 9.0 | 2 | 0.2 |
| Diospyros kaki | 45 | 0.01 | 6.3 | 6.3 | 1 | 0.08 |
| Hamamelis japonica | 25 | 0.01 | 4.7 | 4.7 | 1 | 0.08 |
| Carpinus laxiflora | 22 | < 0.01 | 4.4 | 4.4 | 1 | 0.08 |
| Aphananthe aspera | 9 | < 0.01 | 2.9 | 2.9 | 1 | 0.08 |
| Styrax japonica | 8 | < 0.01 | 2.6 | 2.6 | 1 | 0.08 |
| Subtotal | 25,290 | 5.49 | - | - | 108 | 8.3 |
| Total | 460,804 | 100 | 11.7 | 63.9 | 1301 | 100 |
Table 2.
Dynamics of basal area (BA; m2 ha−1) and number of stems (stems ha−1) of each species (DBH ≥ 10 cm) in the permanent plot during the 28-year period a.
Table 2.
Dynamics of basal area (BA; m2 ha−1) and number of stems (stems ha−1) of each species (DBH ≥ 10 cm) in the permanent plot during the 28-year period a.
| Species | Number of Stems (ha–1) | BA (m2 ha–1) | ||||||
|---|---|---|---|---|---|---|---|---|
| 1989 (May) | 1995 (May) | 2004 (October) | 2017 (January) | 1989 (May) | 1995 (May) | 2004 (October) | 2017 (January) | |
| Evergreen trees | ||||||||
| Castanopsis cuspidata | 666 ± 13 a | 626 ± 13 a | 519 ± 14 b | 404 ± 10 c | 29.18 ± 1.84 a | 31.42 ± 2.46 ab | 35.70 ± 2.06 ab | 38.71 ± 2.22 b |
| Other species | 19 ± 5 a | 30 ± 6 a | 20 ± 5 a | 56 ± 7 b | 0.33 ± 0.10 a | 0.40 ± 0.11 ab | 0.43 ± 0.10 ab | 0.84 ± 0.14 b |
| Subtotal | 684 ± 15 a | 656 ± 18 a | 539 ± 11 b | 460 ± 7 c | 29.51 ± 1.80 a | 31.81 ± 2.41 a | 36.13 ± 2.03 b | 39.54 ± 2.24 c |
| Deciduous trees | 91 ± 30 a | 79 ± 34 a | 56 ± 19 a | 46 ± 14 a | 2.76 ± 0.85 a | 2.90 ± 0.94 a | 2.45 ± 0.59 a | 2.21 ± 0.77 a |
| Total | 779 ± 37 a | 733 ± 38 a | 591 ± 21 b | 510 ± 16 b | 33.23 ± 1.88 a | 34.99 ± 2.04 ab | 38.31 ± 1.83 ab | 42.13 ± 1.82 b |
a Different letters within each variable indicate significant differences among the different survey year (p < 0.05).
Table 3.
Dynamics of species and stems number in the permanent plot (0.7 ha) during the 28-year period (DBH ≥ 10 cm).
Table 3.
Dynamics of species and stems number in the permanent plot (0.7 ha) during the 28-year period (DBH ≥ 10 cm).
| Species | 1989 (May) | 1995 (May) | 2004 (October) | 2017 (January) | |
|---|---|---|---|---|---|
| Evergreen species | |||||
| 1 | Castanopsis cuspidata | 518 | 463 | 361 | 298 |
| 2 | Cleyera japonica | 12 | 14 | 15 | 39 |
| 3 | Quercus glauca | 2 | 2 | 2 | 1 |
| 4 | Eurya japonica | 1 | 1 | 1 | 4 |
| 5 | Ilex pedunculosa | 1 | 1 | 0 | 0 |
| Subtotal | 534 | 481 | 379 | 342 | |
| Deciduous species | |||||
| 1 | Magnolia obovata | 15 | 13 | 10 | 6 |
| 2 | Eleutherococcus sciadophylloides | 24 | 14 | 5 | 3 |
| 3 | Ilex micrococca | 7 | 7 | 5 | 3 |
| 4 | Ilex macropoda | 16 | 16 | 16 | 17 |
| 5 | Rhus sylvestris | 14 | 9 | 6 | 6 |
| 6 | Quercus serrata | 2 | 2 | 1 | 1 |
| 7 | Padus grayana | 2 | 1 | 1 | 1 |
| 8 | Cerasus jamasakura | 1 | 1 | 0 | 0 |
| 9 | Hamamelis japonica | 1 | 1 | 0 | 0 |
| 10 | Gamblea innovans | 1 | 0 | 0 | 0 |
| 11 | Carpinus laxiflora | 1 | 0 | 0 | 0 |
| 12 | Styrax japonica | 1 | 0 | 0 | 0 |
| Subtotal | 85 | 64 | 44 | 37 | |
| Total | 619 | 545 | 423 | 379 | |
| Number of species | 17 | 14 | 11 | 11 | |
Table 4.
Annual aboveground biomass and wood parts increments (SI) and losses (D) during each measuring interval of Castanopsis cuspidata and other tree species (ton ha −1 year −1) a.
Table 4.
Annual aboveground biomass and wood parts increments (SI) and losses (D) during each measuring interval of Castanopsis cuspidata and other tree species (ton ha −1 year −1) a.
| Parts of Biomass | Period | Castanopsis cuspidata | Other Tree Species | All Trees | |||
|---|---|---|---|---|---|---|---|
| SI | D | SI | D | SI | D | ||
| Aboveground | 1989–1995 | 2.30 ± 0.18 a | 1.09 * | 0.22 ± 0.06 a | 0.28 * | 2.53 ± 0.17 a | 1.37 * |
| 1995–2004 | 3.84 ± 0.38 b | 1.59 ± 0.43 ab | 0.21 ± 0.05 a | 0.32 ± 0.17 a | 4.05 ± 0.34 b | 1.91 ± 0.39 b | |
| 2004–2017 | 3.15 ± 0.21 ab | 1.74 ± 0.21 b | 0.20 ± 0.06 a | 0.27 ± 0.03 a | 3.35 ± 0.17 ab | 2.01 ± 0.20 b | |
| Woody parts (stems & branches) | 1989–1995 | 2.23 ± 0.18 a | 1.05 * | 0.17 ± 0.06 a | 0.26 * | 2.40 ± 0.13 a | 1.31 * |
| 1995–2004 | 3.73 ± 0.37 b | 1.53 ± 0.41 a | 0.20 ± 0.04 a | 0.30 ± 0.16 a | 3.93 ± 0.33 b | 1.83 ± 0.37 | |
| 2004–2017 | 3.06 ± 0.21 ab | 1.67 ± 0.21 a | 0.20 ± 0.06 a | 0.26 ± 0.02 a | 3.26 ± 0.16 ab | 1.93 ± 0.19 b | |
a Different letters within each variable indicate significant differences among the different measuring intervals (p < 0.05). b Because the tree map was made during 1995, we could not check the location of some trees that dies during 1989–1995, therefore, the statistical difference of dead necromass (D) during the 1989–1995 period was not assessed (*).
Table 5.
Change of aboveground biomass of each DBH class of all trees in the permanent plot (10–20 cm means 10 cm ≤ DBH < 20 cm) a.
Table 5.
Change of aboveground biomass of each DBH class of all trees in the permanent plot (10–20 cm means 10 cm ≤ DBH < 20 cm) a.
| Year | 10–20 cm | 20–30 cm | 30–40 cm | ≥40 cm | Total |
|---|---|---|---|---|---|
| 1989 | 23.28 ± 2.59 a | 68.61 ± 2.40 a | 33.56 ± 7.96 a | 6.25 ± 2.64 a | 131.70 ± 7.17 a |
| 1995 | 19.34 ± 2.40 a | 67.18 ± 3.26 a | 43.03 ± 6.74 ab | 13.14 ± 4.46 a | 142.67 ± 8.89 a |
| 2004 | 8.79 ± 2.09 b | 49.26 ± 1.02 b | 69.94 ± 3.95 b | 34.85 ± 8.40 a | 162.83 ± 8.32 ab |
| 2017 | 6.05 ± 1.50 b | 31.60 ± 3.82 c | 63.16 ± 7.13 b | 79.83 ± 13.23 b | 180.64 ± 8.68 b |
a Different letters within each variable indicate significant differences among measuring intervals (p < 0.05).
Table 6.
Comparison of forest biomass and woody NPP of lucidophyllous (evergreen broad-leaved) forests in East Asia. NPP: Net primary production.
Table 6.
Comparison of forest biomass and woody NPP of lucidophyllous (evergreen broad-leaved) forests in East Asia. NPP: Net primary production.
| Latitude and Longtitude | Study Site | Dominant Species | No. of Stems (ha–1) | Aboveground Biomass (ton ha–1 ) | Woody (Stem and Branch) NPP (ton ha–1 year–1) | Reference | ||
|---|---|---|---|---|---|---|---|---|
| Leaf | Stem and Branch | Total | ||||||
| 35°26′ N 136°47′ E | Mt. Kinka, Gifu, Japan | Castanopsis cuspidata | 884 | 5.4 | 133.3 | 138.7 | - | This study |
| 779 | 5.6 | 139.9 | 145.5 | 2.2 | ||||
| 604 | 5.9 | 156.3 | 162.2 | 3.6 | ||||
| 541 | 6.6 | 180.3 | 186.9 | 3.1 | ||||
| 32°47′ N 130°44′ E | Kumamoto City, Japan | Castanopsis cuspidata | 24,667 | 8.4 | 72.1 | 80.5 | 14.1 | [28] |
| 32°12′ N 130°24′ E | Minamata City, Japan | Castanopsis cuspidata | - | 7.8 | 335.3 | 343.1 | 4.6 | [27] |
| - | 7.8 | 369.8 | 377.6 | 3.4 | ||||
| - | 6.8 | 346.7 | 353.5 | 4.5 | ||||
| 32°04′ N 131°09′ E | Aya Research site, Japan | Distylium racemosum; Persea thunbergii; Quercus acuta, salicina, and gilva | 1391 | - | - | 446.4 | 4.3 | [33,34,35] |
| 31°12′ N 130°55′ E | Mt. Aranishi, Japan | Distylium racemosum | - | 11.4 | 312.0 | 323.4 | 7.4 | [36] |
| 29°48′ N 121°47′ E | Tiantong National Forest Park, China | Schima superba; Castanopsis carlesii | - | 4.9 | 157.4 | 162.3 | 3.5 | [37] |
| 27°42′ N 117°41′ E | Wuyi Mountain, China | Castanopsis eyrei | 1140 | 12.9 | 335.1 | 348.0 | 8.8 | [38] |
| 26°45′ N 122°13′ E | Yona, Okinawa Island, Japan | C. cuspidata var. sieboldii | 2900 | 7.7 | 185.6 | 193.3 | 11.4 | [21] |
| 25°24′ N 102°45′ E | Songming, China | Castanopsis orthacantha | 3910 | 7.8 | 192.5 | 200.4 | 11.3 | [39,40] |
| 25°19′ N 103°33′ E | Fuming, China | Cyclobalanopsis delavayi | - | 6.1 | 86.7 | 92.8 | 8.4 | [41,42] |
| 25°19′ N 103°33′ E | Puer, China | Castanopsis echidnocarpa | - | 7.0 | 60.1 | 67.1 | 11.8 | [31,43] |
| - | 6.9 | 124.2 | 131.1 | 11.6 | ||||
| 24°51′ N 109°51′ E | Huangmian, China | Schima superba; Engelhardtia chrysolepis; Castanopsis fissa; Cyclobalanopsis glaucoides | 2050 | 4.9 | 64.2 | 69.1 | 7.5 | [44] |
| 24°10′ N 101°25′ E | Ailao Mountain, China | Lithocarpus xylocarpus; L. chintungensis and Castanopsis wattii | 1100 | 7.9 | 343.6 | 351.5 | 6.6 | [45] |
| 512 | 7.3 | 201.4 | 208.7 | 4.3 | ||||
© 2017 by the authors. Licensee MDPI, Basel, Switzerland. This article is an open access article distributed under the terms and conditions of the Creative Commons Attribution (CC BY) license (http://creativecommons.org/licenses/by/4.0/).
Share and Cite
MDPI and ACS Style
Chen, S.; Komiyama, A.; Kato, S.; Cao, R.; Yoshitake, S.; Ohtsuka, T. Stand Dynamics and Biomass Increment in a Lucidophyllous Forest over a 28-Year Period in Central Japan. Forests 2017, 8, 397. https://doi.org/10.3390/f8100397
AMA Style
Chen S, Komiyama A, Kato S, Cao R, Yoshitake S, Ohtsuka T. Stand Dynamics and Biomass Increment in a Lucidophyllous Forest over a 28-Year Period in Central Japan. Forests. 2017; 8(10):397. https://doi.org/10.3390/f8100397
Chicago/Turabian StyleChen, Siyu, Akira Komiyama, Shogo Kato, Ruoming Cao, Shinpei Yoshitake, and Toshiyuki Ohtsuka. 2017. "Stand Dynamics and Biomass Increment in a Lucidophyllous Forest over a 28-Year Period in Central Japan" Forests 8, no. 10: 397. https://doi.org/10.3390/f8100397
Note that from the first issue of 2016, this journal uses article numbers instead of page numbers. See further details here.