Growth and Its Relationship to Individual Genetic Diversity of Mountain Hemlock (Tsuga mertensiana) at Alpine Treeline in Alaska: Combining Dendrochronology and Genomics

 , , and
Abstract
:1. Introduction
Objective
2. Materials and Methods
2.1. Study Species—Mountain Hemlock
2.2. Study Area—Palmer Creek Drainage: Kenai Peninsula, Alaska
2.3. Sampling Plant Material
2.4. Genome-Wide Marker Development
2.5. Genetic Analysis
2.6. Tree-Ring Processing and Analysis
3. Results
3.1. Genome-Wide Marker Development
3.2. Genomic Diversity
3.3. Tree-Ring Processing and Analysis
4. Discussion
Growth and Stability at Alpine Treeline
5. Conclusions
Supplementary Materials
Acknowledgments
Author Contributions
Conflicts of Interest
References
- Speer, J.H. Fundamentals of Tree-Ring Research; Univeristy of Arizona Press: Tuscon, AZ, USA, 2010. [Google Scholar]
- Hodge, A. The plastic plant: Root responses to heterogeneous supplies of nutrients. New Phytol. 2004, 162, 9–24. [Google Scholar] [CrossRef]
- Robinson, D. The responses of plants to non-uniform supplies of nutrients. New Phytol. 1994, 127, 635–674. [Google Scholar] [CrossRef]
- Traiser, C.; Klotz, S.; Uhl, D.; Mosbrugger, V. Environmental signals from leaves—A physiognomic analysis of European vegetation. New Phytol. 2005, 166, 465–484. [Google Scholar] [CrossRef] [PubMed]
- Peppe, D.J.; Royer, D.L.; Cariglino, B.; Oliver, S.Y.; Newman, S.; Leight, E.; Enikolopov, G.; Fernandez-Burgos, M.; Herrera, F.; Adams, J.M.; et al. Sensitivity of leaf size and shape to climate: Global patterns and paleoclimatic applications. New Phytol. 2011, 190, 724–739. [Google Scholar] [CrossRef] [PubMed]
- Koch, G.W.; Sillett, S.C.; Jennings, G.M.; Davis, S.D. The limits to tree height. Nature 2004, 428, 851–854. [Google Scholar] [CrossRef] [PubMed]
- Peterson, D.W.; Peterson, D.L. Effects of climate on radial growth of subalpine conifers in the North Cascade Mountains. Can. J. For. Res. 1994, 24, 1921–1932. [Google Scholar] [CrossRef]
- Halloy, S.R.P.; Mark, A.F. Comparative leaf morphology spectra of plant communities in New Zealand, the Andes and the European Alps. J. R. Soc. N. Z. 1996, 26, 41–78. [Google Scholar] [CrossRef]
- Petit, G.; Anfodillo, T.; Carraro, V.; Grani, F.; Carrer, M. Hydraulic constraints limit height growth in trees at high altitude. New Phytol. 2011, 189, 241–252. [Google Scholar] [CrossRef] [PubMed]
- Mangla, S.; Sheley, R.L.; James, J.J.; Radosevich, S.R. Intra and interspecific competition among invasive and native species during early stages of plant growth. Plant Ecol. 2011, 212, 531–542. [Google Scholar] [CrossRef]
- King, D.A. The adaptive significance of tree height. Am. Nat. 1990, 135, 809–828. [Google Scholar] [CrossRef]
- Dobbertin, M. Tree growth as indicator of tree vitality and of tree reaction to environmental stress: A review. Eur. J. For. Res. 2005, 124, 319–333. [Google Scholar] [CrossRef]
- Waring, R.H.; Thies, W.G.; Muscato, D. Stem growth per unit of leaf area: A measure of tree vigor. For. Sci. 1980, 26, 112–117. [Google Scholar]
- Körner, C. A re-assessment of high elevation treeline positions and their explanation. Oecologia 1998, 115, 445–459. [Google Scholar] [CrossRef] [PubMed]
- Holtmeier, F.K. Mountain Timberlines: Ecology, Patchiness, and Dynamics; Kluwer Academic Publishers: Dordrecht, The Netherlands; Boston, MA, USA; London, UK, 2009; p. 369. [Google Scholar]
- Paulsen, J.; Weber, U.M.; Körner, C. Tree Growth near Treeline: Abrupt or Gradual Reduction with Altitude? Arct. Antarct. Alp. Res. 2000, 32, 14–20. [Google Scholar] [CrossRef]
- Peterson, D.W.; Peterson, D.L. Mountain hemlock growth responds to climatic variability at annual and decadal time scales. Ecology 2001, 82, 3330–3345. [Google Scholar] [CrossRef]
- Mitton, J.B.; Grant, C. Associations among protein heterozygosity, growth rate, and develomental homeostasis. Annu. Rev. Ecol. Syst. 1984, 15, 479–499. [Google Scholar] [CrossRef]
- Lerner, I.M. Genetic Homeostatsis; Oliver and Boyd: Edinburgh, Scotland; London, UK, 1954. [Google Scholar]
- González-Martínez, S.C.; Krutovsky, K.V.; Neale, D.B. Forest-tree population genomics and adaptive evolution. New Phytol. 2006, 170, 227–238. [Google Scholar] [CrossRef] [PubMed]
- Neale, D.B.; Kremer, A. Forest tree genomics: Growing resources and applications. Nat. Rev. Genet. 2011, 12, 111–122. [Google Scholar] [CrossRef] [PubMed]
- Santos-del-Blanco, L.; Bonser, S.P.; Valladares, F.; Chambel, M.R.; Climent, J. Plasticity in reproduction and growth among 52 range-wide populations of a Mediterranean conifer: Adaptive responses to environmental stress. J. Evol. Biol. 2013, 26, 1912–1924. [Google Scholar] [CrossRef] [PubMed]
- Johnson, J.S.; Gaddis, K.D.; Cairns, D.M.; Lafon, C.W.; Krutovsky, K.V. Plant responses to global change: Next generation biogeography. Phys. Geogr. 2016, 37, 93–119. [Google Scholar] [CrossRef]
- Aitken, S.N.; Yeaman, S.; Holliday, J.A.; Wang, T.; Curtis-McLane, S. Adaptation, migration or extirpation: Climate change outcomes for tree populations. Evol. Appl. 2008, 1, 95–111. [Google Scholar] [CrossRef] [PubMed]
- Gaston, K.J. The Structure and Dynamics of Geographic Ranges; Oxford University Press: New York, NY, USA, 2003. [Google Scholar]
- Livshits, G.; Kobyliansky, E. Lerner’s concept of developmental homeostasis and the problem of heterozygosity level in natural populations. Heredity 1985, 55, 341–353. [Google Scholar] [CrossRef] [PubMed]
- Dobzhansky, T.; Wallace, B. The genetics of homeostasis in drosphila. Proc. Natl. Acad. Sci. USA 1953, 39, 162–171. [Google Scholar] [CrossRef] [PubMed]
- Mitton, J.B. Relationship between heterozygosity for enzyme loci and variation of morphological characters in natural populations. Nature 1978, 273, 661–662. [Google Scholar] [CrossRef] [PubMed]
- Mitton, J.B.; Grant, M.C. Observations on the ecology and evolution of quaking aspen, Populus tremuloides, in the Colorado Front Range. Am. J. Bot. 1980, 67, 202–209. [Google Scholar] [CrossRef]
- Neophytou, C.; Weisser, A.-M.; Landwehr, D.; Šeho, M.; Kohnle, U.; Ensminger, I.; Wildhagen, H. Assessing the relationship between height growth and molecular genetic variation in Douglas-fir (Pseudotsuga menziesii) provenances. Eur. J. For. Res. 2016, 135, 465–481. [Google Scholar] [CrossRef]
- Mitton, J.B.; Knowles, P.; Sturgeon, K.B.; Linhart, Y.B.; Davis, M. Associations between Heterozygosity and Growth Rate Variables in Three Western Forest Trees; Conkle, M.T., Ed.; U.S. Department Agriculture: Washington, DC, USA, 1981.
- Ledig, F.T.; Guries, R.P.; Bonefeld, B.A. The relation of growth to heterozygosity in pitch pine. Evolution 1983, 37, 1227–1238. [Google Scholar] [CrossRef] [PubMed]
- Babushkina, E.A.; Vaganov, E.A.; Grachev, A.M.; Oreshkova, N.V.; Belokopytova, L.V.; Kostyakova, T.V.; Krutovsky, K.V. The effect of individual genetic heterozygosity on general homeostasis, heterosis and resilience in Siberian larch (Larix sibirica L.) using dendrochronology and microsatellite loci genotyping. Dendrochronologia 2016, 38, 26–37. [Google Scholar] [CrossRef]
- Johnson, J.S.; Gaddis, K.D.; Cairns, D.M.; Krutovsky, K.V. Seed dispersal at alpine treeline: An assessment of seed movement within the alpine treeline ecotone. Ecosphere 2017, 8, e01649. [Google Scholar] [CrossRef]
- Herring, E.M.; Gavin, D.G.; Dobrowski, S.Z.; Fernandez, M.; Hu, F.S. Ecological history of a long-lived conifer in a disjunct population. J. Ecol. 2017. [Google Scholar] [CrossRef]
- Owens, J.N.; Molder, M. Sexual reproduction of mountain hemlock (Tsuga mertensiana). Can. J. Bot. 1975, 53, 1811–1826. [Google Scholar] [CrossRef]
- Means, J.E. Tsuga mertensiana. In Silvics of North America; Burns, R.M., Honkala, B.H., Eds.; Forest Service: Washington, DC, USA, 1990; Volume 1, pp. 1279–1306. [Google Scholar]
- Ally, D.; El-Kassaby, Y.A.; Ritland, K. Genetic diversity, differentiation and mating system in mountain hemlock (Tsuga mertensiana) across British Columbia. For. Genet. 2000, 7, 97–108. [Google Scholar]
- Johnson, J.S.; Gaddis, K.D.; Cairns, D.M.; Konganti, K.; Krutovsky, K.V. Landscape genomic insights into the historic migration of mountain hemlock in response to Holocene climate change. Am. J. Bot. 2017, 104, 439–450. [Google Scholar] [CrossRef] [PubMed]
- Taylor, A.H. Forest expansion and climate change in the mountain hemlock (Tsuga mertensiana) zone, Lassen Volcanic National Park, California, USA. Arct. Alp. Res. 1995, 27, 207–216. [Google Scholar] [CrossRef]
- Woodward, A.; Silsbee, D.G.; Schreiner, E.G.; Means, J.E. Influence of climate on radial growth and cone production in subalpine fir (Abies lasiocarpa) and mountain hemlock (Tsuga mertensiana). Can. J. For. Res. 1994, 24, 1133–1143. [Google Scholar] [CrossRef]
- Nowacki, G.J.; Spencer, P.; Brock, T.; Fleming, M.; Jorgenson, T. Unified Ecoregions of Alaska and Neighboring Territories; United States Geological Survey: Reston, VA, USA, 2001.
- Colpaert, N.; Cavers, S.; Bandou, E.; Caron, H.; Gheysen, G.; Lowe, A.J. Sampling tissue for DNA analysis of trees: Trunk cambium as an alternative to canopy leaves. Silvae Genet. 2005, 54, 265–269. [Google Scholar] [CrossRef]
- Doyle, J.; Doyle, J. A rapid procedure for DNA purification from small quantities of fresh leaf tissue. Phytochem. Bull. 1987, 19, 11–15. [Google Scholar]
- Peterson, B.K.; Weber, J.N.; Kay, E.H.; Fisher, H.S.; Hoekstra, H.E. Double Digest RADseq: An inexpensive method for De Novo SNP discovery and genotypin in model and non-model species. PLoS ONE 2012, 7, e37135. [Google Scholar] [CrossRef] [PubMed] [Green Version]
- Puritz, J.B.; Hollenbeck, C.M.; Gold, J.R. dDocent: A RADseq, variant-calling pipeline designed for population genomics of non-model organisms. PeerJ 2014, 2, e431. [Google Scholar] [CrossRef] [PubMed]
- Danecek, P.; Auton, A.; Abecasis, G.; Albers, C.A.; Banks, E.; DePristo, M.A.; Handsaker, R.E.; Lunter, G.; Marth, G.T.; Sherry, S.T.; et al. The variant call format and VCFtools. Bioinformatics 2011, 27, 2156–2158. [Google Scholar] [CrossRef] [PubMed]
- Foll, M.; Gaggiotti, O. A genome-scan method to identify selected loci appropriate for both dominant and codominant markers: A Bayesian perspective. Genetics 2008, 180, 977–993. [Google Scholar] [CrossRef] [PubMed]
- Peakall, R.; Smouse, P.E. Genalex 6: Genetic analysis in Excel. Population genetic software for teaching and research. Mol. Ecol. Notes 2006, 6, 288–295. [Google Scholar] [CrossRef]
- Paradis, E. Pegas: An R package for population genetics with an integrated-modular approach. Bioinformatics 2010, 26, 419–420. [Google Scholar] [CrossRef] [PubMed]
- R Development Core Team. R: A Language and Environment for Statistical Computing; R Development Core Team: Vienna, Austria, 2017. [Google Scholar]
- Lafon, C.W. Stand dynamics of a yellow-poplar (Liriodendron tulipifera L.) forest in the Appalachian mountains, Virginia, USA. Dendrochronologia 2004, 22, 43–52. [Google Scholar] [CrossRef]
- Fritts, H.C. Tree Rings and Climate; Academic Press: New York, NY, USA, 1976. [Google Scholar]
- Stokes, M.; Smiley, T. An Introduction to Tree-Ring Dating; University of Chicago Press: Chicago, IL, USA, 1968; p. 73. [Google Scholar]
- Applequist, M. A simple pith locator for use with off-center increment cores. J. For. 1958, 56, 141. [Google Scholar]
- Bunn, A.G. A dendrochronology program library in R (dplR). Dendrochronologia 2008, 26, 115–124. [Google Scholar] [CrossRef]
- Cook, E.R. The decomposition of tree-ring series for environmental studies. Tree-Ring Bull. 1987, 47, 37–59. [Google Scholar]
- Jarvis, S.K.; Wiles, G.C.; Appleton, S.N.; D’Arrigo, R.D.; Lawson, D.E. A warming-induced biome shift detected in tree growth of mountain hemlock [Tsuga mertensiana (Bong.) Carrière] along the gulf of Alaska. Arct. Antarct. Alp. Res. 2013, 45, 211–218. [Google Scholar] [CrossRef]
- Gedalof, Z.E.; Smith, D.J. Dendroclimatic response of mountain hemlock (Tsuga mertensiana) in Pacific North America. Can. J. For. Res. 2001, 31, 322–332. [Google Scholar] [CrossRef]
- Treter, U. Die Baumgrenzen Skandinaviens. Oekologische und dendroklimatische Untersuchungen; Franz Steiner Verlag: Wiesbaden, Germany, 1984. [Google Scholar]
- Tranquillini, W. Physiological Ecology of the Alpine Timberline. Tree Existence at High Altitudes with Special Reference to the European Alps; Springer: Berlin, Germany, 1979. [Google Scholar]
- Körner, C. Alpine Treelines: Functional Ecology of the Global High Elevation Tree Limits; Springer: Basel, Switzerland, 2012. [Google Scholar]
- Butler, D.R.; Malanson, G.P.; Walsh, S.; Fagre, D.B. Influences of Geomorphology and Geology on Alpine Treeline in the American West—More Important than Climatic Influences? Phys. Geogr. 2007, 28, 434–450. [Google Scholar] [CrossRef]
- Cairns, D.M. Patterns of winter desiccation in krummholz forms of Abies lasiocarpa at treeline sites in Glacier National Park, Montana, USA. Geogr. Ann. Ser. A Phys. Geogr. 2001, 83A, 157–168. [Google Scholar] [CrossRef]
- Elliott, G.P. Extrinsic regime shifts drive abrupt changes in regeneration dynamics at upper treeline in the Rocky Mountains, USA. Ecology 2012, 93, 1614–1625. [Google Scholar] [CrossRef] [PubMed]
- Germino, M.J.; Smith, W.K. Sky exposure, crown architecture, and low-temperature photoinhibition in conifer seedlings at alpine treeline. Plant Cell Environ. 1999, 22, 407–415. [Google Scholar] [CrossRef]
- Harsch, M.A.; Bader, M.Y. Treeline form—A potential key to understanding treeline dynamics. Glob. Ecol. Biogeogr. 2011, 20, 582–596. [Google Scholar] [CrossRef]
- Kupfer, J.A.; Cairns, D.M. The suitability of montane ecotones as indicators of global climatic change. Prog. Phys. Geogr. 1996, 20, 253–272. [Google Scholar] [CrossRef]
- Chhetri, P.K.; Cairns, D.M. Contemporary and historic population structure of Abies spectabilis at treeline in Barun Valley, eastern Nepal Himalaya. J. Mt. Sci. 2015, 12, 558–570. [Google Scholar] [CrossRef]
- Chhetri, P.K.; Cairns, D.M. Dendroclimatic response of Abies spectabilis at treeline ecotone of Barun Valley, eastern Nepal Himalaya. J. For. Res. 2016, 27, 1163–1170. [Google Scholar] [CrossRef]
- Sullivan, P.F.; Ellison, S.B. Z.; McNown, R.W.; Brownlee, A.H.; Sveinbjornsson, B. Evidence of soil nutrient availability as the proximate constraint on growth of treeline trees in northwest Alaska. Ecology 2015, 96, 716–727. [Google Scholar] [CrossRef] [PubMed]
- Sullivan, P.F.; Sveinbjornsson, B. Microtopographic control of treeline advance in Noatak National Preserve, Northwest Alaska. Ecosystems 2010, 13, 275–285. [Google Scholar] [CrossRef]
- Cieraad, E.; McGlone, M.S. Thermal environment of New Zealand’s gradual and abrupt treeline ecotones. N. Z. J. Ecol. 2014, 38, 12–25. [Google Scholar]
- Mayor, J.R.; Sanders, N.J.; Classen, A.T.; Bardgett, R.D.; Clément, J.-C.; Fajardo, A.; Lavorel, S.; Sundqvist, M.K.; Bahn, M.; Chisholm, C.; et al. Elevation alters ecosystem properties across temperate treelines globally. Nature 2017, 542, 91–95. [Google Scholar] [CrossRef] [PubMed]
- Brown, C.D.; Vellend, M. Non-climatic constraints on upper elevational plant range expansion under climate change. Proc. R. Soc. Lond. B Biol. Sci. 2014, 281. [Google Scholar] [CrossRef] [PubMed]
- Kremer, A.; Ronce, O.; Robledo-Arnuncio, J.J.; Guillaume, F.; Bohrer, G.; Nathan, R.; Bridle, J.R.; Gomulkiewicz, R.; Klein, E.K.; Ritland, K.; et al. Long-distance gene flow and adaptation of forest trees to rapid climate change. Ecol. Lett. 2012, 15, 378–392. [Google Scholar] [CrossRef] [PubMed]
- Kirkpatrick, M.; Barton, N.H. Evolution of a species’ range. Am. Nat. 1997, 150, 1–23. [Google Scholar] [CrossRef] [PubMed]
- Lenormand, T. Gene flow and the limits to natural selection. Trends Ecol. Evol. 2002, 17, 183–189. [Google Scholar] [CrossRef]
- Gaston, K.J. Geographic range limits: Achieving synthesis. Proc. Biol. Sci. 2009, 276, 1395–1406. [Google Scholar] [CrossRef] [PubMed]
- Kubisch, A.; Holt, R.D.; Poethke, H.-J.; Fronhofer, E.A. Where am I and why? Synthesizing range biology and the eco-evolutionary dynamics of dispersal. Oikos 2014, 123, 5–22. [Google Scholar] [CrossRef]
- Balkenhol, N.; Dudaniec, R.Y.; Krutovsky, K.V.; Johnson, J.S.; Cairns, D.M.; Segelbacher, G.; Selkoe, K.A.; von der Heyden, S.; Wang, I.J.; Selmoni, O.; et al. Landscape Genomics: Understanding relationships between environmental heterogeneity and genomic characteristics of populations. In Population Genomics Concepts, Strategies and Approaches; Rajora, O.P., Ed.; Springer: Berlin, Germany, 2017. [Google Scholar]


| TreeID | Est Date | Age | Elev. (m) | Longitude | Latitude | N Loci | N Hets | IndHet | AvTRW | VarTRW |
|---|---|---|---|---|---|---|---|---|---|---|
| PA20107 | 1944 | 68 | 772 | −149.53650 | 60.79341 | 4352 | 716 | 0.134 | 0.95151 | 0.34557 |
| PA2013 | 1979 | 33 | 846 | −149.53470 | 60.79419 | 4664 | 602 | 0.129 | 0.55224 | 0.04262 |
| PA20139 | 1965 | 47 | 722 | −149.53807 | 60.79319 | 4665 | 690 | 0.148 | 0.57192 | 0.19820 |
| PA20145 | 1968 | 44 | 716 | −149.53809 | 60.79317 | 4665 | 715 | 0.153 | 0.73780 | 0.32924 |
| PA20149 | 1987 | 25 | 716 | −149.53832 | 60.79322 | 358 | 71 | 0.198 | 0.82242 | 0.09512 |
| PA20154 | 1944 | 68 | 715 | −149.53842 | 60.79317 | 4665 | 596 | 0.128 | 0.69796 | 0.17935 |
| PA20157 | 1998 | 14 | 704 | −149.53889 | 60.79312 | 4665 | 648 | 0.139 | 0.47880 | 0.04498 |
| PA20164 | 1996 | 16 | 688 | −149.53984 | 60.79335 | 4656 | 679 | 0.146 | 0.92571 | 0.21609 |
| PA2022 | 1954 | 58 | 759 | −149.53675 | 60.79347 | 4540 | 722 | 0.159 | 0.54797 | 0.17426 |
| PA2023 | 1951 | 61 | 823 | −149.53383 | 60.79344 | 4321 | 695 | 0.161 | 0.36076 | 0.08894 |
| PA2032 | 1985 | 27 | 757 | −149.53692 | 60.79354 | 2076 | 350 | 0.169 | 1.11189 | 0.07175 |
| PA2033 | 1940 | 72 | 753 | −149.53700 | 60.79344 | 824 | 168 | 0.204 | 0.82933 | 0.61222 |
| PA2034 | 1928 | 84 | 749 | −149.53708 | 60.79334 | 4620 | 757 | 0.164 | 0.71668 | 0.09697 |
| PA2039 | 1965 | 47 | 722 | −149.53807 | 60.79319 | 4633 | 802 | 0.173 | 0.98235 | 0.16320 |
| PA2040 | 1984 | 28 | 721 | −149.53808 | 60.79316 | 4352 | 769 | 0.177 | 0.72021 | 0.06927 |
| PA2041 | 1976 | 36 | 812 | −149.53496 | 60.79396 | 4525 | 729 | 0.161 | 0.85976 | 0.09464 |
| PA2042 | 1990 | 22 | 721 | −149.53806 | 60.79316 | 4634 | 792 | 0.171 | 0.81483 | 0.16144 |
| PA2043 | 1938 | 74 | 718 | −149.53812 | 60.79312 | 4418 | 750 | 0.170 | 0.57972 | 0.16152 |
| PA2045 | 1927 | 85 | 716 | −149.53809 | 60.79317 | 4026 | 665 | 0.165 | 0.58040 | 0.23133 |
| PA2049 | 1749 | 264 | 811 | −149.53552 | 60.79387 | 4665 | 667 | 0.143 | 0.34177 | 0.04176 |
| PA2050 | 1957 | 55 | 815 | −149.53539 | 60.79384 | 4640 | 763 | 0.164 | 0.73711 | 0.07449 |
| PA2052 | 1986 | 26 | 822 | −149.53512 | 60.79372 | 4665 | 686 | 0.147 | 1.14874 | 0.30389 |
| PA2053 | 1975 | 37 | 820 | −149.53517 | 60.79372 | 4660 | 659 | 0.141 | 1.12179 | 0.39463 |
| PA2055 | 1960 | 52 | 799 | −149.53567 | 60.79367 | 4447 | 684 | 0.154 | 0.29079 | 0.01399 |
| PA2064 | 1992 | 20 | 801 | −149.53593 | 60.79383 | 4651 | 634 | 0.136 | 0.53157 | 0.07496 |
| PA2071 | 1932 | 80 | 806 | −149.53605 | 60.79394 | 4656 | 668 | 0.143 | 0.44953 | 0.10267 |
| PA2072 | 1927 | 85 | 799 | −149.53603 | 60.79386 | 1380 | 246 | 0.178 | 0.66545 | 0.16827 |
| PA208 | 1957 | 55 | 859 | −149.53384 | 60.79419 | 4375 | 669 | 0.153 | 0.67936 | 0.23457 |
| PA2081 | 1868 | 145 | 798 | −149.53620 | 60.79379 | 4375 | 669 | 0.153 | 0.52432 | 0.29497 |
| PA2091 | 1937 | 75 | 785 | −149.53641 | 60.79363 | 4648 | 693 | 0.149 | 0.58472 | 0.13435 |
| IndHet | AvrTRW | VarTRW | Elev | |
|---|---|---|---|---|
| IndHet | 0 | |||
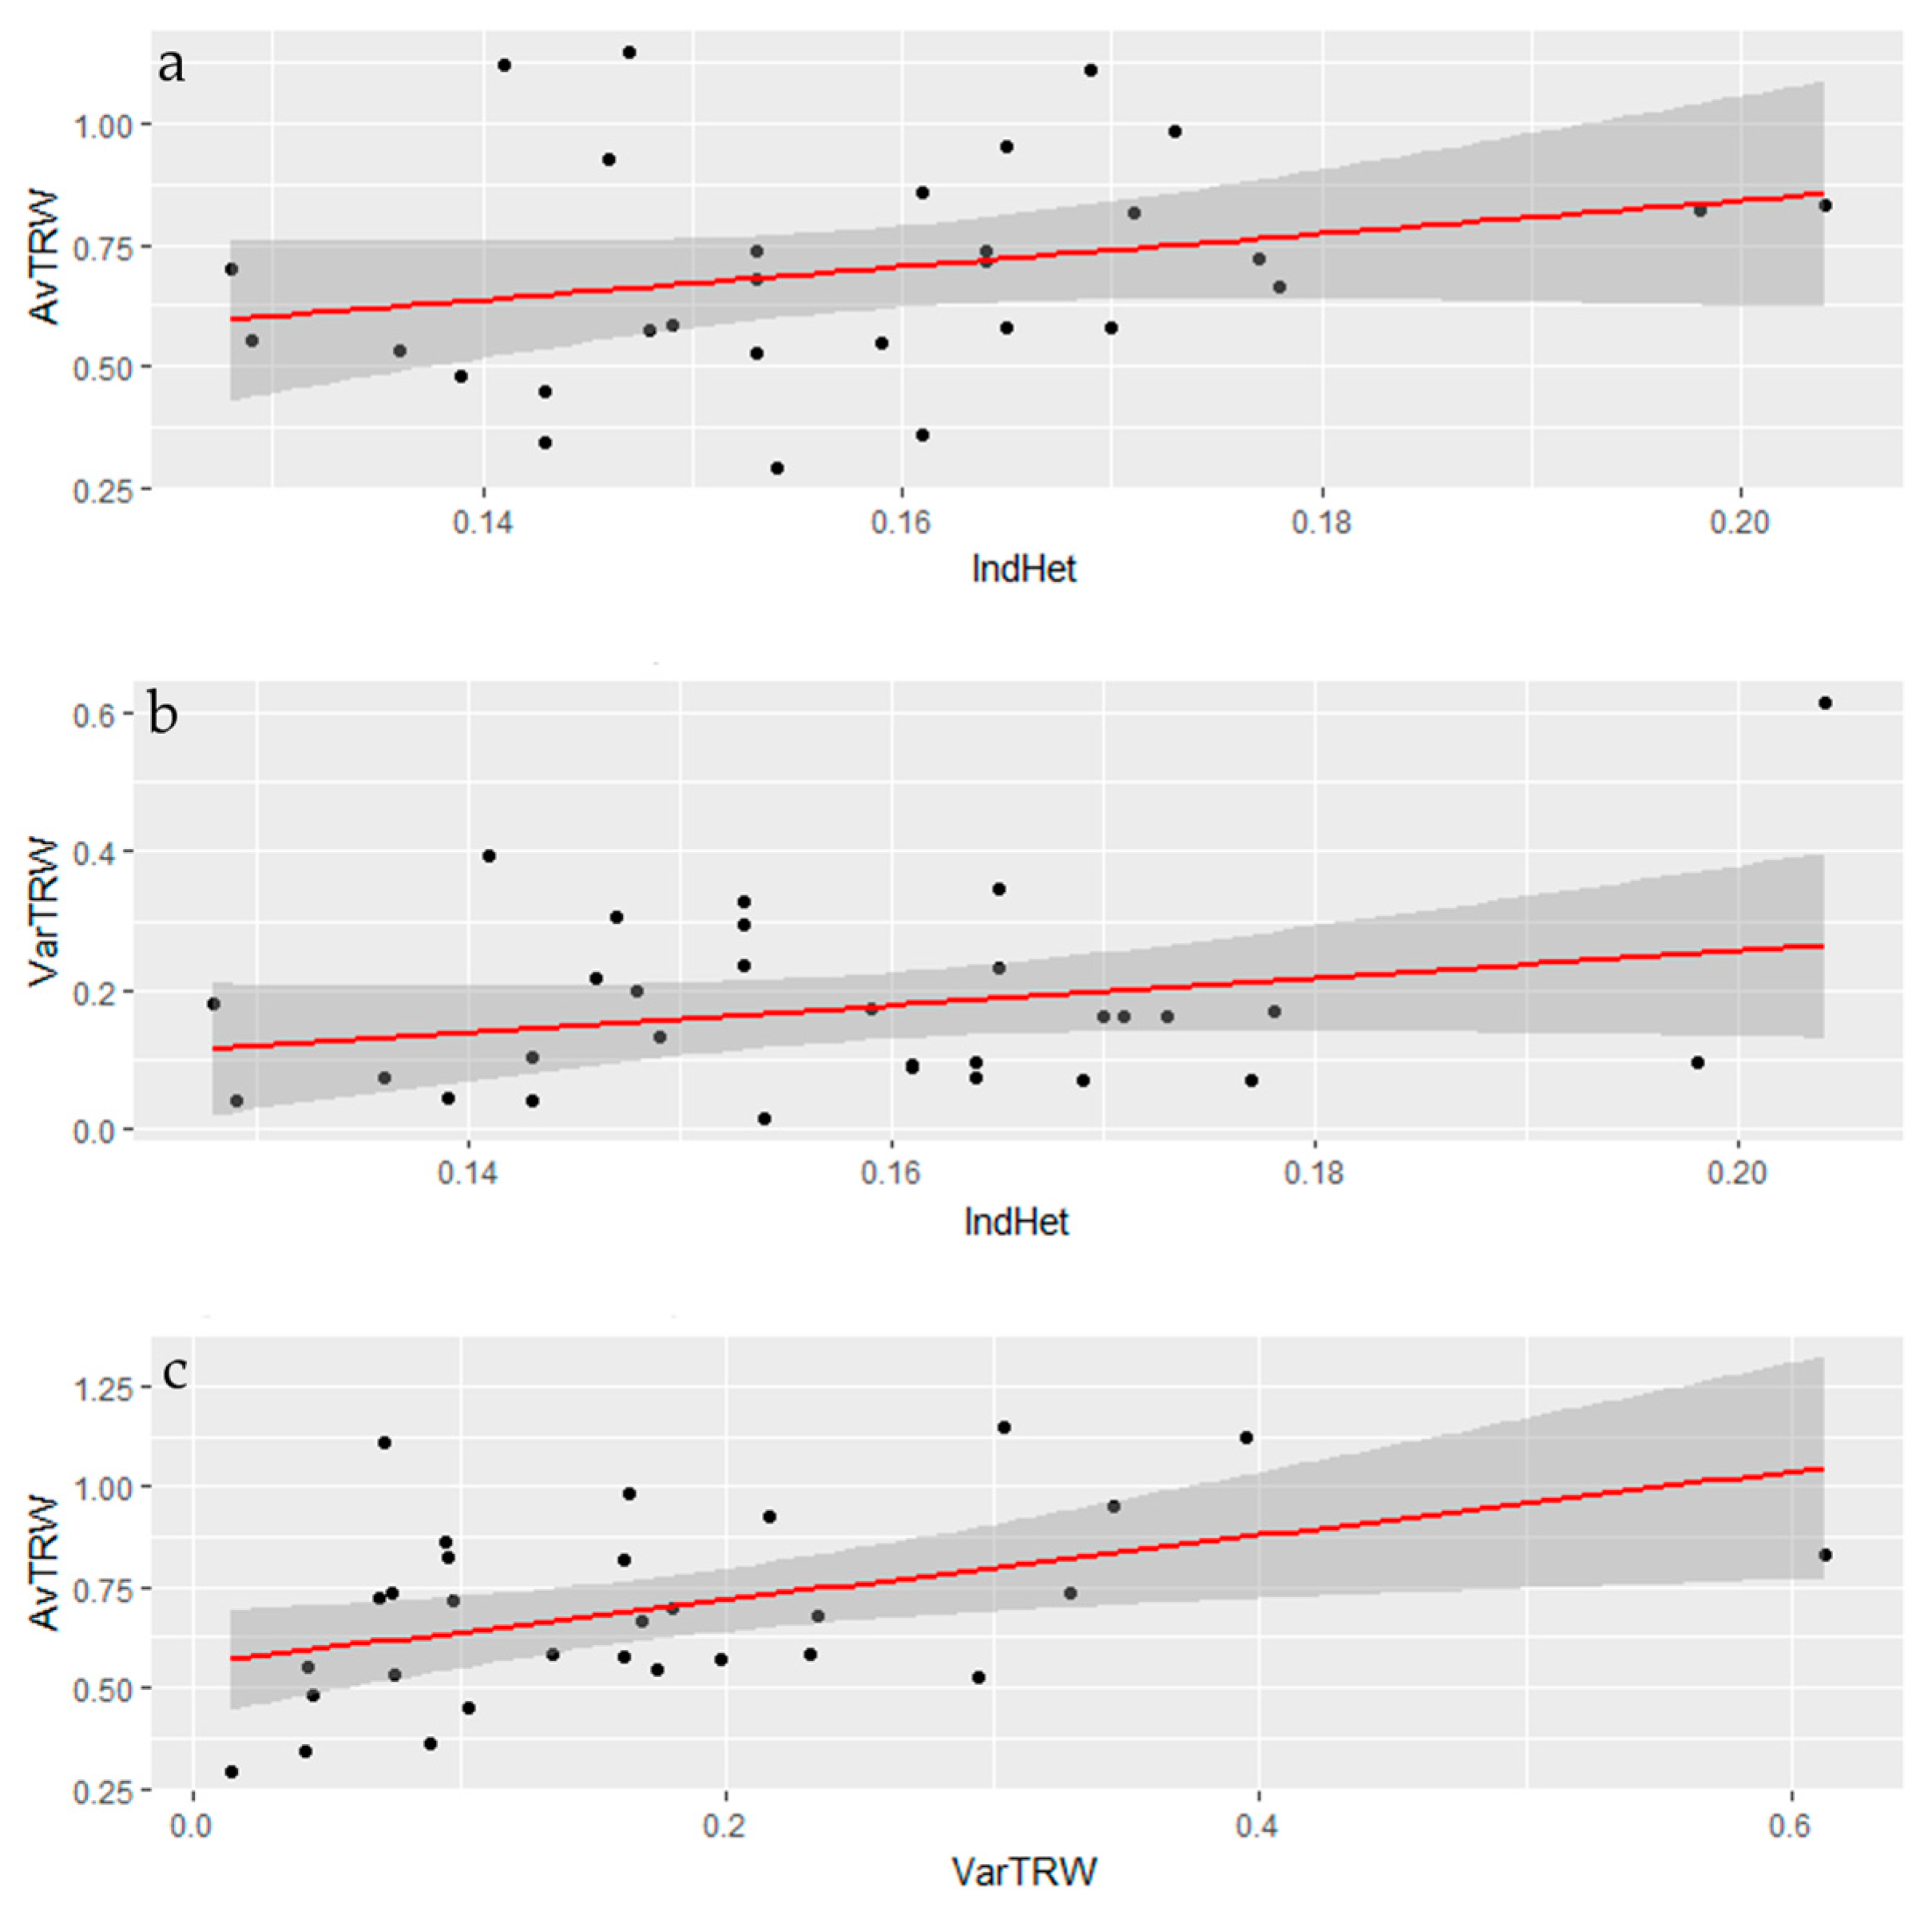
| AvrTRW | 0.2657 (0.1558) | 0 | ||
| VarTRW | 0.2704 (0.1454) | 0.4544 (0.0116) | 0 | |
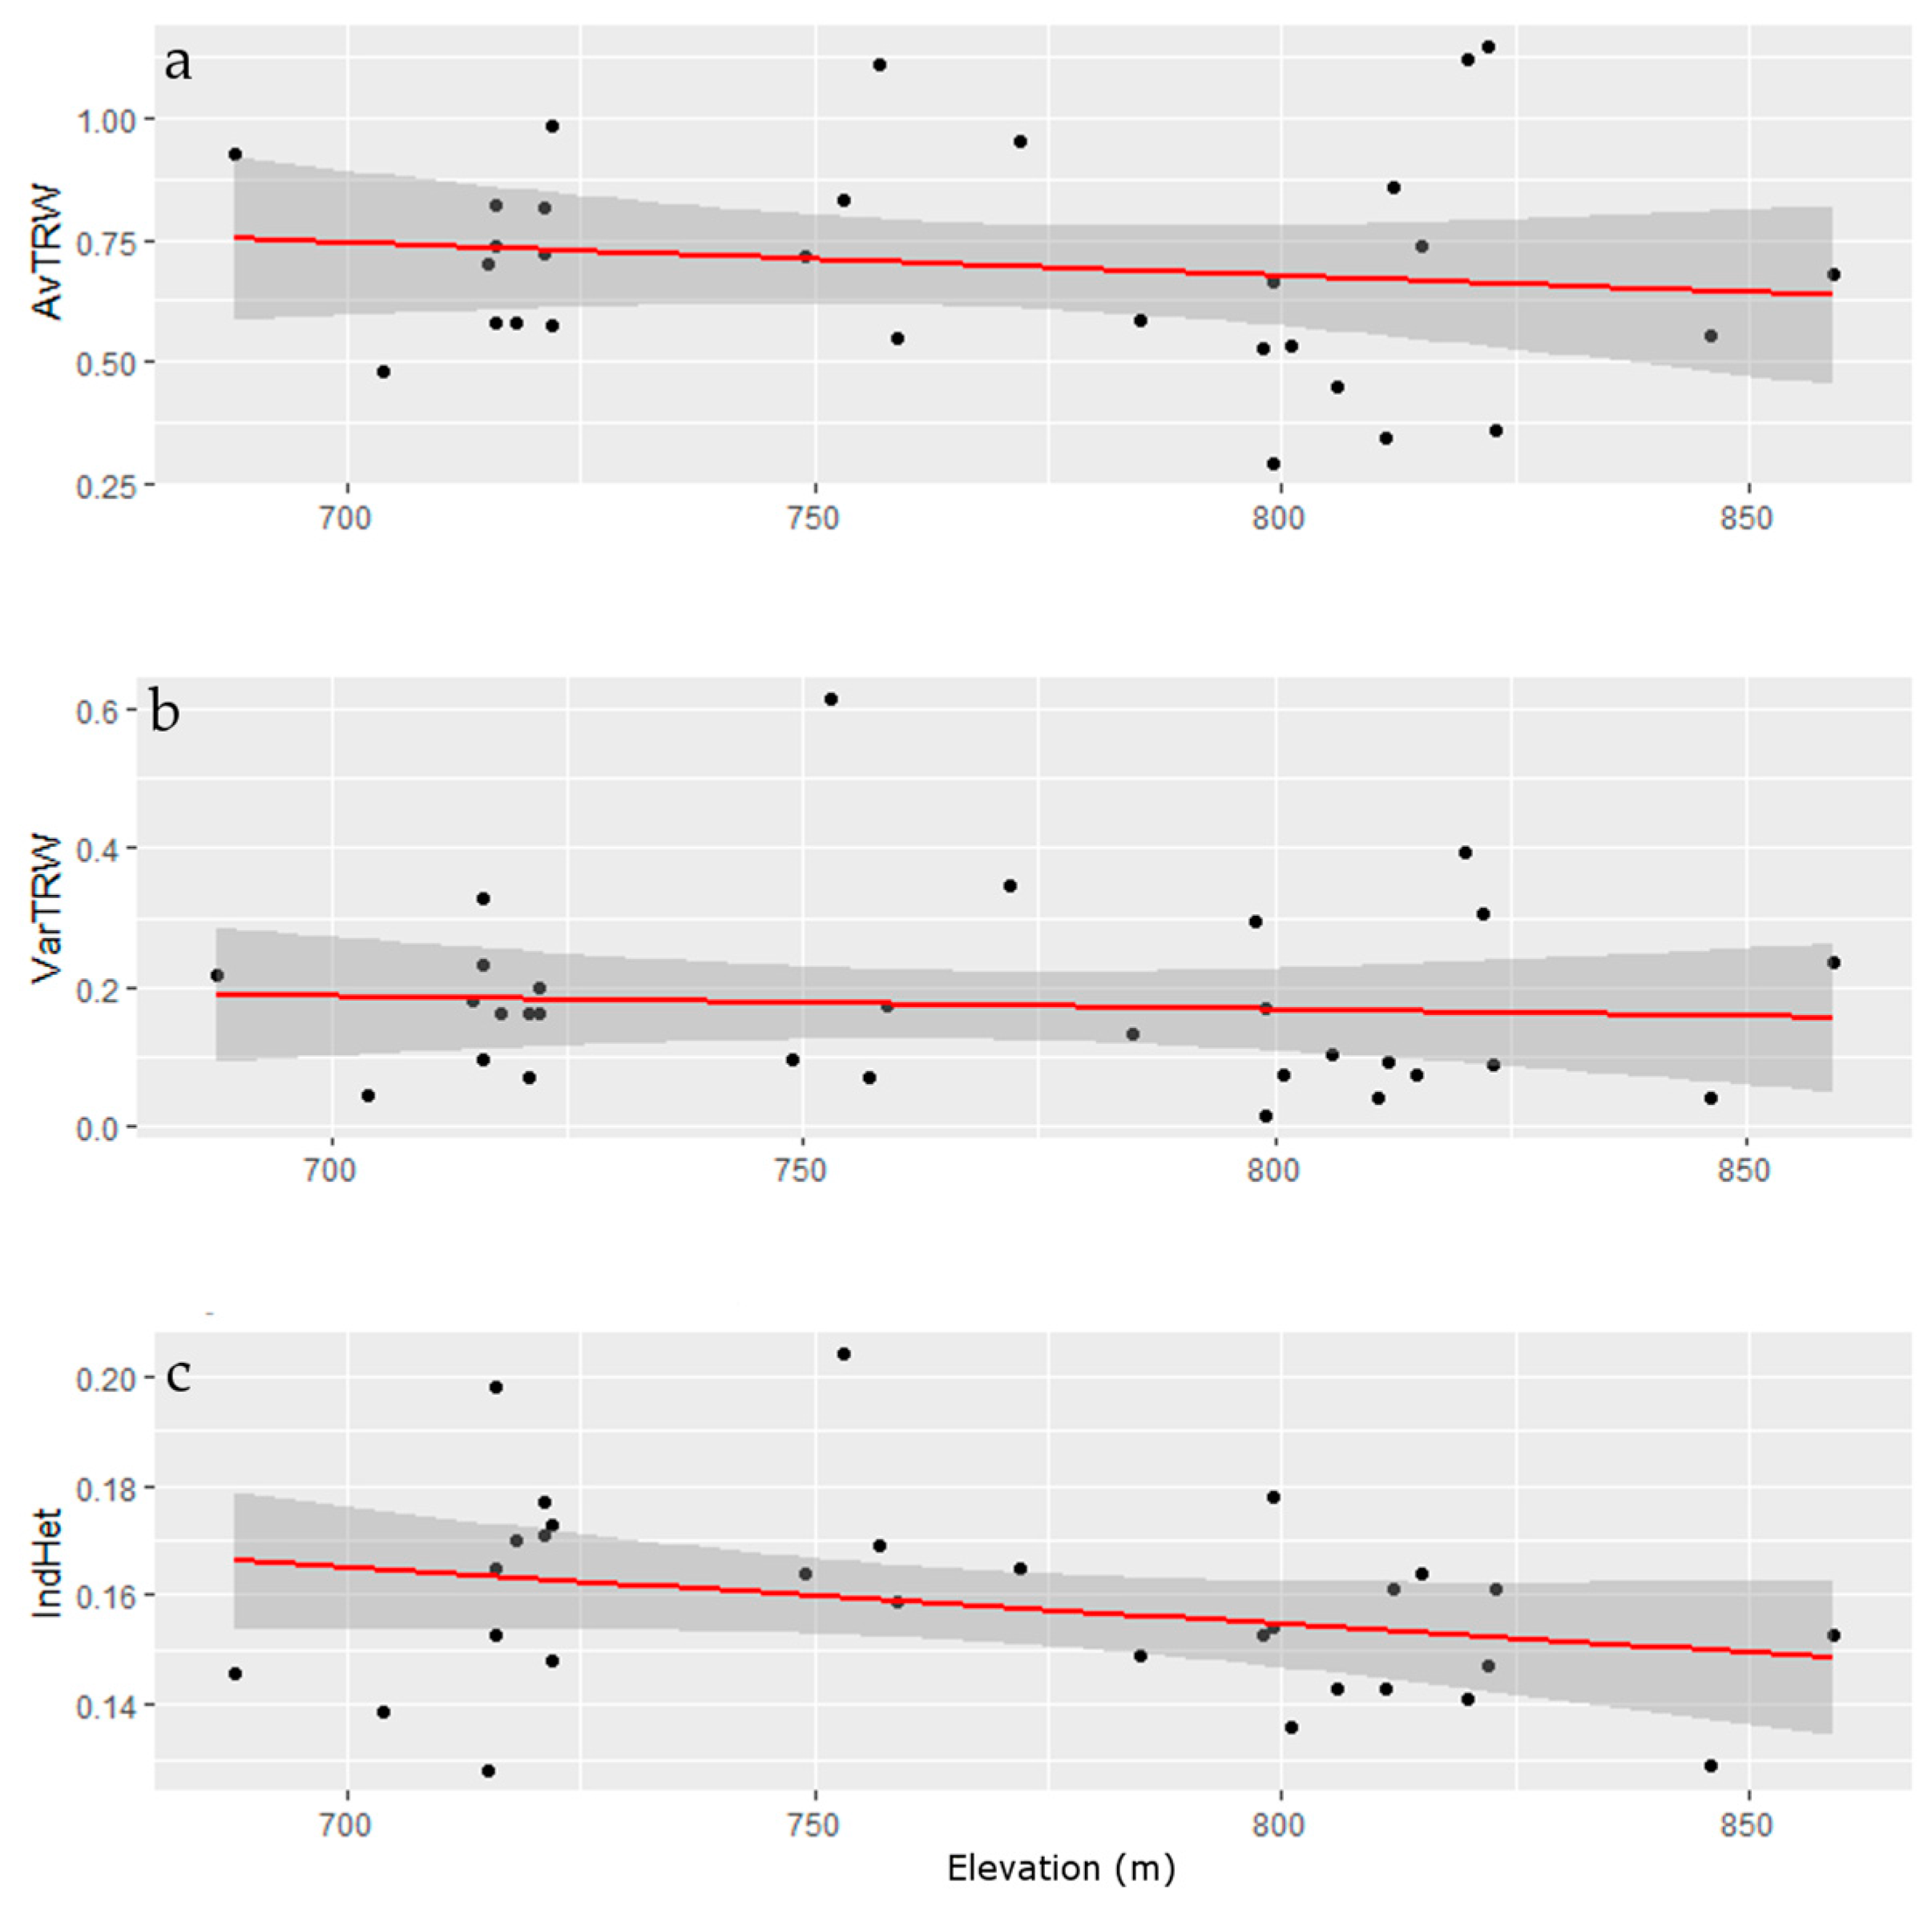
| Elev | −0.2619 (0.1869) | −0.1315 (0.5132) | −0.1034 (0.6077) | 0 |
| Variables | Values |
|---|---|
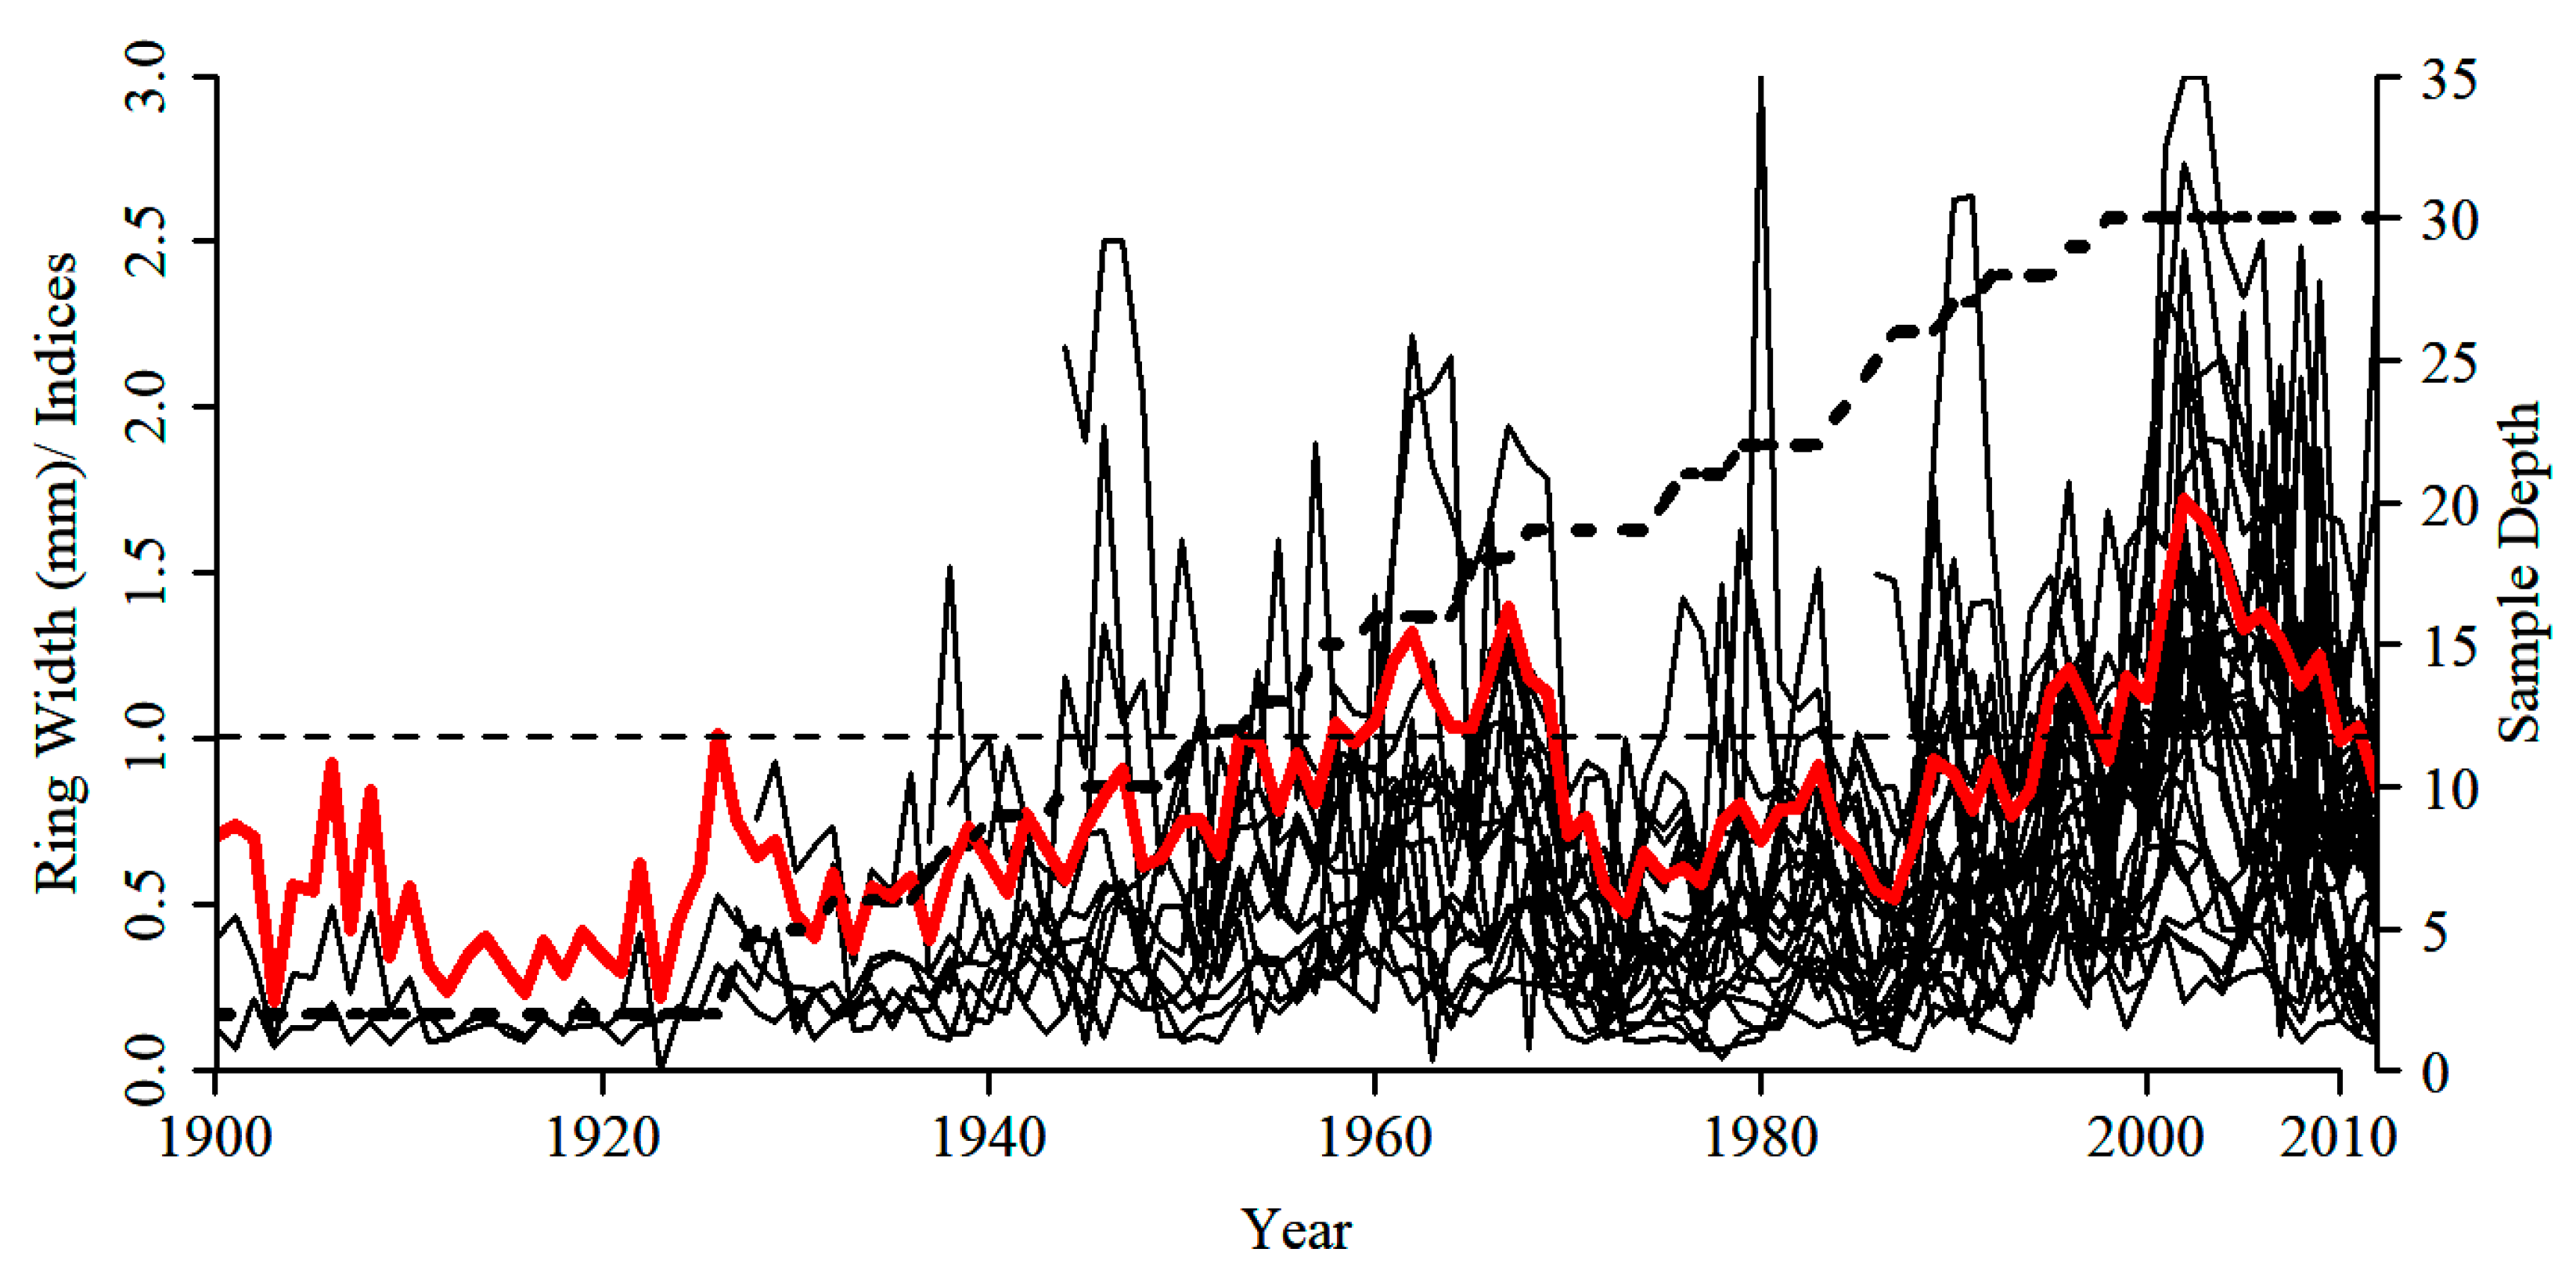
| CL | 112 (1900–2012) |
| n | 32 (32) |
| MRW (mm) | 0.68 |
| MS | 0.35 |
| SD | 0.39 |
| Rbar | 0.36 |
| AR1 | 0.62 |
| SNR | 4.12 |
| EPS | 0.86 |
© 2017 by the authors. Licensee MDPI, Basel, Switzerland. This article is an open access article distributed under the terms and conditions of the Creative Commons Attribution (CC BY) license (http://creativecommons.org/licenses/by/4.0/).
Share and Cite
Johnson, J.S.; Chhetri, P.K.; Krutovsky, K.V.; Cairns, D.M. Growth and Its Relationship to Individual Genetic Diversity of Mountain Hemlock (Tsuga mertensiana) at Alpine Treeline in Alaska: Combining Dendrochronology and Genomics. Forests 2017, 8, 418. https://doi.org/10.3390/f8110418
Johnson JS, Chhetri PK, Krutovsky KV, Cairns DM. Growth and Its Relationship to Individual Genetic Diversity of Mountain Hemlock (Tsuga mertensiana) at Alpine Treeline in Alaska: Combining Dendrochronology and Genomics. Forests. 2017; 8(11):418. https://doi.org/10.3390/f8110418
Chicago/Turabian StyleJohnson, Jeremy S., Parveen K. Chhetri, Konstantin V. Krutovsky, and David M. Cairns. 2017. "Growth and Its Relationship to Individual Genetic Diversity of Mountain Hemlock (Tsuga mertensiana) at Alpine Treeline in Alaska: Combining Dendrochronology and Genomics" Forests 8, no. 11: 418. https://doi.org/10.3390/f8110418