Differences in Human versus Lightning Fires between Urban and Rural Areas of the Boreal Forest in Interior Alaska


1
Soka University of America, 1 University Dr, Aliso Viejo, CA 92656, USA
2
U.S. Geological Survey, Alaska Cooperative Fish and Wildlife Research Unit, University of Alaska Fairbanks, Fairbanks, AK 99775, USA
*
Author to whom correspondence should be addressed.
Forests 2017, 8(11), 422; https://doi.org/10.3390/f8110422
Submission received: 4 September 2017
/
Revised: 17 October 2017
/
Accepted: 31 October 2017
/
Published: 4 November 2017
(This article belongs to the Special Issue Managing Wildfires in Changing Climates: History, Current Practice, and Challenges)
Abstract
:In western North America, the carbon-rich boreal forest is experiencing warmer temperatures, drier conditions and larger and more frequent wildfires. However, the fire regime is also affected by direct human activities through suppression, ignition, and land use changes. Models are important predictive tools for understanding future conditions but they are based on regional generalizations of wildfire behavior and weather that do not adequately account for the complexity of human–fire interactions. To achieve a better understanding of the intensity of human influence on fires in this sparsely populated area and to quantify differences between human and lightning fires, we analyzed fires by both ignition types in regard to human proximity in urban (the Fairbanks subregion) and rural areas of interior Alaska using spatial (Geographic Information Systems) and quantitative analysis methods. We found substantial differences in drivers of wildfire: while increases in fire ignitions and area burned were caused by lightning in rural interior Alaska, in the Fairbanks subregion these increases were due to human fires, especially in the wildland urban interface. Lightning fires are starting earlier and fires are burning longer, which is much more pronounced in the Fairbanks subregion than in rural areas. Human fires differed from lightning fires in several ways: they started closer to settlements and highways, burned for a shorter duration, were concentrated in the Fairbanks subregion, and often occurred outside the brief seasonal window for lightning fires. This study provides important insights that improve our understanding of the direct human influence on recently observed changes in wildfire regime with implications for both fire modeling and fire management.
1. Introduction
The circumpolar boreal region stores 24% of the global terrestrial carbon [1] yet is experiencing rapid environmental change [2]. One major disturbance is fire which has increased recently in frequency, extent, and severity [3,4,5,6,7] accompanied by potentially substantial losses of stored carbon [8,9,10]. Models predict continued increases in area burned and carbon emissions in boreal North America in the future [11,12,13,14] in response to a strengthening of arctic amplification of global climate change [15]. However, there are indications of an ecosystem shift from highly flammable mature spruce to less flammable early successional deciduous vegetation [16,17,18,19].
Wildfire burn area is closely associated with a moist enough climate to produce vegetative fuel and temporary high temperature and dry conditions [14,20,21]. It can be modulated by vegetation [22,23,24], land use [25], and suppression [26,27,28] after being ignited by either lightning strikes [29] or people [30,31,32]. These complex interactions between humans, environmental conditions, and fire are currently not well represented in regional models of vegetation, fire, or carbon emissions despite their influence on future climate–vegetation interactions [33] and indications that human activities can override biophysical fire drivers [20,34,35].
With low human population and lack of large-scale agricultural or pastoral potential, interior Alaska has been transitioning from a traditional subsistence lifestyle which included the use of fire to some extent [36,37] to sprawling developments and landscape fragmentation, especially at the Wildland–Urban-Interface (WUI) near Fairbanks, the region’s only large population center. This region is confined by the Brooks Range to the North, the coastal tundra to the West, and the Alaska Range to the South and is underlain by discontinuous permafrost (Figure 1). The mountain ranges block coastal air masses carrying moisture, resulting in a semi-arid climate where tree growth is only possible because of low evapotranspiration rates associated with low summer temperatures [38]. Over the past century, mean annual temperature rose 1.4 °C in Fairbanks while precipitation decreased; this warming was especially pronounced in winter, spring, and summer [39]. Since the 1970s [40], temperatures have been the warmest of the past 200 years [41]. Frequent large-scale fires have been a part of this region since the arrival of black spruce approximately 5500 years ago [42]. Lightning-ignited wildfires occur generally from mid-June, when convective thunderstorm activity is frequent, until either late summer when rain or snowfall showers arrive [43,44]; thus, a delay in summer rains leads to a larger area burned [21,45]. In areas where black spruce is dominant, its high flammability increases fire initiation [23] as well as fire frequency and total area burned [24].
Human influence on fire in boreal forests diminishes with distance from human settlements, roads, and to some extent railroads [26,27,30,31,46]. Calef et al. [31] determined that human ignitions exceed lightning ignitions within 15 km of settlements and within 20 km of highways in interior Alaska. Comparing fires in the boreal zone of North America between the 1960s/70s and the 1980s/90s, Kasischke and Turetsky [6] found that human-caused fires occurred earlier during the growing season (April–June) and were increasing in relative area burned. DeWilde and Chapin [26] showed that highly suppressed areas in interior Alaska in close proximity to roads and communities experienced 50 times more fire ignitions and began the fire season two months earlier, but because suppression is so effective, area burned was reduced by 50% compared to areas in the unsuppressed forest. However, due to the very low population density in interior Alaska, it is generally assumed that human-caused area burned is negligible in this vast region. To put this into context, Fairbanks North Star Borough, which includes Fairbanks and has a population density of 9 people km−2 (based on 2016 US Census data), is almost the same size as the state of New Jersey with a population density of 641 people km−2. Previous analyses have generally assumed a relatively homogeneous region to characterize the average fire regime of the region.
However, Fairbanks has a unique history in interior Alaska because the surrounding forest was extensively logged and burned by goldminers around 1900 and has now reached peak maturity and flammability [47]. It is also the most populated area in the region where most of the highways intersect and fire suppression has been intense. This has possibly led to fuel buildup [48]. When we analyzed five subregions in interior Alaska in a previous study [49], only the Fairbanks subregion showed a statistically significant increase in annual area burned but it was not clear how the fire regime in this particular subregion differed despite the importance of this information for effective fire management and risk reduction.
Therefore, this study focuses specifically on the differences between human- and lightning-caused fires in urban (the Fairbanks subregion) and rural interior Alaska. While some general differences between human and lightning fires are already known, we provide precise quantitative results on fundamental differences between human and lightning fires and the two subregions which can be used as model inputs. In particular, our study addresses three questions: (1) what are the differences in long-term trends in area burned and ignitions for human versus lightning fires in the two subregions? (2) How does human proximity influence wildfire in the two subregions? and (3) how do fire start date and fire duration differ for human and lightning fires?
2. Materials and Methods
We analyzed the differences between human and lightning fires in interior Alaska with particular emphasis on the differences between urban (the Fairbanks subregion) versus rural areas. Area burned and fire ignitions were evaluated in regard to human proximity, fire management, fire seasonality, fire duration, and changes through time using Geographic Information Systems (ArcGIS, Version 10.5, Environmental Systems Research Institute, Redlands, CA, USA) and quantitative data analysis methods.
2.1. Study Area
We defined interior Alaska as the area between the Brooks Range to the North and the Alaska Range to the South where the boreal ecoregion from the Omernik-Bailey ecosystem classification [50] overlaps with the area where large wildfires are common (Figure 1). The total extent of the resulting study area is 440,325 km2. We then added a subregional study area centered on Fairbanks defined as the area of a circle with a 100-km radius. We chose 100 km because it allowed a good representation of the area, seemed a reasonable distance to travel frequently for work or leisure and was mostly contained within the regional boundary (we removed the small part that was not).
2.2. Geospatial Datasets
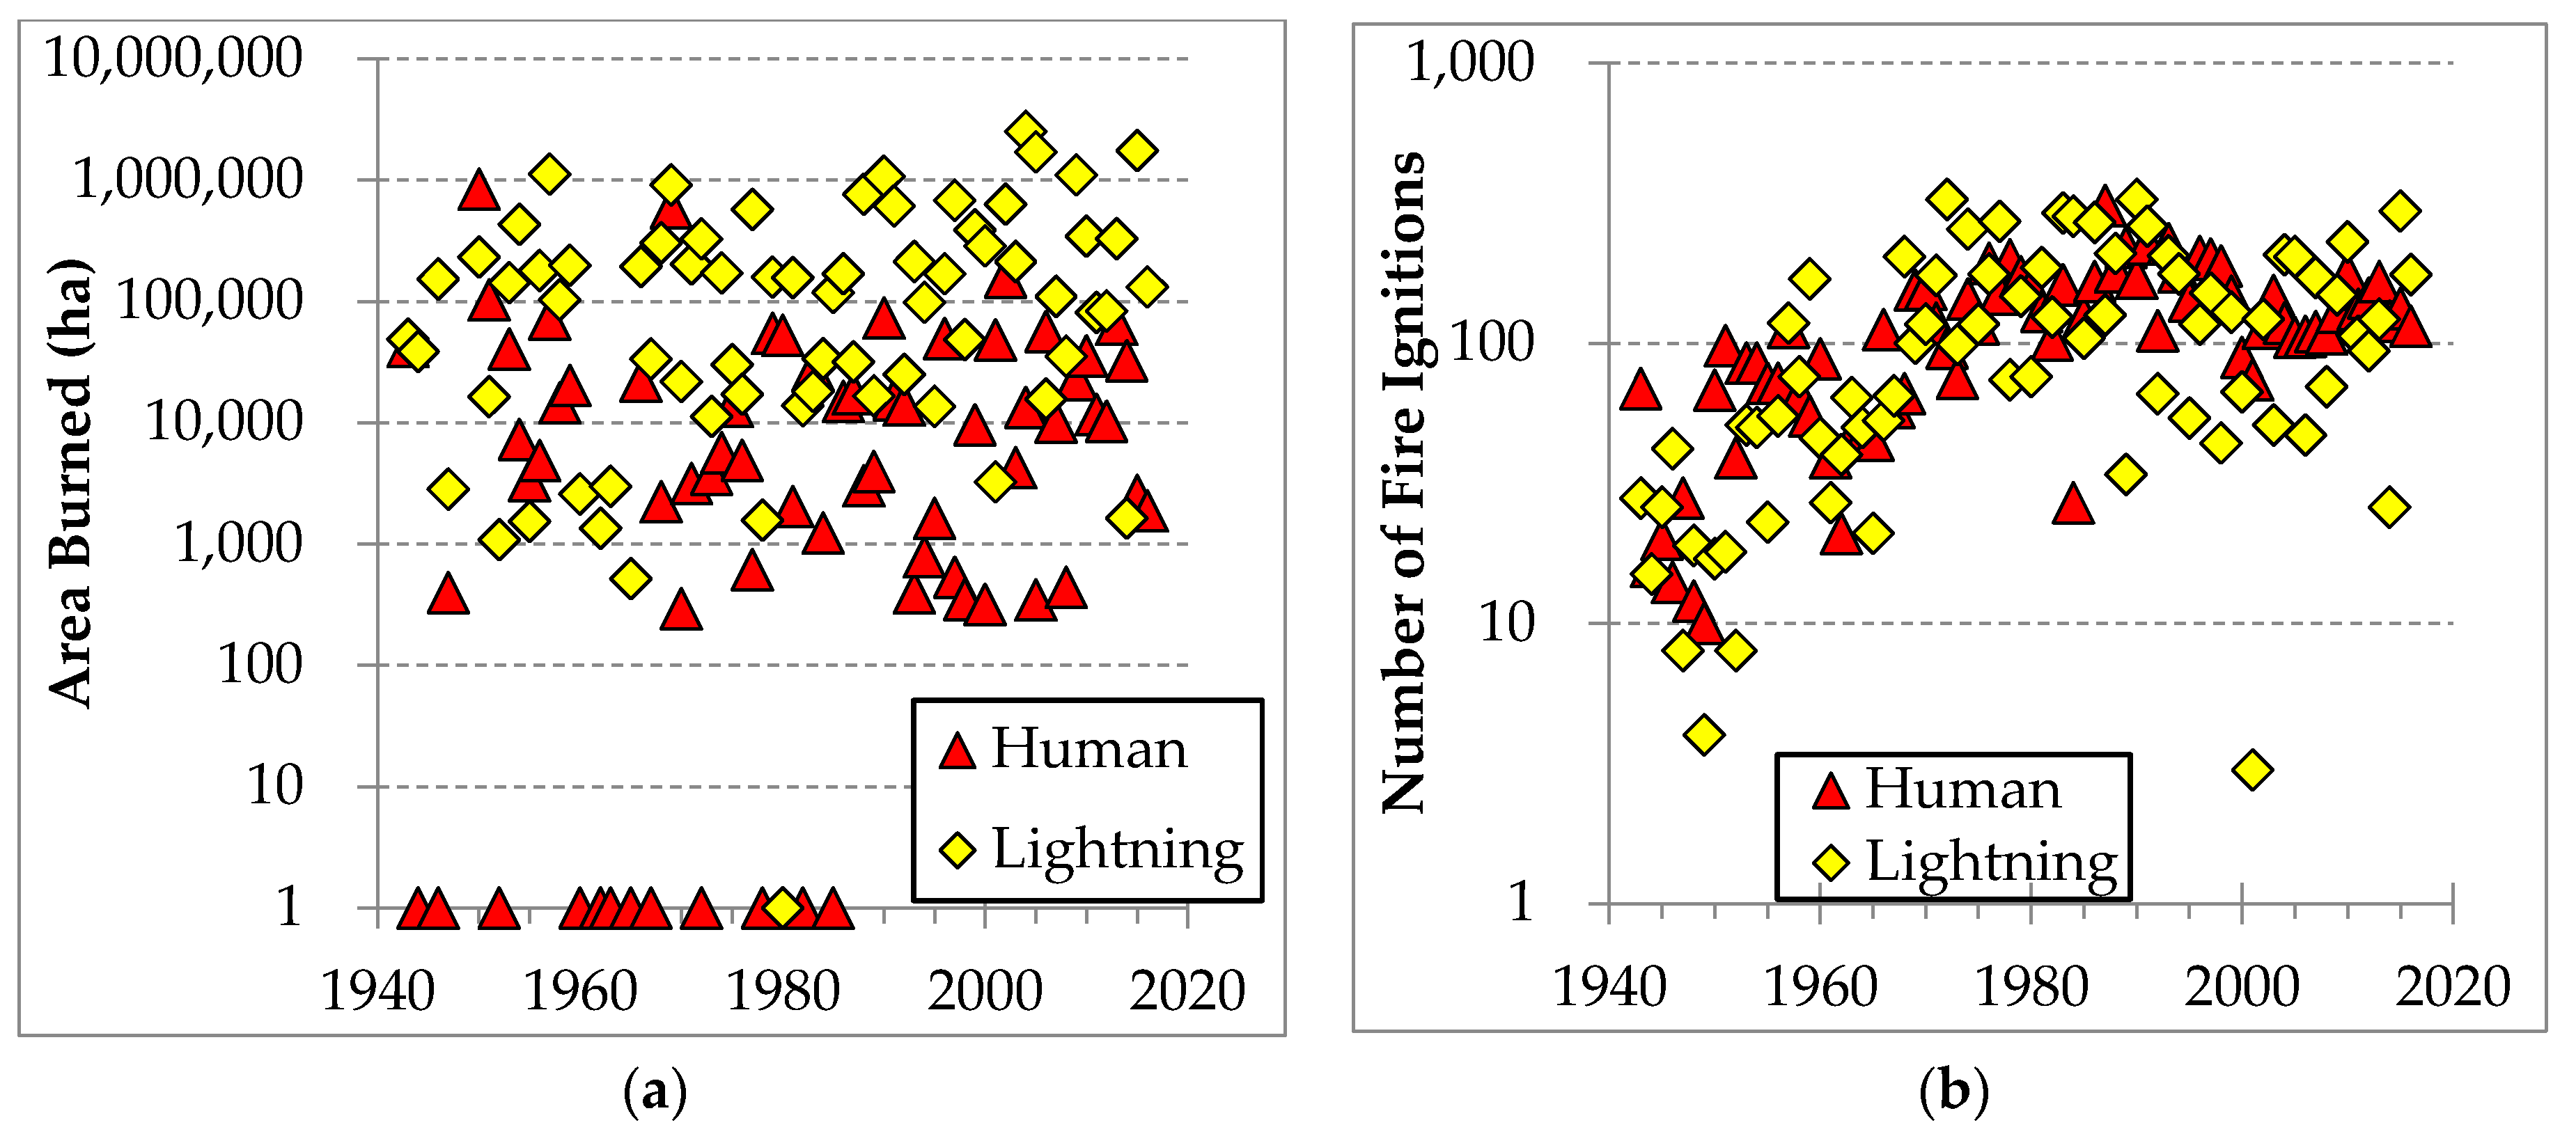
The Alaska Interagency Coordination Center (AICC) coordinates initial attack resources, logistics, and predictive services for all state and federal agencies involved in wildland fire management and suppression in Alaska. The agency also provides up-to-date information on fire ignitions and fire perimeters in GIS format [51]. While data on fire ignitions start in 1939 and include all fires >2.5 ha, data on fire perimeters by large fires (>405 ha) start in 1943. Unfortunately, spatial data prior to the 1980s are incomplete [52,53]. From 1988 onward, fire perimeters for fires >40.5 ha are included and each fire can consist of several disconnected fire patches or polygons. From 1988 to 2016, fires <40.5 ha accounted for <1% of area burned in interior Alaska and up to 3% of area burned by human fires in the Fairbanks subregion. Due to the large interannual variability in both ignitions and area burned (Figure 2) and the roughly 30-year Pacific Decadal Oscillation (PDO) cycle [54] which influences fire in Alaska [55], it is critical to include a long data record in statistical analyses. As a compromise between data quality and the need for data quantity, we used the long record only for general long-term trends while basing more detailed analyses on the high resolution record of 1988–2016.
The fire ignition and fire perimeter data include information on cause and area burned, but only the fire perimeter data includes an accurate location of the firescar (in Geographic Information Systems (GIS) format). Details on fire discovery date and end date for fire ignitions are available since 1990. We used the difference between end date and discovery date to calculate fire duration. However, the fire end date is not always the day the fire ceased because sometimes fire files are kept administratively ‘active’ in case they might flare up from smoldering in the organic horizons [53]. Thus, the fire duration we calculated needs to be viewed as an approximate value.
We excluded all fire perimeters and fire ignitions where a clear human or lightning cause could not be determined; we also removed fire ignitions for fires that resulted in zero area burned since we were interested in wildfires, not small point fires such as house fires or burning trash barrels. Because it is unrealistic to suppress all wildfires in Alaska, the state was divided into four categories during the 1980s which prioritize fire suppression efforts [56]. While these Fire Management Zones (FMZs; fire managers also refer to these as fire management options) are adjusted slightly each year, we used 2013 boundaries for consistency (Figure 1 top right panel). The zones in decreasing order of suppression are: (1) Critical (lands containing human lives and property receive top-priority fire protection, and all fires are immediately and aggressively suppressed); (2) Full (generally uninhabited lands that have high cultural, historical, or other resource value; usually also fully suppressed; most of the suburban and exurban sprawl into the Wildland–Urban-Interface (WUI) around Fairbanks falls in this zone); (3) Modified (a buffer zone where fires are suppressed during times of high fire danger but only monitored otherwise); and (4) Limited (essentially a natural fire regime).
Ancillary data include all named settlements in interior Alaska. These range from a population of zero because of abandonment to Fairbanks with a current population of over 32,000. The named settlements are mostly villages but also include some places of (often historic) significance which might have very low to no permanent residents that serve as important recreation or subsistence destinations. We therefore decided to include all of them.
Roads play an important role as fire breaks but also serve as human access points. While new local roads were built (especially in the greater Fairbanks sub-region) over the last several decades as population increased and sprawled, no new highways have been constructed in interior Alaska since the 1970s. Since it is not possible to obtain accurate information on new road construction for each year, we decided to limit our analysis to highways with the understanding that they connect with local roads and trails.
2.3. Geospatial and Quantitative Analysis
2.3.1. Differences in Temporal Trends between Urban and Rural Interior Alaska
To gain a better understanding of general long-term trends in annual area burned and annual number of ignitions by cause, we developed log-linear regression models covering 1943–2016 (full record) and 1988–2016 (high-resolution record) for both the Fairbanks subregion and rural interior Alaska. Data were log-transformed to address heteroscedasticity.
Because there are years without recorded areas burned by human or lightning causes in the fire perimeter database, we used a two-step approach to the area burned models: we first determined the probability of a fire occurring in any given year in that subregion using the logistic model for odds ratio (p/(1 − p)), before developing regression models using only years with recorded areas burned. Additionally, we created a second version of the 1988–2016 regression models which included years with zero area burned based on the assumption that the recent record is complete and years without recorded areas burned were too wet to support fires >40.5 ha. In order to include these years in the regression, we replaced all zeros with 1.1 ha so that log10(area burned) > 0.
Since ignitions of fires >2.5 ha were much more frequent, we did not develop odds ratio models but included all data points (including zeros). Instead, we developed a regression model of ignition trends by fire management zone.
2.3.2. Differences in the Influences of Human Proximity between Urban and Rural Interior Alaska
We used ArcGIS to derive nearest neighbor distances between all fire ignition points and the nearest named settlement and highway within 50 km using the most detailed data from 1990 to 2016. We used the nonparametric Kruskal–Wallis test to determine whether the median distance for fire ignition from highways or settlements is significantly different for human- versus lightning-caused fires. This was followed by a nonparametric Siegel–Tukey [57] test with adjusted medians to verify whether the difference in dispersion between these data is statistically significant.
For a more detailed analysis of the gradient of human impacts with distance from settlements, we created buffers at 5 km intervals up to 30 km around all settlements that were then intersected with the fire ignitions and fire perimeter data. We could then calculate ignition density and percent area burned for each ring.
2.3.3. Differences in Fire Seasonality and Duration
Discovery dates were converted into approximate Julian dates. Then, the Kruskal–Wallis test was applied to ascertain whether the median discovery date for fire ignitions is significantly different for human- versus lightning-caused fires from 1990 to 2016. This was followed by a Siegel–Tukey test with adjusted medians to establish whether the difference in dispersion between these data is statistically significant. The same tests were applied to fire duration; though this analysis was limited to fires that were not extinguished the same day they started and were not prescribed. Simple linear regression analysis was used to analyze temporal trends for average discovery dates. To analyze temporal trends in fire duration, we used generalized regression models (GLM) with Poisson family, with natural logarithm as the link function.
3. Results
3.1. Differences in Temporal Trends between Urban and Rural Interior Alaska
While large lightning fires were recorded for almost every year in rural interior Alaska, this was not the case in the Fairbanks subregion nor for human fires (Table 1). However, the odds of a fire being recorded in the fire perimeter dataset (odds ratio >1) increased from one year to the next for all fires from 1943 to 2016 in the Fairbanks subregion, human fires since 1988 in the Fairbanks subregion, and human fires since 1943 in rural interior Alaska. Increases in area burned were statistically significant in rural interior Alaska (e.g., 2.6% year−1 increase for both ignition causes driven by a 2.9% year−1 increase in lightning ignitions since 1943; p < 0.05 for both), while the Fairbanks subregion showed no statistically significant trend. However, when we include years without recorded large fires, we see an increase of 16.1% (p < 0.05) in human-caused area burned in the Fairbanks subregion.
Meanwhile, all ignitions have increased slightly more steeply in the Fairbanks subregion than in rural interior Alaska since 1943 (e.g., 2.5% year−1 versus 2.1% year−1 for combined ignitions, respectively; p < 0.001 for both; Table 2) but human ignitions have been decreasing steeply in the Fairbanks subregion since 1988 (e.g., 2.6% year−1, p < 0.001). This decrease in human ignitions was driven by changes in the highly suppressed Full fire management zones, which accounts for 37% of the subregion.
3.2. Differences in the Influences of Human Proximity between Urban and Rural Interior Alaska
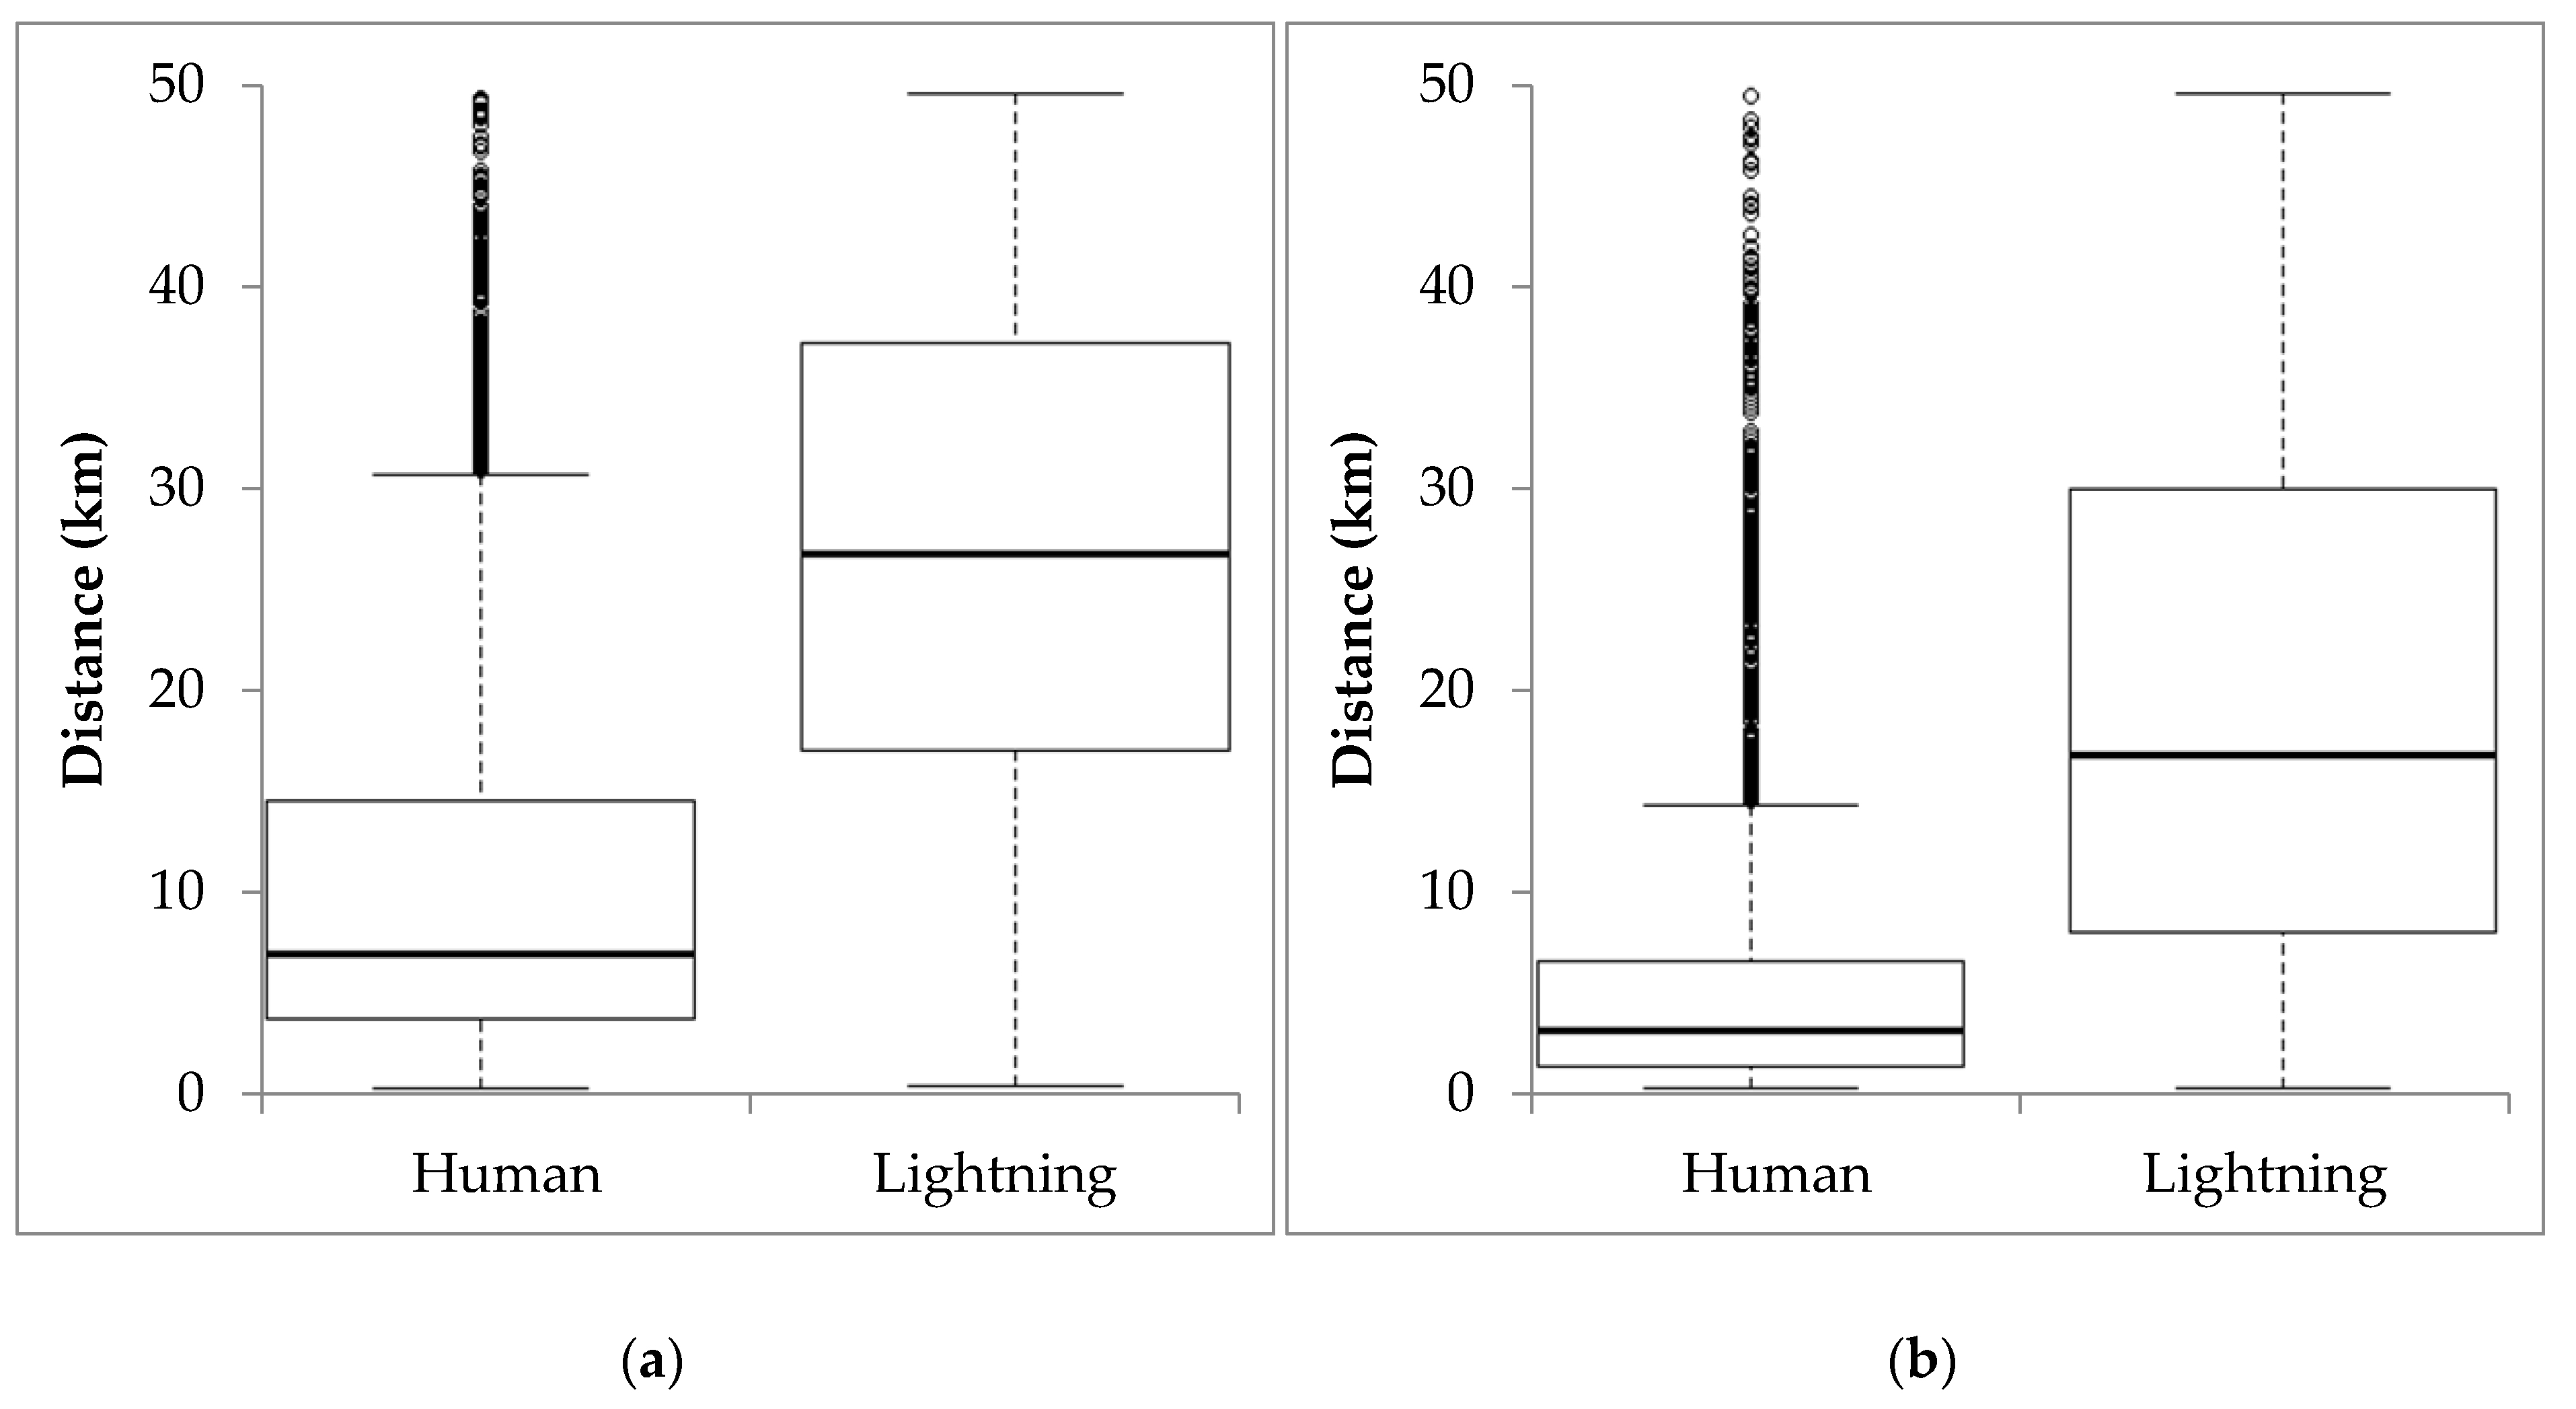
Between 1990 and 2016, interior Alaska experienced 8203 wildfire ignitions of which 52% were caused by people and accounted for 5% of area burned. Human fires occurred much closer to settlements (median distance of 6830 m versus 26,973 m, respectively) and highways (2828 m versus 5335 m for lightning fires, respectively) than lightning fires (Figure 3) and the differences as well as the dispersions were all statistically significant (p < 0.001 for all four tests). The large Inter Quartile Ranges (IQR) of lightning fires compared to human fires show that they can be found at a much larger range of distances while human-caused fires are more confined to human proximity. While human ignitions were responsible for 23.9% of area burned in the Fairbanks subregion, they accounted for only 3.2% in rural interior Alaska.
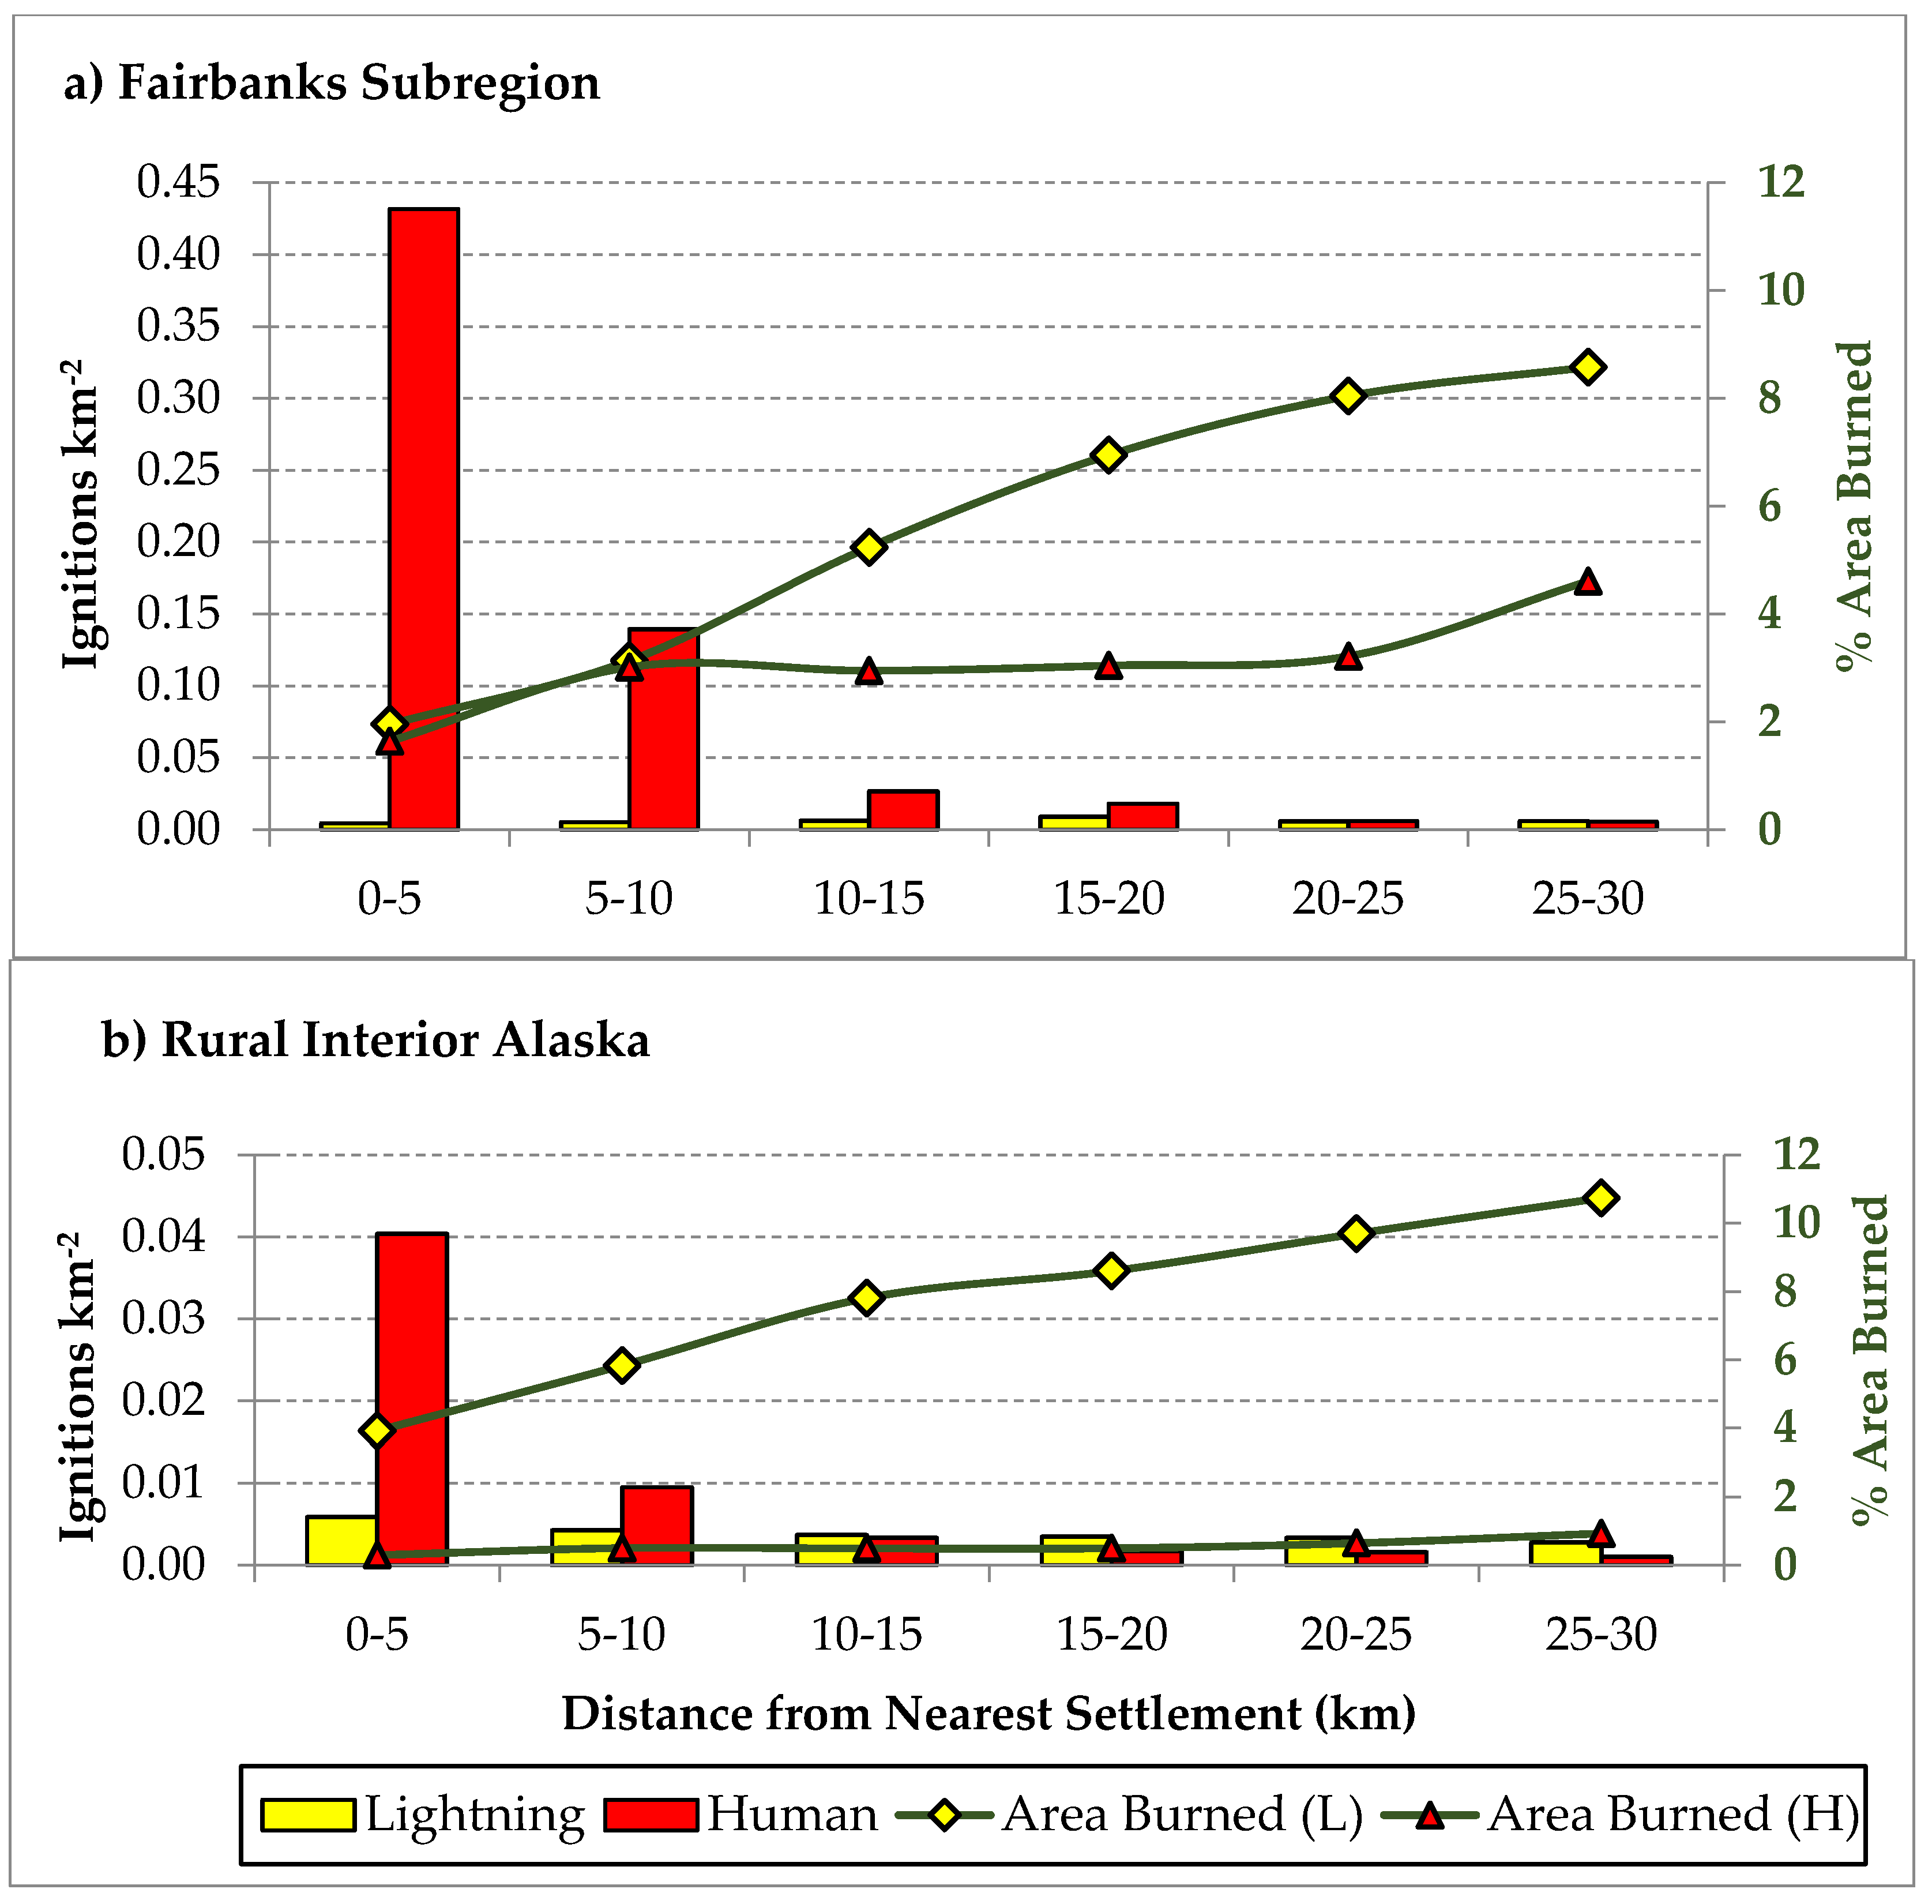
Human ignitions far exceed lightning ignitions within close proximity to settlements. In the Fairbanks subregion, human ignitions were twelve times denser close to settlements (0–5 km distance) than in rural interior Alaska (0.49 ignitions km−2 versus 0.04 ignitions km−2, Figure 4) and accounted for 99.2% versus 87.0% of ignitions, respectively, at that close proximity. The Fairbanks subregion was unique with respect to area burned by human and lighting causes because they were equivalent up to a 10 km distance, at which point area burned by lightning started to rise more rapidly though area burned by humans continued at a high rate (4.6%). In contrast, in rural interior Alaska, area burned by people remained <1% along the entire gradient from settlements to 30 km distance while area burned by lightning increased from 3.9% (within 5 km) to 10.7% (at 25–30 km).
3.3. Differences in Fire Seasonality and Duratio
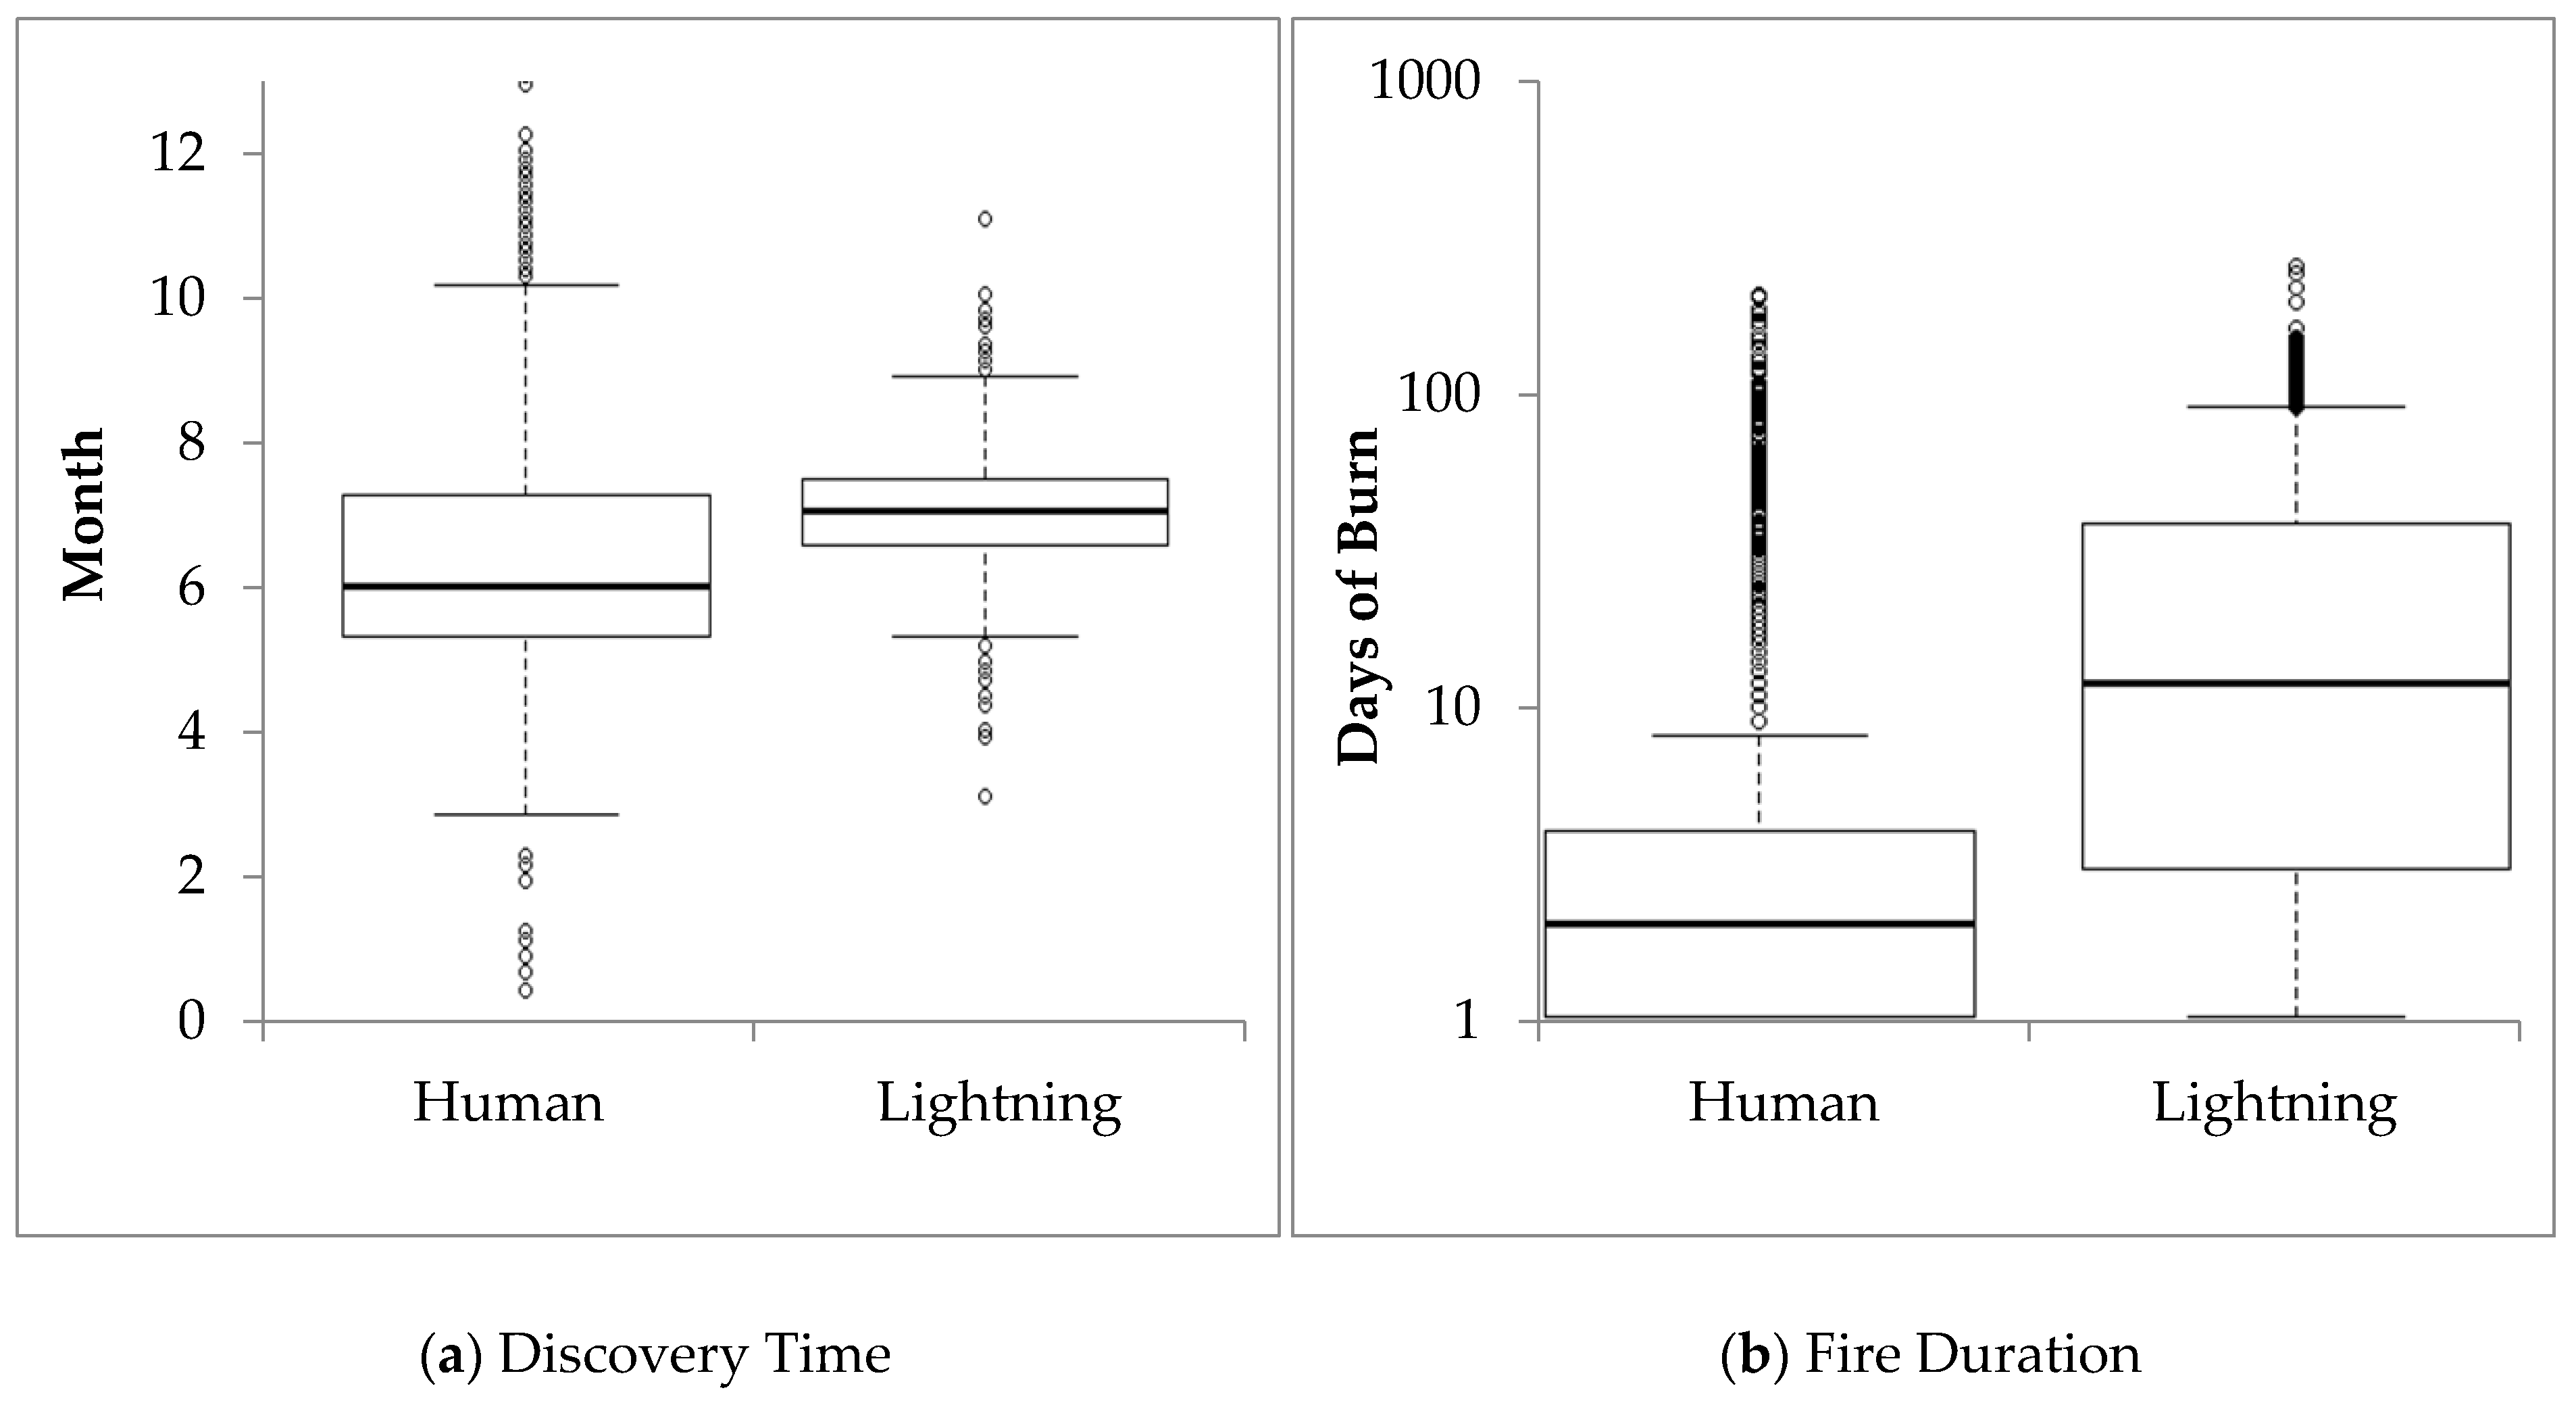
In comparison to lightning fires, human-ignited fires start during a wider seasonal window that starts earlier in the summer and they burn more briefly. The median discovery date for human fires was in early June though they could start at a wide range of dates (median day = 149, IQR = 51) while the median discovery date for lightning fires is in late June (median day = 177, IQR = 24) (Figure 5a). Both the difference in mean start dates and their dispersion were statistically significant (p < 0.001). While there is no statistically significant change in average discovery dates for human-caused fires, the average start date for lightning ignitions has been moving closer to spring at a rate of 0.2 days year−1 (t = −4.68, p < 0.001). In the Fairbanks subregion, the average discovery date has been moving to an earlier date at the rate of 0.5 days year−1 (t = −5.59, p < 0.001), almost five times faster than for rural interior Alaska (b = −0.11, t = −1.94, p < 0.01).
Median fire duration was 2 days (IQR = 3 days) versus 12 days (IQR = 36 days) for human- versus lightning-caused fires, respectively, with significant differences both in medians and dispersion (p < 0.001) (Figure 5b). Fire duration has been increasing on average by 3.4% year−1 in the period of 1990–2016 (Table 3). However, this increase is twice as steep for the Fairbanks subregion (5.7% year−1) than for the rural interior Alaska (2.4% per year) due to longer burning human fires (6.0% year−1).
4. Discussion
In rural interior Alaska, wildfire frequency, extent, and duration seem to be increasing in response to climate change based on the longest available wildfire record going back to 1943. Unfortunately, the more reliable record since 1988 is too short to show clear statistical trends for most parameters we evaluated. In the Fairbanks subregion, on the other hand, area burned is not only a function of weather and fuel, but is more directly manipulated by human activity via ignitions, fuels management, land use change, and fire suppression. As humans have increased in number in the area so too has their influence, which combined with increased susceptibility to fire either due to stand age, fuel accumulation, or climate is turning into a hazardous combination of increased fire ignitions, area burned, and fire duration. Since people set and suppress fires primarily within their vicinity, there are clear differences between human- and lightning-caused fires in regards to proximity and duration.
This section is organized around the three main questions of this study: (1) what are the differences in long-term trends in area burned and ignitions for human versus lightning fires in the two subregions? (2) How does human proximity influence wildfire in the two subregions? and (3) how do fire start date and fire duration differ for human and lightning fires?
4.1. Differences in Temporal Trends between Urban and Rural Interior Alaska
Several studies have reported increases in area burned in Alaska [5,6,49] which is expected to continue to increase into the future [11] due to climate warming [58] and acceleration of Arctic amplification [15]. Using our more conservative approach of only including years with recorded large fires, we found a 2.9% year−1 increase in area burned by lightning and an increased probability for human fires in rural interior Alaska since 1943. This is similar to the 2.4% year−1 increase in annual area burned reported for 1943–2012 using all years [49]. However, other possible explanations for this observed increase in area burned are the sparsity of the earlier record, the switch of the PDO from cool and moist to warm and dry around 1976, or human impacts on fuels (history of logging and suppression) and ignitions. Kasischke et al. [5] point to increases in extreme fire events (>50,000 ha) and a quadrupling of area burned during late-season fires during the 2000s as explanations for a rise in the decadal average area burned in the 1990s and 2000s. Calef et al. [49] tested the influence of (incomplete records of) earlier decades, the fire management system, and the PDO phases on increasing trends in annual area burned and found that only the positive PDO phase from 1976 to 2006 and location in the intensely suppressed Critical or Full FMZs were significant predictors.
The results of this study show that trends in the Fairbanks subregion differ from regional observations: the odds of any fire occurring have been increasing since 1943 and area burned by human fires has increased since 1988 by 16.1% year−1 (when we include all years in the analysis). This rate is much lower than the 19.0% yearly increase reported from 1988 to 2012 in the same subregion [49] but 2014 and 2016 were very low fire years. This increase in human ignitions can be explained by an actual increase in human fire frequency (as population increased), misclassification of early human fires, or missing early records although it is a reasonable assumption that fire detection and record keeping have been fairly accurate since 1988 in the subregion.
Fire ignitions have increased since 1943 across both subregions and for both causes which might be due to better detection rates to some extent; however, ignition rates have decreased in the Fairbanks subregion since 1988 which has been driven by a decrease in human ignitions by 2.6% year−1. This is especially pronounced in the intensely suppressed Full fire management zone, which constitutes 37% of the subregion, experiences 82% of all human fires in this subregion, and is home to sprawling exurban developments in the WUI. Veraverbeke [29] reported a 4.82% year−1 increase in lightning ignitions since 1975 which is higher than the 2.3% year−1 increase in lightning ignitions we calculated in rural interior Alaska since 1943. Kasischke et al. [5] attributed decreasing decadal lightning ignitions since a peak in the 1970s to the following causes: lack of detection of new fires because either fire services were focused on existing fires or smoke from big fires obscured new small fires; another explanation is that in remote areas, several small fires can merge resulting in a reduction in total fire counts despite increased area burned. The recent decrease in human ignitions which turn into wildfires might be due to increased fragmentation of the landscape, firewise landscaping with removal of flammable vegetation, successful initial attack on fires, or people being more careful about setting unintentional fires.
To summarize, increases in area burned since 1943 are probably due to long-term climate trends (both the PDO and global climate change) while recent increases in area burned in the Fairbanks subregion are due to increased human fires which is also reflected in the increased probability of human fires. Fire ignitions were increasing regardless of location and cause, but recently have been decreasing in the Fairbanks subregion, especially in the WUI.
4.2. Differences in the Influences of Human Proximity between Urban and Rural Interior Alaska
The majority of human-caused fires stay small because they occur in high suppression zones and start outside the fire season and in less flammable vegetation [26]. Hence, while 52% of all fires in interior Alaska from 1990 to 2016 were caused by people, they accounted for only 5% of area burned. This is identical to the 5% reported between 1992 and 2001 when they accounted for 62% of all fires [26]. This ratio is probably higher than ours because we only included fire ignition points which had an area burned associated with them.
Human influence diminishes with distance from human settlements, roads, and railroads [26,27,30,31] and kernel density estimations have been used to identify hotspots of human activity [32,46,59]. We found that lightning fires generally started at four times the distance of human fires from settlements (approximately 27 km versus 7 km, respectively) and twice the distance of human fires from highways (5 km versus 3 km). However, while the majority of lightning fires started anywhere within a 50 km distance from settlements and highways, human fire ignitions were unusual beyond approximately 30 km from settlements and 12 km from highways. The exact extent of this human influence seems to vary with location. In the Chinese boreal forest, human fire occurrence was especially dense within less than 13 km from settlements and less than 34 km from roads [32]. In Central Siberia, most wildfires occurred within 100 km from human settlements and 130 km from roads [30].
When we recognize the human footprint as a ‘continuum of human influence stretched across the land surface’ [60] (p. 892), we find that, on average, people accounted for 94% of all fire ignitions within 5 km of settlements, 50% of ignitions at 15–20 km distance, and 40% of ignitions at 25–30 km distance (which accounts for one-third of interior Alaska). However, this human footprint was much more pronounced in the Fairbanks subregion where the ratio of human to lightning ignitions was 122:1 within 5 km of settlement centers (which is 12 times denser than in rural interior Alaska) and exceeded lightning ignitions up to 25 km distance (compared to 10 km in rural interior Alaska). These additional human-caused ignitions resulted in a larger contribution to area burned: people were responsible for 23.9% of area burned in the Fairbanks subregion versus only 3.2% in rural interior Alaska.
While Calef et al. [31] reported that area burned was 2% within 5 km of settlements from 1988 to 2005 (or 1.1% decade−1) within a background rate of 8–10% (9% = 5.0% decade−1) at 25–30 km distance, our analysis for 1988–2016 revealed rates of 4.2% decade−1 in rural interior Alaska (consisting of 0.3% area burned by people and 3.9% area burned by lightning) to 11.7% decade−1, respectively. In the Fairbanks subregion, area burned was 3.6% within 5 km of downtown with equal contributions by human and lightning causes and 13.2% at 25–30 km distance. This higher area burned at all distances is either due to minor differences in methodology or is another indication of increasing area burned in interior Alaska while land use change [25] and the success of fire suppression [26,27,49] explain reduced areas burned near settlements. The contribution of human fires to total area burned varied from 11.4% within 5 km of settlements to 11.3% at 25–30 km distance or a low of 8.4% (at 15–20 km) to a slight peak at 13.3% (at 5–10 km). These values are much higher than the 5% area burned by humans described earlier when averaged across interior Alaska and indicates strong human influence within 30 km of settlements.
4.3. Differences in Fire Seasonality and Duration
The occurrence of lightning strikes in Alaska seems to be a function of forest cover, intermediate elevation, and weather conducive to lightning development [29,43,61]. Lightning fires are mostly observed in June and July with some fires in August [26] which correspond to recorded lightning strike peaks in June and especially July and a rapid drop in August [45]. In contrast, human-caused fires occur earlier during the growing season with a peak in May [6,26]. Our results align with these findings by providing median start dates of late June versus early June for lightning and human fires, respectively. We also found that the average discovery date of lightning ignitions is moving towards spring by 0.2 days year−1 in rural interior Alaska and 0.5 days year−1 in the Fairbanks subregion which seems a clear response to the observed climate warming during winter, spring, and summer [39]. This warming has led to earlier thaw and greenup [62] and lengthened the growing season by 45% near Fairbanks over the past century [39]. The earlier beginning of the fire season and longer growing season also explain increases in fire duration for all causes and subregions, which ranged from 6.0% year−1 for human fires in the Fairbanks subregion to 2.4% year−1 for lightning fires in rural interior Alaska. In general, human fires stay smaller and do not burn as long. DeWilde and Chapin [26] determined that the most frequently recorded fire size of lightning-caused fires was 0.4–4 ha; in comparison, 78% of human-caused fires were less than 0.4 ha in size. This complements our findings of median fire durations of 2 days for human-caused fires and 12 days for lightning-caused fires.
5. Conclusions
We found that human-caused fires start closer to human settlements and highways, burn for a shorter duration which is increasing, and start earlier in the year. The fire regime in the more urban Fairbanks subregion is much more impacted by human activity: people are responsible for more ignitions and a much larger contribution to total area burned. Yet, while human ignitions have been decreasing over the past three decades, total area burned, and fire duration of human-caused fires have been increasing steeply. In contrast, rural interior Alaska is experiencing increasing fire ignitions, longer burning fires, and increasing area burned mostly by natural causes. This study provides much needed insights into differences in fire regime between urban and rural areas of interior Alaska and between human- and lighting-caused fires that are relevant for modeling and fire management. Interior Alaska also serves as a suitable case study for human impacts on the natural fire regime that are relevant to other remote forest regions that are experiencing an increase in human influence on fire via hotspots.
Acknowledgments
This research was supported by funding from the National Science Foundation and the USDA Forest Service through the Bonanza Creek Long Term Ecological Research Program. Any use of trade, firm, or product names is for descriptive purposes only and does not imply endorsement by the U.S. Government.
Author Contributions
Monika P. Calef performed the GIS analyses and wrote the majority of the manuscript; Anna Varvak performed the statistical tests and created the relevant figures; and A. David McGuire provided critical contributions to manuscript format, content, and writing.
Conflicts of Interest
The authors declare no conflict of interest.
References
- Scharlemann, J.P.; Tanner, E.V.; Hiederer, R.; Kapos, V. Global soil carbon: Understanding and managing the largest terrestrial carbon pool. Carbon Manag. 2014, 5, 81–91. [Google Scholar] [CrossRef]
- Gauthier, S.; Bernier, P.; Kuuluvainen, T.; Shvidenko, A.; Schepaschenko, D. Boreal forest health and global change. Science 2015, 349, 819–822. [Google Scholar] [CrossRef] [PubMed]
- Gillett, N.P.; Weaver, A.J.; Zwiers, E.W.; Flannigan, M.D. Detecting the effect of climate change on canadian forest fires. Geophys. Res. Lett. 2004, 31. [Google Scholar] [CrossRef]
- Soja, A.J.; Tchebakova, N.M.; French, N.H.F.; Flannigan, M.D.; Shugart, H.H.; Stocks, B.J.; Sukhinin, A.I.; Parfenova, E.I.; Chapin, F.S., III; Stackhouse, P.W., Jr. Climate-induced boreal forest change: Predictions versus current observations. Glob. Planet. Chang. 2007, 56, 274–296. [Google Scholar] [CrossRef]
- Kasischke, E.S.; Verbyla, D.L.; Rupp, T.S.; McGuire, A.D.; Murphy, K.A.; Jandt, R.; Barnes, J.L.; Hoy, E.E.; Duffy, P.A.; Calef, M.P.; et al. Alaska’s changing fire regime—Implications for the vulnerability of its boreal forests. Can. J. For. Res. 2010, 40, 1313–1324. [Google Scholar] [CrossRef]
- Kasischke, E.S.; Turetsky, M.R. Recent changes in the fire regime across the north american boreal region—Spatial and temporal patterns of burning across canada and alaska. Geophys. Res. Lett. 2006, 33, 1–5. [Google Scholar] [CrossRef]
- Ponomarev, E.I.; Kharuk, V.I.; Ranson, K.J. Wildfires dynamics in siberian larch forests. Forests 2016, 7, 125. [Google Scholar] [CrossRef]
- Kelly, R.; Genet, H.; McGuire, A.D.; Hu, F.S. Palaeodata-informed modelling of large carbon losses from recent burning of boreal forests. Nat. Clim. Chang. 2016, 6, 79–82. [Google Scholar] [CrossRef]
- Turetsky, M.R.; Kane, E.S.; Harden, J.W.; Ottmar, R.D.; Manies, K.L.; Hoy, E.; Kasischke, E.S. Recent acceleration of biomass burning and carbon losses in alaskan forests and peatlands. Nat. Geosci. 2011, 4, 27–31. [Google Scholar] [CrossRef]
- Amiro, B.D.; Todd, J.B.; Wotton, B.M.; Logan, K.A.; Flannigan, M.D.; Stocks, B.J.; Mason, J.A.; Martell, D.L.; Hirsch, A. Direct carbon emissions from canadian forest firest, 1959–1999. Can. J. For. Res. 2005, 31, 512–525. [Google Scholar] [CrossRef]
- Balshi, M.S.; McGuire, A.D.; Duffy, P.; Flannigan, M.D.; Walsh, J.; Melillo, J.M. Assessing the response of area burned to changing climate in western boreal north america using a multivariate adaptive regression splines (mars) approach. Glob. Chang. Biol. 2009, 15, 578–600. [Google Scholar] [CrossRef]
- Amiro, B.D.; Cantin, A.; Flannigan, M.D.; De Groot, W. Future emissions from canadian boreal forest fires. Can. J. For. Res. 2009, 39, 383–395. [Google Scholar] [CrossRef]
- Balshi, M.S.; McGuire, A.D.; Duffy, P.; Flannigan, M.; Kicklighter, D.W.; Melillo, J. Vulnerability of carbon storage in north american boreal forests to wildfires during the 21st century. Glob. Chang. Biol. 2009, 15, 1491–1510. [Google Scholar] [CrossRef]
- Young, A.M.; Higuera, P.E.; Duffy, P.A.; Hu, F.S. Climatic thresholds shape northern high-latitude fire regimes and imply vulnerability to future climate change. Ecography 2017, 40, 606–617. [Google Scholar] [CrossRef]
- Serreze, M.C.; Barry, R.G. Processes and impacts of arctic amplification: A research synthesis. Glob. Planet. Chang. 2011, 77, 85–96. [Google Scholar] [CrossRef]
- Mann, D.H.; Rupp, T.S.; Olson, M.A.; Duffy, P.A. Is alaska’s boreal forest now crossing a major ecological threshold? Arct. Antarct. Alp. Res. 2012, 44, 319–331. [Google Scholar] [CrossRef]
- Héon, J.; Arsenault, D.; Parisien, M.-A. Resistance of the boreal forest to high burn rates. Proc. Natl. Acad. Sci. USA 2014, 111, 13888–13893. [Google Scholar] [CrossRef] [PubMed]
- Wolken, J.M.; Hollingsworth, T.N.; Rupp, T.S.; Chapin III, F.S.; Trainor, S.F.; Barrett, T.M.; Sullivan, P.F.; McGuire, A.D.; Euskirchen, S.E.; Hennon, P.E.; et al. Evidence and implications of recent and projected climate change in alaska’s forest ecosystems. Ecosphere 2011, 2, 1–35. [Google Scholar] [CrossRef]
- Pastick, N.J.; Duffy, P.; Genet, H.; Rupp, T.S.; Wylie, B.K.; Johnson, K.D.; Jorgenson, M.T.; Bliss, N.; McGuire, A.D.; Jafarov, E.E.; et al. Historical and projected trends in landscape drivers affecting carbon dynamics in alaska. Ecol. Appl. 2017, 27, 1383–1402. [Google Scholar] [CrossRef] [PubMed]
- Aldersley, A.; Murray, S.J.; Cornell, S.E. Global and regional analysis of climate and human drivers of wildfire. Sci. Total Environ. 2011, 409, 3472–3481. [Google Scholar] [CrossRef] [PubMed]
- Abatzoglou, J.T.; Kolden, C.A. Relative importance of weather and climate on wildfire growth in interior alaska. Int. J. Wildland Fire 2011, 20, 479–486. [Google Scholar] [CrossRef]
- Kelly, R.; Chipman, M.L.; Higuera, P.E.; Stefanova, I.; Brubaker, L.B.; Hu, F.S. Recent burning of boreal forests exceeds fire regime limits of the past 10,000 years. Proc. Natl. Acad. Sci. USA 2013, 110, 13055–13060. [Google Scholar] [CrossRef] [PubMed]
- Krawchuk, M.A.; Cumming, S.G.; Wein, R.W. Biotic and abiotic regulation of lightning fire initiation in the mixedwood boreal forest. Ecology 2006, 87, 458–468. [Google Scholar] [CrossRef] [PubMed]
- Rupp, T.S.; Starfield, A.M.; Chapin, F.S.I.; Duffy, P. Modeling the impact of black spruce on the fire regime of alaskan boreal forest. Clim. Chang. 2002, 55, 213–233. [Google Scholar] [CrossRef]
- Butsic, V.; Kelly, M.; Moritz, M.A. Land use and wildfire: A review of local interactions and teleconnections. Land 2015, 4, 140–156. [Google Scholar] [CrossRef]
- DeWilde, L.; Chapin, F.S.I. Human impacts on the fire regime of interior alaska: Interactions among fuels, ignition sources, and fire suppression. Ecosystems 2006, 9, 1342–1353. [Google Scholar] [CrossRef]
- Cumming, S.G. Effective fire suppression in boreal forests. Can. J. Forest Res. 2005, 35, 772–786. [Google Scholar] [CrossRef]
- Ward, P.C.; Tithecott, A.G.; Wotton, B.M. Reply—A re-examination of the effects of fire suppression in the boreal forest. Can. J. Forest Res. 2001, 31, 1467–1480. [Google Scholar]
- Veraverbeke, S.; Rogers, B.M.; Goulden, M.L.; Jandt, R.R.; Miller, C.E.; Wiggins, E.B.; Randerson, J.T. Lightning as a major driver of recent large fire years in north american boreal forests. Nat. Clim. Chang. 2017, 7, 529–534. [Google Scholar] [CrossRef]
- Kovacs, K.; Ranson, K.J.; Sun, G.; Kharuk, V.I. The relationship of the terra modis fire product and anthropogenic features in the central siberian landscape. Earth Interact. 2004, 8, 1–25. [Google Scholar] [CrossRef]
- Calef, M.P.; McGuire, A.D.; Chapin III, F.S. Human influences on wildfire in alaska from 1988 through 2005: An analysis of the spatial patterns of human impacts. Earth Interact. 2008, 12, 1–17. [Google Scholar] [CrossRef]
- Wu, Z.; He, H.S.; Yang, J.; Liu, Z.; Liang, Y. Relative effects of climatic and local factors on fire occurence in boreal forest landscapes of northeastern china. Sci. Total Environ. 2014, 493, 472–480. [Google Scholar] [CrossRef] [PubMed]
- Krawchuk, M.A.; Moritz, M.A.; Parisien, M.-A.; Van Dorn, J.; Hayhoe, K. Global pyrogeography: The current and future distribution of wildfire. PLoS ONE 2009, 4, e5102. [Google Scholar] [CrossRef] [PubMed]
- Syphard, A.; Radeloff, V.C.; Keeley, J.E.; Hawbaker, T.J.; Clayton, M.K.; Stewart, S.I.; Hammer, R.B. Human influence on california fire regimes. Ecol. Appl. 2007, 17, 1388–1402. [Google Scholar] [CrossRef] [PubMed]
- Hantson, S.; Pueyo, S.; Chuvieco, E. Global fire size distribution is driven by human impact and climate. Global Ecol. Biogeogr. 2015, 24, 77–86. [Google Scholar] [CrossRef]
- Lutz, H.J. Aboriginal Man and White Man as Historical Causes of Fires in the Boreal Forest, with Particular Reference to Alaska; School of Forestry, Yale University: New Haven, CT, USA, 1959; p. 49. [Google Scholar]
- Natcher, D.C.; Calef, M.P.; Huntington, O.; Trainor, S.F.; Huntington, H.P.; DeWilde, L.; Rupp, T.S.; Chapin, F.S., III. Factors contributing to the cultural and spatial variability of landscape burning by native peoples of interior alaska. Ecol. Soc. 2007, 12, 7. [Google Scholar] [CrossRef]
- Bourgeau-Chavez, L.L.; Alexander, M.E.; Stocks, B.J.; Kasischke, E.S. Distribution of forest ecosystems and the role of fire in the north american boreal region. In Fire, Climate Change, and Carbon Cycling in the Boreal Forest; Kasischke, E.S., Stocks, B.J., Eds.; Springer: New York, NY, USA, 2000; Volume 138, pp. 111–131. [Google Scholar]
- Wendler, G.; Shulski, M. A century of climate change for fairbanks, alaska. Arctic 2009, 62, 295–300. [Google Scholar] [CrossRef]
- Barber, V.G.; Juday, G.P.; Finney, B.P.; Wilmking, M. Reconstruction of summer temperatures in interior alaska from tree-ring proxies: Evidence for changing climate regimes. Clim. Chang. 2004, 63, 91–120. [Google Scholar] [CrossRef]
- Barber, V.A.; Juday, G.P.; Finney, B.P. Reduced growth of alaskan white spruce in the twentieth century from temperature-induced drought stress. Nature 2000, 405, 668–673. [Google Scholar] [CrossRef] [PubMed]
- Lynch, J.A.; Clark, J.S.; Bigelow, N.H.; Edwards, M.E.; Finney, B.P. Geographic and temporal variations in fire history in boreal ecosystems of alaska. J. Geophys. Res. 2003, 108, 1–17. [Google Scholar] [CrossRef]
- Henry, D.M. Fire Occurence Using 500 mb Map Correlation; NWS AR-21; NOAA Technical Memorandum: Anchorage, AK, USA, 1978.
- DeWilde, L. Human Impacts on the Fire Regime of Interior Alaska. Master’s Thesis, University of Alaska, Fairbanks, AK, USA, 2003. [Google Scholar]
- Wendler, G.; Conner, J.; Moore, B.; Shulski, M.; Stuefer, M. Climatology of alaskan wildfires with special emphasis on the extreme year of 2004. Theor. Appl. Climatol. 2011, 104, 459–472. [Google Scholar] [CrossRef]
- Guo, F.; Innes, J.L.; Wang, G.; Ma, X.; Sun, L.; Hu, H.; Su, Z. Historic distribution and driving factors of human-caused fires in the chinese boreal forest between 1972 and 2005. J. Plant Ecol. 2015, 8, 480–490. [Google Scholar] [CrossRef]
- Gaglioti, B.V.; Mann, D.H.; Jones, B.M.; Wooller, M.J.; Finney, B.P. High-resolution records detect human-caused changes to the boreal forest wildfire regime in interior alaska. Holocene 2016, 26, 1064–1074. [Google Scholar] [CrossRef]
- Chapin, F.S.; Rupp, T.S.; Starfield, A.M.; DeWilde, L.; Zavaleta, E.S.; Fresco, N.; Henkelman, J.; McGuire, A.D. Planning for resilience: Modeling change in human-fire interactions in the alaskan boreal forest. Front. Ecol. Environ. 2003, 1, 255–261. [Google Scholar] [CrossRef]
- Calef, M.P.; Varvak, A.; McGuire, A.D.; Chapin III, F.S.; Reinhold, K.B. Recent changes in annual area burned in interior alaska: The impact of fire management. Earth Interact. 2015, 19, 1–17. [Google Scholar] [CrossRef]
- Gallant, A.L.; Binnian, E.F.; Omernik, J.M.; Shasby, M.B. Ecoregions of Alaska; USGS Professional Paper 1567; USGS Publications Warehouse: Oklahoma City, OK, USA, 1995; p. 73.
- Alaska Fire Service. Available online: https://afsmaps.blm.gov/ (accessed on 1 August 2017).
- Kasischke, E.S.; Williams, D.; Barry, D. Analysis of patterns of large fires in the boreal forest region of alaska. Int. J. Wildland Fire 2002, 11, 131–144. [Google Scholar] [CrossRef]
- Kasischke, E.S.; Loboda, T.; Giglio, L.; French, N.H.F.; Hoy, E.E.; de Jong, B.; Riano, D. Quantifying burned area for north american forests: Implications for direct reduction of carbon stocks. J. Geophys. Res. Atmos. 2011, 116, 1–17. [Google Scholar] [CrossRef]
- Mantua, N.J.; Hare, S.R.; Zhang, Y.; Wallace, J.M.; Francis, R.C. A pacific interdecadal climate oscillation with impacts on salmon production. Bull. Am. Meteorol. Soc. 1997, 78, 1069–1079. [Google Scholar] [CrossRef]
- Duffy, P.; Walsh, J.E.; Mann, D.H.; Graham, J.M.; Rupp, T.S. Impacts of large-scale atmospheric-ocean variability on alaskan fire season severity. Ecol. Appl. 2005, 15, 1317–1330. [Google Scholar] [CrossRef]
- Todd, S.K.; Jewkes, H.A. Wildland Fire in Alaska: A History of Organized Fire Suppression and Management in the Last Frontier; Agricultural and Forestry Experiment Station Bulletin No. 114; University of Alaska Fairbanks: Fairbanks, AK, USA, 2006; p. 63. [Google Scholar]
- Siegel, S.; Tukey, J.W. A nonparametric sum of ranks procedure for relative spread in unpaired samples. J. Am. Stat. Assoc. 1960, 55, 429–445. [Google Scholar] [CrossRef]
- Karl, T.R.; Arguez, A.; Huang, B.; Lawrimore, J.H.; McMahon, J.R.; Menne, M.J.; Peterson, T.C.; Vose, R.S.; Zhang, H.-M. Possible artifacts of data biases in the recent global surface warming hiatus. Science 2015, 348, 1469–1472. [Google Scholar] [CrossRef] [PubMed]
- Gonzalez-Olabarria, J.R.; Brotons, L.; Gritten, D.; Tudela, A.; Teres, J.A. Identifying location and causality of fire ignition hotspots in a mediterranean region. Int. J. Wildland Fire 2012, 21, 905–914. [Google Scholar] [CrossRef]
- Sanderson, E.W.; Jaiteh, M.; Levy, M.A.; Redford, K.H.; Wannebo, A.V.; Woolmer, G. The human footprint and the last of the wild. BioScience 2002, 52, 891–904. [Google Scholar] [CrossRef]
- Dissing, D.; Verbyla, D.L. Spatial patterns of lightning strikes in interior alaska and their relations to elevation and vegetation. Can. J. Forest Res. 2003, 33, 770–782. [Google Scholar] [CrossRef]
- Kimball, J.S.; McDonald, K.C.; Zhao, M. Spring thaw and its effect on terrestrial vegetation productivity in the western arctic observed from satellite microwave and optical remote sensing. Earth Interact. 2006, 10, 1–22. [Google Scholar] [CrossRef]
Figure 1.
Delineation of interior Alaska and the Fairbanks subregion, location of designated fire management zones, area burned by cause between 1988 and 2016, and other relevant geographic information.
Figure 1.
Delineation of interior Alaska and the Fairbanks subregion, location of designated fire management zones, area burned by cause between 1988 and 2016, and other relevant geographic information.
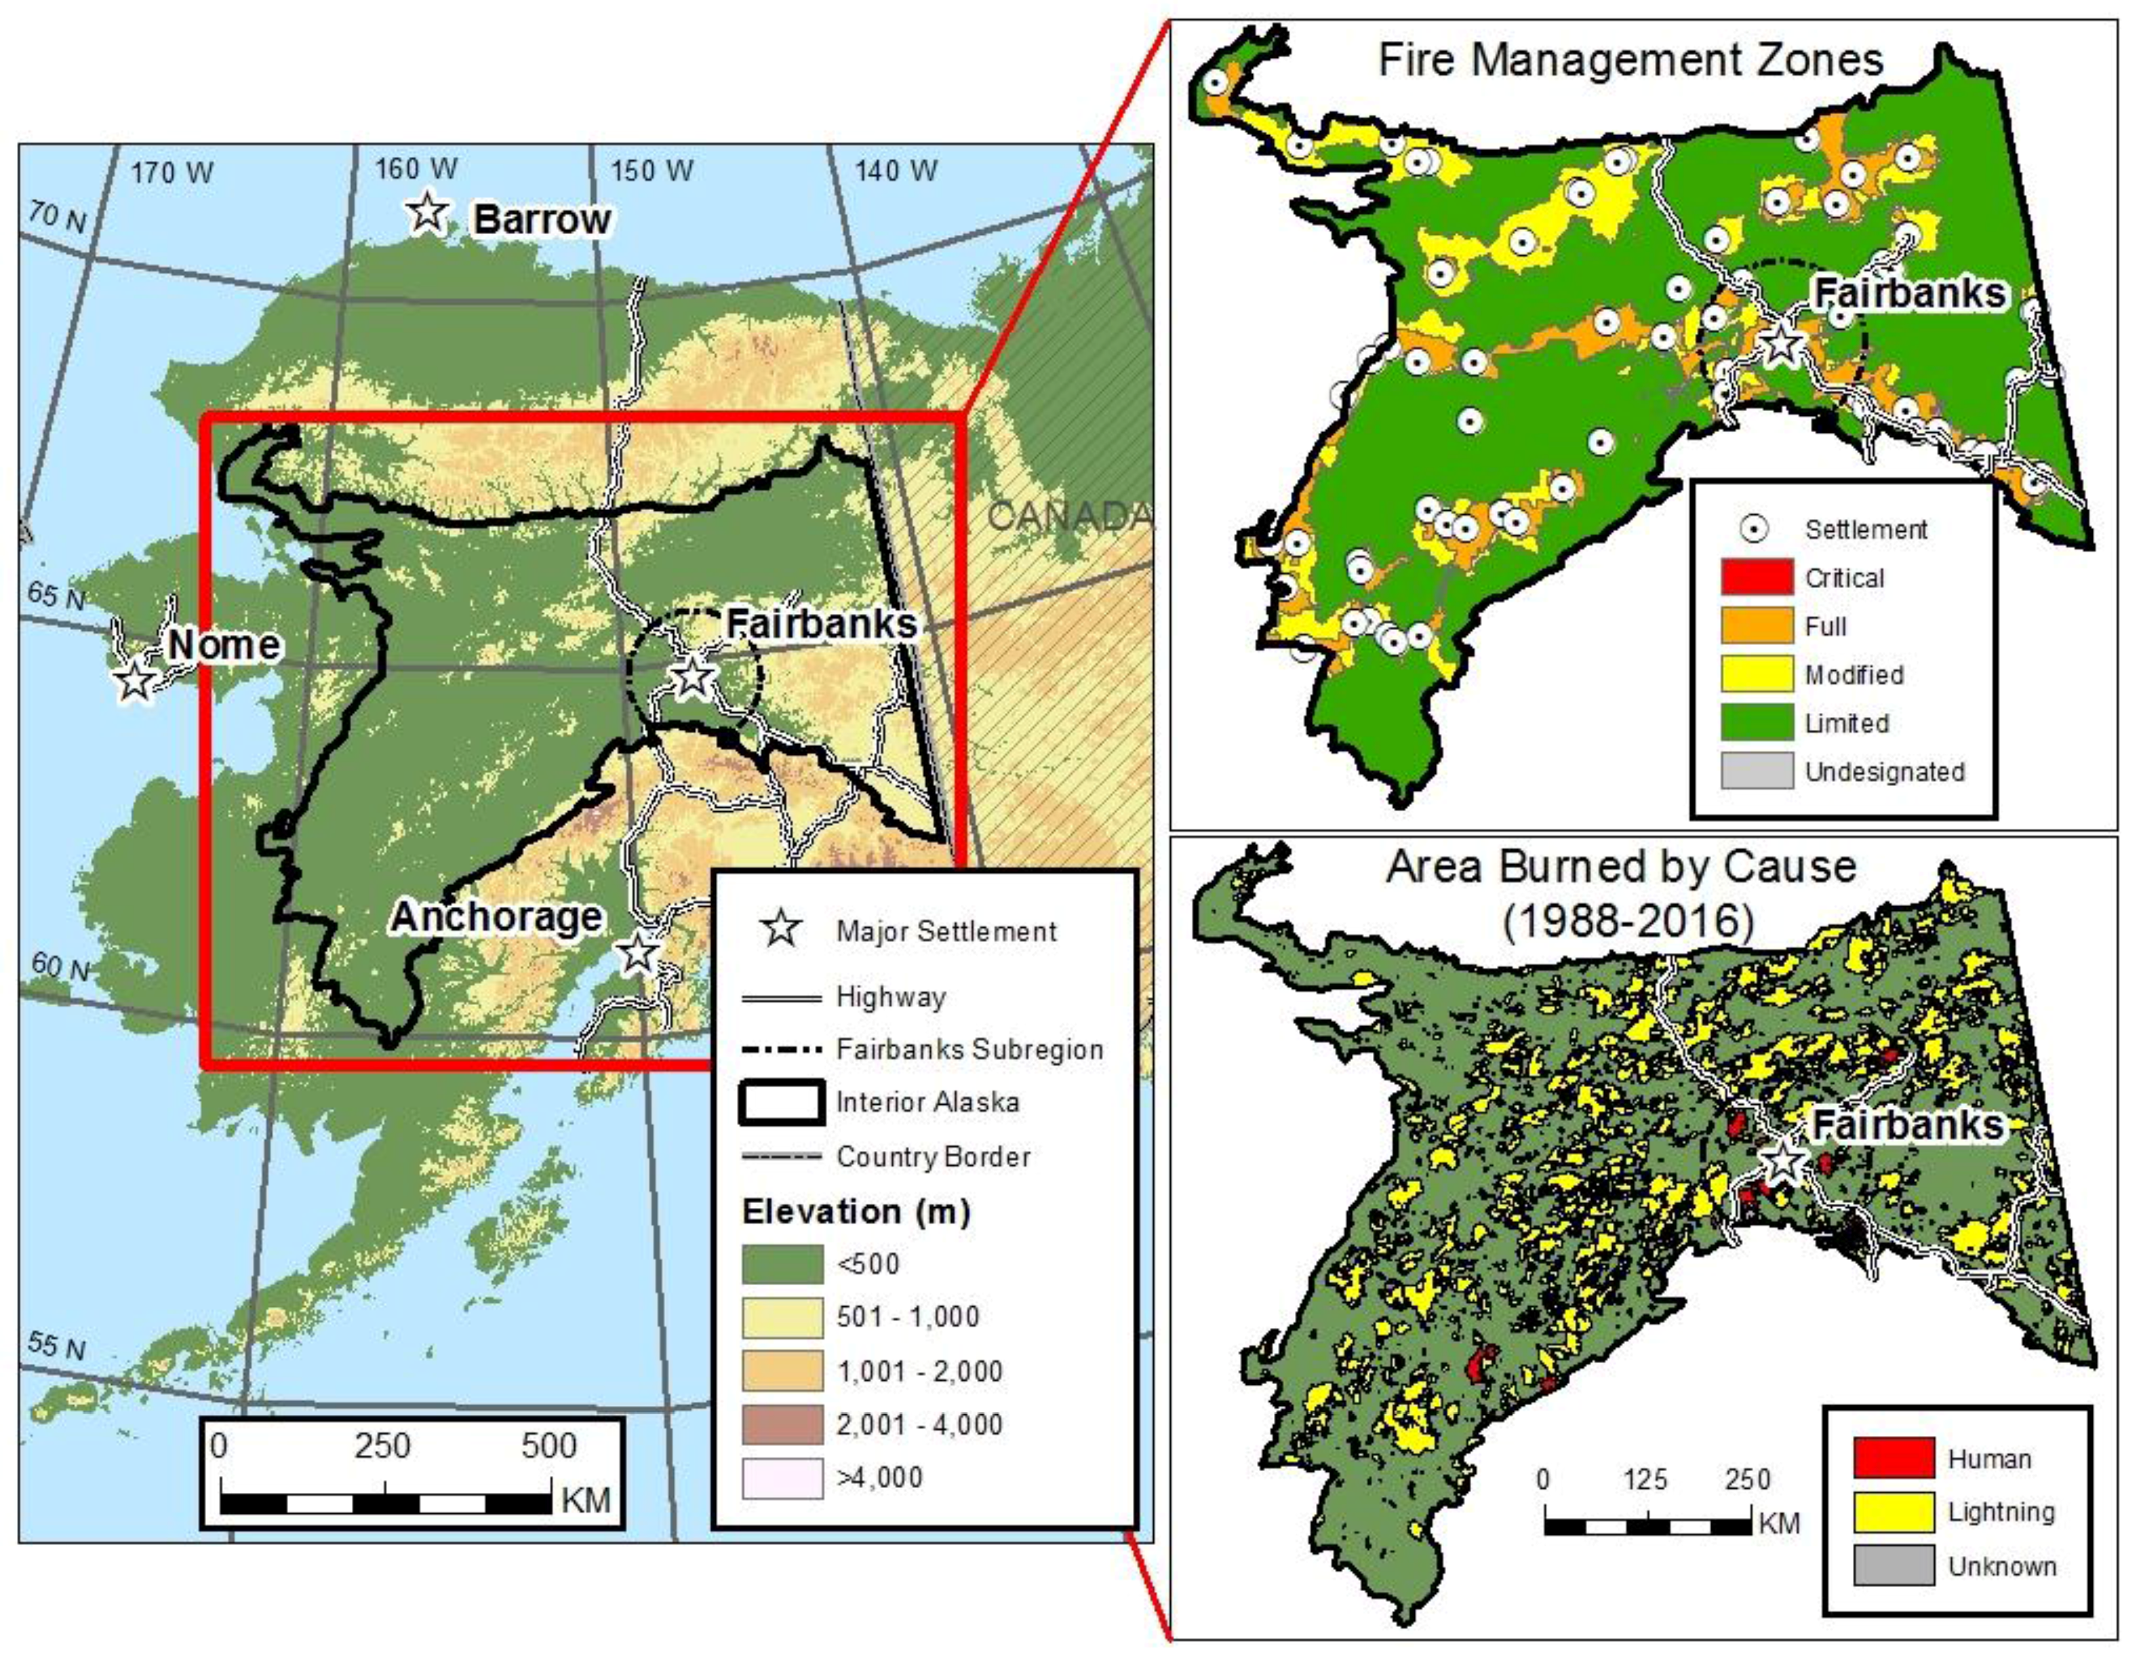
Figure 2.
Temporal trends in (a) annual area burned (ha) and (b) number of annual fire ignitions by cause in interior Alaska from 1943 to 2016.
Figure 2.
Temporal trends in (a) annual area burned (ha) and (b) number of annual fire ignitions by cause in interior Alaska from 1943 to 2016.

Figure 3.
General relationship between ignition cause and human proximity in interior Alaska as determined by Kruskal–Wallis tests for 1990–2016: Median distance of ignitions from (a) nearest settlement and (b) nearest highway. The boxplots show median values (thick line) with the first and third quartile forming the lower and upper boundary of the box, respectively; the dashed lines indicate 1.5 times the upper or lower quartile and the circles represent outliers.

Figure 4.
Number of fire ignitions (km−2 decade−1) and area burned (% decade−1) by cause from 1988 to 2016 with distance (km) from all named settlements in (a) the Fairbanks subregion; and (b) rural interior Alaska. In order to simplify comparisons across publications with different date ranges, we converted ignition density and area burned into decadal averages; e.g., within 0–5 km of settlements in the Fairbanks subregion, there were 0.43 human ignitions km−2 decade−1 which burned a total of 1.6% decade−1 of the area at that distance.

Figure 5.
General differences between lightning- and human-caused fire ignitions in interior Alaska as determined by Kruskal–Wallis tests for (a) discovery time and (b) fire duration.
Figure 5.
General differences between lightning- and human-caused fire ignitions in interior Alaska as determined by Kruskal–Wallis tests for (a) discovery time and (b) fire duration.


Table 1.
Probability of a fire occurring in any given year using logistic regression analysis for odds ratio and log-linear regression of temporal trends in area burned [using log10(annual area burned) > 0 ha unless noted otherwise] in (a) the Fairbanks subregion, and (b) rural interior Alaska.
Table 1.
Probability of a fire occurring in any given year using logistic regression analysis for odds ratio and log-linear regression of temporal trends in area burned [using log10(annual area burned) > 0 ha unless noted otherwise] in (a) the Fairbanks subregion, and (b) rural interior Alaska.
| (a) Fairbanks | |||||||||||
| Odds Ratio of Fire Occurrence | N | Area Burned Trends | |||||||||
| 1943–2016 | b | SE | z | Odds Ratio | b | SE | t | Yearly Change | |||
| Both | 0.074 | 0.021 | 3.55 | 1.077 | *** | 55 | 0.006 | 0.006 | 0.975 | 1.3% | |
| Human | 0.052 | 0.015 | 3.51 | 1.054 | *** | 41 | −0.013 | 0.007 | −1.891 | −3.0% | |
| Lightning | 0.066 | 0.017 | 3.91 | 1.068 | *** | 43 | −0.003 | 0.007 | −0.406 | −0.7% | |
| 1988–2016 | |||||||||||
| Both | 0.842 | 0.857 | 0.98 | 2.321 | 28 | 0.019 | 0.020 | 0.957 | 4.5% | ||
| Both 1 | NA 1 | 29 | 0.097 | 10.2% | |||||||
| Human | 0.189 | 0.094 | 2.00 | 1.208 | * | 24 | 0.007 | 0.025 | 0.274 | 1.6% | |
| Human | NA 1 | 29 | 0.065 | 0.031 | 2.123 | 16.1% | * | ||||
| Lightning | 0.129 | 0.115 | 1.12 | 1.138 | 27 | 0.000 | 0.023 | −0.001 | 0.0% | ||
| Lightning | NA 1 | 29 | 0.024 | 0.029 | 0.821 | 5.7% | |||||
| (b) Rural Interior Alaska | |||||||||||
| Odds Ratio of Fire Occurrence | N | Area Burned Trend | |||||||||
| 1943–2016 | b | SE | z | Odds Ratio | b | SE | t | Change | |||
| Both | NA 2 | 69 | 0.011 | 0.005 | 2.273 | 2.6% | * | ||||
| Human | 0.038 | 0.015 | 2.62 | 1.039 | ** | 49 | −0.008 | 0.006 | −1.286 | −1.7% | |
| Lightning | NA 3 | 68 | 0.012 | 0.005 | 2.334 | 2.9% | * | ||||
| 1988–2016 | |||||||||||
| Both | NA 2 | 29 | 0.003 | 0.016 | 0.160 | 0.7% | |||||
| Human | 0.056 | 0.093 | 0.60 | 1.057 | 27 | 0.009 | 0.019 | 0.442 | 2.0% | ||
| Human | NA 1 | 29 | 0.021 | 0.028 | 0.752 | 4.9% | |||||
| Lightning | NA 2 | 29 | −0.004 | 0.019 | −0.204 | −0.9% | |||||
b = slope, SE = Standard Error, z = z-statistic, t = two-tailed t-statistic, and N = number of years with data. Percent yearly change is derived from slope values to provide more understandable information of yearly changes in area burned. Significance: * = 0.05, ** = 0.01, *** = 0.001; NA = not applicable, 1 Linear regression was developed using all years, including years with zero area burned; 2 No model was developed since fire was recorded for every year; 3 No model was developed since fire was recorded for all years except 1980.
Table 2.
Log-linear regression results on temporal trends in fire ignitions using log10(annual ignitions) in the Fairbanks subregion versus rural interior Alaska.
Table 2.
Log-linear regression results on temporal trends in fire ignitions using log10(annual ignitions) in the Fairbanks subregion versus rural interior Alaska.
| Fairbanks | Rural Int. AK | |||||||
|---|---|---|---|---|---|---|---|---|
| 1943–2016 | b | SE | t | Yearly Change | b | SE | t | Yearly Change |
| Both | 0.011 | 0.001 | 4.468 | 2.5% *** | 0.009 | 0.002 | 5.464 | 2.1% *** |
| Human | 0.011 | 0.002 | 6.897 | 2.5% *** | 0.009 | 0.002 | 5.368 | 2.1% *** |
| Lightning | 0.011 | 0.002 | 4.387 | 2.5% *** | 0.010 | 0.002 | 4.472 | 2.3% *** |
| 1988–2016 | ||||||||
| Both | −0.010 | 0.003 | −3.457 | −2.3% ** | <−0.001 | 0.006 | −0.029 | −0.0% |
| Human | −0.011 | 0.003 | −4.108 | −2.6% *** | <0.001 | 0.003 | −0.010 | −0.0% |
| Human Full FMZ | −0.014 | 0.003 | −4.799 | −3.2% *** | −0.004 | 0.004 | −1.045 | −1.0% |
| Lightning | −0.004 | 0.010 | −0.406 | −1.0% | <−0.001 | 0.009 | −0.038 | −0.1% |
b = slope, SE = Standard Error, and t = two-tailed t-statistic. Percent yearly change is derived from slope values to provide more understandable information of yearly increase. FMZ = Fire management zone. Significance: * = 0.05, ** = 0.01, *** = 0.001
Table 3.
Temporal trends in fire duration in interior Alaska as a whole, the Fairbanks subregion, and rural interior Alaska by cause of ignition as determined by linear regression for 1990–2016.
Table 3.
Temporal trends in fire duration in interior Alaska as a whole, the Fairbanks subregion, and rural interior Alaska by cause of ignition as determined by linear regression for 1990–2016.
| Region | Cause | Yearly Change | b | SE | z |
|---|---|---|---|---|---|
| Interior Alaska | All | 3.4% | 0.0337 | 0.0003 | 98.72 |
| Human | 4.7% | 0.0457 | 0.0008 | 57.70 | |
| Lightning | 2.7% | 0.0265 | 0.0004 | 71.73 | |
| Fairbanks | All | 5.7% | 0.0557 | 0.0008 | 67.12 |
| Human | 6.0% | 0.0580 | 0.0011 | 52.68 | |
| Lightning | 4.6% | 0.0445 | 0.0012 | 36.67 | |
| Rural | All | 2.4% | 0.0235 | 0.0004 | 63.35 |
| Human | 2.7% | 0.0268 | 0.0011 | 23.67 | |
| Lightning | 2.4% | 0.0241 | 0.0004 | 62.01 |
All models show statistical significance below 0.0001 and b = slope, SE = Standard Error and z = z-statistic. Percent yearly change is derived from slope values to provide more understandable information of yearly increase.
© 2017 by the authors. Licensee MDPI, Basel, Switzerland. This article is an open access article distributed under the terms and conditions of the Creative Commons Attribution (CC BY) license (http://creativecommons.org/licenses/by/4.0/).
Share and Cite
MDPI and ACS Style
Calef, M.P.; Varvak, A.; McGuire, A.D. Differences in Human versus Lightning Fires between Urban and Rural Areas of the Boreal Forest in Interior Alaska. Forests 2017, 8, 422. https://doi.org/10.3390/f8110422
AMA Style
Calef MP, Varvak A, McGuire AD. Differences in Human versus Lightning Fires between Urban and Rural Areas of the Boreal Forest in Interior Alaska. Forests. 2017; 8(11):422. https://doi.org/10.3390/f8110422
Chicago/Turabian StyleCalef, Monika P., Anna Varvak, and A. David McGuire. 2017. "Differences in Human versus Lightning Fires between Urban and Rural Areas of the Boreal Forest in Interior Alaska" Forests 8, no. 11: 422. https://doi.org/10.3390/f8110422
Note that from the first issue of 2016, this journal uses article numbers instead of page numbers. See further details here.