Planting Waterscapes: Green Infrastructures, Landscape and Hydrological Modeling for the Future of Santa Cruz de la Sierra, Bolivia


Abstract
:1. Introduction
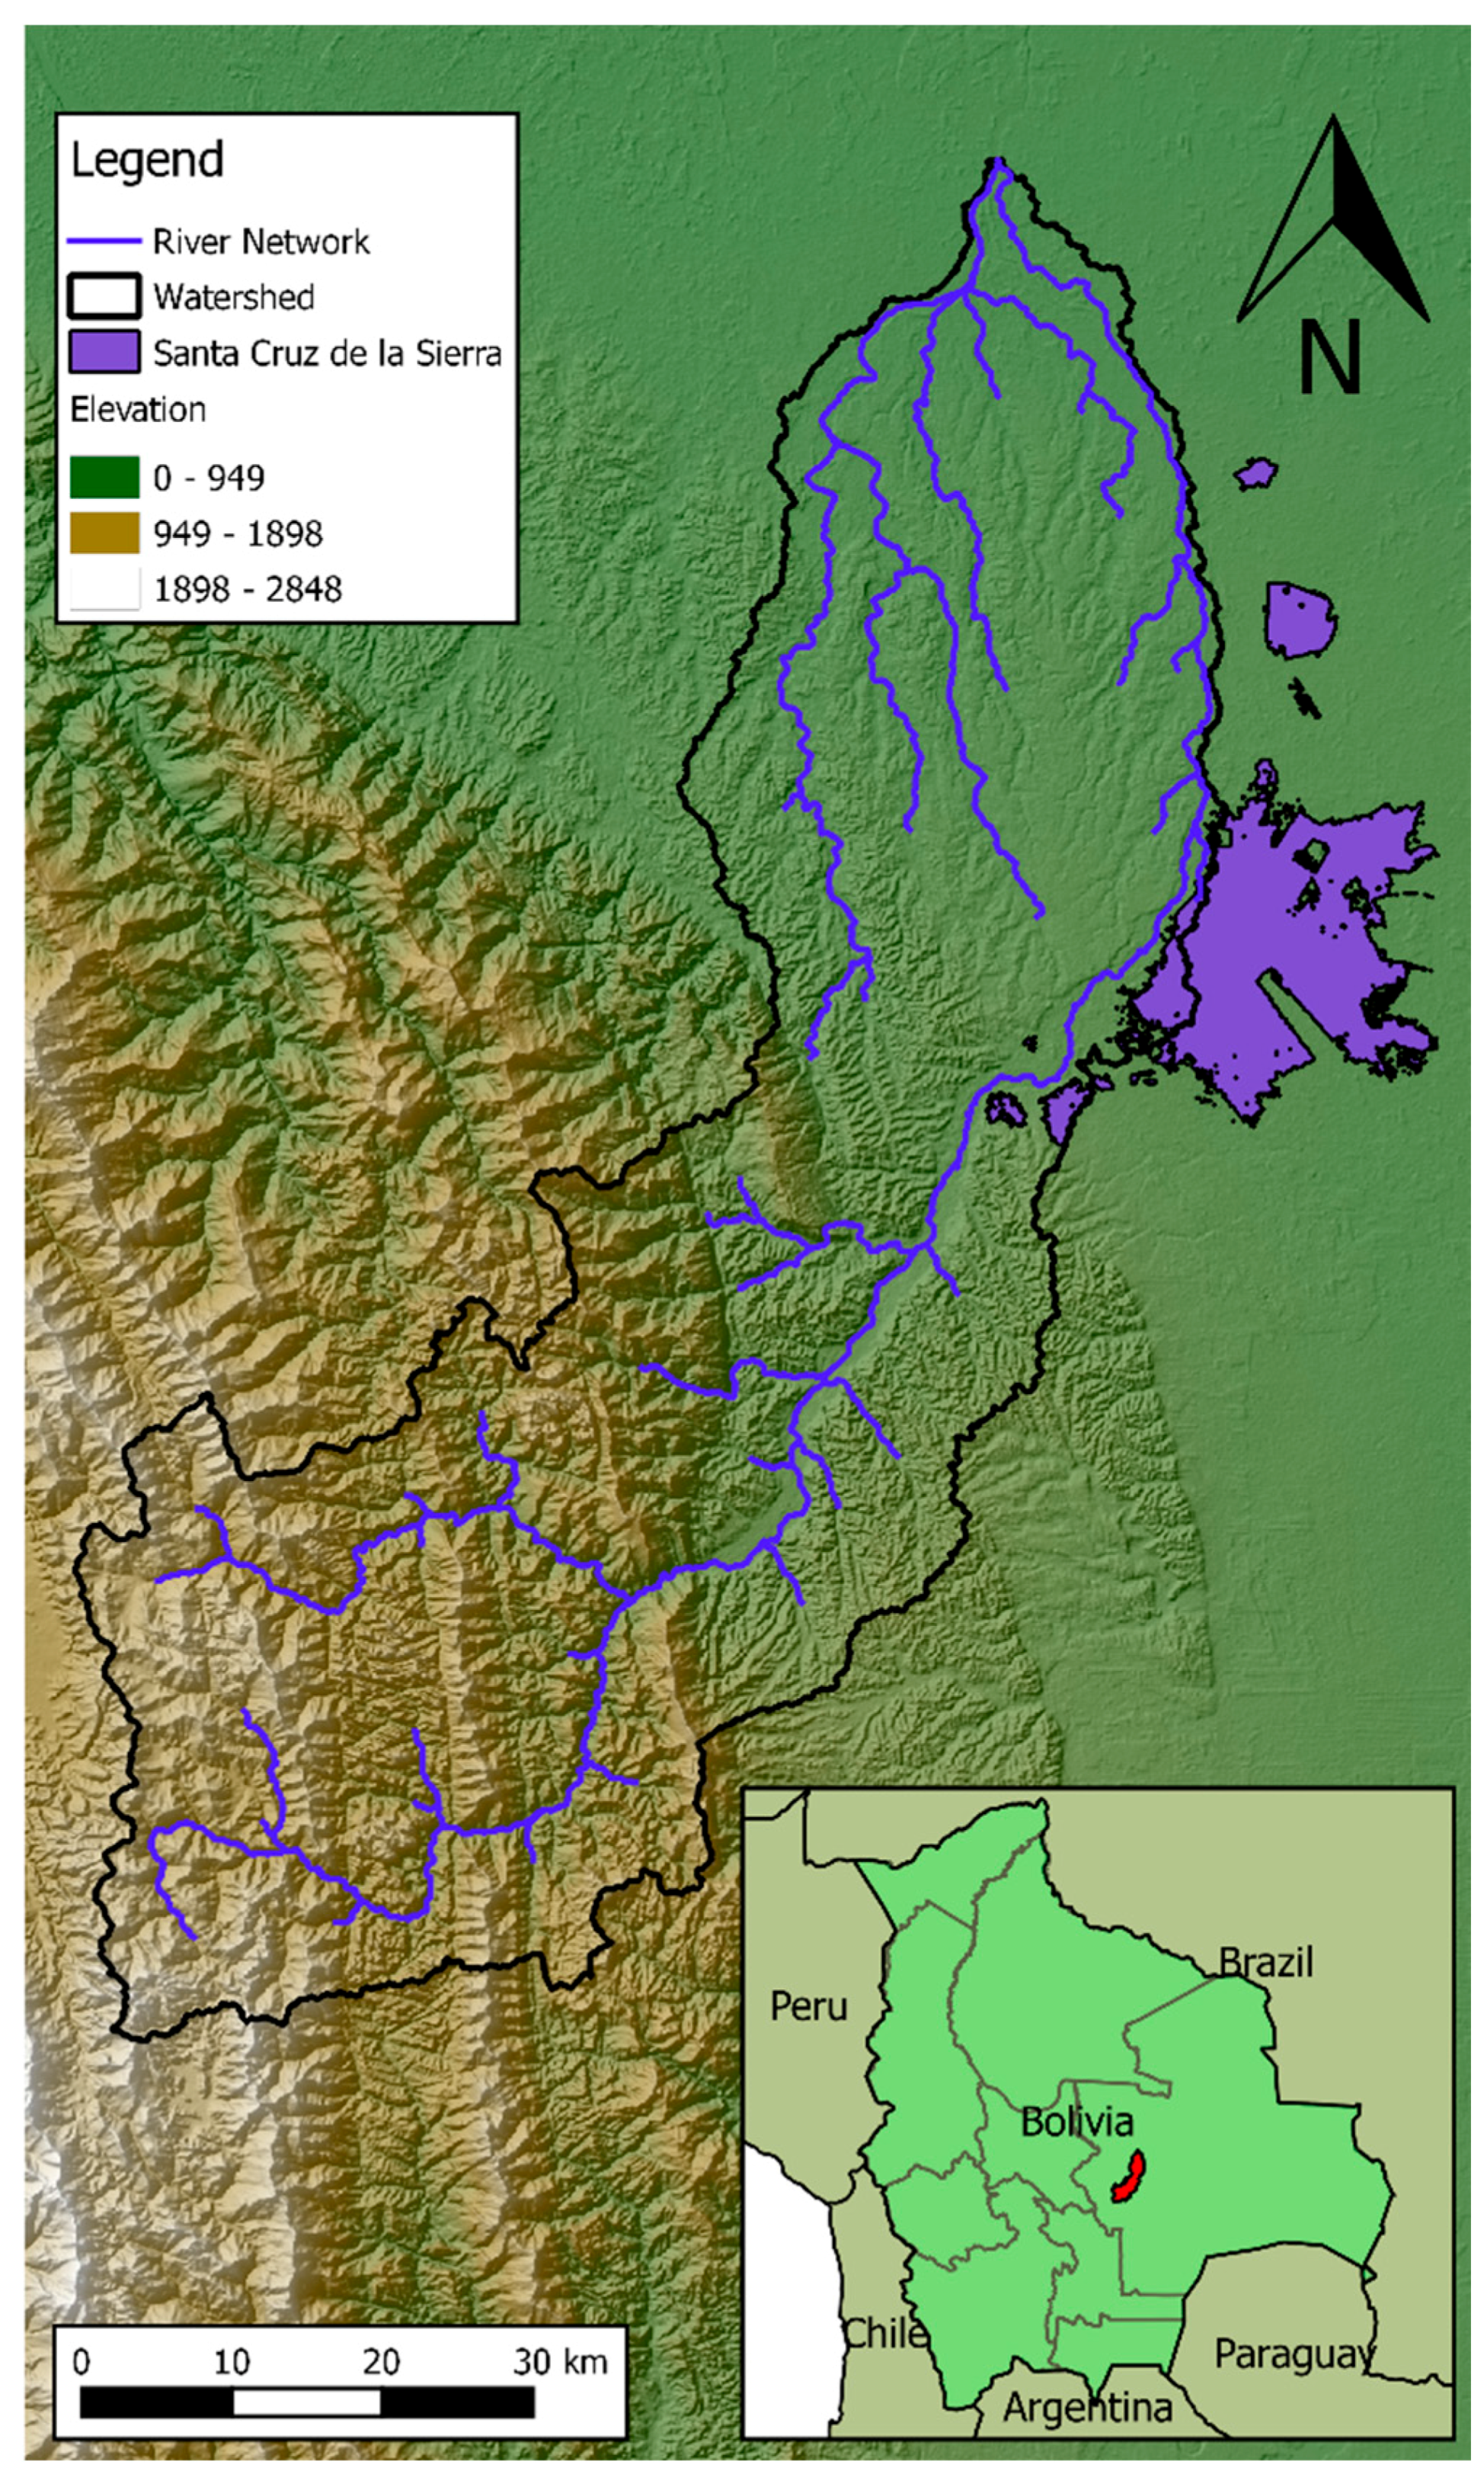
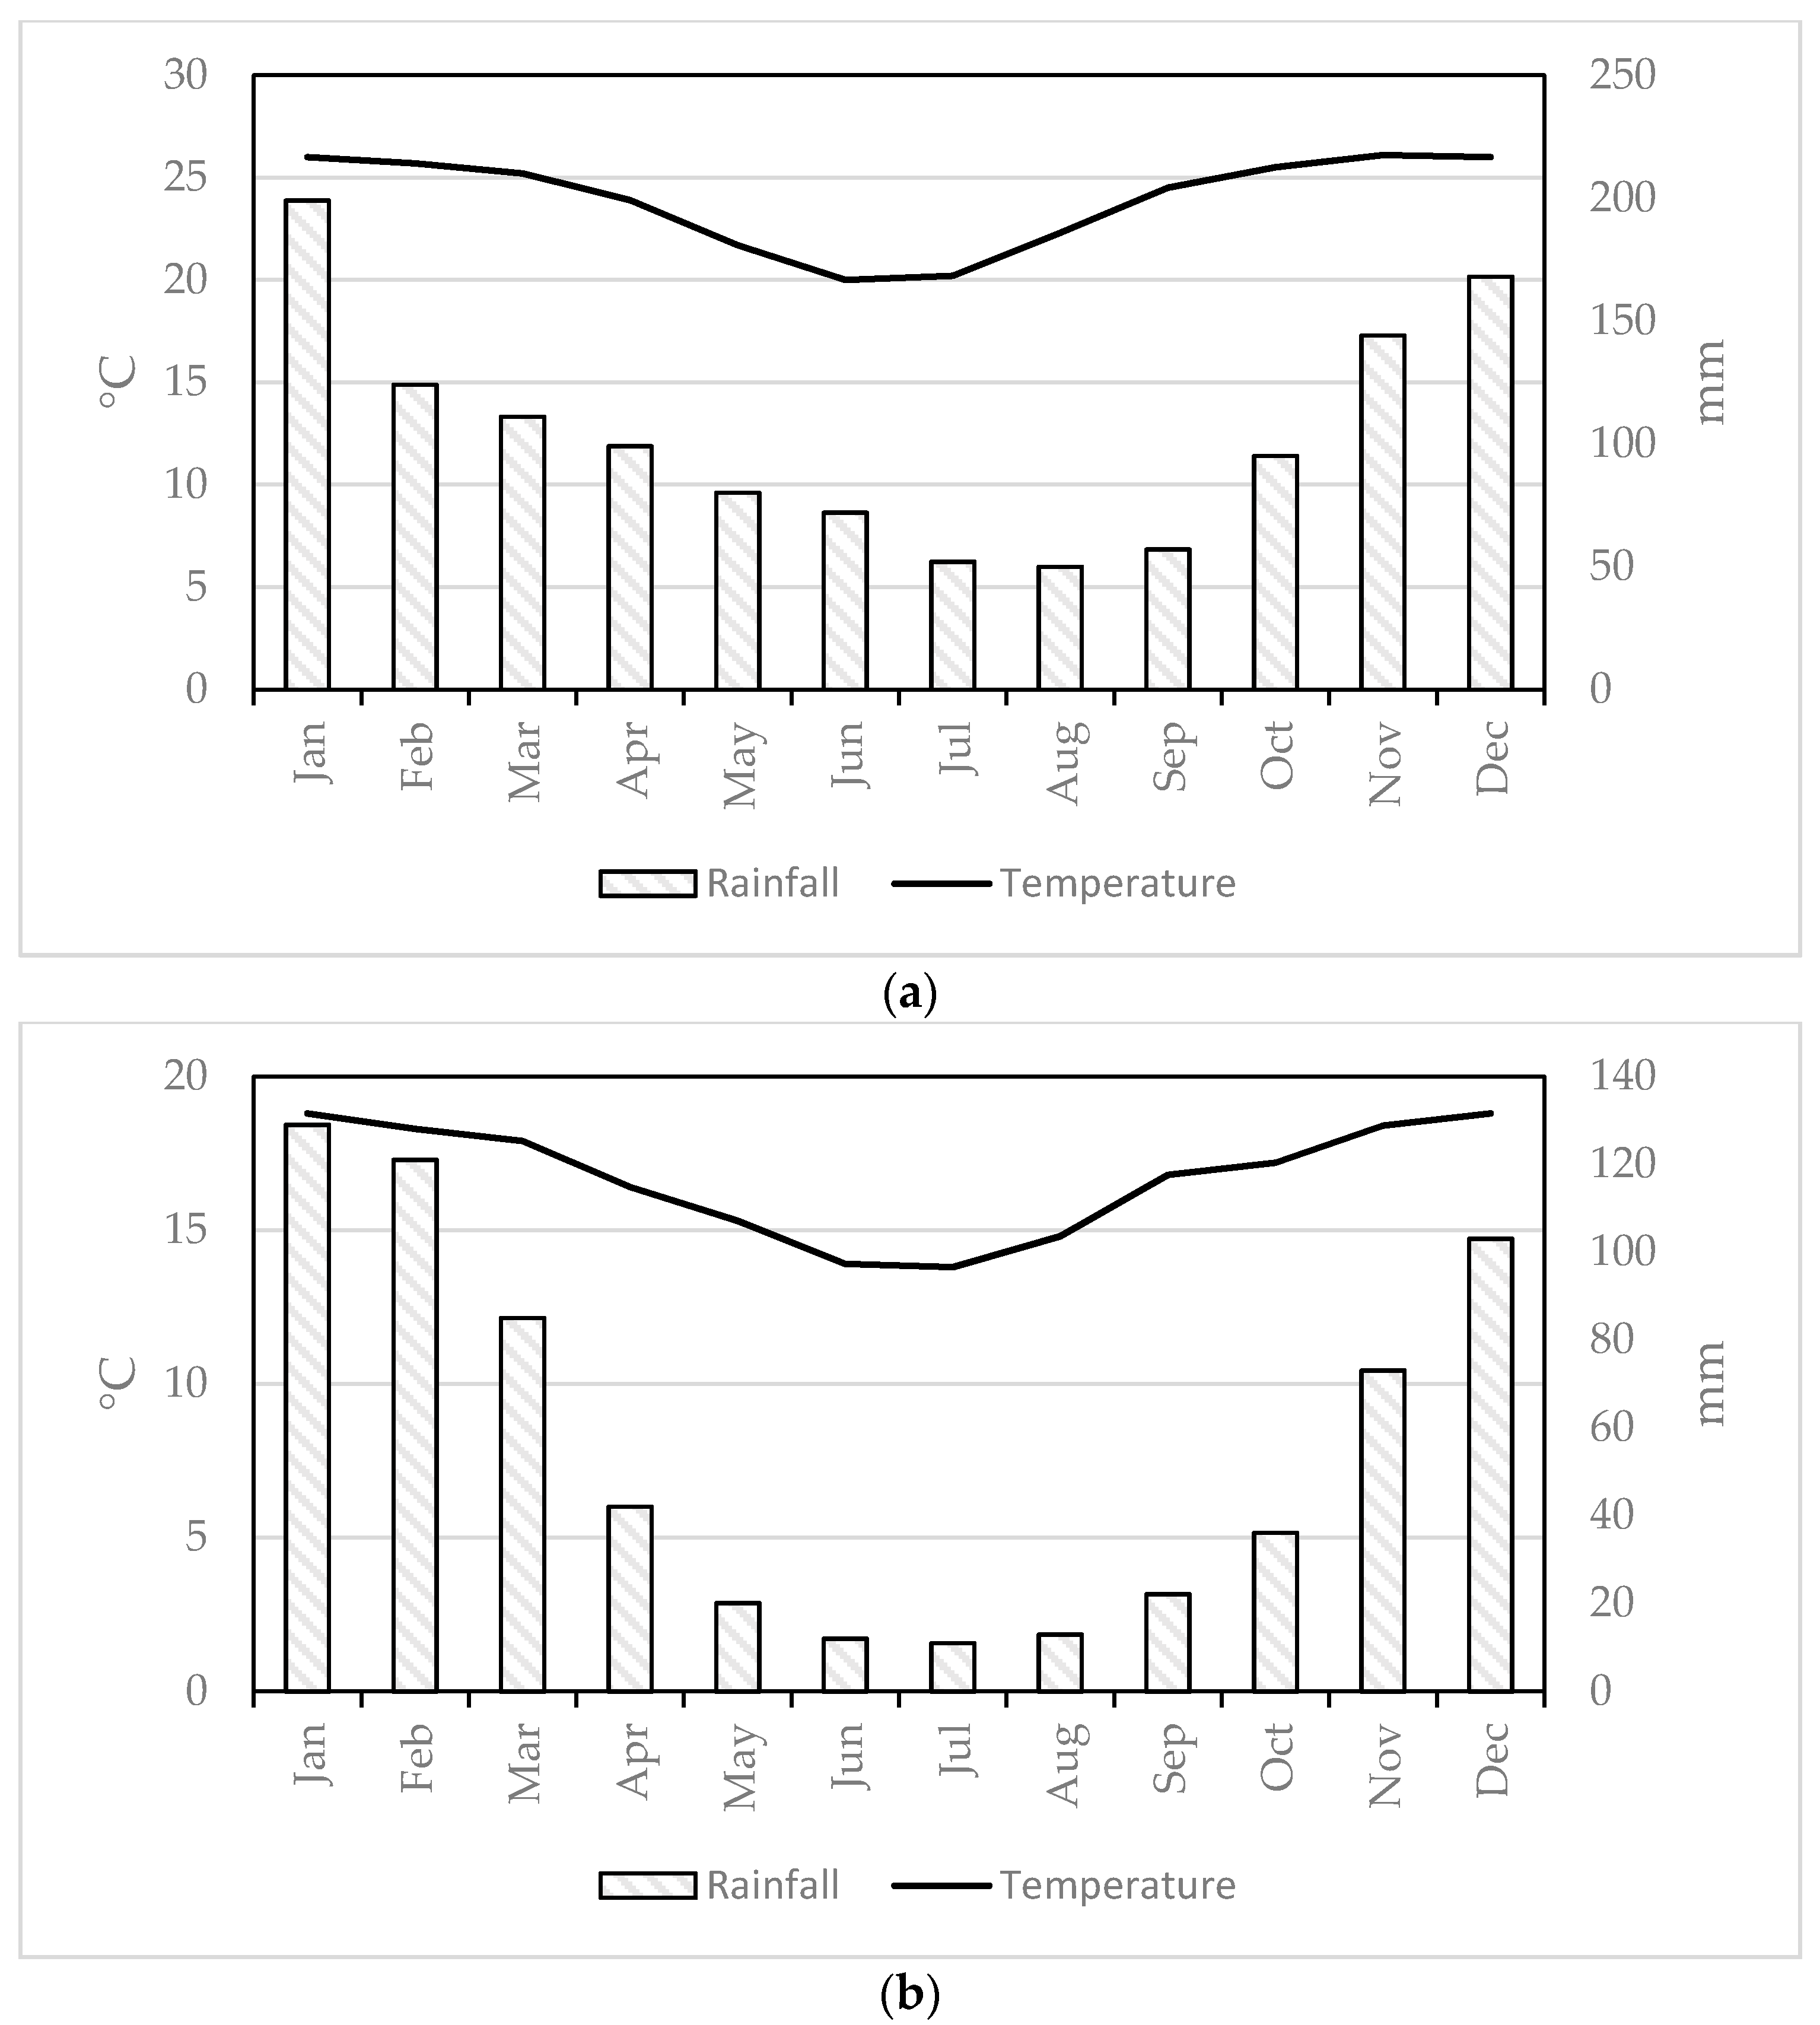
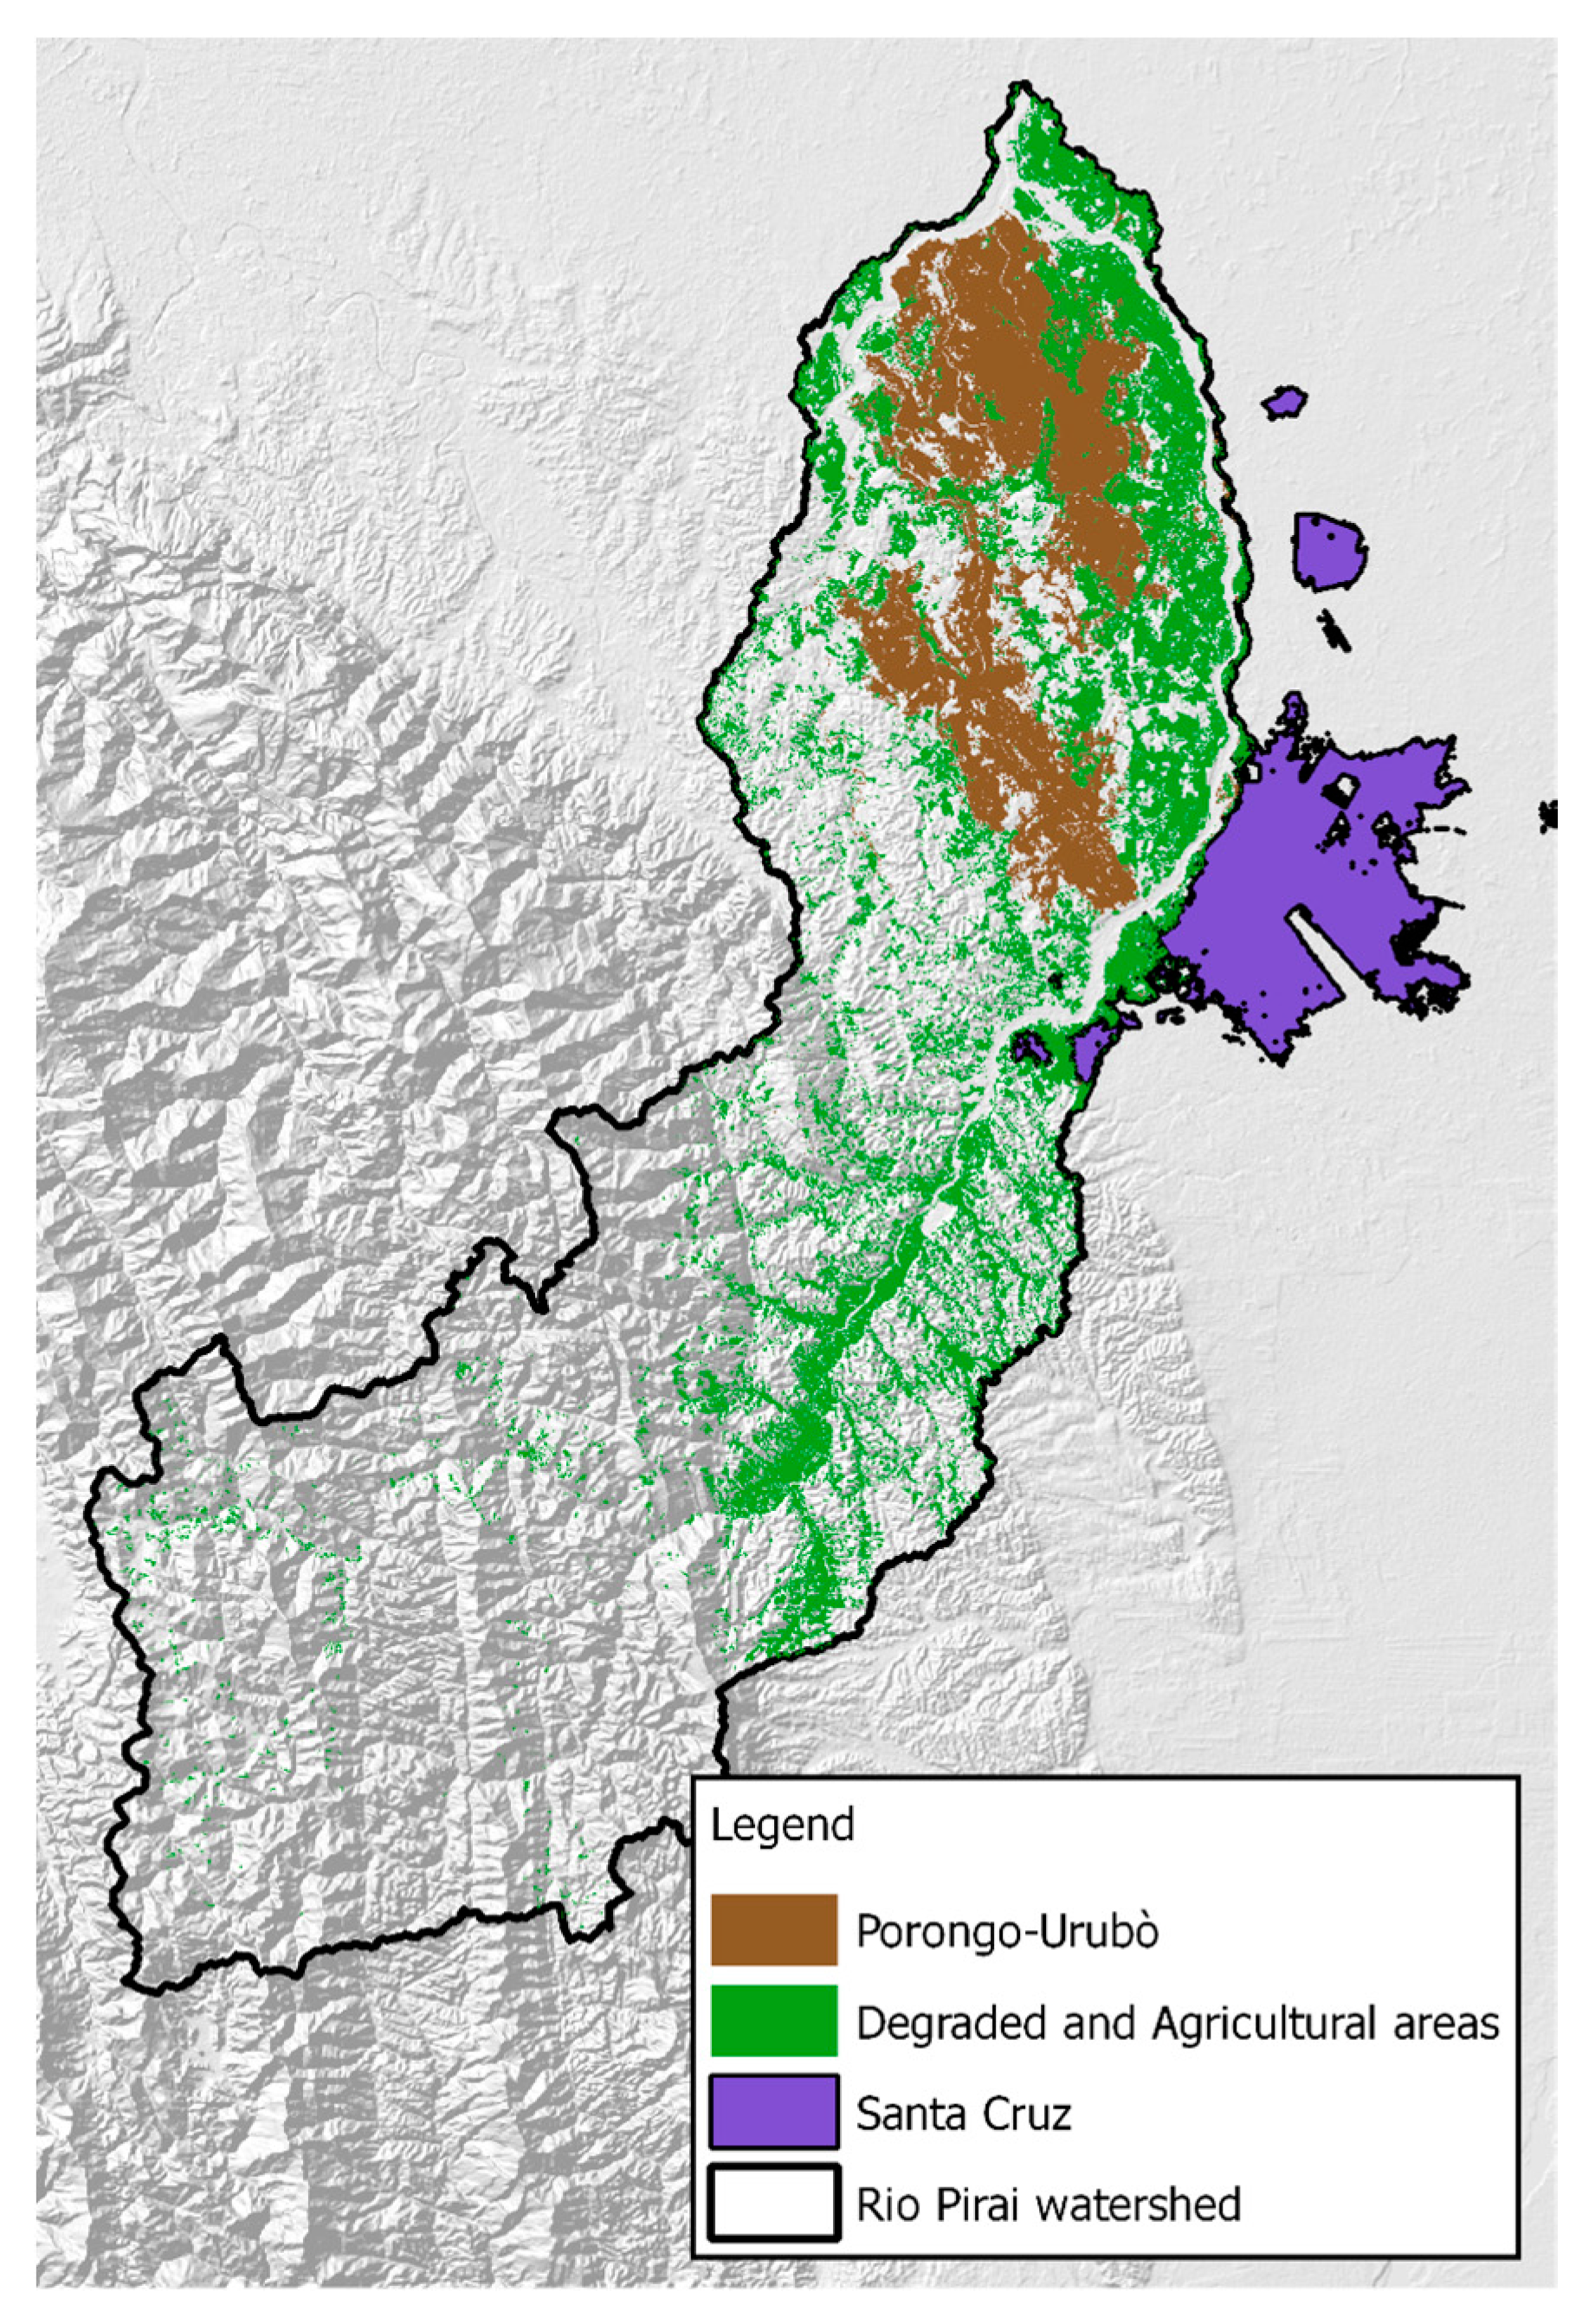
2. Study Area
3. Materials and Methods
- Scenario 2 (worst-case scenario): Porongo–Urubò area entirely urbanized.
- Scenario 3: Porongo–Urubò area entirely urbanized, with green infrastructures in the new urbanised areas (components: sustainable drainage systems, rain gardens, and green roofs).
- Scenario 4: Porongo–Urubò area entirely urbanized, with green infrastructures in the new urbanised areas and agroforestry—afforestation implemented in the degraded areas of the headwaters of the catchment.
- Scenario 5 (best-case scenario): Agroforestry—afforestation implemented in the degraded areas of the headwaters of the catchment.
4. Results
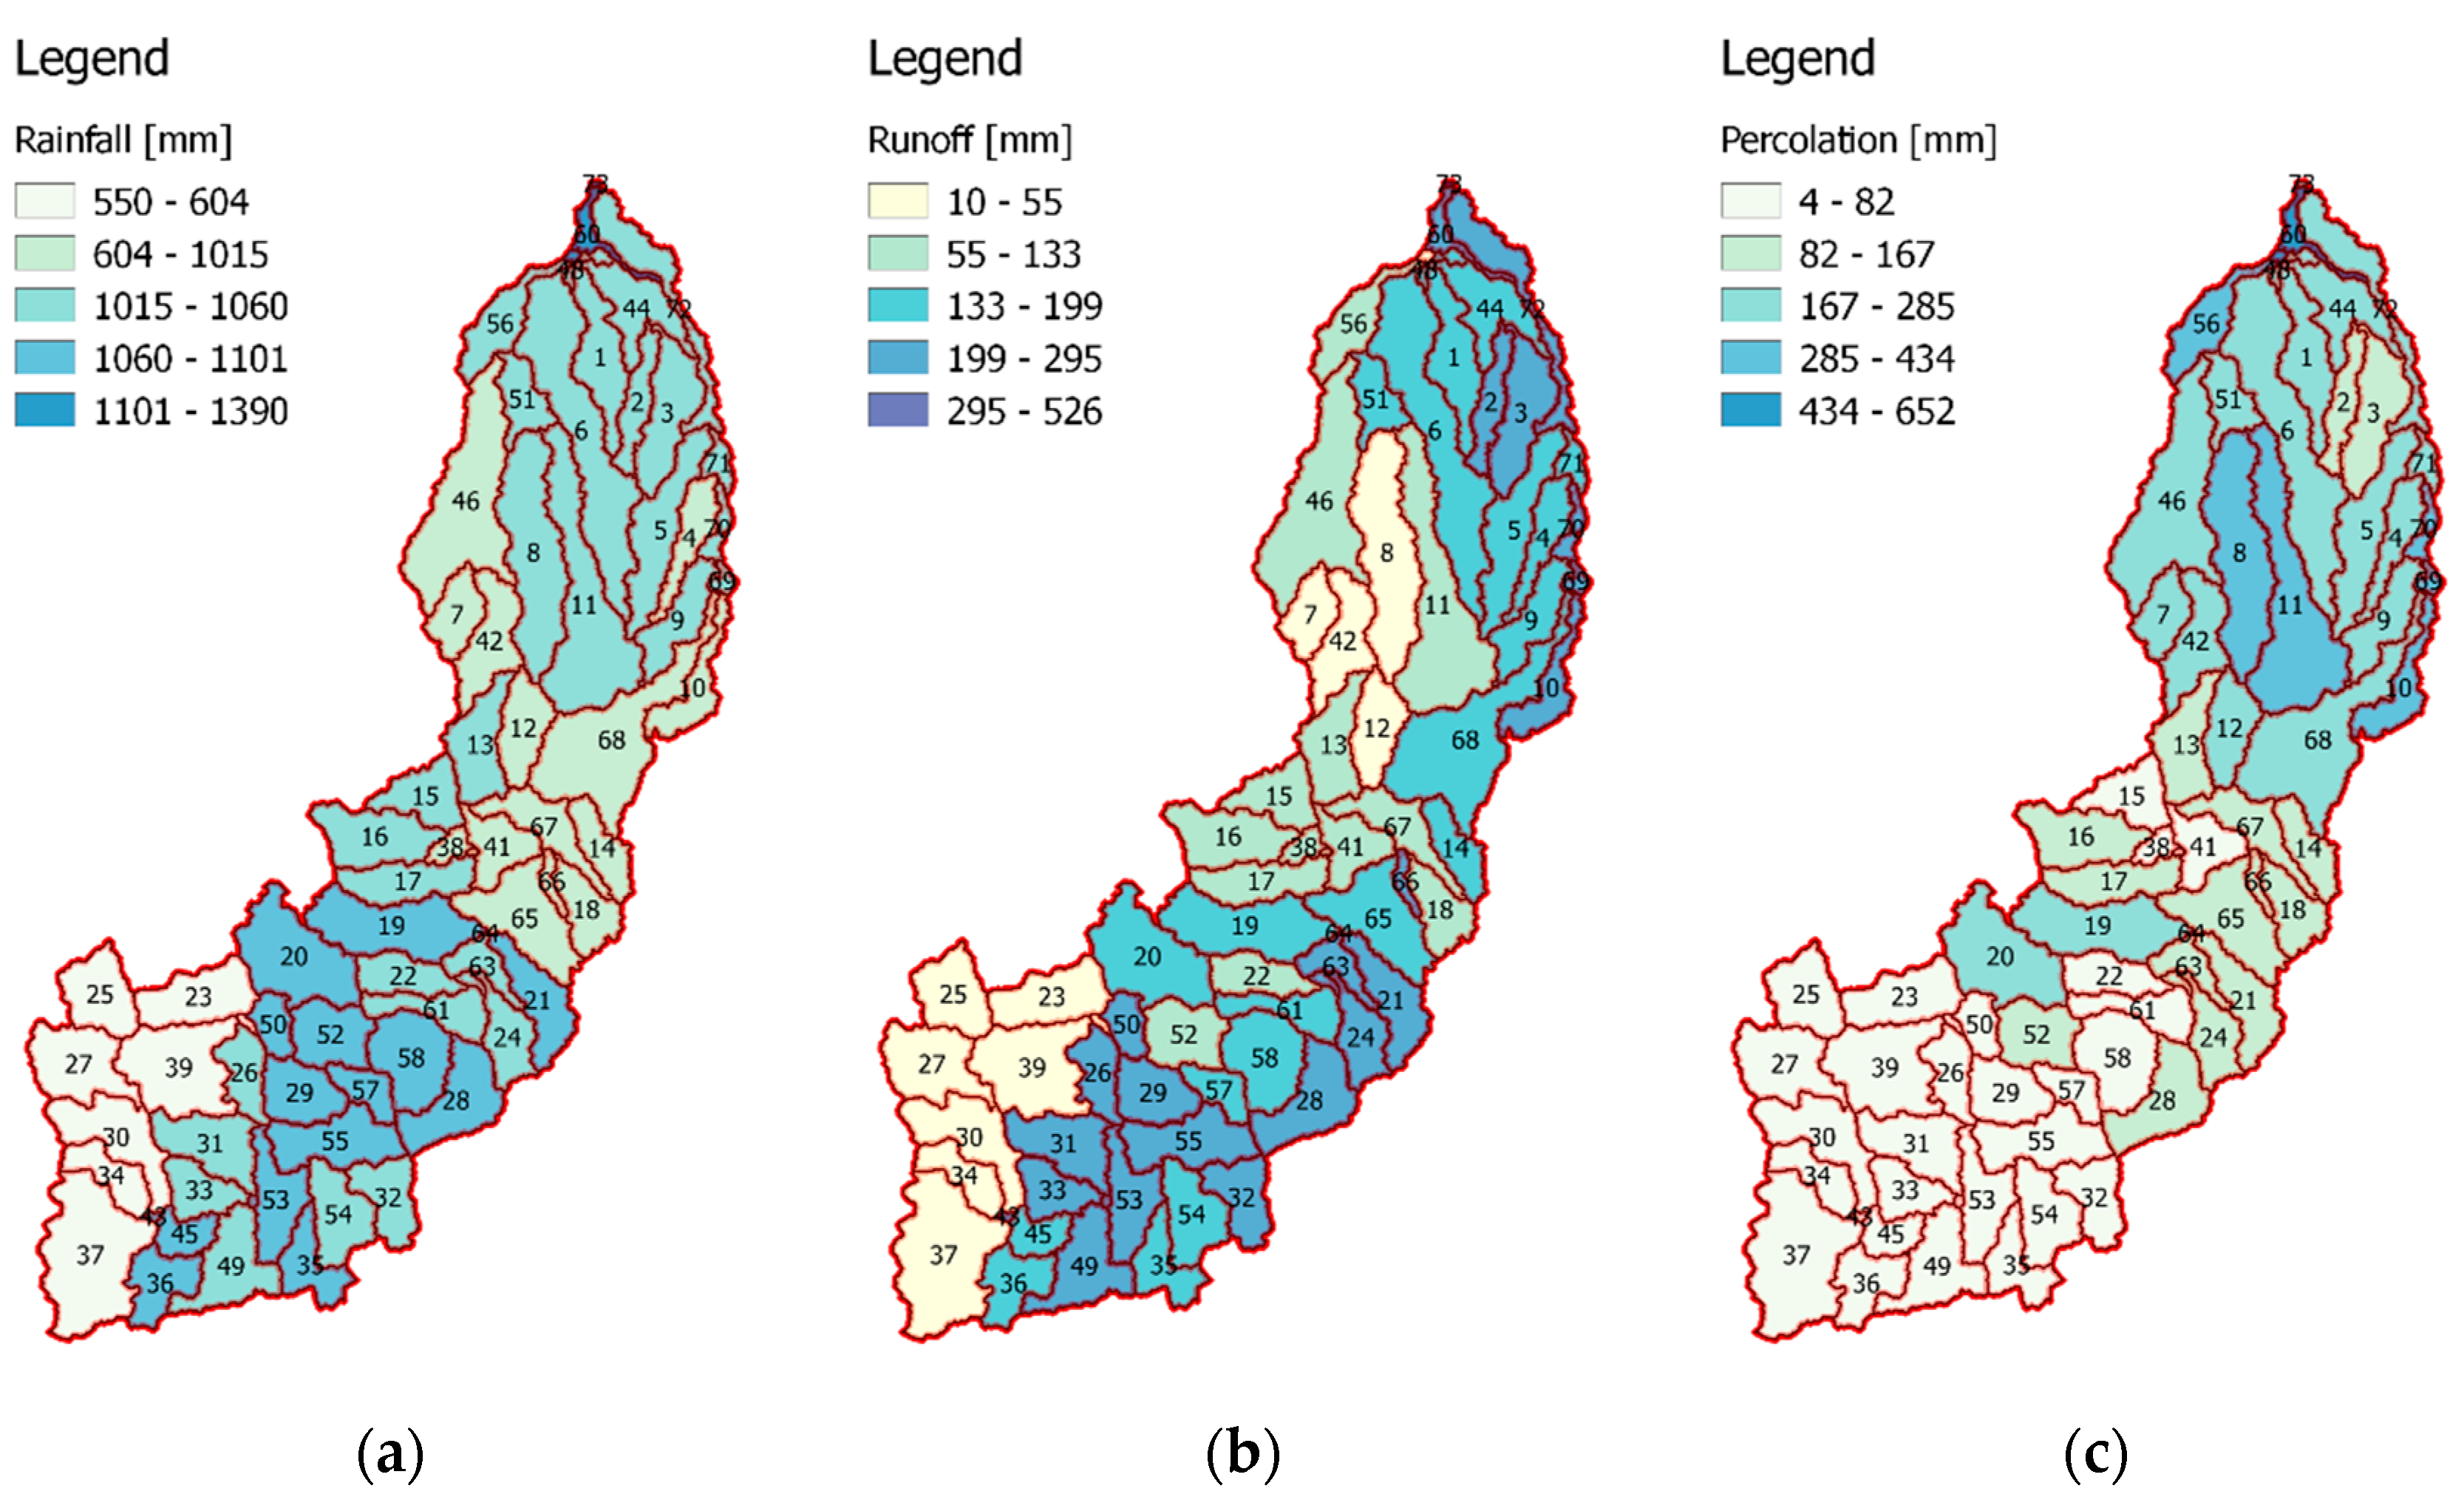
4.1. Results of Rio Pirai Watershed Model
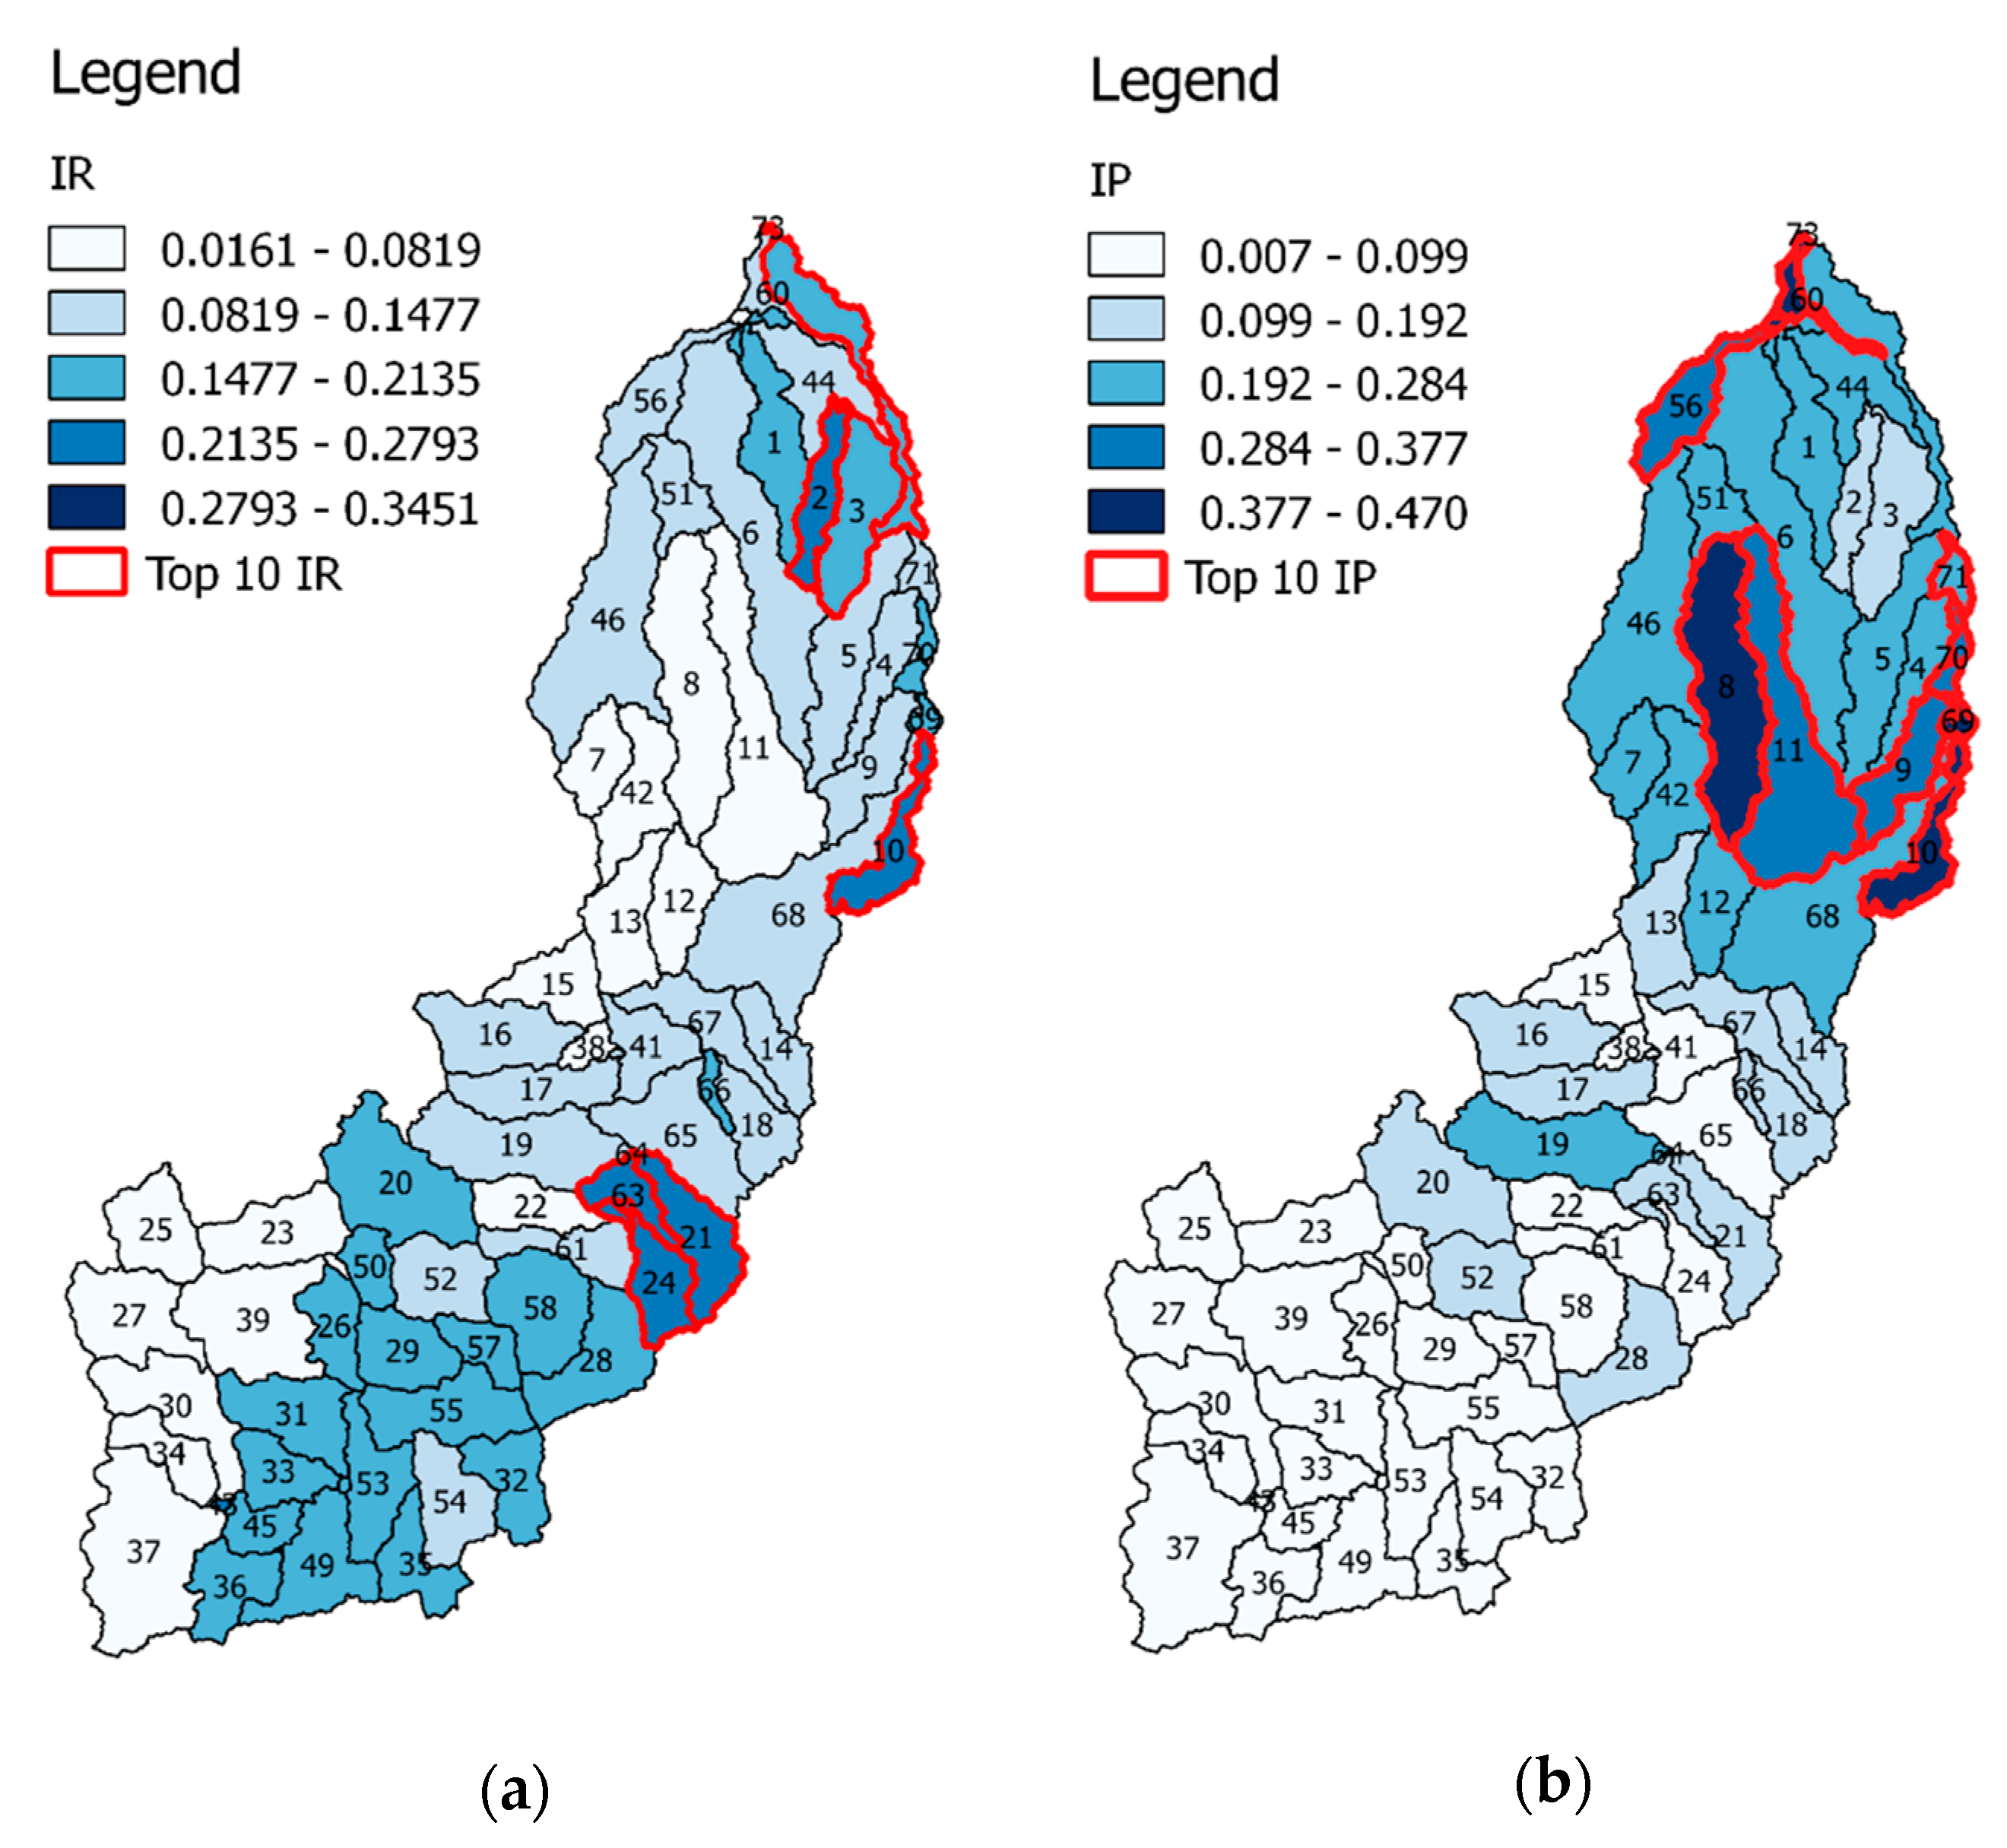
Spatial Distribution of Water Ecosystem Services
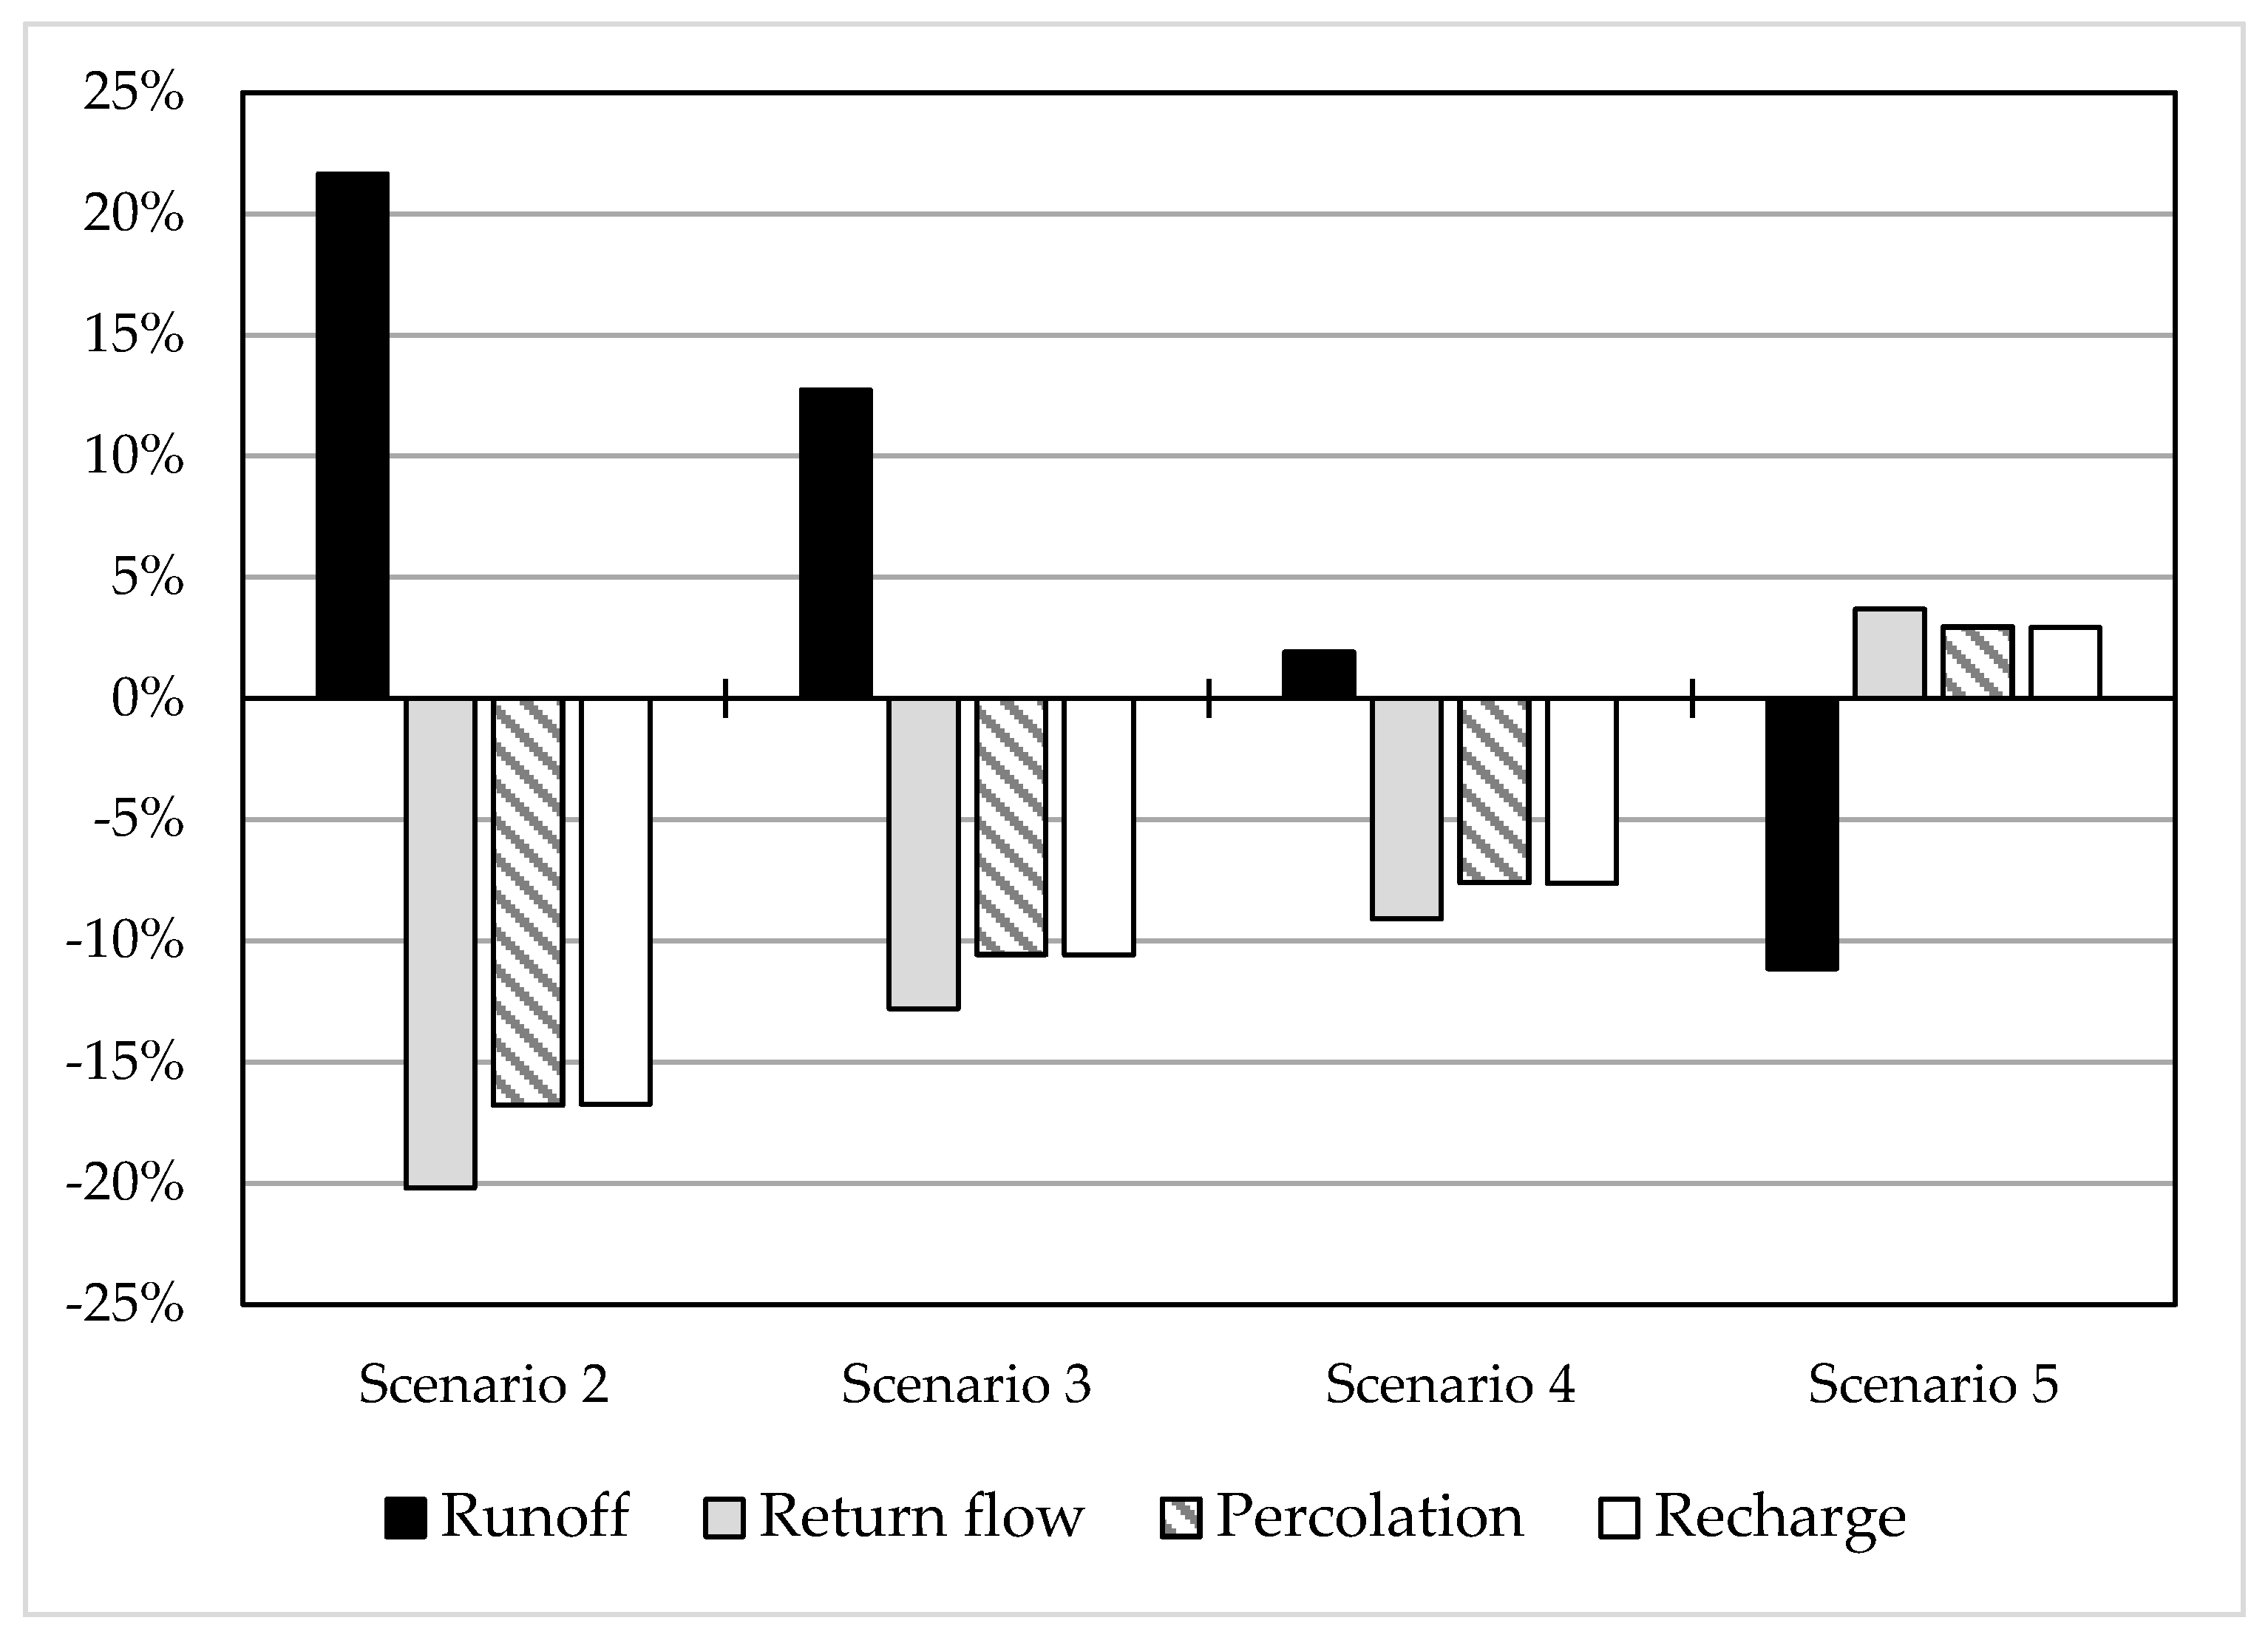
4.2. Analysis of Future Scenarios
5. Discussion
6. Aguacruz Project Outcomes
7. Conclusions
Acknowledgments
Author Contributions
Conflicts of Interest
References
- Salbitano, F.; Borelli, S.; Conigliaro, M.; Chen, Y. Guidelines on Urban and Peri-Urban Forestry; Food and Agriculture Organizations of the United Nations: Rome, Italy, 2016. [Google Scholar]
- Lee, Y.-C.; Ahern, J.; Yeh, C.-T. Ecosystem services in peri-urban landscapes: The effects of agricultural landscape change on ecosystem services in Taiwan’s western coastal plain. Landsc. Urban Plan. 2015, 139, 137–148. [Google Scholar] [CrossRef]
- Wu, J. Urban ecology and sustainability: The state-of-the-science and future directions. Landsc. Urban Plan. 2014, 125, 209–221. [Google Scholar] [CrossRef]
- Gill, S.E.; Handley, J.F.; Ennos, A.R.; Pauleit, S. Adapting cities for climate change: The role of the green infrastructure. Built Environ. 2007, 33, 115–133. [Google Scholar] [CrossRef]
- Benedict, M.A.; McMahon, E.T.; Fund, T.C. Green Infrastructures: Linking Landscapes and Communities; Island Press: Washington, DC, USA, 2006. [Google Scholar]
- Artmann, M.; Bastian, O.; Grunewald, K. Using the concepts of green infrastructure and ecosystem services to specify leitbilder for compact and green cities-The example of the landscape plan of Dresden (Germany). Sustainability 2017, 9, 198. [Google Scholar] [CrossRef]
- Scenarios Working Group. The Millennium Ecosystem Assessment Millennium Ecosystem Assessment. In Ecosystems and Human Well-Being: Scenarios. Findings of the Scenarios Working Group; Island Press: Washington, DC, USA, 2005. [Google Scholar]
- Pickett, S.T.A.; Cadenasso, M.L.; Childers, D.L.; McDonnell, M.J.; Zhou, W. Evolution and future of urban ecological science: Ecology in, of, and for the city. Ecosyst. Health Sustain. 2016, 2, e01229. [Google Scholar] [CrossRef]
- Giacomoni, M.H.; Kanta, L.; Zechman, E. Complex Adaptive Systems Approach to Simulate the Sustainability of Water Resources and Urbanization. J. Water Resour. Plan. Manag. 2013, 139, 554–564. [Google Scholar] [CrossRef]
- Postel, S.L.; Thompson, B.H., Jr. Watershed protection: Capturing the benefits of nature’s water supply services. Nat. Resour. Forum 2005, 29, 98–108. [Google Scholar] [CrossRef]
- Martin-Ortega, J.; Ferrier, R.; Gordon, I.; Kahn, S. Water Ecosystem Services: A Global Perspective; UNESCO Publishing: Paris, France, 2015; ISBN 9781107100374. [Google Scholar]
- Cuo, L.; Lettenmaier, D.P.; Alberti, M.; Richey, J.E. Effects of a century of land cover and climate change on the hydrology of the Puget Sound basin. Hydrol. Process. 2009, 23, 907–933. [Google Scholar] [CrossRef]
- D’Agostino, D.R.; Trisorio, L.G.; Lamaddalena, N.; Ragab, R. Assessing the results of scenarios of climate and land use changes on the hydrology of an Italian catchment: Modelling study. Hydrol. Process. 2010, 24, 2693–2704. [Google Scholar] [CrossRef]
- Mwangi, H.M.; Julich, S.; Patil, S.D.; McDonald, M.A.; Feger, K.-H. Modelling the impact of agroforestry on hydrology of Mara River Basin in East Africa. Hydrol. Process. 2016, 30, 3139–3155. [Google Scholar] [CrossRef]
- Rockström, J.; Falkenmark, M.; Allan, T.; Folke, C.; Gordon, L.; Jägerskog, A.; Kummu, M.; Lannerstad, M.; Meybeck, M.; Molden, D.; et al. The unfolding water drama in the Anthropocene: Towards a resilience-based perspective on water for global sustainability. Ecohydrology 2014, 7, 1249–1261. [Google Scholar] [CrossRef]
- Boggs, J.L.; Sun, G. Urbanization alters watershed hydrology in the Piedmont of North Carolina. Ecohydrology 2011, 4, 256–264. [Google Scholar] [CrossRef]
- Barbedo, J.; Miguez, M.; van der Horst, D.; Marins, M. Enhancing ecosystem services for flood mitigation: A conservation strategy for peri-urban landscapes? Ecol. Soc. 2014, 19, 54. [Google Scholar] [CrossRef]
- Aragón-Durand, F. Urbanisation and flood vulnerability in the peri-urban interface of Mexico City. Disasters 2007, 31, 477–494. [Google Scholar] [CrossRef] [PubMed]
- Núñez, D.; Nahuelhual, L.; Oyarzún, C. Forests and water: The value of native temperate forests in supplying water for human consumption. Ecol. Econ. 2006, 58, 606–616. [Google Scholar] [CrossRef]
- Ahn, K.-H.; Merwade, V. The effect of land cover change on duration and severity of high and low flows. Hydrol. Process. 2017, 31, 133–149. [Google Scholar] [CrossRef]
- Ellison, D.; Futter, M.N.; Bishop, K. On the forest cover-water yield debate: From demand-to supply-side thinking. Glob. Chang. Biol. 2012, 18, 806–820. [Google Scholar] [CrossRef]
- Proyecciones De La Población Por Sexo, Segun Municipios 2000–2010. Available online: http://www.ine.gob.bo/index.php/prensa/publicaciones/124-publicaciones/poblacion-y-demografia (accessed on 19 November 2011).
- Servicio Nacional de Áreas Protegidas. Deforestación y Regeneración de Bosques en Bolivia y en Sus Áreas Protegidas Nacionales Para Los Periodos 1990–2000 y 2000–2010; Servicio Nacional de Áreas Protegidas, Museo de Historia Natural Noel Kempff Mercado y Conservación Internacional—Bolivia: La Paz, Bolivia, 2013.
- Killeen, T.J.; Guerra, A.; Calzada, M.; Correa, L.; Calderon, V.; Soria, L.; Quezada, B.; Steininger, M.K. Total Historical Land-Use Change in Eastern Bolivia: Who, Where, When, and How Much? Ecol. Soc. 2008, 13, 36. [Google Scholar] [CrossRef]
- Skole, D.; Tucker, C. Tropical Deforestation and Habitat Fragmentation in the Amazon: Satellite Data from 1978 to 1988. Science 1993, 260, 1905. [Google Scholar] [CrossRef] [PubMed]
- Villazón, M.F.; Willems, P. Filling gaps and daily disaccumulation of precipitation data for rainfall-runoff model. In Proceedings of the 4th International Scientific Conference on Water Observation and Information Systems for Decision Support, Ohrid, Republic of Macedonia, 25–29 May 2010; Morell, M., Popovska, C., Morell, O., Stojov, V., Eds.; BALWOIS: Ohrid, Republic of Macedonia, 2010; pp. 1–9. [Google Scholar]
- Killeen, T.J.; Calderon, V.; Soria, L.; Quezada, B.; Steininger, M.K.; Harper, G.; Solórzano, L.A.; Tucker, C.J.; Solorzano, L.A. Thirty years of land-cover change in Bolivia. AMBIO J. Hum. Environ. 2007, 36, 600–606. [Google Scholar] [CrossRef]
- Mertens, B.; Kaimowitz, D.; Puntodewo, A.; Vanclay, J.; Mendez, P. Modeling deforestation at distinct geographic scales and time periods in Santa Cruz, Bolivia. Int. Reg. Sci. Rev. 2004, 27, 271–296. [Google Scholar] [CrossRef]
- Arnold, J.G.; Srinivasan, R.; Muttiah, R.S.; Williams, J.R. Large area hydrologic modeling and assessment part I: Model development1. JAWRA J. Am. Water Resour. Assoc. 1998, 34, 73–89. [Google Scholar] [CrossRef]
- Francesconi, W.; Srinivasan, R.; Pérez-Miñana, E.; Willcock, S.P.; Quintero, M. Using the Soil and Water Assessment Tool (SWAT) to model ecosystem services: A systematic review. J. Hydrol. 2016, 535, 625–636. [Google Scholar] [CrossRef]
- Worku, T.; Khare, D.; Tripathi, S.K. Modeling runoff–sediment response to land use/land cover changes using integrated GIS and SWAT model in the Beressa watershed. Environ. Earth Sci. 2017, 76, 550. [Google Scholar] [CrossRef]
- Wangpimool, W.; Pongput, K.; Sukvibool, C.; Sombatpanit, S.; Gassman, P.W. The effect of reforestation on stream flow in Upper Nan river basin using Soil and Water Assessment Tool (SWAT) model. Int. Soil Water Conserv. Res. 2013, 1, 53–63. [Google Scholar] [CrossRef]
- Neitsch, S.L.; Arnold, J.L.; Kiniry, J.R.; Srinavasan, R.; Wiliams, J.R. Soil and Water Assessment Tool Theoritical Documentation Version 2009; Texas A&M University: College Station, TX, USA, 2011. [Google Scholar]
- Climate Forecast System Reanalysis (CFSR). Available online: https://climatedataguide.ucar.edu/climate-data/climate-forecast-system-reanalysis-cfsr (accessed on 10 November 2017).
- WgnMaker. Available online: http://swat.tamu.edu/media/41583/wgen-excel.zip (accessed on 1 February 2017).
- NOAA Global Surface Summary of the Day—GSOD. Available online: https://data.noaa.gov/dataset/global-surface-summary-of-the-day-gsod (accessed on 1 June 2016).
- Niraula, R.; Meixner, T.; Norman, L.M. Determining the importance of model calibration for forecasting absolute/relative changes in streamflow from LULC and climate changes. J. Hydrol. 2015, 522, 439–451. [Google Scholar] [CrossRef]
- Feng, Y.; Burian, S.; Pomeroy, C. Potential of green infrastructure to restore predevelopment water budget of a semi-arid urban catchment. J. Hydrol. 2016, 542, 744–755. [Google Scholar] [CrossRef]
- Mekdaschi Studer, R.; Liniger, H. Water Harvesting: Guidelines to a Good Practice; Centre for Development and Environment (CDE): Bern, Switzerland, 2013. [Google Scholar]


| Data | Source | Description |
|---|---|---|
| Rainfall | Santa Cruz department meteorological archive | 6 stations |
| Temperature | Santa Cruz department meteorological archive | 3 stations |
| Wind speed | National Oceanic and Atmospheric Administration (NOAA) Global Surface Summary of the Day (GSOD) [36] | 1 station |
| Relative humidity | National Oceanic and Atmospheric Administration (NOAA) Global Surface Summary of the Day (GSOD) [36] | 1 station |
| Solar radiation | Climate Forecast System Reanalysis (CFSR) | Simulated data |
| Topography | Shuttle Radar Topography Mission (SRTM) | 90 m resolution |
| Soil map | Santa Cruz department | |
| Land use map | Noel Kempff Natural Museum [23] |
| Model Output | mm | Mm3 |
|---|---|---|
| Precipitation | 974.7 | 3854.9 |
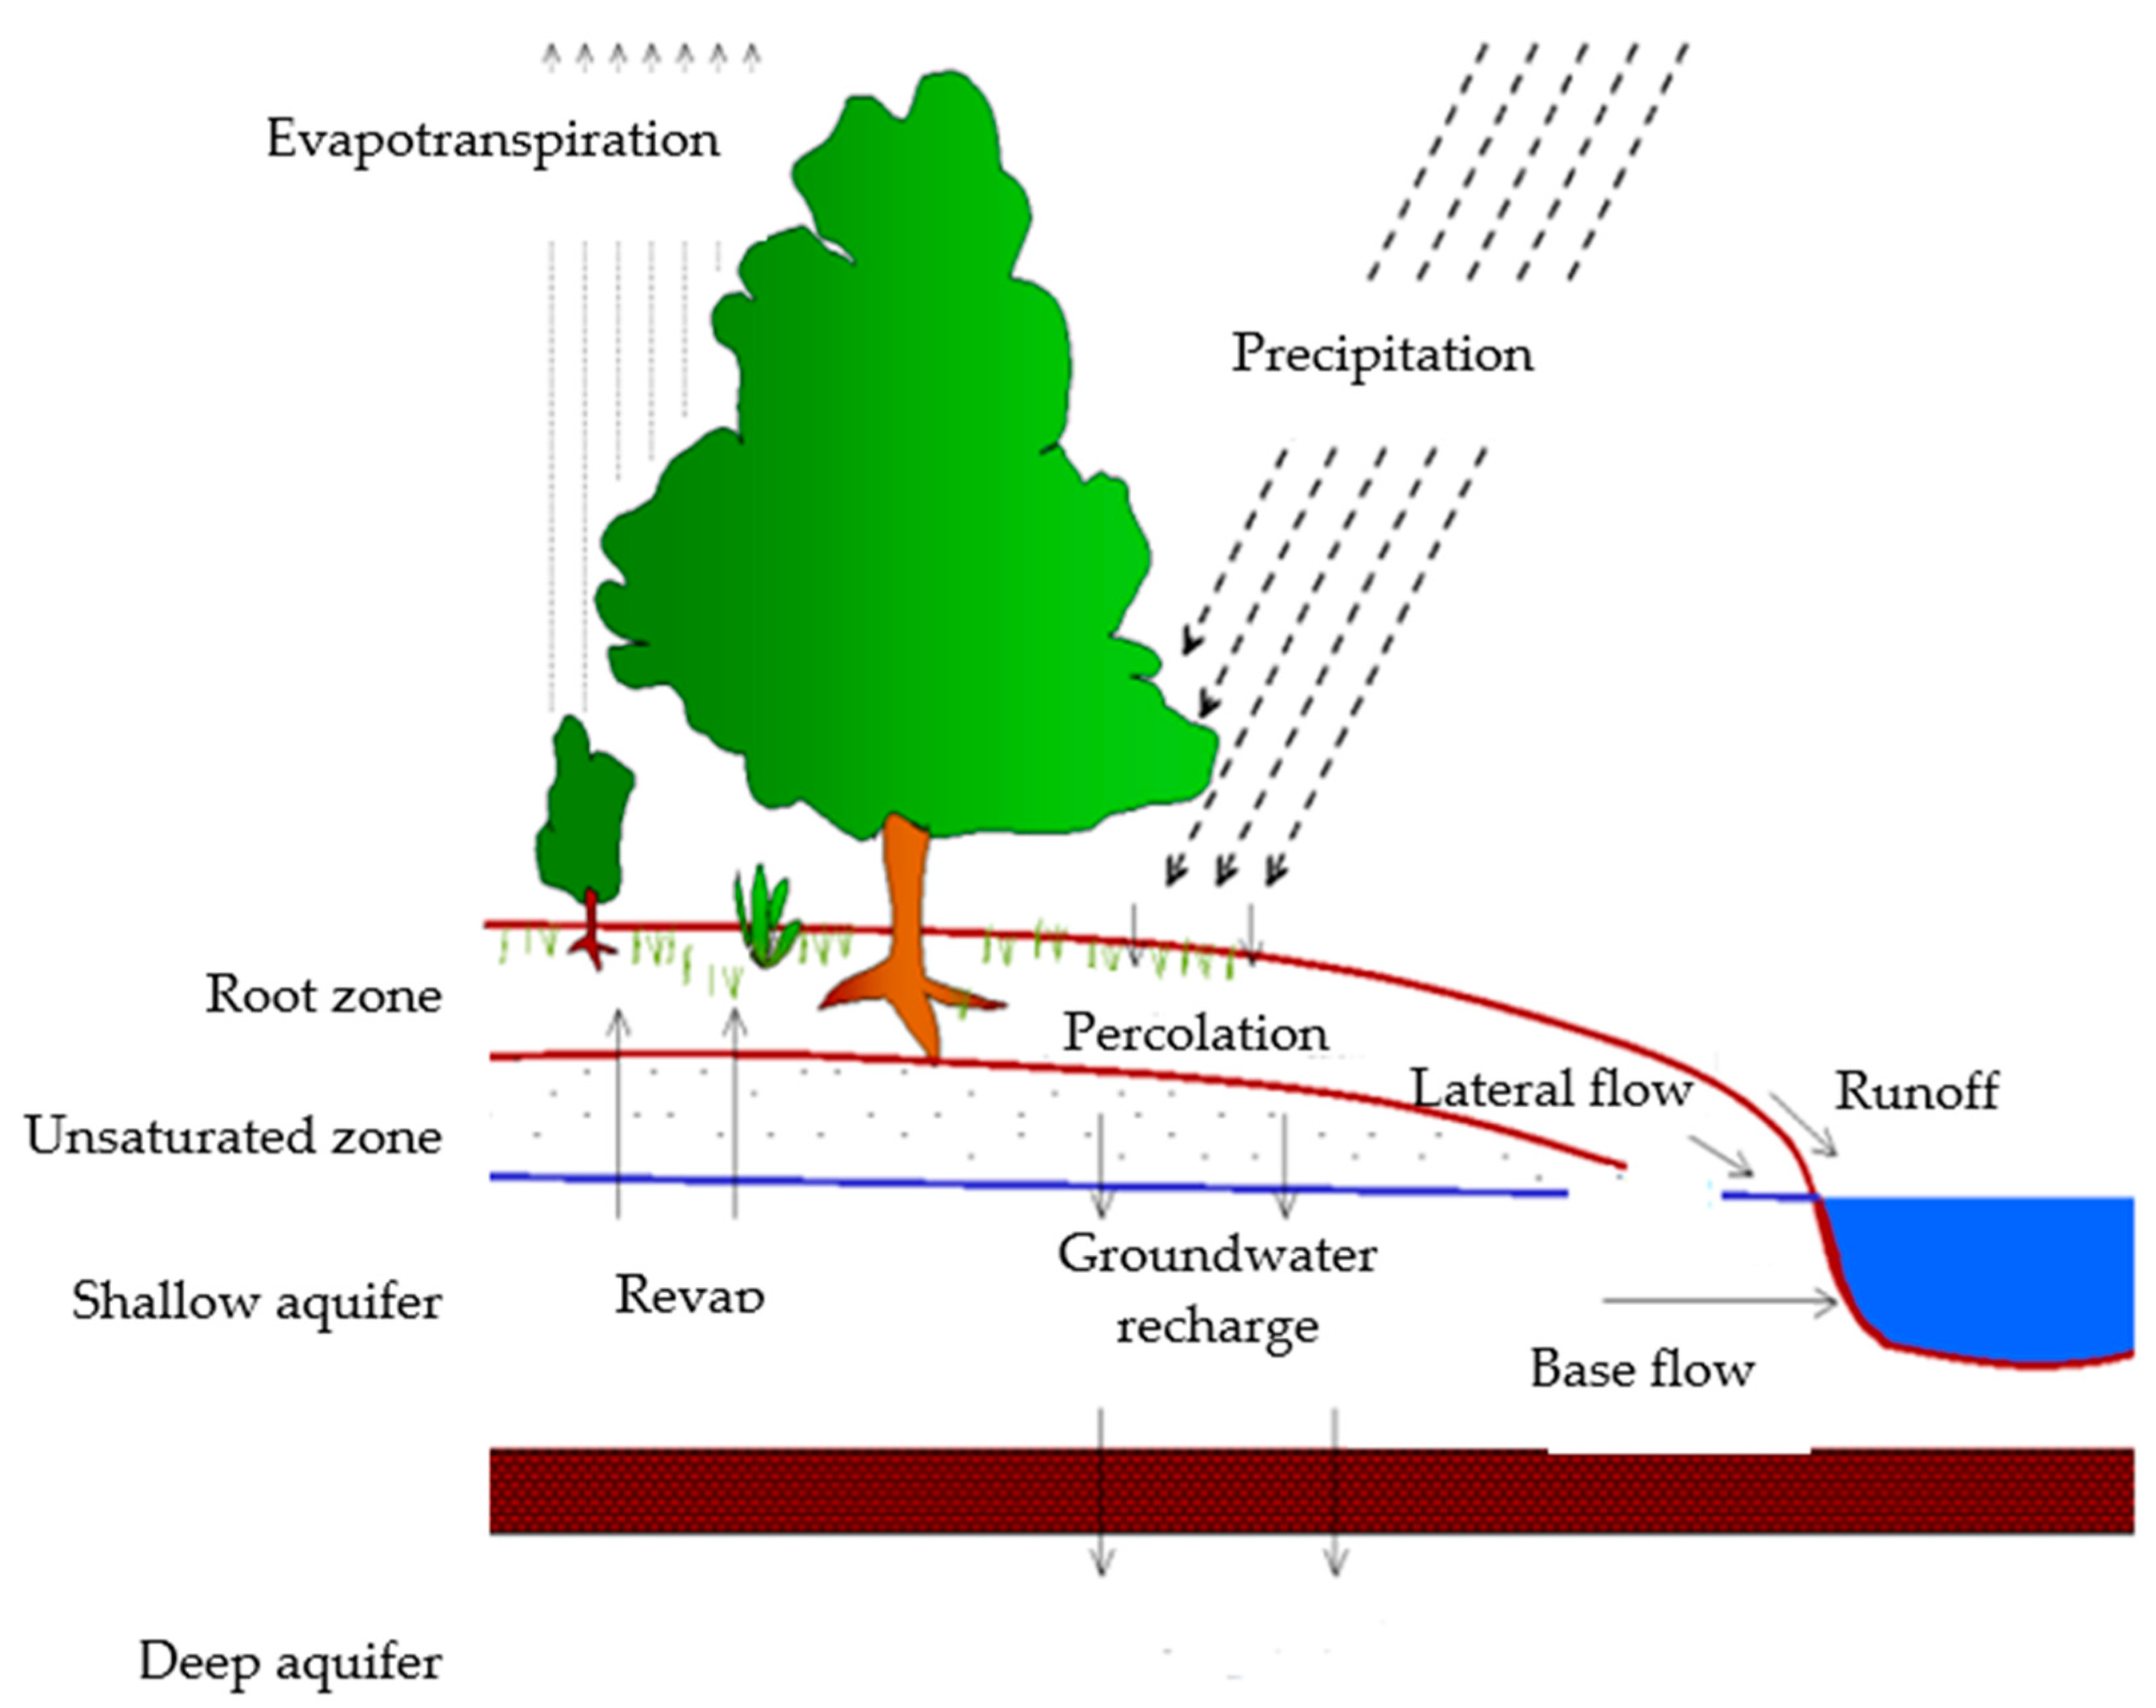
| Evapotranspiration | 550.7 | 2178.0 |
| Revap from shallow aquifer | 38.7 | 153.0 |
| Surface runoff | 131.8 | 521.4 |
| Lateral flow | 143.3 | 566.8 |
| Return flow | 110.0 | 435.0 |
| Percolation to shallow aquifer | 149.4 | 590.8 |
| Recharge to deep aquifer | 7.5 | 29.5 |
| Model Output | Scenario 2 | Scenario 3 | Scenario 4 | Scenario 5 | ||||
|---|---|---|---|---|---|---|---|---|
| mm | Mm3 | mm | Mm3 | mm | Mm3 | mm | Mm3 | |
| Precipitation | 974.7 | 3855 | 974.7 | 3855 | 974.7 | 3855 | 974.7 | 3855 |
| Evapotranspiration | 548.9 | 2171 | 550.7 | 2178 | 558.3 | 2208 | 559.4 | 2212 |
| Revap from shallow aquifer | 37.34 | 148 | 37.93 | 150 | 38.12 | 151 | 38.87 | 154 |
| Surface runoff | 160.37 | 634 | 148.64 | 588 | 134.37 | 531 | 117.15 | 463 |
| Lateral flow | 141.82 | 561 | 142.45 | 563 | 143.79 | 569 | 144.67 | 572 |
| Return flow | 87.78 | 347 | 95.92 | 379 | 99.97 | 395 | 114.03 | 451 |
| Percolation to shallow aquifer | 124.33 | 492 | 133.62 | 528 | 138.03 | 546 | 153.79 | 608 |
| Recharge to deep aquifer | 6.22 | 25 | 6.68 | 26 | 6.9 | 27 | 7.69 | 30 |
© 2017 by the authors. Licensee MDPI, Basel, Switzerland. This article is an open access article distributed under the terms and conditions of the Creative Commons Attribution (CC BY) license (http://creativecommons.org/licenses/by/4.0/).
Share and Cite
Castelli, G.; Foderi, C.; Guzman, B.H.; Ossoli, L.; Kempff, Y.; Bresci, E.; Salbitano, F. Planting Waterscapes: Green Infrastructures, Landscape and Hydrological Modeling for the Future of Santa Cruz de la Sierra, Bolivia. Forests 2017, 8, 437. https://doi.org/10.3390/f8110437
Castelli G, Foderi C, Guzman BH, Ossoli L, Kempff Y, Bresci E, Salbitano F. Planting Waterscapes: Green Infrastructures, Landscape and Hydrological Modeling for the Future of Santa Cruz de la Sierra, Bolivia. Forests. 2017; 8(11):437. https://doi.org/10.3390/f8110437
Chicago/Turabian StyleCastelli, Giulio, Cristiano Foderi, Boris Hinojosa Guzman, Lorenzo Ossoli, Yandery Kempff, Elena Bresci, and Fabio Salbitano. 2017. "Planting Waterscapes: Green Infrastructures, Landscape and Hydrological Modeling for the Future of Santa Cruz de la Sierra, Bolivia" Forests 8, no. 11: 437. https://doi.org/10.3390/f8110437