Assessment of Flammability of Moroccan Forest Fuels: New Approach to Estimate the Flammability Index
by
 ,
,
Salaheddine Essaghi
1,2,* ,
,
M’hamed Hachmi
2,
Mohammed Yessef
1,
Mohammed Dehhaoui
1 and
Fahed El Amarty
2 1
Institut Agronomique et Vétérinaire Hassan II, BP 6202, Rabat-Instituts, 10101 Rabat, Morocco
2
Ecole Nationale Forestière d’Ingénieurs, BP 511, Tabriquet, 11015 Salé, Morocco
*
Author to whom correspondence should be addressed.
Forests 2017, 8(11), 443; https://doi.org/10.3390/f8110443
Submission received: 1 September 2017
/
Revised: 8 November 2017
/
Accepted: 14 November 2017
/
Published: 15 November 2017
(This article belongs to the Section Forest Ecology and Management)
Abstract
:A new flammability index (FI) was developed, which integrated two parameters that are highly correlated to fuel moisture content (MC). These parameters are time-to-ignition and flame height. The newly obtained FI-values belong to the variation interval of {0; 20}. In addition to the six flammability classes defined in the earlier work, a seventh class (FI > 16.5) was proposed to include fuel species with a high content of volatile flammable-compounds. Flammability testing and MC measurement were performed at a range of MC obtained through a drying process of samples. As a result, FI was statistically highly correlated with MC for all 13 Moroccan forest fuels tested in this study. Following this, linear regression equations were established to predict the FI-value as a function of MC. Therefore, the classification of flammability would depend on the species as well as the MC-value of the samples and the season in which they were collected.
1. Introduction
The assessment of the fuel hazard and fire risk is now more than ever in demand due to the severe climatic conditions. Furthermore, this has been combined with the highly flammable nature of Mediterranean species, which favour bushfires [1,2,3]. Such fires are exacerbated by litter and shrub abundance, which are known for their propensity for recurrent fire besides the importance of fire for plant reproduction [3]. Reducing the fuel hazard requires a realistic flammability ranking of forest fuels [2,4,5,6], which would result in the rigorous selection of fire-resistant species appropriate for afforestation as part of a forest fire management plan [2,4,6,7,8].
Fuel characterization is required to assess flammability, as the latter is linked to the properties of fuel elements and complexes [9]. Few studies have tried to assess flammability using field-scale fire experiments [10] due to authorization, safety and cost constraints [9,11,12], while the most studies performed standardized laboratory-scale flammability measurements [2,5,7,12,13,14,15,16,17,18,19,20,21], including some recent studies that still use the method of Valette [2,7,12,15]. Some of these methods have the disadvantage of using ground samples (do not take into account the fuel structure) and are criticized for combustion tests under conditions different from the natural conditions [1]. Other authors measured plant flammability at the shoot-level following the method of Pérez-Harguindeguy et al. [22] to preserve the architecture of the plant shoots [23]. Neither bulk density nor continuity of the fuel were taken into account in this method. In addition, this method shows its limitations when scaling beyond the experimental setting [23]. In contrast, the individual contribution of the flammability of each species to fire behaviour is an important input variable that should be integrated into a fire behaviour prediction system under development in the image of BehavePlus [24] and the Forest Flammability Model [25]. This is all the more important since modelling the behaviour of fire can help compensate for deficiencies due to inadequate weighting of fuel characteristics and the interactions involved [9]. Besides other fuel and site characteristics (input variables), such as the surface area-to-volume ratio, bulk density, fuel load per size class as well as vertical and horizontal continuity of different layers, the individual species flammability would improve the accuracy and effectiveness of such systems. The individual species flammability assessment is particularly useful since the ignitability of individual leaves was correlated with several parameters of flammability in fuel beds, including the rate of fire spread [26].
In general, flammability represents the ability of plant biomass to burn [27,28]. In practice, individual species flammability is broadly comprised of three components: ignitability, combustibility and sustainability [29]. Ignitability is represented by time-to-ignition (TI) [16,30], which is widely used in plant flammability ranking (e.g., [7,16,31,32]). In terms of a fire test, combustibility is examined through flame height (FH) [1,31,33]. This FH parameter also gives insight into a fire propagation rating [14]. Sustainability is assessed using the duration of combustion (DC) [1,14,17,34].
Moisture content (MC) is a key factor influencing flammability (e.g., [5,17,35,36]), acting both physically on the plant by controlling the thermal capacity of tissues and chemically through the adjustment of the combustion process [1,37]. Therefore, flammability variation within species depends on fuel water content [1,35,38]. Hence, there is the need for a flammability database as a function of MC within the same species [26], which can be expressed in practice through modelling functions of the relation flammability against MC.
Valette [7] developed a flammability index (FI) that took into account only TI and ignition frequency combined to derive the FI-values. FI was introduced because the flammability determination is not easy and can be appreciated only in a general sense instead of in a very precise scientific way [7]. However, considering that the method of Valette [7] had some weaknesses, in particular the fact that it only delivers qualitative FI-values in addition to its negligence of flammability parameters of major importance, Hachmi et al. [14] proposed a revision of the aforementioned method by trying to compensate for the shortcomings observed. Hachmi et al. [14] suggested an empirical formula that estimates FI-values based on a continuous quantitative notation scale system. FI was calculated based on three parameters measured during fire tests (TI, DC and FH) as shown in Equation (1):
where TI and DC are in seconds and FH is in centimetres. FI combines the capability of fine fuels to ignite when given a heat source [12] to spread fire to the adjacent fuels and to sustain the combustion [14]. Ranking these species according to FI as well as integrating FI data into a fire behaviour prediction system in order to improve its accuracy and map the high-risk areas based on vegetation maps would help in forest fire management as these would facilitate the selection of the appropriate afforestation species for mitigating fuel hazards [7,8,17].
However, a weak correlation between MC and the average DC was observed [14], while the correlations between MC and the average TI or between MC and the average FH were both strong [14]. In addition, by using Equation (1), high DC-values resulted in outlier FI-values classifying all species as extremely flammable regardless of their TI- and FH-values. Therefore, the objective of this paper is to revise this FI-formula in order to address the correlation weakness observed between MC and the average DC as well as to assess the relationship FI compared to the MC characteristic of a range of Moroccan forest fuel species.
2. Materials and Methods
2.1. Study Sites
Five sites were located throughout north-western Morocco (western Rif Mountains). Each site had experienced no fires for at least three years and contained a suite of canopy and understory species characterizing the respective ecosystems. All study sites are located on forestlands managed by the Moroccan High Commission for Forests and included forests of Larache, Ahl Srif, Souk L’Qolla (Larache province), Dardara (Chefchaouen province) and Bellota (Ouezzane province) (Table 1). Sites were chosen at various altitudes starting at the cork oak forests (Atlantic coast) to pine forests of Chefchaouen with an aim of covering the most important tree and shrub species.
2.2. Species Selection, Sampling and Modus Operandi
The tree species studied were Pinus pinea (stone pine), Pinus pinaster (maritime pine), Pinus canariensis (Canary Island pine), Ceratonia siliqua (carob tree), Quercus suber (cork oak) and Quercus coccifera (kermes oak). The shrub species were Arbutus unedo (strawberry tree), Cistus albidus (grey-leaved cistus), Cistus crispus (wrinkle-leaved rockrose), Cistus monspeliensis (narrow-leaved cistus), Cistus salviifolius (sage-leaved rockrose), Pistacia lentiscus (mastic tree) and Viburnum tinus (laurustinus) (Table 1).
The canopy and understory species were chosen based on their abundance in the forest ecosystems of Western Rif (Table 1). The samples were collected from the sites listed in Table 1 in locations with different solar irradiances in order to mitigate the possible effect of solar irradiance intensity. For each species, approximately 600 g of samples of terminal twigs with their leaves or needles were collected in January 2016 from 3–4 mature plants. They were immediately placed into sealed plastic bags and transported in a thermally insulated box with ice as shown in the method of Hachmi et al. [14]. Once in the laboratory, flammability and MC tests were immediately performed for some of the freshly collected samples of each species. The remaining samples were left for drying under laboratory ambient conditions in a view of measuring the FI- and MC-values at regular intervals as the drying took place. However, to reach MC-values of less than 20%, samples were placed in an oven at 60 °C for varying times according to the targeted MC levels.
To calculate the MC-value, a sample of 2 g was weighed before and after oven-drying at 60 °C for 72 h [14,39]. The average MC was computed based on three replicates. MC was expressed as follows [40,41]:
All weights were measured using a Mettler PE 600 balance with an accuracy of 0.01 g.
To determine the average FI-value corresponding to each MC level and each species, 36 flammability tests were performed according to three replicates. Indeed, according to Hachmi et al. [14], the 12 tests per replicate provided significantly similar results as the method consisting of 50 tests per replicate suggested by Valette [7]. For each species, a quantity of 42 g of vegetation material was separated into two sets. The first set was comprised of 36 samples of 1 g each. Each sample consisted of terminal twigs with their leaves or needles, which were put on the well-heated ceramic surface of the epiradiator. TI and DC were measured (in seconds) using a stopwatch and maximum FH (in centimetres) was read with a vertical graduated ruler [14].
The second set, consisting of three samples of 2 g each prepared simultaneously with fire tests, was used to calculate the MC-values in order to adjust flammability for the effect of MC. For each MC level, the same procedure was repeated as explained above.
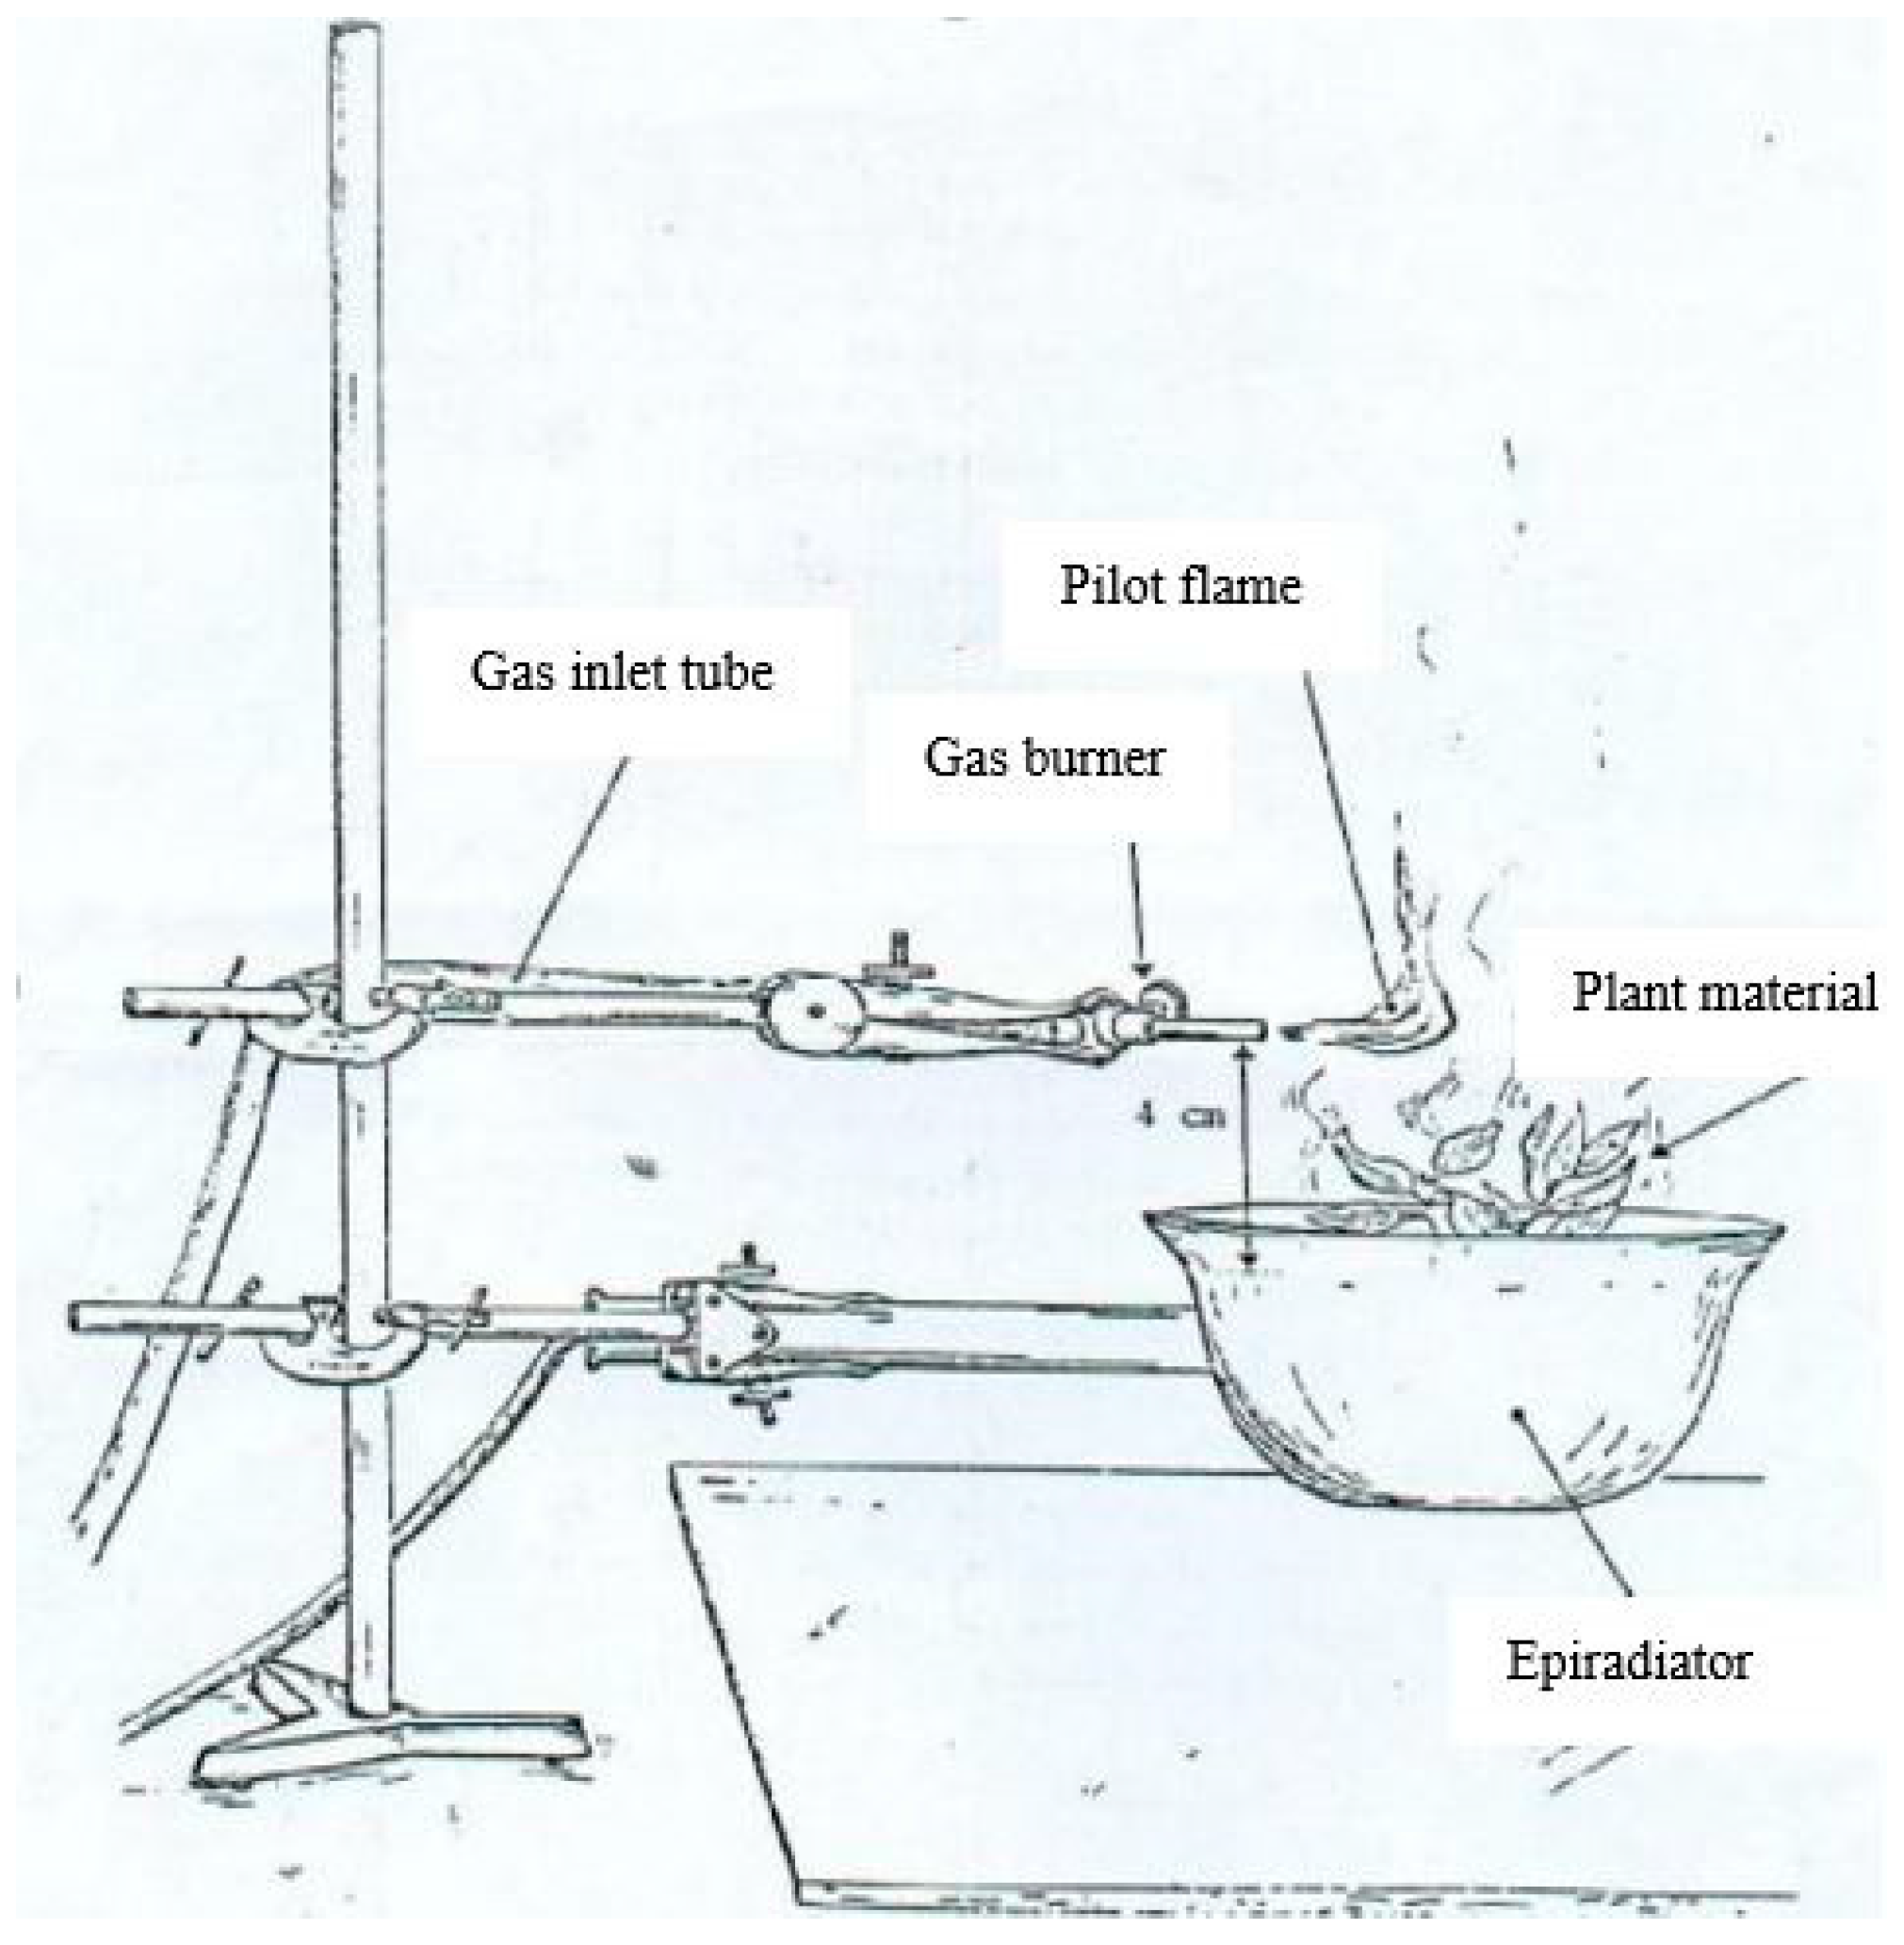
Fire tests were carried out using a Quartzalliance epiradiator 500 W 534 Rc 2 (Figure 1). The radiant disk of the epiradiator has a diameter of 10 cm and radiates 7 W/cm2 (220 V; 50 Hz). The radiant disk temperature is about 600 °C. A pilot flame is located 4 cm above the centre of the disk, while the epiradiator and pilot flame are under a hood to prevent any air current to disturb inflammation process [42].
2.3. Statistical Analysis
Species data were analysed in IBM Statistical Package for Social Sciences (SPSS version 21) (SPSS Inc., Chicago, IL, USA). Pearson’s correlation matrix was used to determine the correlations between each flammability parameter and moisture content. Linear and non-linear regression models were tested to find the model functions that had the best fit for FI and MC.
3. Results
The average values for TI, DC and FH are presented in Figure 2. Overall, for all the species examined, FH values decreased substantially when MC increased, whereas TI increased with MC. However, DC-values were only slightly affected by MC variation (Figure 2). TI average values varied from 0.9 s for Q. coccifera to 9.9 s for V. tinus. DC average values varied from 35.0 s (P. canariensis) to 152.0 s (P. pinaster). FH mean values varied from 0.3 cm for C. monspeliensis to 29.1 cm for P. lentiscus. Regarding Cistus species, flammability parameters varied from 1.2 s (C. monspeliensis), 61.3 s (C. monspeliensis) and 0.3 cm (C. monspeliensis) to 8.4 s (C. monspeliensis), 129.1 s (C. crispus) and 25.2 cm (C. monspeliensis), respectively for TI, DC and FH. Therefore, Cistus monspeliensis showed the highest scope of fluctuations of flammability parameters among Cistus species. Among Pinus species, TI moved from 1.1 s (P. canariensis) to 7.1 s (P. pinea), DC from 35.0 s (P. canariensis) to 152.0 s (P. pinaster) and FH from 3.8 cm (P. pinea) to 26.3 cm (P. pinea). Quercus species had close variation intervals of TI (0.9–7.4 s for Q. coccifera; 1.4–8.1 s for Q. suber), DC (40.3–51.6 s for Q. coccifera; 43.1–56.4 s for Q. suber) and FH (13.9–28.4 cm for Q. coccifera; 12.8–27.2 cm for Q. suber).
Pearson’s correlation tests performed for the interrelationships between each of the flammability parameters (TI, DC and FH) and MC are shown in Table 2. The parameters TI and FH were highly correlated to MC, while the correlation between DC and MC was relatively weak (r = 0.37). Close r-values were recorded by Hachmi et al. [14] for the same interrelationships mentioned above, except for the correlation coefficient between DC and MC, which was found to be weak but negative (r = −0.34). This was also supported by our results shown in Figure 2, which revealed that DC was fairly constant during the drying process, while TI and FH has substantially responded to MC change. Indeed, MC significantly affects TI [1,5] as well as both TI and flame characteristics, including FH [15,36]. However, Equation (1) should be questioned due to the important weight of DC as a numerator term in the FI equation expression despite having a low correlation coefficient with MC parameters. Furthermore, according to Table 2, DC was positively correlated with MC implying a negative correlation between DC and FI in contrast with the assumptions of the equation of Hachmi et al. [14]. The latter pointed out that FI was characterized by the ratio DC/TI since DC was negatively correlated with MC. The contrast between our findings and those of Hachmi et al. [14] regarding the correlation between DC and MC can be due to the differences noticed in the initial moisture contents of the respective samples collected and probably could also be attributed to the laboratory ambient climatic conditions. Thus, since an accurate and reliable FI value can only be achieved in association with MC as stated in Hachmi et al. [14] and Grootemaat et al. [26], FI calculation parameters should all be strongly correlated with MC. Moreover, the maximum expected FI-value (calculated based on Equation (1)) corresponded to extreme fire test conditions, which was namely a maximum DC-value as noted in Hachmi et al. [14] (DC = 26 s) with minimum TI = 0 s and maximum FH = 40 cm. This resulted in an outlier (FI = 7.19), which considerably exceeded the upper limit of the FI variation interval ({0; 5.5}) predefined by the FI assumption [14]. This is in contrast with the FI assumption of Hachmi et al. [14], which specified that the flammability index should be bounded within a predetermined interval. This situation cannot be acceptable since it would undermine the interpretation of the FI-values. Therefore, high values of DC would lead to a misinterpretation of the resulting FI-values among the extremely flammable fuels regardless of the values of the other parameters (TI and FH). All these weaknesses are calling into question the very existence of DC in Equation (1). Therefore, we suggest a new FI formula in line with our findings where DC would be thus removed.
The initial assumptions of the FI expression state that FI should vary in the bounded interval of {0; 6.5}, which was inspired by the flammability variation range of Valette [7]. Indeed, in order to classify the species according to their flammability, we have to attribute the corresponding flammability class to each FI-value variation range. Therefore, FI-values need to be bounded in a limited interval where each range of FI-values would refer to one flammability class within a well-known flammability scale. If the FI range is not limited, the classification scale would no longer be useful. FH should also change from 0 to 40 cm and TI from 0 to 60 s. The negative test is declared (FI = 0) when TI = 60 s and FH = 0 cm. These assumptions fit the collected data precisely. The proposed FI Equation is therefore:
The terms regarding FH remain the same as shown in the equation above proposed by Hachmi et al. [14]. Thus, to maintain the FI range considered by Valette [7], FH is raised in the exponential ranges to mitigate its effect on FI, since FH represents only the pyrolysis (pre-ignition step). The latter corresponds to the maximum gas released and varies among species depending on their chemical composition. TI would differentiate between the flammability of species having same FH values.
In the denominator, 12.5 was chosen since it represented the inferior limit of TI variation range according to Valette [7]. Indeed, using Equation (2) under the initial assumptions, FI would reach its maximum value (6.16) at the extremes of TI = 0 s and FH = 40 cm. Moreover, at the extremes of TI = 60 s and FH = 0 cm, FI has a value of 0, which represents the negative test (no ignition even after 60 s). Using the proposed new equation, the initial assumptions are all verified. Therefore, Equation (2) is the FI expression that best fits the data. Equation (2) allows for maintenance of FI-values inside the variation range of {0; 6.5}. However, this would be more appropriate to introduce a rating out of 20 points. Therefore, Equation (2) should be multiplied by 3 as follows:
Using Equation (3), the initial assumptions are all verified. At the extremes of TI = 60 s and FH = 0 cm, FI is 0 (negative test). In contrast, at the extremes of TI = 0 s and FH = 40 cm, FI would reach its maximum value of 18.48. Along the lines of Valette [7] and Hachmi et al. [14], a FI-value classification scale according to Equation (3) would comprise of seven flammability classes: least flammable (FI < 1.5), less flammable (1.5 ≤ FI < 4.5), moderately flammable (4.5 ≤ FI < 7.5), flammable (7.5 ≤ FI < 10.5), highly flammable (10.5 ≤ FI < 13.5), most flammable (13.5 ≤ FI < 16.5) and extremely flammable (FI ≥ 16.5). The latter flammability class is a theoretical class reserved for forest fuels with a high content of flammable essential oils, which would probably have a FH of more than 40 cm.
The results of the analysis of variance between the method of Hachmi et al. [14] (Equation (1)) and our FI calculation method (Equation (3)) are presented in Table 3. The F-test revealed a very highly significant difference between the two methods.
For fresh (freshly collected) and dried (retrieved at the end of the drying process) samples, the average values of FI per species calculated based on Equation (3) and their respective average moisture contents are shown in Table 4. Average FI values were close to each other and varied from 10.98 (C. monspeliensis) to 13.86 (Q. coccifera). For Cistus species, the average FI values were disparate and changed from 10.98 (C. monspeliensis) to 13.00 (C. albidus), whereas for Quercus species, FI average values were very close (13.04 and 13.86 respectively for Q. suber and Q. coccifera). Pinus pinaster indicated the highest average FI value among pine species (13.14), while P. pinea samples indicated the lowest average FI value (11.87).
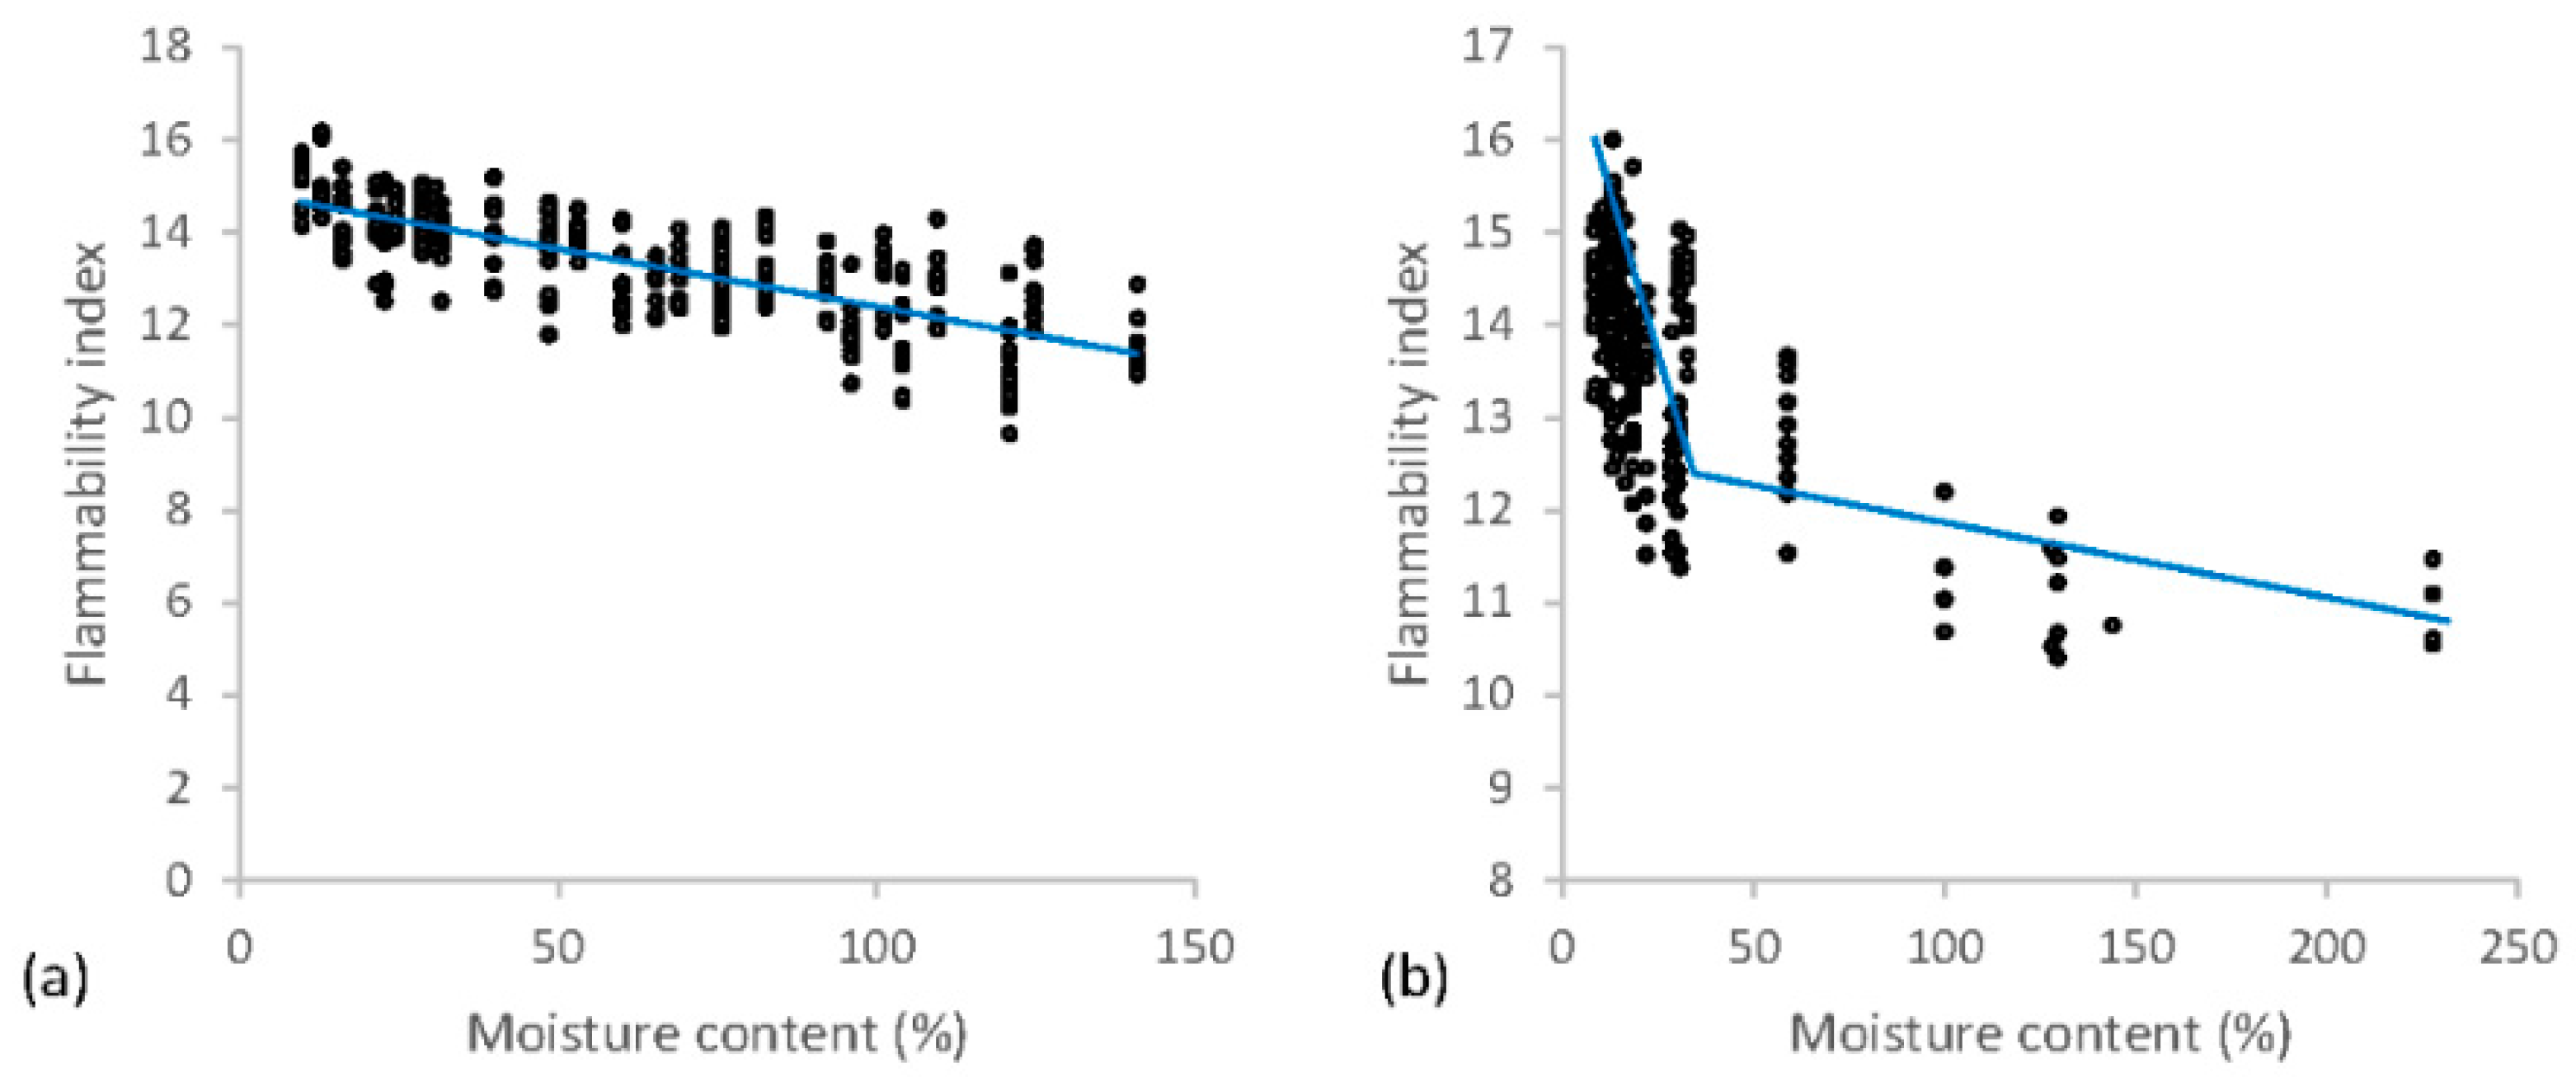
The Pearson’s correlation coefficients calculated for the relationship FI–MC are presented in Table 5. For all species examined, FI is highly correlated with MC. The variation of FI according to MC and corresponding trend curves are presented in Figure 3, which shows two different scenarios of FI change. FI increased as MC decreased (Table 5; Figure 3), which is when the samples dried.
Overall, FI rose linearly on a continuous basis when MC decreased during the drying process, except in certain cases where FI has evolved differently in two stages (Figure 3b). First, FI remained stable and increased slowly, but upon reaching a minimum threshold of MC during the drying process, FI rose strikingly. Two scenarios can be thus highlighted as shown in Figure 3:
- (1)
- Species for which FI increased linearly when MC decreased, such as A. unedo, C. siliqua, C. crispus, P. pinaster, P. pinea, P. lentiscus, Q. coccifera, Q. suber and V. tinus (Figure 3a).
- (2)
- Species showing a two-stage FI change according to MC. First, FI remained relatively stable until MC dropped below a minimum threshold. At this time, FI began to rise strikingly and linearly as the samples dried. This is the case with C. albidus, C. monspeliensis, C. salviifolius and P. canariensis (Figure 3b).
The regression models that had the best fit with the relationship of FI and MC are shown in Table 6. Regarding the species of the second group, the minimum thresholds of moisture content below which FI behaviour changed varied from 18% for C. salviifolius to 86% for C. monspeliensis (Table 6). According to the two scenarios of FI change during drying, the appropriate model functions used to adjust FI for the effect of MC followed the same rate of change. For the first group, where FI increased linearly when MC decreased, the linear model was adopted throughout the drying process. For the second group, two FI behaviours have been defined according to moisture content, each of which was represented by a different linear model. Such modelling in two linear functions defined on two MC intervals reflect the two-stage variation of FI, which is a feature of species of the second group (Figure 3b).
As a practical use of the FI-regression models shown in Table 6, FI-values were computed for each species using their respective model functions for both the MC-values of their fresh samples obtained during the present work (winter 2016) and the average MC-values for the same species delivered by Hachmi et al. [43] which were determined during the critical summer period of July–September 2009. It should be noted that the 2009-summer MC data were considered here just for a practical example of the use of MC in FI-regression models of Table 6. The rough FI-values obtained for the two latter MC-applications as well as the approximate forest fuels ranking are shown in Table 7. For greater efficiency, wildfire prevention requires the flammability ranking of fuels considered under environmental conditions corresponding to periods of high recurrence of wildfires (summer). To get the realistic summer FI-values, the samples to be tested should be collected during the same summer, which are richer in volatile organic compounds. These compounds can affect FH-values and subsequently FI-values [44,45,46]. Three flammability classes are identified according to the FI-value classification scale adopted by Hachmi et al. [14] and using Equation (3) proposed in this paper (Table 7). Note that the classification of species’ flammability was variable according to the seasons. Only the classification of C. crispus, C. monspeliensis and P. lentiscus remained unchanged.
4. Discussion
4.1. Flammability Parameters
Average TI values fell within the TI range of species in common with Liodakis et al. [47] (A. unedo, P. lentiscus and Q. coccifera) in an area at the confines of the national park of mountain Parnitha, which is north of the city of Athens (Greece) and Dimitrakopoulos et al. [32] (P. pinaster and P. pinea) in low elevation sites in Greece. However, the TI values obtained with the calorimeter methods [18,19,20,21] are far from being comparable to the TI values obtained with the epiradiator [2,7,12,14,15], as the heat flux, among other parameters, is very different in the two types of methods. In addition, some methods [18,19] refer to the concept of time to sustained ignition instead of TI. The TI-values increased with the moisture content as expected by Dimitrakopoulos and Papaioannou [5], Weise et al. [18], Jervis and Rein [20], Madrigal et al. [21] and Possell and Bell [48]. The relationship between TI and MC was globally linear, which is in accordance with Jervis and Rein [20]. The average DC values are in line with the findings of Liodakis et al. [47] regarding common species. The peak hat release rate, which is a measure of combustibility The average FH values recorded in this work went beyond the FH variation range for common species studied by Liodakis and Kakardakis [31] (A. unedo, P. lentiscus and Q. coccifera) and Liodakis et al. [47], which were both collected from the same Greek ecosystems.
4.2. Flammability Index vs. Moisture Content
The FI-values calculated based on Equation (3) were highly correlated with the corresponding MC-values. Indeed, MC has a profound effect on different aspects of flammability [1,35,36,37,49], especially TI [5,15,38] and flame characteristics [15,36]. Behm et al. [39] considered MC as an indicator of ignitability inter alia. MC is also the main cause of flammability difference between dead and live fuels [9]. Nonetheless, some reports found no effect of MC on TI under the high convective and radiative heat fluxes that are characteristic of high-intensity crown fires [36].
The increase in FI with a decrease in MC is in accordance with the findings of Papió and Trabaud [49], Xanthopoulos and Wakimoto [38], Pausas et al. [15] and Alexander and Cruz [36] since the amount of heat required to evaporate water is positively correlated with fuel moisture content. Xanthopoulos and Wakimoto [38] pointed out that the minimum temperature required for ignition rose with increasing moisture content. Additionally, litter was considered as the most flammable forest fuel compared with other fresh samples of different species [8], which is in line with our outcomes where the highest values of FI corresponded to the driest samples (litter) as shown in Figure 3. Such low moisture contents are also associated with forests subjected to insect attacks or heat desiccation [36], especially in summer.
4.3. FI Behaviour and Flammability Classification
The observation of two distinct behaviours of FI as a function of MC (representing two groups of species) in the examined species may be explained by the existence of two different responses to water stress in Mediterranean plants [50]. Given that water use strategies control the quantity of water maintained inside plant cells under drought conditions in order to withstand drought, the two groups of plant species mentioned above may have distinct flammability behaviours, since the amount of heat required to evaporate water is positively correlated with MC [38]. Moreover, Alessio et al. [35] and White and Zipperer [1] confirmed this fact by indicating that flammability was strictly related to MC due to physical and chemical mechanisms as well as physiological elements, especially whether the character is deciduous or evergreen as this can influence the plant flammability [1]. Indeed, the species examined in this paper are subdivided into drought-deciduous and evergreen sclerophyllous species. Therefore, the distinction between two groups of different physiological responses to water deficit primarily materialized in terms of leaf water content during drought [50] (simulated here by drying process) would lead to differences in flammability behaviour [1] as shown in our results (two groups of different flammability behaviours). As one might expect, during drying, the samples were subjected to water stress, each plant group would adopt distinct physiological adaptations [50,51], which would affect its flammability [1].
The flammability ranking, presented in Table 7 as an example of FI calculation from the average MC-values given by Hachmi et al. [43], is in line with the results found by other authors, such as Papió and Trabaud [49] (C. salviifolius and P. lentiscus), Dimitrakopoulos [50] (A. unedo, C. salviifolius and P. lentiscus), Liodakis et al. [47] (A. unedo and P. lentiscus), Yılmaz and Satıl [51] (A. unedo) and Madrigal et al. [21] (P. pinaster), notwithstanding the different criteria used in each of the methods. Papió and Trabaud [49] ranked C. salviifolius as more flammable than P. lentiscus, while Dimitrakopoulos [50] classified C. salviifolius in a more flammable category in comparison with A. unedo and P. lentiscus. Liodakis et al. [47] classified A. unedo and P. lentiscus among the least flammable species. Yılmaz and Satıl [51] considered A. unedo as a fire-resistant species due to its high moisture content, which is in accordance with our classification in Table 7 (moderately flammable). According to Madrigal et al. [21], Pinus pinaster is among the species that release more heat and is therefore among the most flammable species, which is consistent with our results. Weise et al. [47] revealed contradictory results regarding the flammability ranking of Cistus salviifolius and therefore could not classify it. Concerning the species in common with Dimitrakopoulos and Papaioannou [5] (A. unedo, C. salviifolius and P. lentiscus), Liodakis and Kakardakis [31,34], Liodakis et al. [8] (A. unedo and P. lentiscus), the flammability classifications reported by these authors were in contrast with our outcomes. Dimitrakopoulos and Papaioannou [5] gave a flammability classification based only on TI without taking into account the flame characteristics. However, moisture content affects significantly not only TI but also flame characteristics, including FH [36]. Moreover, the visual flame height (FH) was considered as potential indicator of combustibility [1], which is a relevant component of flammability [1,29,39], emphasizing the importance of FH in flammability assessment. Therefore, this calls into question the relevance of a ranking neglecting the effect of FH, such as the one created by Dimitrakopoulos and Papaioannou [5]. Furthermore, the method of Liodakis et al. [8] was to classify some forest fuels towards their ignitability using the relative limiting oxygen index and the thermogravimetric analysis, whereas the methods of Liodakis and Kakardakis [31,34] provided a flammability ranking of some species using analytical methods. These methods ranked P. lentiscus as less flammable than A. unedo. likewise, Dimitrakopoulos [4] chose to classify species flammability according to a statistical method based on different physical and chemical fuel properties [52], although he neglected the effect of moisture content. As a result, except for P. lentiscus, which fell in the same “Flammable species” class as suggested by the method of Dimitrakopoulos [4], the other commonly examined species A. unedo and C. salviifolius were ranked according to the same author in different flammability classes compared to our results in Table 7. Such flammability classification methods have not gone unchallenged due to the lack of ability to weigh the role of each fuel property and the interactions involved [9]. In addition, the methods of Liodakis and Kakardakis [31,34], Liodakis et al. [8] and Dimitrakopoulos [4] ignored the effect of moisture content in the determination of fuel flammability [14] despite its significant and central role in plant flammability determination revealed in several reports (e.g., [1,14,36]). Ultimately, the classification of the flammability of plant species is controversial as it differs from one season to another. For example, P. pinaster was highly flammable in the summer of 2009 while it was flammable in the winter of 2016. Worse still, A. unedo was moderately flammable in summer 2009 with an average MC-value of 117% while in winter 2016, it was flammable with an average MC-value of 70%. Indeed, the winter of 2016 coincided with a period of prolonged drought that had lasted from the summer before, while the summer of 2009 was preceded by a rainy spring in a global climate change context.
The method proposed in this paper aims to bring model functions of the relationship FI–MC. A practical use of these functions would lead to a realistic classification of plant flammability based on FI-values calculated with MC-values corresponding to the critical periods of high fire occurrence of the year (June–September) as measured by Hachmi et al. [43]. This is when there is the greatest need to perform flammability ratings in a view to preventing wildfires since plant flammability fluctuates within species according to environmental conditions [1,2]. Indeed, the flammability classification would lead us to identify the least flammable species to favour during afforestation campaigns and along the same lines, avoid the most flammable species as much as possible [2,7,8]. Due to the major effect of MC on FI determination [5,14,15,36], plant flammability must be examined in close association with fuel moisture content [14,35]. The latter even highlighted the strict dependence of plant flammability on leaf water availability when several reports testified that horticultural practices, such as watering and routine irrigation, could potentially modify plant flammability [1,2,53,54]. Thus, this enhanced the credibility of our approach of flammability classification. Indeed, our approach is conducted in harmony with fuel moisture content fluctuations. The use of the real MC average values during periods of high fire occurrence, measured by Hachmi et al. [43], is particularly interesting since these values correspond to a period when there is an urgent need to prevent fires.
Furthermore, many plant flammability rankings were carried out throughout the world using plant lists in order to identify the most flammable species to be removed or to convey information on desirable plants (fire-resistant), which would provide guidance for forest managers in selecting the appropriate species for reforestation (e.g., [55,56]). However, such lists have been the subject of sharp criticism because of lack of scientific basis in their design as a result of possible flammability fluctuations according to season and location due to regional climatic differences [1,2]. Even when a scientific basis is adopted, such as in the listing of key plant characteristics associated with favourable or unfavourable fire resistance [54], the standardization of protocols seems to be lacking [1,2], which results in conflicting rankings.
5. Conclusions
The present work provides a response to two major issues. First, we proposed a new FI equation without the DC parameters, which was weakly correlated with moisture content and led to outliers (outside of the predetermined FI interval), especially for fresh samples of some species. This is in contradiction with the FI assumptions. This new expression would correct the weaknesses of the flammability assessment approach of Hachmi et al. [14]. Secondly, since the flammability is tightly linked with fuel moisture content (MC), functions were modelled to adjust FI for the effect of MC in order to obtain realistic FI-values that match specific MC-values. This is even more interesting when it comes to flammability assessment in certain critical conditions, such as the period with high fire occurrence during the period of June–September. For most species, the model functions were linear except for C. albidus, C. monspeliensis, C. salviifolius and P. canariensis, whose functions were piecewise linear with a variation threshold. Indeed, for most species, FI rose linearly when MC decreased. However, for the aforementioned species, FI remained virtually unchanged at the beginning of the drying but once MC dropped below a particular threshold point, FI increased linearly. The resulting model functions will help forest managers to calculate the species-specific FI-values only by measuring the corresponding MC-values in the field. The measurement of MC in the field at a given time would give us the FI-value corresponding to that time. According to average MC-values during the period with high fire occurrence measured by Hachmi et al. [43], most species were ranked among ‘flammable’ fuels. The pine species and C. albidus were regarded as ‘highly flammable’ fuels, whereas A. unedo and Q. suber were classified as ‘moderately flammable’. Research prospects are conceivable for the extension of the flammability classification to more plant species in order to cover all vulnerable ecosystems. The development of a larger MC database corresponding to the critical summer period would be highly desirable. However, the scaling up of our approach requires taking into account numerous fuel and site characteristics, which would merge as input variables into a fire behaviour prediction system [11], which would be capable of producing a reliable assessment of fuel hazards.
Acknowledgments
We are grateful to students Rachid Nidlahadj and Abderrahim Raji from Ecole Nationale Forestière d’Ingénieurs (Salé, Morocco) for their help during field and laboratory work. We also want to thank Mohammed Rhaz, laboratory technician, for technical help at the laboratory. Special thanks are addressed to George K. Arhin for his great help in English language checking and laboratory work. We also acknowledge four anonymous reviewers for their great contribution in the improvement of the quality of the present paper.
Author Contributions
M’hamed Hachmi, Mohammed Yessef, Mohammed Dehhaoui conceived the research work and contributed to the interpretation of the whole results. Salaheddine Essaghi and Fahed El-Amarty harvested the leaves samples from the field, performed the measurements and analysed the data. Salaheddine Essaghi interpreted the experimental results and drafted the manuscript. All authors read and approved the final manuscript.
Conflicts of Interest
The authors declare no conflicts of interest. The funding sponsors had no role in the design of the study; in the collection, analyses, or interpretation of data; in the writing of the manuscript, and in the decision to publish the results.
References
- White, R.H.; Zipperer, W.C. Testing and classification of individual plants for fire behaviour: Plant selection for the wildlandurban interface. Int. J. Wildl. Fire 2010, 19, 213–227. [Google Scholar] [CrossRef]
- Ganteaume, A.; Jappiot, M.; Lampin, C.; Guijarro, M. Flammability of Some Ornamental Species in Wildland—Urban Interfaces in Southeastern France: Laboratory Assessment at Particle Level. Int. J. Wildl. Fire 2013, 52, 467–480. [Google Scholar] [CrossRef] [PubMed]
- Anderson, W.R.; Cruz, M.G.; Fernandes, P.M.; McCaw, L.; Vega, J.A.; Bradstock, R.A.; Fogarty, L.; Gould, J.; McCarthy, G.; Marsden-Smedley, J.B.; et al. A generic, empirical-based model for predicting rate of fire spread in shrublands. Int. J. Wildl. Fire 2015, 24, 443–460. [Google Scholar] [CrossRef]
- Dimitrakopoulos, A.P. A statistical classification of Mediterranean species based on their flammability componentes. Int. J. Wildl. Fire 2001, 10, 113–118. [Google Scholar] [CrossRef]
- Dimitrakopoulos, A.P.; Papaioannou, K.K. Flammability assessment of Mediterranean forest fuels. Fire Technol. 2001, 37, 143–152. [Google Scholar] [CrossRef]
- Essaghi, S.; Hachmi, M.; Yessef, M.; Dehhaoui, M. Leaf shrinkage: A predictive indicator of the potential variation of the surface area-to-volume ratio according to the leaf moisture content. Springerplus 2016, 2, 1229. [Google Scholar] [CrossRef] [PubMed]
- Valette, J.C. Inflammabilités des espèces forestières méditerranéennes. Conséquences sur la combustibilité des formations forestières. Rev. For. Française 1990. [Google Scholar] [CrossRef]
- Liodakis, S.; Kakardakis, T.; Tzortzakou, S.; Tsapara, V. How to measure the particle ignitability of forest species by TG and LOI. Thermochim. Acta 2008, 477, 16–20. [Google Scholar] [CrossRef]
- Fernandes, M.P.; Cruz, M.G. Plant flammability experiments offer limited insight into vegetation—Fire dynamics interactions. New Phytol. 2012, 194, 606–609. [Google Scholar] [CrossRef] [PubMed]
- Schwilk, D.W. Dimensions of plant flammability. New Phytol. 2015, 206, 486–488. [Google Scholar] [CrossRef] [PubMed]
- Pausas, J.G.; Moreira, B. Flammability as a biological concept. New Phytol. 2012, 194, 610–613. [Google Scholar] [CrossRef] [PubMed] [Green Version]
- Molina, J.R.; Martín, T.; Rodríguez, Y.; Silva, F.; Herrera, M.A. The ignition index based on flammability of vegetation improves planning in the wildland-urban interface: A case study in Southern Spain. Landsc. Urban Plan. 2017, 158, 129–138. [Google Scholar] [CrossRef]
- Pellizzaro, G.; Duce, P.; Ventura, A.; Zara, P. Seasonal variations of live moisture content and ignitability in shrubs of the Mediterranean Basin. Int. J. Wildl. Fire 2007, 16, 633–641. [Google Scholar] [CrossRef]
- Hachmi, M.; Sesbou, A.; Benjelloun, H.; El Handouz, N.; Bouanane, F. A simple technique to estimate the flammability index of moroccan forest fuels. J. Combust. 2011, 2011. [Google Scholar] [CrossRef]
- Pausas, J.G.; Alessio, G.A.; Moreira, B.; Corcobado, G. Fires enhance flammability in Ulex parviflorus. New Phytol. 2012, 193, 18–23. [Google Scholar] [CrossRef] [PubMed] [Green Version]
- Murray, B.R.; Hardstaff, L.K.; Phillips, M.L. Differences in leaf flammability, leaf traits and flammability-trait relationships between native and exotic plant species of dry sclerophyll forest. PLoS ONE 2013, 8, 1–8. [Google Scholar] [CrossRef] [PubMed]
- Grootemaat, S.; Wright, I.J.; van Bodegom, P.M.; Cornelissen, J.H.C.; Cornwell, W.K. Burn or rot: Leaf traits explain why flammability and decomposability are decoupled across species. Funct. Ecol. 2015, 29, 1486–1497. [Google Scholar] [CrossRef]
- Weise, D.R.; White, R.H.; Beall, F.C.; Etlinger, M. Use of the cone calorimeter to detect seasonal differences in selected combustion characteristics of ornamental vegetation. Int. J. Wildl. Fire 2005, 14, 321–338. [Google Scholar] [CrossRef]
- Dibble, A.C.; White, R.H.; Lebow, P.K. Combustion characteristics of north-eastern USA vegetation tested in the cone calorimeter: Invasive versus non-invasive plants. Int. J. Wildl. Fire 2007, 426–443. [Google Scholar] [CrossRef]
- Jervis, F.X.; Rein, G. Experimental study on the burning behaviour of Pinus halepensis needles using small-scale fire calorimetry of live, aged and dead samples. Fire Mater. 2016, 385–395. [Google Scholar] [CrossRef]
- Madrigal, J.; Hernando, C.; Guijarro, M. A new bench-scale methodology for evaluating the flammability of live forest fuels. J. Fire Sci. 2012, 31, 131–142. [Google Scholar] [CrossRef]
- Pérez-Harguindeguy, N.; Díaz, S.; Garnier, E.; Lavorel, S.; Poorter, H.; Jaureguiberry, P.; Bret-Harte, M.S.; Cornwell, W.K.; Craine, J.M.; Gurvich, D.E.; et al. New handbook for standardised measurement of plant functional traits worldwide. Aust. J. Bot. 2013, 61, 167–234. [Google Scholar] [CrossRef]
- Wyse, S.V.; Perry, G.L.W.; O’Connell, D.M.; Holland, P.S.; Wright, M.J.; Hosted, C.L.; Whitelock, S.L.; Geary, I.J.; Maurin, K.J.L.; Curran, T.J. A quantitative assessment of shoot flammability for 60 tree and shrub species supports rankings based on expert opinion. Int. J. Wildl. Fire 2016, 25, 466–477. [Google Scholar] [CrossRef] [Green Version]
- Andrews, P.L. Current status and future needs of the BehavePlus Fire Modeling System. Int. J. Wildl. Fire 2014, 23, 21–33. [Google Scholar] [CrossRef]
- Zylstra, P.; Bradstock, R.A.; Bedward, M.; Penman, T.D.; Doherty, M.D.; Weber, R.O.; Gill, A.M.; Cary, G.J. Biophysical mechanistic modelling quantifies the effects of plant traits on fire severity: Species, not surface fuel loads, determine flame dimensions in eucalypt forests. PLoS ONE 2016, 11, e0160715. [Google Scholar] [CrossRef] [PubMed]
- Grootemaat, S.; Wright, I.J.; van Bodegom, P.M.; Cornelissen, J.H.C. Scaling up flammability from individual leaves to fuel beds. Oikos 2017. [Google Scholar] [CrossRef]
- Pausas, J.G.; Keeley, J.E.; Schwilk, D.W. Flammability as an ecological and evolutionary driver. J. Ecol. 2017, 105, 289–297. [Google Scholar] [CrossRef]
- Dehane, B.; Hernando, C.; Guijarro, M.; Madrigal, J. Flammability of some companion species in cork oak (Quercus suber L.) forests. Ann. For. Sci. 2017, 74. [Google Scholar] [CrossRef]
- Anderson, H.E. Forest Fuel Ignitibility. Fire Technol. 1970, 312–319. [Google Scholar] [CrossRef]
- Xanthopoulos, G.; Calfapietra, C.; Fernandes, P. Fire Hazard and Flammability of European Forest Types. In Post-Fire Management and Restoration of Southern European Forests; Moreira, F., Arianoutsou, M., Corona, P., De las Heras, J., Eds.; Springer: Dordrecht, The Netherlands, 2012; Volume 24. [Google Scholar] [CrossRef]
- Liodakis, S.; Kakardakis, T. Measuring the relative particle foliar combustibility of WUI forest species located near athens. J. Therm. Anal. Calorim. 2008, 93, 627–635. [Google Scholar] [CrossRef]
- Dimitrakopoulos, A.P.; Mitsopoulos, I.D.; Kaliva, A. Short communication. comparing flammability traits among fire-stricken (low elevation) and non fire- stricken (high elevation) conifer forest species of Europe: A test of the mutch hypothesis. For. Syst. 2013, 22, 134–137. [Google Scholar] [CrossRef]
- Gill, A.M.; Zylstra, P. Flammability of Australian forests. Aust. For. 2005, 68, 87–93. [Google Scholar] [CrossRef]
- Liodakis, S.; Kakardakis, T. Measuring the particle flammability of forest species from wildland/urban interface (WUI) near athens by thermal analysis. In Proceedings of the 2006 ISEIMA 1st International Symposium on Environment Identities and Mediterranean Area, Corte-Ajaccio, France, 9–12 July 2006; pp. 24–28. [Google Scholar] [CrossRef]
- Alessio, G.A.; Peñuelas, J.; Llusià, J.; Ogaya, R.; Estiarte, M.; De Lillis, M. Influence of water and terpenes on flammability in some dominant Mediterranean species. Int. J. Wildl. Fire 2008, 17, 274–286. [Google Scholar] [CrossRef]
- Alexander, M.E.; Cruz, M.G. Assessing the effect of foliar moisture on the spread rate of crown fires. Int. J. Wildl. Fire 2012, 22, 415–427. [Google Scholar] [CrossRef]
- Etlinger, M.G.; Beall, F. Development of a laboratory protocol for fire performance of landscape plants of landscape plants. Int. J. Wildl. Fire 2004, 13, 479–488. [Google Scholar] [CrossRef]
- Xanthopoulos, G.; Wakimoto, R. Time to Ignition–temperature–moisture Relationship for Branches of Three Western Conifers. Can. J. For. Res. 1993, 23, 253–258. [Google Scholar] [CrossRef]
- Behm, A.L.; Duryea, M.L.; Long, A.J.; Zipperer, W.C. Flammability of native understory species in pine flatwood and hardwood hammock ecosystems and implications for the wildland-urban interface. Int. J. Wildl. Fire 2004, 13, 355–365. [Google Scholar] [CrossRef]
- Van Wilgen, A.B.W.; Higgins, K.B.; Bellstedt, D.U. The Role of Vegetation Structure and Fuel Chemistry in Excluding Fire From Forest Patches in the Fire-Prone Fynbos Shrublands of South Africa. J. Ecol. 1990, 78, 210–222. [Google Scholar] [CrossRef]
- Eriksson, I.; Teketay, D.; Granström, A. Response of plant communities to fire in an Acacia woodland and a dry Afromontane forest, southern Ethiopia. For. Ecol. Manag. 2003, 177, 39–50. [Google Scholar] [CrossRef]
- Valette, J.C. Inflammabilities of Mediterranean Species; Leibniz Information Center for Science and Technology University Library: Porto Carras, Nalkidiki, Greece, 1992; Volume 1. [Google Scholar]
- Hachmi, M.; Sesbou, A.; Benjelloun, H. Prediction of Ignition and Fuel Flammability and Temporal Variation of Fuel Moisture: Temporal Variation in Dead and Live Fuel Moisture (Case of Forest Moroccan Species); Fireparadox Project No. FP6-018505, D[WP3.4.2]-FINAL REPORT-ENFI P(29); European Commission: Brussels, Belgium, 2009. [Google Scholar]
- Ciccioli, P.; Centritto, M.; Loreto, F. Biogenic volatile organic compound emissions from vegetation fires. Plant Cell Environ. 2014, 37, 1810–1825. [Google Scholar] [CrossRef] [PubMed]
- Pausas, J.G.; Alessio, G.A.; Moreira, B.; Segarra-Moragues, J.G. Secondary compounds enhance flammability in a Mediterranean plant. Oecologia 2016, 180, 103–110. [Google Scholar] [CrossRef] [PubMed]
- Della Rocca, G.; Madrigal, J.; Marchi, E.; Michelozzi, M.; Moya, B.; Danti, R. Relevance of terpenoids on flammability of Mediterranean species: An experimental approach at a low radiant heat flux. IForest 2017, 10, 766–775. [Google Scholar] [CrossRef]
- Liodakis, S.; Agiovlasitis, I.P.; Kakardakis, T.; Tzamtzis, N.; Vorisis, D.; Lois, E. Determining hazard risk indices for Mediterranean forest species based on particle flammability properties. Fire Saf. J. 2011, 46, 116–124. [Google Scholar] [CrossRef]
- Possell, M.; Bell, T.L. The influence of fuel moisture content on the combustion of Eucalyptus foliage. Int. J. Wildl. Fire 2013, 22, 343–352. [Google Scholar] [CrossRef]
- Papió, C.; Trabaud, L. Structural characteristics of fuel components of five Meditarranean shrubs. For. Ecol. Manag. 1990, 35, 249–259. [Google Scholar] [CrossRef]
- Dimitrakopoulos, A.P. Thermogravimetric analysis of Mediterranean plant species. J. Anal. Appl. Pyrolysis 2001, 60, 123–130. [Google Scholar] [CrossRef]
- Yılmaz, F.; Satıl, F. Evaluated Aspect of Ethnobotanical of the Implementations the Fire-Resistant Forest Projects (YARDOP) in the Region Kepsut /Balıkesir (Turkey). Pharm. Chem. J. 2016, 3, 110–118. [Google Scholar]
- Dimitrakopoulos, A.P.; Panov, P.I. Pyric properties of some dominant Mediterranean vegetation species. Int. J. Wildl. Fire 2001, 10, 23–27. [Google Scholar] [CrossRef]
- Narog, M.G.; Paysen, T.E.; Koonce, A.L.; Burke, G. Burning irrigated and unirrigated chamise. In Proceedings of the 11th Conference on Fire and Forest Meteorology, Missoula, MT, USA, 16–19 April 1991; Society of American Foresters: Bethesda, MD, USA, 1991; pp. 352–356. [Google Scholar]
- Doran, J.D.; Randall, C.K.; Long, A.J. Fire in the Wildland-Urban Interface: Selecting and Maintaining Firewise Plants for Landscaping. In University Florida, Institute Food Agricultural Service; Florida Cooperative Extension Service Circular 1445: Gainesville, FL, USA, 2004. [Google Scholar]
- Baptiste, L. Firescape—Landscaping to Reduce Fire Hazard; East Bay Municipal Utility District: Oakland, CA, USA, 1992. [Google Scholar]
- Lubin, D.M.; Shelly, J. Defensible Space Landscaping in the Urban/Wildland Interface: A Compilation of Fire Performance Ratings of Residential Landscape Plants; Internal Report No. 36.01.137; University of California, Forest Products Laboratory: Richmond, CA, USA, 1997. [Google Scholar]
Figure 1.
Epiradiator used for fuel species flammability testing and its illustrating schematic components.
Figure 1.
Epiradiator used for fuel species flammability testing and its illustrating schematic components.

Figure 2.
(a) Average values of time-to-ignition; (b) duration of combustion and (c) flame height by species according to fuel moisture content.
Figure 2.
(a) Average values of time-to-ignition; (b) duration of combustion and (c) flame height by species according to fuel moisture content.
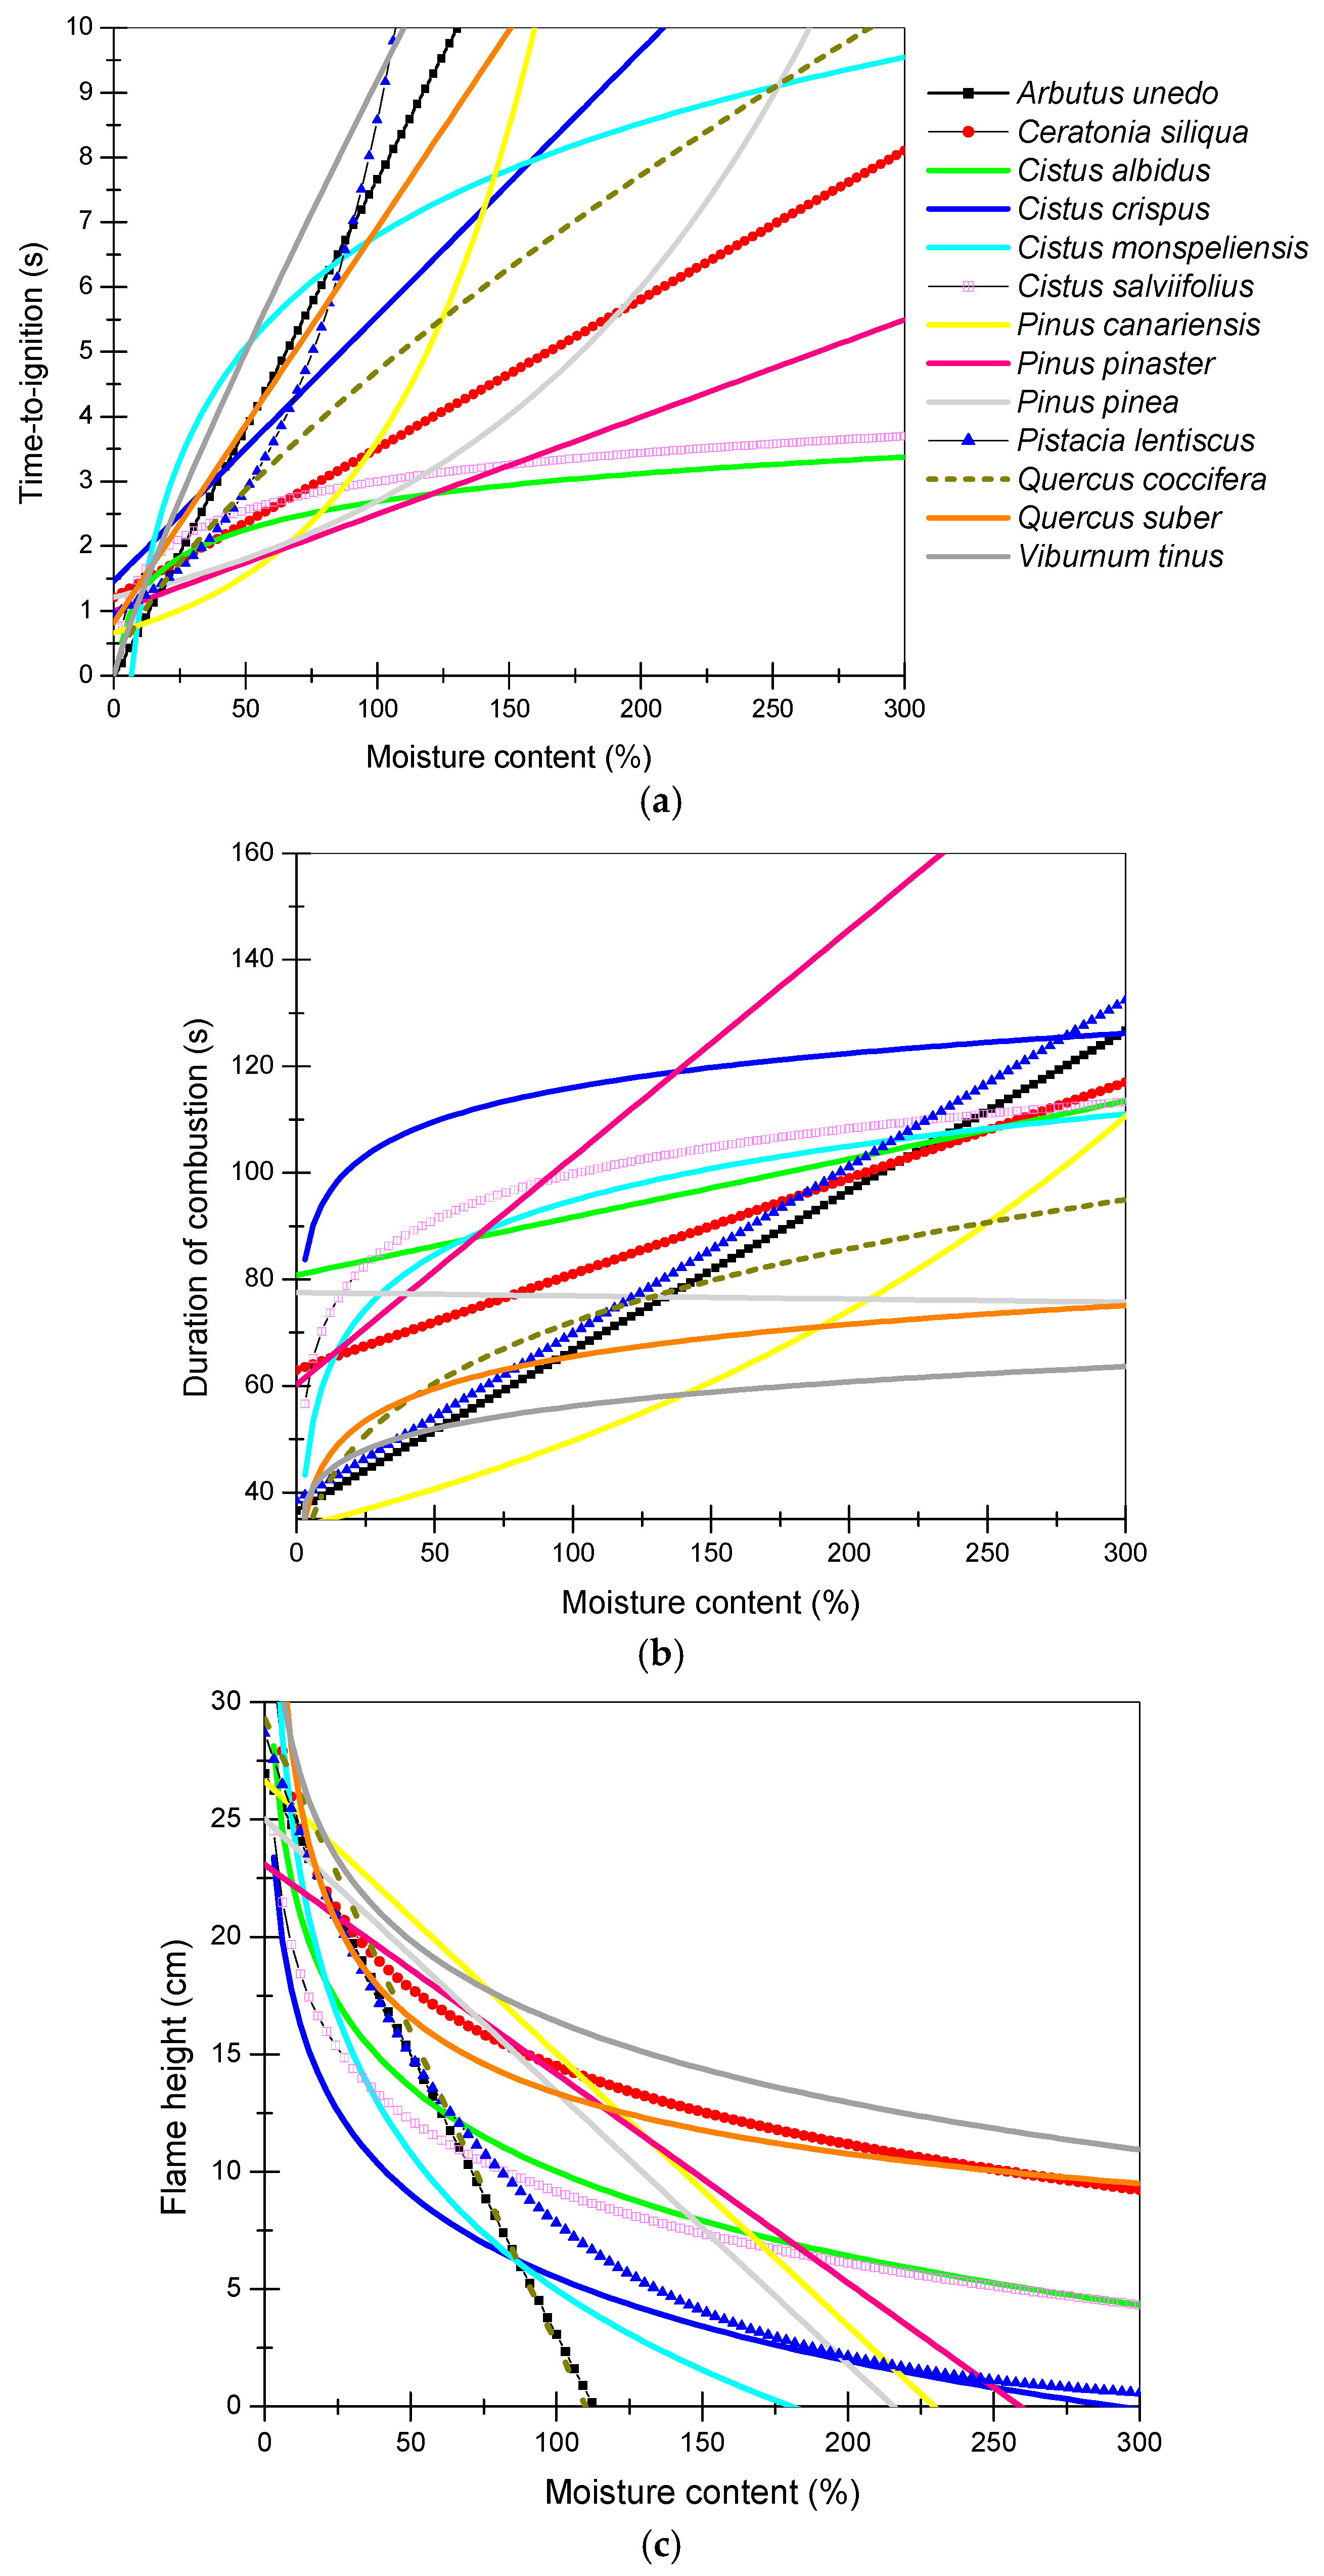
Figure 3.
Flammability indices (FI) as a function of fuel moisture content (MC in %) for (a) Pinus pinaster (1st group) and (b) Cistus albidus (2nd group) with appropriate trend curves.
Figure 3.
Flammability indices (FI) as a function of fuel moisture content (MC in %) for (a) Pinus pinaster (1st group) and (b) Cistus albidus (2nd group) with appropriate trend curves.


Table 1.
Distribution of the collected species among sampling sites.
| Sampling Sites | Altitude (m) | Longitude N | Latitude W | Canopy Cover | Species Collected | |
|---|---|---|---|---|---|---|
| Shrub | Tree | |||||
| Larache (S1) | 25 | 35°13′45.9″ | 6°14′25.0″ | Pinus pinea | Cistus salviifolius | Pinus pinea |
| Ahl Srif (S2) | 142 | 35°00′18.1″ | 5°41′26.5″ | Pinus canariensis | Cistus crispus | Ceratonia siliqua, Pinus canariensis |
| Souk L’Qolla (S3) | 263 | 35°5′2.5″ | 5°34′19.5″ | Pinus pinaster | Cistus albidus | Pinus pinaster |
| Dardara (S4) | 406 | 35°7′50.0″ | 5°17′23.7″ | Quercus suber | Arbutus unedo, Pistacia lentiscus | Quercus suber |
| Bellota (S5) | 128 | 34°56′5.0″ | 5°31′56.1″ | Pinus canariensis | Cistus monspeliensis, Quercus coccifera, Viburnum tinus | |
Table 2.
Pearson’s correlation matrix regarding the parameters time-to-ignition (TI), duration of combustion (DC), flame height (FH) and fuel moisture content (MC).
Table 2.
Pearson’s correlation matrix regarding the parameters time-to-ignition (TI), duration of combustion (DC), flame height (FH) and fuel moisture content (MC).
| MC | TI | DC | FH | |
|---|---|---|---|---|
| MC | ||||
| TI | 0.684 ** | |||
| DC | 0.368 ** | 0.266 ** | ||
| FH | −0.808 ** | −0.718 ** | −0.635 ** |
** Highly significant effect (α = 0.01).
Table 3.
Analysis of variance between the FI-calculating methods presented in Equation (1) and the proposed Equation (3).
Table 3.
Analysis of variance between the FI-calculating methods presented in Equation (1) and the proposed Equation (3).
| Source of Variation | SS | d.f | MS | F | F-Test |
|---|---|---|---|---|---|
| FI-calculating methods | 47,780.220 | 1 | 47,780.220 | 5740.988 | 0.000 significant |
| Residual error | 27,364.866 | 3288 | 8.323 | ||
| Totals | 75,145.086 | 3289 |
FI: Flammability index; SS: Sum of squares due to the source; MS: Mean sum of squares due to the source.
Table 4.
Average values of the flammability indices calculated based on Equation (3) per species for fresh and dried samples and their respective average MC-values followed by standard errors.
Table 4.
Average values of the flammability indices calculated based on Equation (3) per species for fresh and dried samples and their respective average MC-values followed by standard errors.
| Species | Fresh Samples | Dried Samples | ||
|---|---|---|---|---|
| MC (%) | FI | MC (%) | FI | |
| Arbutus unedo | 70.67 ± 0.67 | 7.77 ± 0.16 | 12.33 ± 0.33 | 15.39 ± 0.04 |
| Ceratonia siliqua | 141.65 ± 2.02 | 9.4 ± 0.27 | 9.2 ± 0.48 | 14.85 ± 0.07 |
| Cistus albidus | 198.12 ± 27.15 | 9.22 ± 0.21 | 9.01 ± 0.66 | 14.33 ± 0.09 |
| Cistus crispus | 110.94 ± 6.51 | 8.37 ± 0.19 | 10.46 ± 0.45 | 13.93 ± 0.06 |
| Cistus monspeliensis | 219.67 ± 2.91 | 7.71 ± 0.09 | 10.80 ± 0.25 | 14.98 ± 0.06 |
| Cistus salviifolius | 302.72 ± 2.72 | 7.95 ± 0.17 | 11.81 ± 0.60 | 14.09 ± 0.07 |
| Pinus canariensis | 108.79 ± 1.36 | 10.24 ± 0.15 | 11.77 ± 0.12 | 15.15 ± 0.06 |
| Pinus pinaster | 127.57 ± 6.69 | 10.79 ± 0.16 | 12.85 ± 1.82 | 14.83 ± 0.12 |
| Pinus pinea | 179.27 ± 3.08 | 8.45 ± 0.26 | 13.29 ± 2.18 | 14.82 ± 0.08 |
| Pistacia lentiscus | 100 ± 0.00 | 7.80 ± 0.12 | 11.21 ± 0.34 | 15.68 ± 0.06 |
| Quercus coccifera | 50.25 ± 0.75 | 8.55 ± 0.13 | 11.43 ± 0.54 | 15.08 ± 0.03 |
| Quercus suber | 69.20 ± 0.76 | 8.15 ± 0.20 | 12.02 ± 0.24 | 14.90 ± 0.05 |
| Viburnum tinus | 97.40 ± 1.30 | 7.41 ± 0.12 | 11.32 ± 0.23 | 15.01 ± 0.04 |
MC: Fuel moisture content; and FI: Flammability index.
Table 5.
Pearson correlation coefficient of flammability index (FI) and moisture content (MC) and number of observations per species.
Table 5.
Pearson correlation coefficient of flammability index (FI) and moisture content (MC) and number of observations per species.
| Species | Number of Observations | Pearson Correlation Coefficient of FI and MC |
|---|---|---|
| Arbutus unedo | 262 | −0.952 ** |
| Ceratonia siliqua | 306 | −0.833 ** |
| Cistus albidus | 246 | −0.800 ** |
| Cistus crispus | 271 | −0.892 ** |
| Cistus monspeliensis | 244 | −0.864 ** |
| Cistus salviifolius | 280 | −0.761 ** |
| Pinus canariensis | 313 | −0.916 ** |
| Pinus pinaster | 290 | −0.804 ** |
| Pinus pinea | 405 | −0.877 ** |
| Pistacia lentiscus | 207 | −0.970 ** |
| Quercus coccifera | 252 | −0.948 ** |
| Quercus suber | 216 | −0.946 ** |
| Viburnum tinus | 276 | −0.943 ** |
** Highly significant effect (α = 0.01).
Table 6.
Regression models of flammability index vs. moisture content of some dominant Mediterranean forest fuels.
Table 6.
Regression models of flammability index vs. moisture content of some dominant Mediterranean forest fuels.
| Species | Regression Models | Adjusted R2 |
|---|---|---|
| Arbutus unedo | FI = −0.1 MC + 16.299 | 0.91 |
| Ceratonia siliqua | FI = −0.032 MC + 14.71 | 0.69 |
| Cistus albidus | FI = −0.096 MC + 15.543; MC < 42% | 0.59 |
| FI = −3.73.10−4 MC + 11.557; MC ≥ 42% | 0.82 | |
| Cistus crispus | FI = −0.044 MC + 13.533 | 0.72 |
| Cistus monspeliensis | FI = −0.09 MC + 15.399; MC < 86% | 0.95 |
| FI = −0.001 MC + 7.766; MC ≥ 86% | 0.99 | |
| Cistus salviifolius | FI = −0.07 MC + 14.614; MC ≤ 18% | 0.66 |
| FI = −0.017 MC + 13.637; MC > 18% | 0.64 | |
| Pinus canariensis | FI = −0.193 MC + 27.403; MC ≤ 81% | 0.73 |
| FI = −0.049 MC + 15.733; MC > 81% | 0.67 | |
| Pinus pinaster | FI = −0.025 MC + 14.891 | 0.60 |
| Pinus pinea | FI = −0.029 MC + 14.923 | 0.70 |
| Pistacia lentiscus | FI = −0.082 MC + 15.817 | 0.93 |
| Quercus coccifera | FI = −0.091 MC + 16.284 | 0.60 |
| Quercus suber | FI = −0.097 MC + 15.691 | 0.65 |
| Viburnum tinus | FI = −0.091 MC + 15.698 | 0.89 |
FI: Flammability index; MC: fuel moisture content (%); and Adjusted R2: Adjusted coefficient of determination.
Table 7.
Practical example of the use of MC-values in the FI calculation for both the MC-values obtained during the present work (winter 2016) and the average MC-values delivered by Hachmi et al. [43] which were determined during the critical summer period of July–September 2009.
Table 7.
Practical example of the use of MC-values in the FI calculation for both the MC-values obtained during the present work (winter 2016) and the average MC-values delivered by Hachmi et al. [43] which were determined during the critical summer period of July–September 2009.
| Species | Average MC * (%, Summer 2009) | FI-Value (Summer 2009) | Species Flammability Classification ** | Average MC for Fresh Samples (%, Winter 2016) & | FI-Value for Fresh Samples (Winter 2016) | Species Flammability Classification for Fresh Samples ¶ |
|---|---|---|---|---|---|---|
| Cistus salviifolius | 111.9 | 11.73 | Highly flammable | 302.7 | 7.95 | Flammable |
| Pinus pinaster | 134.8 | 11.52 | 127.6 | 10.79 | ||
| Cistus albidus | 129.5 | 11.51 | 198.1 | 9.22 | ||
| Pinus canariensis | 91.1 | 11.27 | 108.8 | 10.24 | ||
| Cistus crispus | 77.1 | 10.15 | Flammable | 110.9 | 8.37 | |
| Viburnum tinus | 72.9 | 9.06 | 97.4 | 7.41 | Moderately flammable | |
| Pistacia lentiscus | 91.6 | 8.27 | 100.0 | 7.80 | Flammable | |
| Cistus monspeliensis | 87.8 | 7.68 | 219.7 | 7.71 | ||
| Quercus suber | 90.8 | 6.86 | Moderately flammable | 69.2 | 8.15 | |
| Arbutus unedo | 117.5 | 4.50 | 70.7 | 7.77 |
* Average MC delivered by Hachmi et al. [43] and determined during the critical summer period of July–September 2009. ** Classification based on MC-values delivered by Hachmi et al. [43] inspired by Hachmi et al. [14] with the same delimitations as the latter authors. Least flammable (FI < 1.5), less flammable (1.5 ≤ FI < 4.5), moderately flammable (4.5 ≤ FI < 7.5), flammable (7.5 ≤ FI < 10.5), highly flammable (10.5 ≤ FI < 13.5), most flammable (13.5 ≤ FI < 16.5) and extremely flammable (FI ≥ 16.5). & MC for fresh samples collected during the present work in the winter of 2016. ¶ Classification based on MC-values recorded during the present work for fresh samples in the winter of 2016 with the same delimitations as Hachmi et al. [14].
© 2017 by the authors. Licensee MDPI, Basel, Switzerland. This article is an open access article distributed under the terms and conditions of the Creative Commons Attribution (CC BY) license (http://creativecommons.org/licenses/by/4.0/).
Share and Cite
MDPI and ACS Style
Essaghi, S.; Hachmi, M.; Yessef, M.; Dehhaoui, M.; El Amarty, F. Assessment of Flammability of Moroccan Forest Fuels: New Approach to Estimate the Flammability Index. Forests 2017, 8, 443. https://doi.org/10.3390/f8110443
AMA Style
Essaghi S, Hachmi M, Yessef M, Dehhaoui M, El Amarty F. Assessment of Flammability of Moroccan Forest Fuels: New Approach to Estimate the Flammability Index. Forests. 2017; 8(11):443. https://doi.org/10.3390/f8110443
Chicago/Turabian StyleEssaghi, Salaheddine, M’hamed Hachmi, Mohammed Yessef, Mohammed Dehhaoui, and Fahed El Amarty. 2017. "Assessment of Flammability of Moroccan Forest Fuels: New Approach to Estimate the Flammability Index" Forests 8, no. 11: 443. https://doi.org/10.3390/f8110443
Note that from the first issue of 2016, this journal uses article numbers instead of page numbers. See further details here.