Article

Predicting Future Seed Sourcing of Platycladus orientalis (L.) for Future Climates Using Climate Niche Models

1
Beijing Advanced Innovation Center for Tree Breeding by Molecular Design, National Engineering Laboratory for Tree Breeding, Key Laboratory of Genetics and Breeding in Forest Trees and Ornamental Plants, Ministry of Education, College of Biological Sciences and Technology, Beijing Forestry University, Beijing 100083, China
2
Department of Forest and Conservation Sciences, Faculty of Forestry, University of British Columbia, Vancouver, BC V6T 1Z4, Canada
*
Author to whom correspondence should be addressed.
Forests 2017, 8(12), 471; https://doi.org/10.3390/f8120471
Submission received: 30 October 2017 / Revised: 17 November 2017 / Accepted: 28 November 2017 / Published: 1 December 2017
(This article belongs to the Section Forest Ecology and Management)

Abstract

:
Climate niche modeling has been widely used to assess the impact of climate change on forest trees at the species level. However, geographically divergent tree populations are expected to respond differently to climate change. Considering intraspecific local adaptation in modeling species responses to climate change will thus improve the credibility and usefulness of climate niche models, particularly for genetic resources management. In this study, we used five Platycladus orientalis (L.) seed zones (Northwestern; Northern; Central; Southern; and Subtropical) covering the entire species range in China. A climate niche model was developed and used to project the suitable climatic conditions for each of the five seed zones for current and various future climate scenarios (Representative Concentration Pathways: RCP2.6, RCP4.5, RCP6.0, and RCP8.5). Our results indicated that the Subtropical seed zone would show consistent reduction for all climate change scenarios. The remaining seed zones, however, would experience various degrees of expansion in suitable habitat relative to their current geographic distributions. Most of the seed zones would gain suitable habitats at their northern distribution margins and higher latitudes. Thus, we recommend adjusting the current forest management strategies to mitigate the negative impacts of climate change.

1. Introduction

Forest trees are genetically adapted to a range of climate conditions [1], referred to as their climate niche [2,3] or bioclimatic envelope [4]. A rapidly changing climate is moving these climate niches away from their current species ranges. Trees growing outside of their climate niche are likely to be maladapted and their productivity and ecological values compromised. Biological and non-biological responses to climate change are well documented [5,6]. To tackle these problems, climate niche models have been widely used to model and project the geographic distributions of suitable climatic conditions of forest tree species under current and future climates [7,8,9]. The model output can be used to identify regions where the species is vulnerable and those where genetic conservation and assisted migration are necessary [10,11,12].
In climate niche modeling, a species is usually treated as if individuals from all populations respond equally to climate change, and predictions on their response to climate change are mostly formulated at species level [13,14]. Thus, intraspecific variation and local adaptation is not generally considered when assessing species responses to climate change [15,16]. By treating populations within a widespread species as an undifferentiated collection of individuals, differences in many physiological, ecological, and growth attributes are discounted and the assessment of climate change effects may result in a false net positive impact on forest productivity (herein considered only as area-base suitable habitat) [17,18,19]. However, among-population variation resulting from climate-related natural selection and local adaptation is widely observed along climatic gradients [20,21]. Ecological genetics studies such as provenance testing have revealed that the adaptability of different geographic populations can differ substantially [22,23]. In addition, spatially explicit predictions of climate change impacts on potential geographic distribution areas have also suggested that different populations of a species respond differently to climate change [17,21,24,25]. Therefore, failure to consider local adaptation when forecasting climate change-driven species range shifts not only results in less precise predictions, but also often leads to biased conclusions.
To consider the among-population variation and local adaptation in forest practice, provenance tests have been used to develop seed zones for many economically and ecologically important species. Provenance tests were initially established to identify superior seed sources for reforestation [26], and were mainly used to develop and delineate seed zones. A seed zone represents a restricted geographic region, from which collected seeds are expected to be equally suited for reforestation within all the seed zone’s territory. Thus, seed zones are considered an essential tool to ensure that seed and plant material are well adapted to the climatic conditions of the planting site [27]. Climate niche modeling at the seed zone level can provide scientific information for developing strategies for the management of seed sources, and conservation of forest genetic diversity under current and anticipated future climates is of increased importance [10,27,28,29,30].
Platycladus orientalis (L.) Franco, a member of the family Cupressaceae, is a widespread conifer in China [31,32,33]. This species is able to endure severe drought and persist on barren soil, and consequently, it is commonly used for ecological restoration in arid mountain landscapes of northern China. There are five seed zones delineated based on provenance tests, which have provided the basis for seed resource management [33,34,35]. Hu et al. [15] demonstrated the impacts of future climate change on the distribution of this species; however, this study treated all populations as if they respond to climate change equally. In the present study, we used five seed zones to represent populations of this species. A climate niche model was developed for each seed zone, and used to project the suitable range of P. orientalis seed zones for current and future climate scenarios (four future climate scenarios in 2050 and 2070). We specifically want to address the following objectives: (1) to verify the climate niche divergence among different seed zones through a series of validation and contrast tests; (2) to assess seed zone dynamics in terms of changes in area, spatial shift, and migrations of geographic center of the seed zones; and (3) to explore the creation of new guidelines for seed transfer based on our future projections for each of the five seed zones. Our study provides a scientific basis for the use of seed zones in long-term forest plantations that are able to adapt to future climates and to mitigate the negative impacts of climate change.

2. Materials and Methods

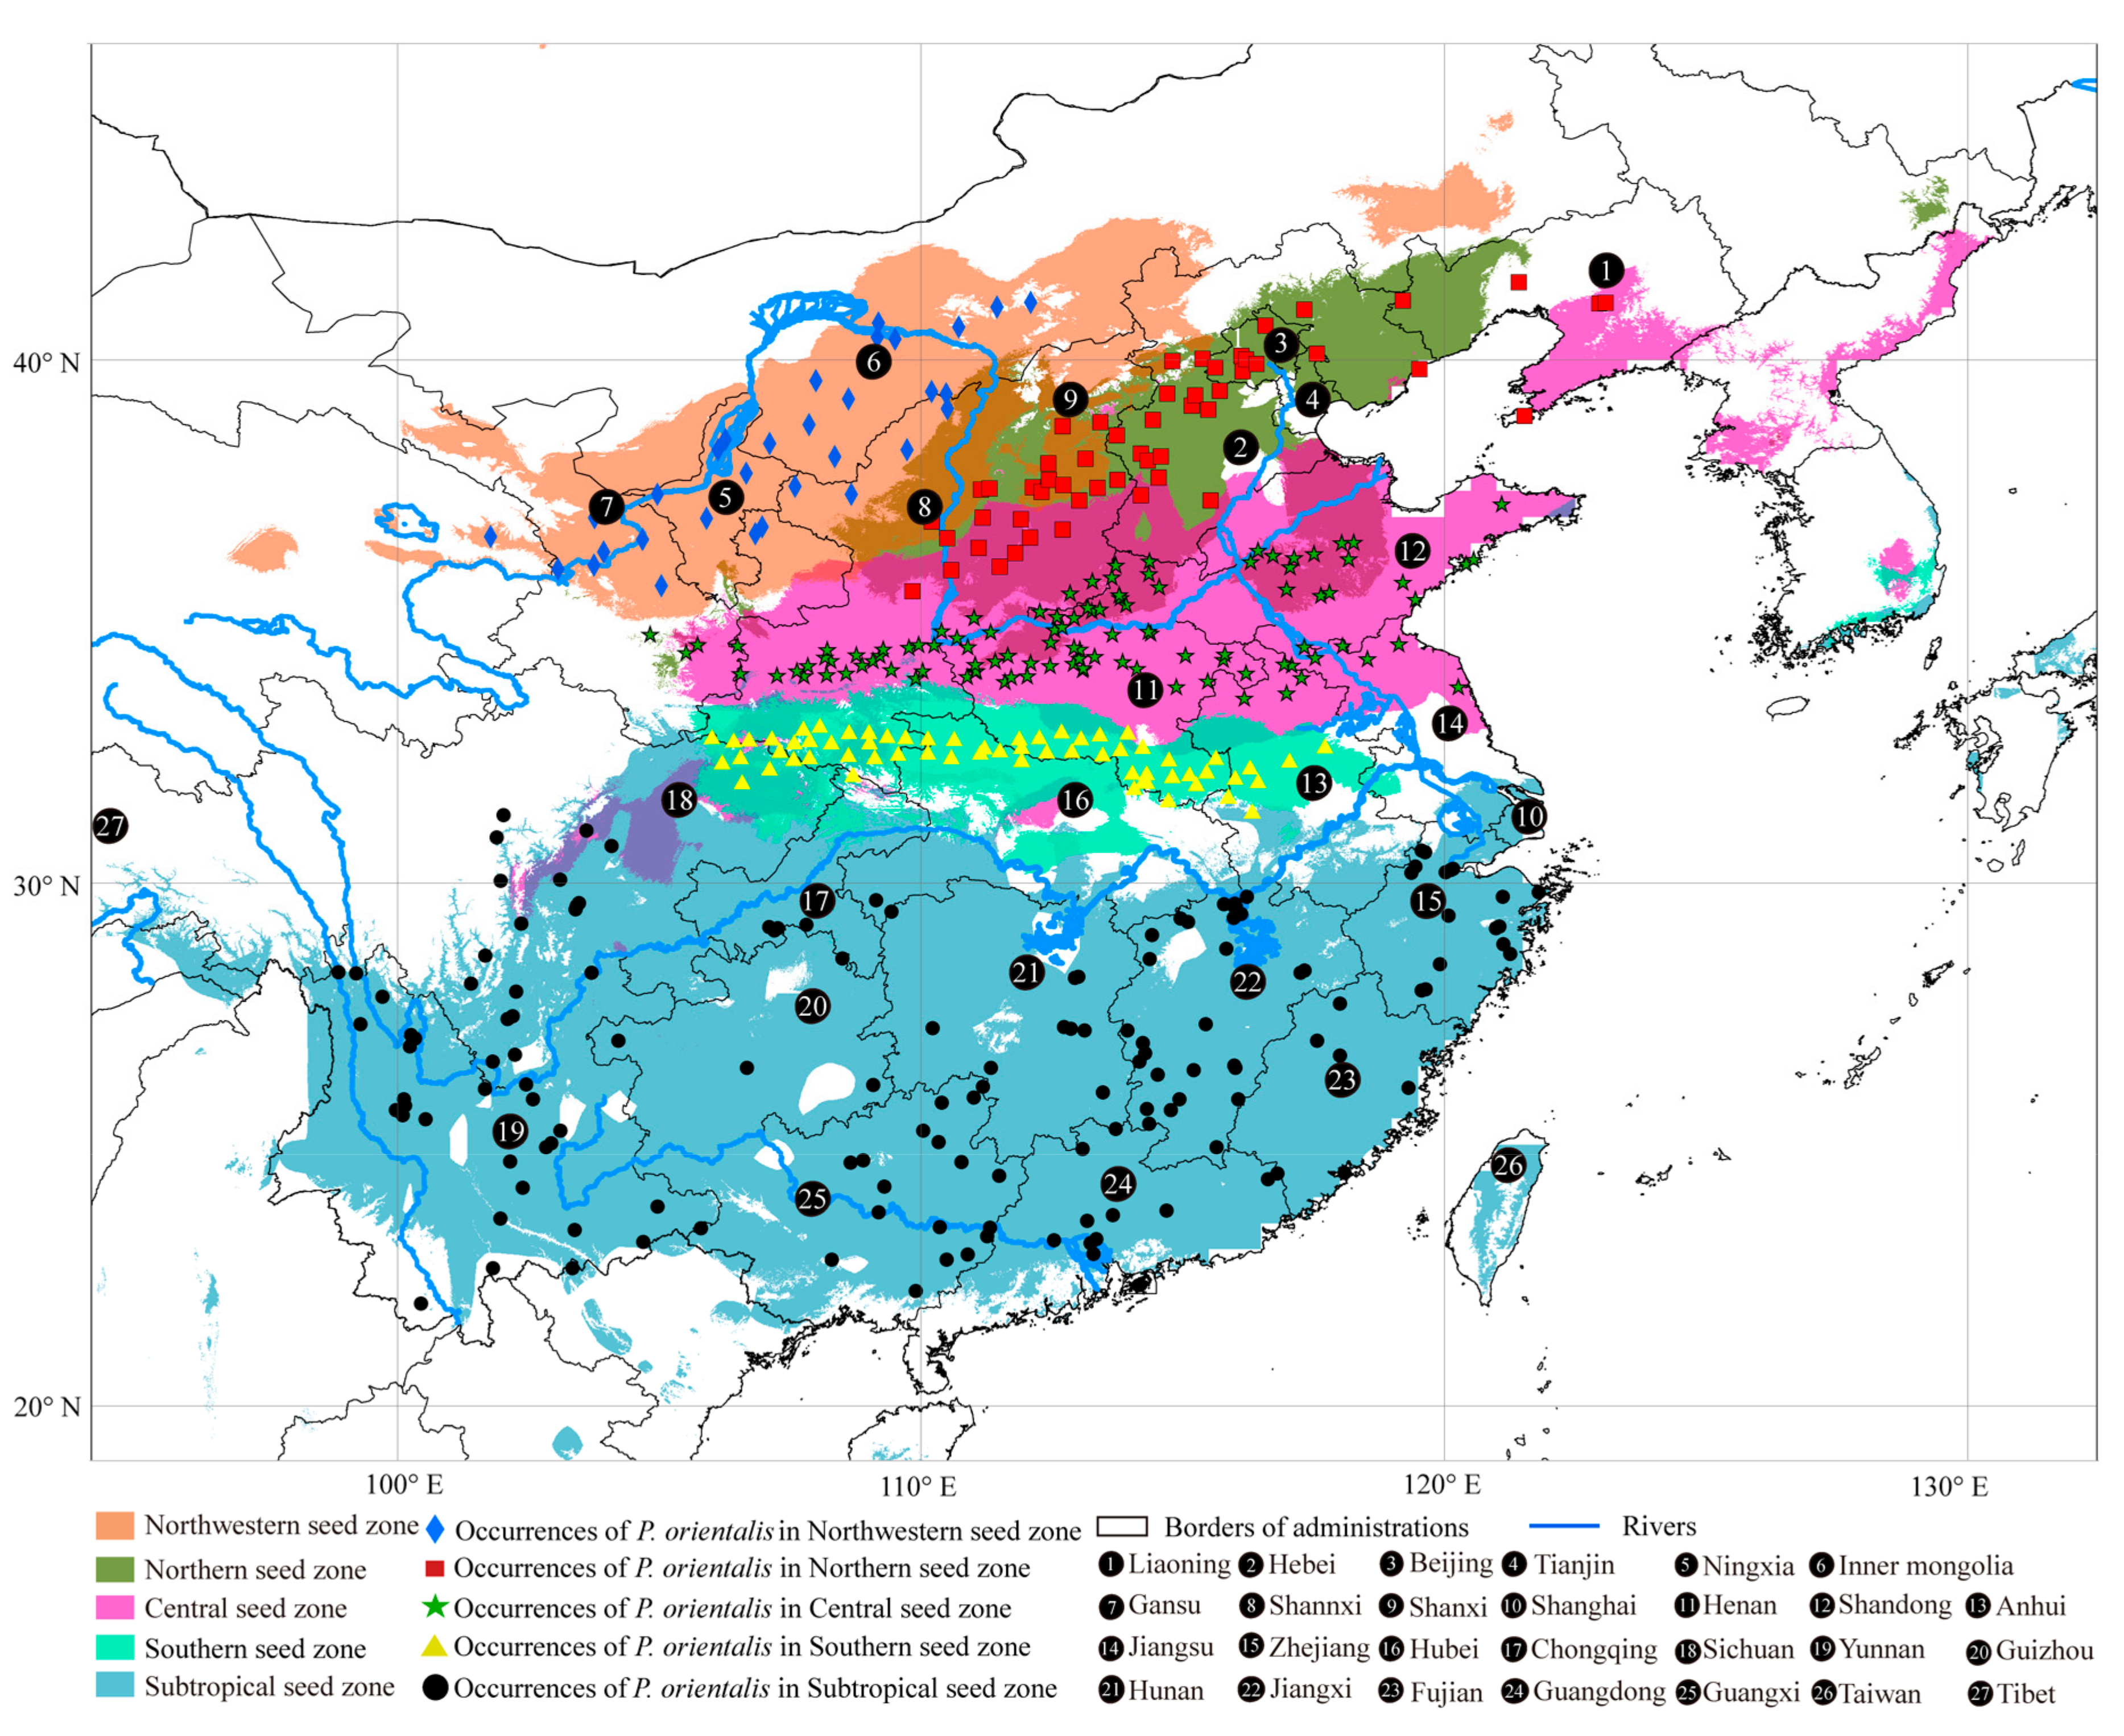
2.1. Seed Zone Delimitation of P. orientalis and Occurrence Data Collection

In the 1980s, the forestry community of China initiated P. orientalis seed certification and established seed zone delimitation based on large-scale provenance tests. The species range was divided into five seed zones: (1) Northwestern; (2) Northern; (3) Central; (4) Southern; and (5) Subtropical [35]. Based on range-wide sampling and multi-region transplantation, provenance tests have revealed significant difference among provenances and seed zones in terms of morphology, germination and growth rate (height and diameter), survival and physiological characteristics of drought/cold tolerance [36,37,38,39,40,41,42]. Comparisons of these traits among seed zones are summarized in Table S1. In addition to the distinct differences among seed zones, the provenance test studies have also revealed that the variation among both morphological and functional traits is strongly correlated with geographic (latitude and longitude) and environmental elements. Temperature (cold injury) and water availability (drought) are found as major climatic factors limiting the distribution range and shaping the morphological and functional variation among seed zones (Table S1). We obtained the occurrence data for P. orientalis across the five seed zones from the distributions reported in the literature [43,44,45] and the China Virtual Herbarium database (CVH, http://v5.cvh.org.cn/). In cases of occurrence records missing geo-coordinates, Google Map (http://www.google.cn/maps/) was used to determine their latitude and longitude. Incorrect species occurrence information (e.g., presence in extreme environments or unsuitable habitat) may inflate the measure of niche overlap [46]. To reduce this error, outliers were identified by a multi-dimensional-based approach using Mahalanobis distances [47] and were eliminated if they occurred outside the 5–95th range of the niche space using the raster package [48] in R [49]. In this process, the climatic combinations at each site of the occurrence were given a Mahalanobis distance in relation to a vector describing the mean conditions found within the dataset, which is assumed to represent the ‘optimal’ climatic niche of the species [47]. In this way, any site with different environmental conditions from the mean climatic niche can be identified.

2.2. Environmental Parameters and Future Climate Scenarios

The provenance tests revealed that thermal and water availability parameters are the most important bioclimatic variables related to the growth and survival of P. orientalis [35,36,37,38,39,40,41,42]. To develop a climate niche model and predict the spatial distribution for each of the five seed zones, we selected eight bioclimatic and two soil related environmental variables that are closely related to plant growth (Table 1) and frequently used in climate niche modeling. The eight bioclimatic layers (Bio1, Bio2, Bio3, Bio4, Bio5, Bio12, Bio14, and Bio15) were obtained from Worldclim for the reference normal period 1961–1990 [50] (http://www.worldclim.org/) and the two environmental variables (soil organic carbon (SC) and soil pH (SpH)) were obtained from the Center for Sustainability and the Global Environment (http://www.sage.wisc.edu/atlas/index.php) (Table 1). These data on environmental variables were preprocessed to a spatial resolution of 30″ latitude/longitude (ca. 1 km2 at ground level). We used |r| ≤ 0.80 (Pearson correlation coefficient) as a cut-off threshold to determine the exclusion of highly correlated variables [51].
To project the shift in geographic distributions of the climate niches of the seed zones, we obtained future climate scenario data for 2050 and 2070 from the Intergovernmental Panel on Climate Change (IPCC)’s research program on climate change, Coupled Model Intercomparison Project 5 (CMIP5) climate data archive [52]. The IPCC provides calibrated and downscaled climatic projections representing four different future scenarios. These scenarios are models, which represent different possible socioeconomic and political conditions that influence future emission trajectories or Representative Concentration Pathways (RCPs). The four RCPs (RCP2.6, RCP4.5, RCP6.0, and RCP8.5) are coded according to increased radiative forcing values in the year 2100 relative to preindustrial values (+2.6, +4.5, +6.0, and +8.5 W/m−2, respectively) [53]. We downloaded the same bioclimatic variables that were used in developing the models at Worldclim (http://www.worldclim.org/, version 1.4) for BCC-CSM1-1 (Beijing Climate Center Climate System Model, version 1-1) for the eight climate change scenario/year combinations: RCP2.6-2050 (average for the years 2041–2060 under scenario RCP2.6), RCP2.6-2070 (average for the years 2061–2080 under the scenario RCP2.6), RCP4.5-2050, RCP4.5-2070, RCP6.0-2050, RCP6.0-2070, RCP8.5-2050, and RCP8.5-2070. The two soil-related variables were kept unchanged.

2.3. Testing for Niche Divergence among Seed Zones

Three statistical approaches were used to check the ecological differentiation among the seed zones. First, the population-level (seed zone) divergence associated with each of the environmental variables was examined by a nonparametric Kruskal–Wallis multiple-range test [54], and the variation among seed zones was determined by a permutational ANOVA (Analysis of Variance) implemented in lmperm [55]. The distribution of each seed zone in terms of each environmental variable was displayed in kernel density plots. Second, without a priori designation of seed zones, principal components analysis (PCA) was applied to scaled data for the 10 studied environmental variables corresponding to all available occurrence records. The relative contribution of each environmental parameter to the formation of niche spaces was then illustrated in a PCA distance biplot, and the magnitude and statistical significance of niche shifts among the occurrence clouds in the PCA graph were assessed by between-class inertia percentages and 99 Monte Carlo randomization tests [56]. Finally, in order to further test climate niche divergence between each seed zone pair, we compared background divergence (db) with observed niche divergence (dn) in the PCA-reduced axes, with the null hypothesis of no significant difference between these two distributions (db = dn) [57]. If db < dn and the observed niche divergence itself (dn) is significant (according to permutation t-test), this provided support to significant niche divergence, otherwise, niche conservatism is supported. For each seed zone, the values of 10 environmental variables, longitude, latitude, and altitude were drawn by the occurrence points and from 10,000 random background points within the background region of each seed zone with the dismo [58] and raster packages in R. The 10 variables were reduced by PCA of the correlation matrix with the ade4 package [59]. Using a nonparametric correlation test implemented in perm [60], the correlations between the reduced PCA axes and the geographical variables (longitude, latitude, and altitude) were examined. In this test, dn and db were computed as the differences between the mean scores of 75% random samples of the occurrence points of the two compared seed zones (dn) and of the 10,000 background points of the two compared background habitats (db), in the reduced PCA axes. The distributions of db and dn were generated with 10,000 resamplings, and the mean of dn was compared to the 95% confidence interval of db to determine its significance. The significance of the observed divergence between two compared niches was determined by a permutation t-test in perm. These tests provide more detailed information about (1) niche divergence between different seed zones; (2) validate the precision and credibility of seed zone division; and (3) detect environmental variables that are strongly associated with niche divergence.

2.4. Development of Climate Niche Models and Projections for Future Climates

We used Maximum Entropy Modeling (MaxEnt, version 3.3.3, New York, NY, USA) [61] to develop the climate niche models for each of the five seed zones. MaxEnt is a presence-background algorithm which calculates the probability of habitat suitability, based on the occurrence locations relative to random background conditions [62,63,64]. The occurrence locations define the environmental constraints placed on the predicted distribution. For example, the temperature conditions associated with occurrence data will define the mean and variance in temperature associated with species presence. A distribution is then fitted that fulfills the constraints, starting with a uniform distribution and moving away from this to meet the requirements of the constraints [65]. This process utilizes feature functions (e.g., linear, threshold, and hinge) to produce an output probability distribution that sums to 1 over the study area, meaning that locations with environmental conditions more similar to the mean of presence locations will have higher occurrence probabilities. To prevent model over-fitting, a regularization parameter is used [61]. MaxEnt provides several methods of thresholding to convert the continuous probability output into a binary, suitable–unsuitable prediction. For model evaluation, MaxEnt calculates a receiver operating characteristic (ROC) plot [66], and the area under this curve (AUC) is often used to determine model performance where a perfect model has an AUC of 1, although performance is considered good when the AUC is >0.7 [67].
To model the climatic suitability of the seed zones, we conducted model cross-validation after splitting our data into training (75%) and testing (25%). Using MaxEnt’s [61] default settings, we modeled the current climatic suitability distribution in each of the five seed zones in relation to the 10 current environmental variables. We applied the “maximum training sensitivity plus specificity” threshold rule to all models. For each seed zone model, MaxEnt generated response curves and percent contribution for each predictor variable, which we examined to uncover relationships between environmental suitability and current bioclimatic conditions, such as individual variable importance across the different seed zone models.
For each of the five seed zones, we used MaxEnt to project future climatic suitability distributions under four future climate scenarios at two future time periods, 2050 and 2070 (RCP2.6-2050, RCP2.6-2070, RCP4.5-2050, RCP4.5-2070, RCP6.0-2050, RCP6.0-2070, RCP8.5-2050, and RCP8.5-2070). For soil organic carbon (SC) and soil pH (SpH) variables, no simulated future data is available, so we assumed that these data remain unchanged in the future. We compared the current distributions to future predictions for each seed zone, to identify regions that have changed to (i) unsuitable (the loss of original suitable area); (ii) suitable (the gain in suitable area); and (iii) unchanged (the unchanged original suitable area).

2.5. Shifts and Spatial Dynamics of the Suitable Habitats

To further examine the changes in suitable area, we calculated the average elevation and geographic centroids for all seed zones and compared their difference between current and future distributions. This allowed the detection of the spatial and elevational shifts of climatic suitability distributions between the current and the future distributions for each seed zone. These statistical computations were performed using the raster package in R. We used a python-based GIS toolkit, SDMtoolbox [68], to calculate changes in centroid location between current and future distributions. SDMtoolbox reduces the predicted suitable area to a single central point and creates a vector file depicting the magnitude and direction of predicted change through time. By examining variations in the binary distribution map, we were able to summarize core distributional shifts of seed zone ranges, indicating geographical shifts in suitable environmental conditions.

3. Results

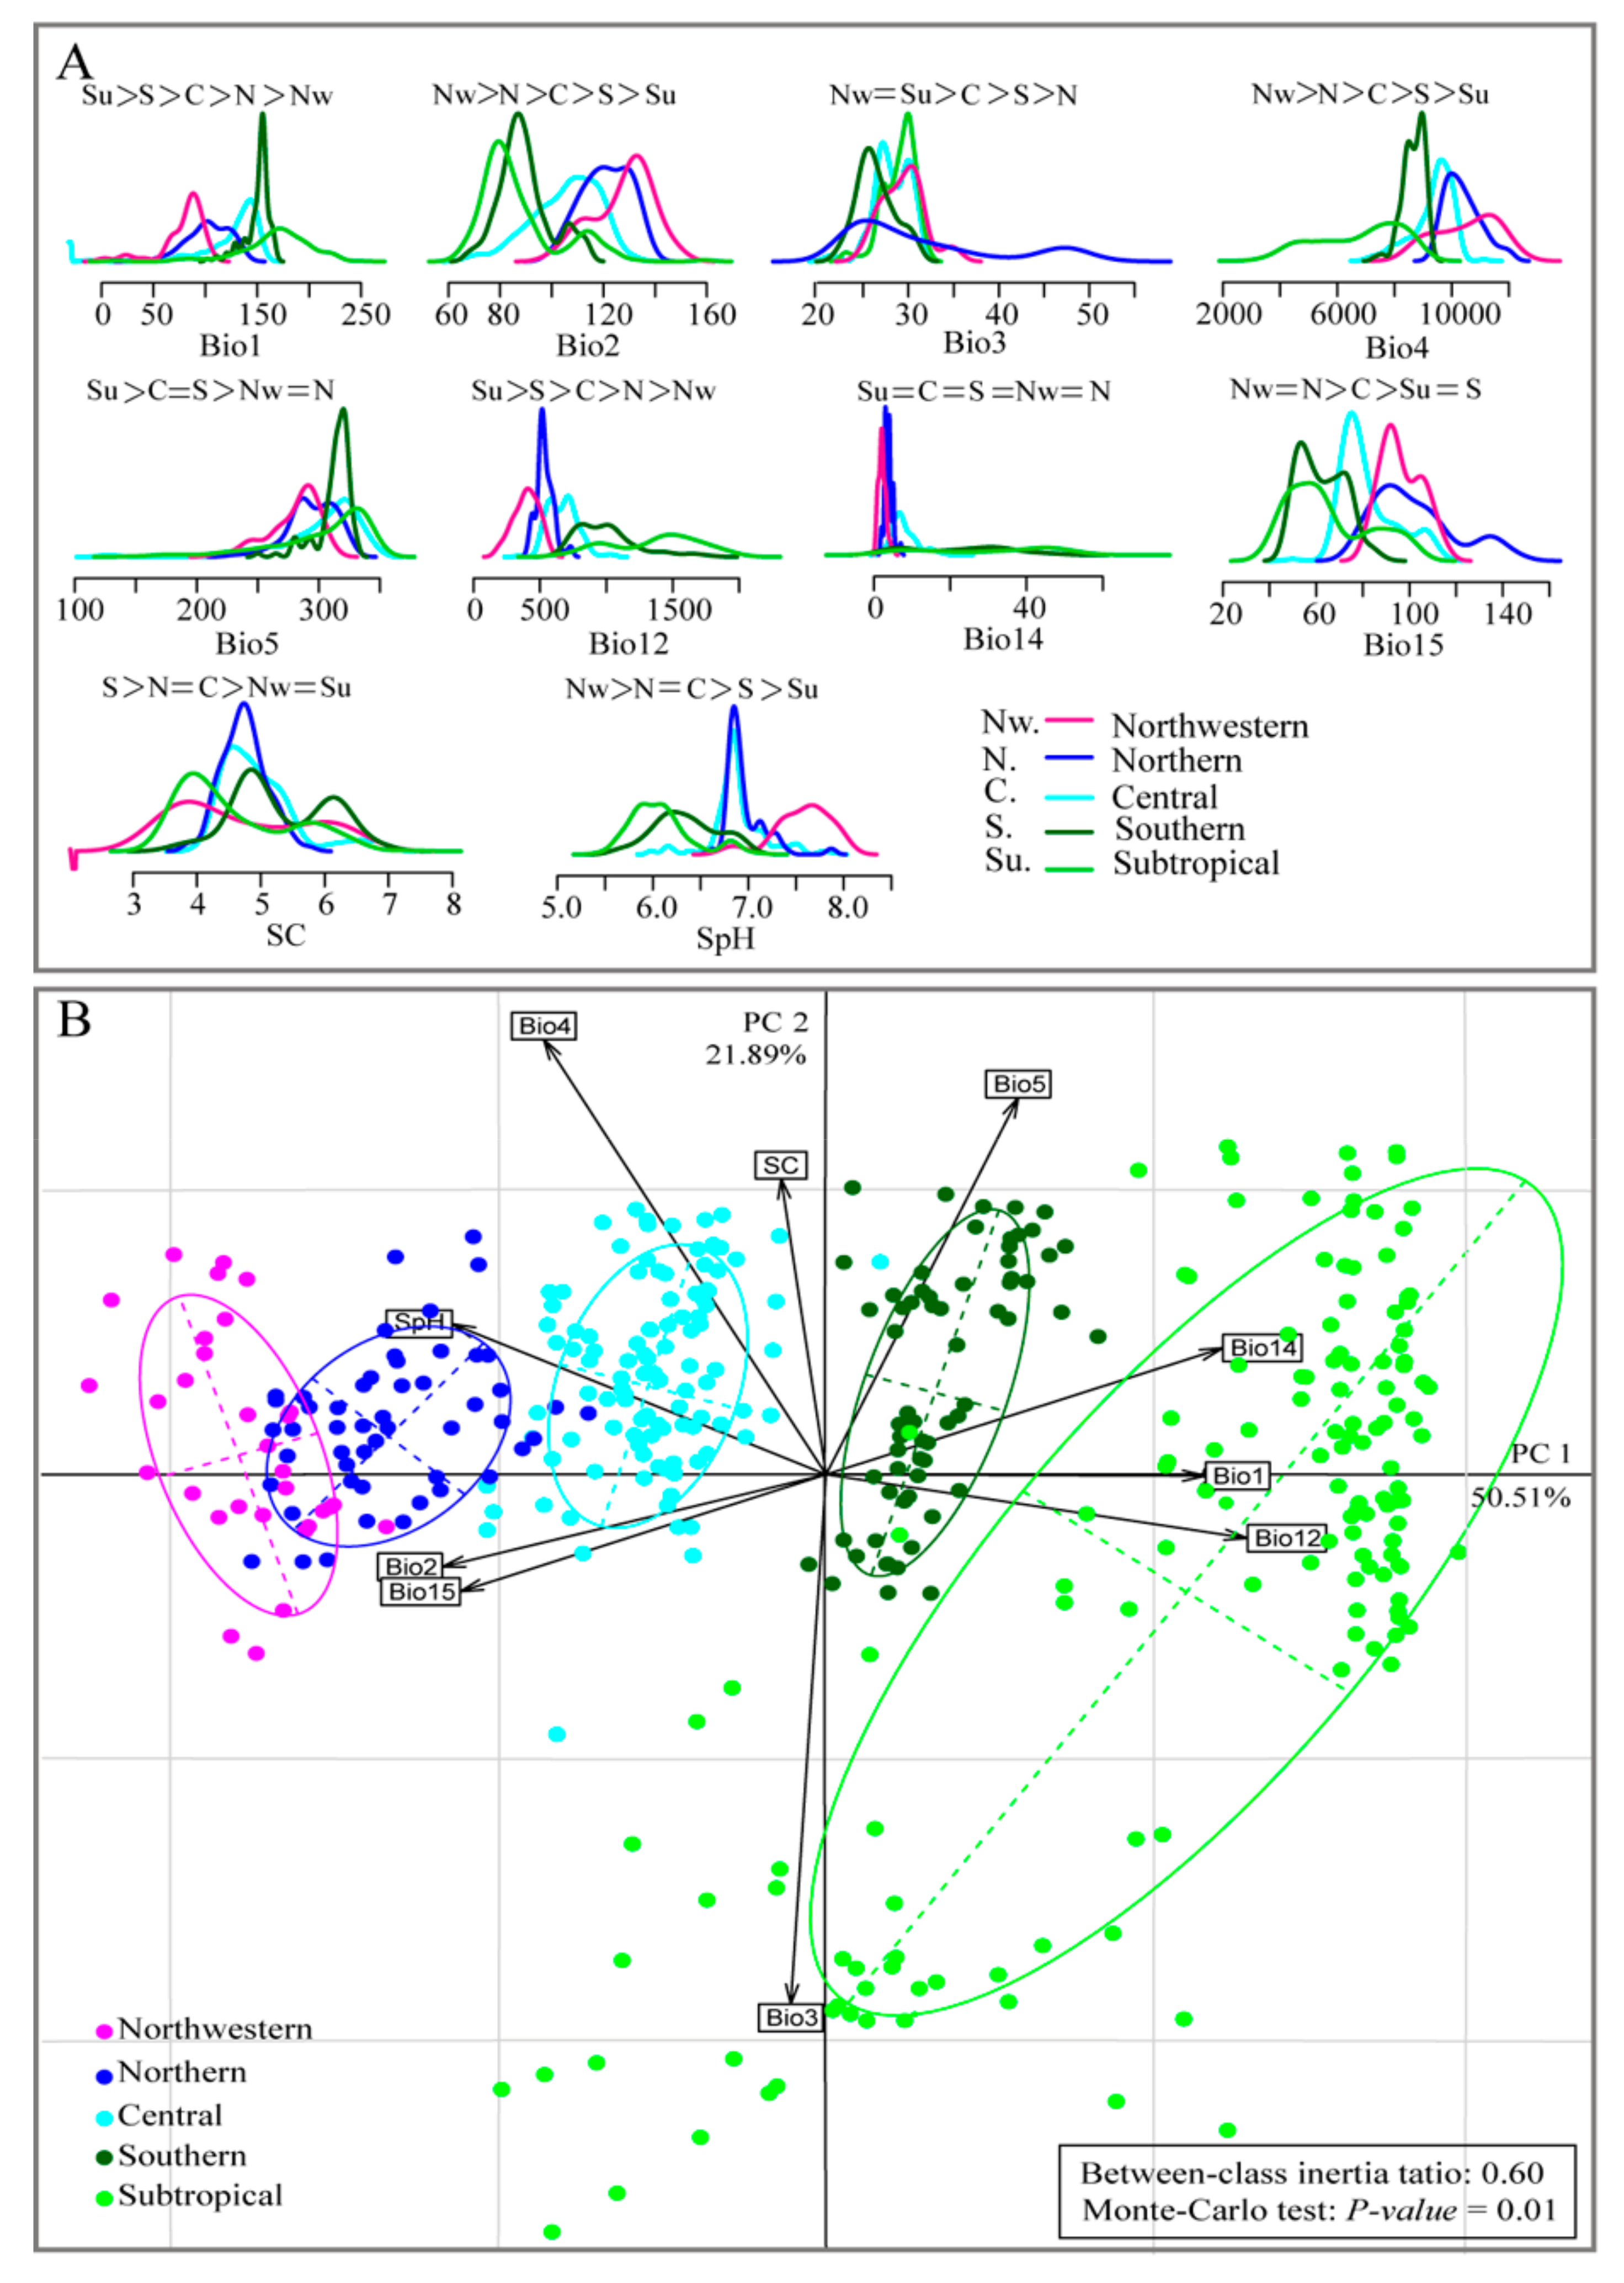
3.1. Testing for Niche Divergence

The locality records available for each seed zone were obtained after the species distribution raw data pre-proceeding, and we finally identified 31, 53, 106, 64, and 147 locality available geo-referenced occurrence records (401 in total) in Northwestern, Northern, Central, Southern, and Subtropical seed zones, respectively (Table S2). In accordance with the classification of the suitable habitats, substantial environmental variation among the five seed zones was detected, and the frequency distributions of individual variables within each seed zone are presented in the kernel density plots in Figure 1A. The between-seed zone identity for each of the 10 environment parameters was analyzed by the nonparametric Kruskal–Wallis multiple-range test, and revealed that each seed zone of P. orientalis had a different adaptability range to environment variables compared with another seed zone. PCA of the 10 environmental factors identified two components (with eigenvalues >1) that collectively explained 72.39% (50.51% and 21.89%) of the observed variation among the 401 occurrence records (see Figure 1B for the relative contribution of each environmental variable to PC1 and PC2 as illustrated in the PCA distance biplot). PC1 was closely associated with temperature and water availability, while PC2 was associated with temperature variability (e.g., bio3, bio4 and bio5). The 401 occurrence sites were clustered into five clearly separated environmental spaces in the Cartesian coordinates formed by the first two principal components, and the clustering correlated well with the current seed zones designations. The niche centroids diverged strongly among the five clusters (especially in PC1) with a between-group inertia value of 0.60 (p = 0.01; Figure 1B).
All ten pairwise comparisons indicated that the reduced niche axes were primarily associated with temperature and precipitation. All pairwise comparisons of seed zones indicated that divergence was supported along all niche axes (i.e., dn > db and dn is significant) and strongly suggested the presence of ecological differentiation among the seed zones (Table S3). For example, three axes (PC1, PC2 and PC3) were identified (each with an eigenvalue >1) and explained 78% of the total variation in Northern versus Northwestern; and 75% in Central versus Subtropical (Table S3). All niche axes (e.g., PC1) showed strong association with geographical variables (longitude, latitude, and altitude) in each pairwise comparison. Since this test reflects the niche differences after background extraction, the detected association could indicate true ecological preference between different seed zones, even though some of the differences are associated with geographic range. The main bioclimatic factors that defined the differentiated niche dimensions are likely to influence species distribution and habitat selection in nature.

3.2. Predicted Current Suitable Areas and Important Environmental Factors

Climate niche modeling for the five P. orientalis seed zones performed better than random, with average testing AUC values ranging from 0.965 to 0.991, indicating that the models performed well in predicting the suitable habitat of the seed zones. The “maximum training sensitivity plus specificity” threshold is 0.358 (test omission rate is 0.143) for the Northwestern seed zone, and 0.180 (0.250), 0.104 (0.038), 0.280 (0.188), and 0.190 (0.083) for Northern, Central, Southern, and Subtropical seed zones, respectively. We found that the predicted current suitable habitat distributions for the seed zones matched well to the actual ranges of the identified seed zones [35], with overlaps found in the margins of neighboring seed zones (Figure 2).
Among the 10 environmental variables used, some contributed more to the models than others. Across the five seed zones, the top contributing variables to the model were related to temperature or precipitation (Table 2 shows the contributions of the major bioclimatic variables (contributions > 10%) for each MaxEnt model of the five seed zones). Although the main influential factors are basically consistent and related to temperature and precipitation (e.g., Bio1 and Bio12), populations reacted differently to the different environment condition and this ultimately determined their geographic distributions.

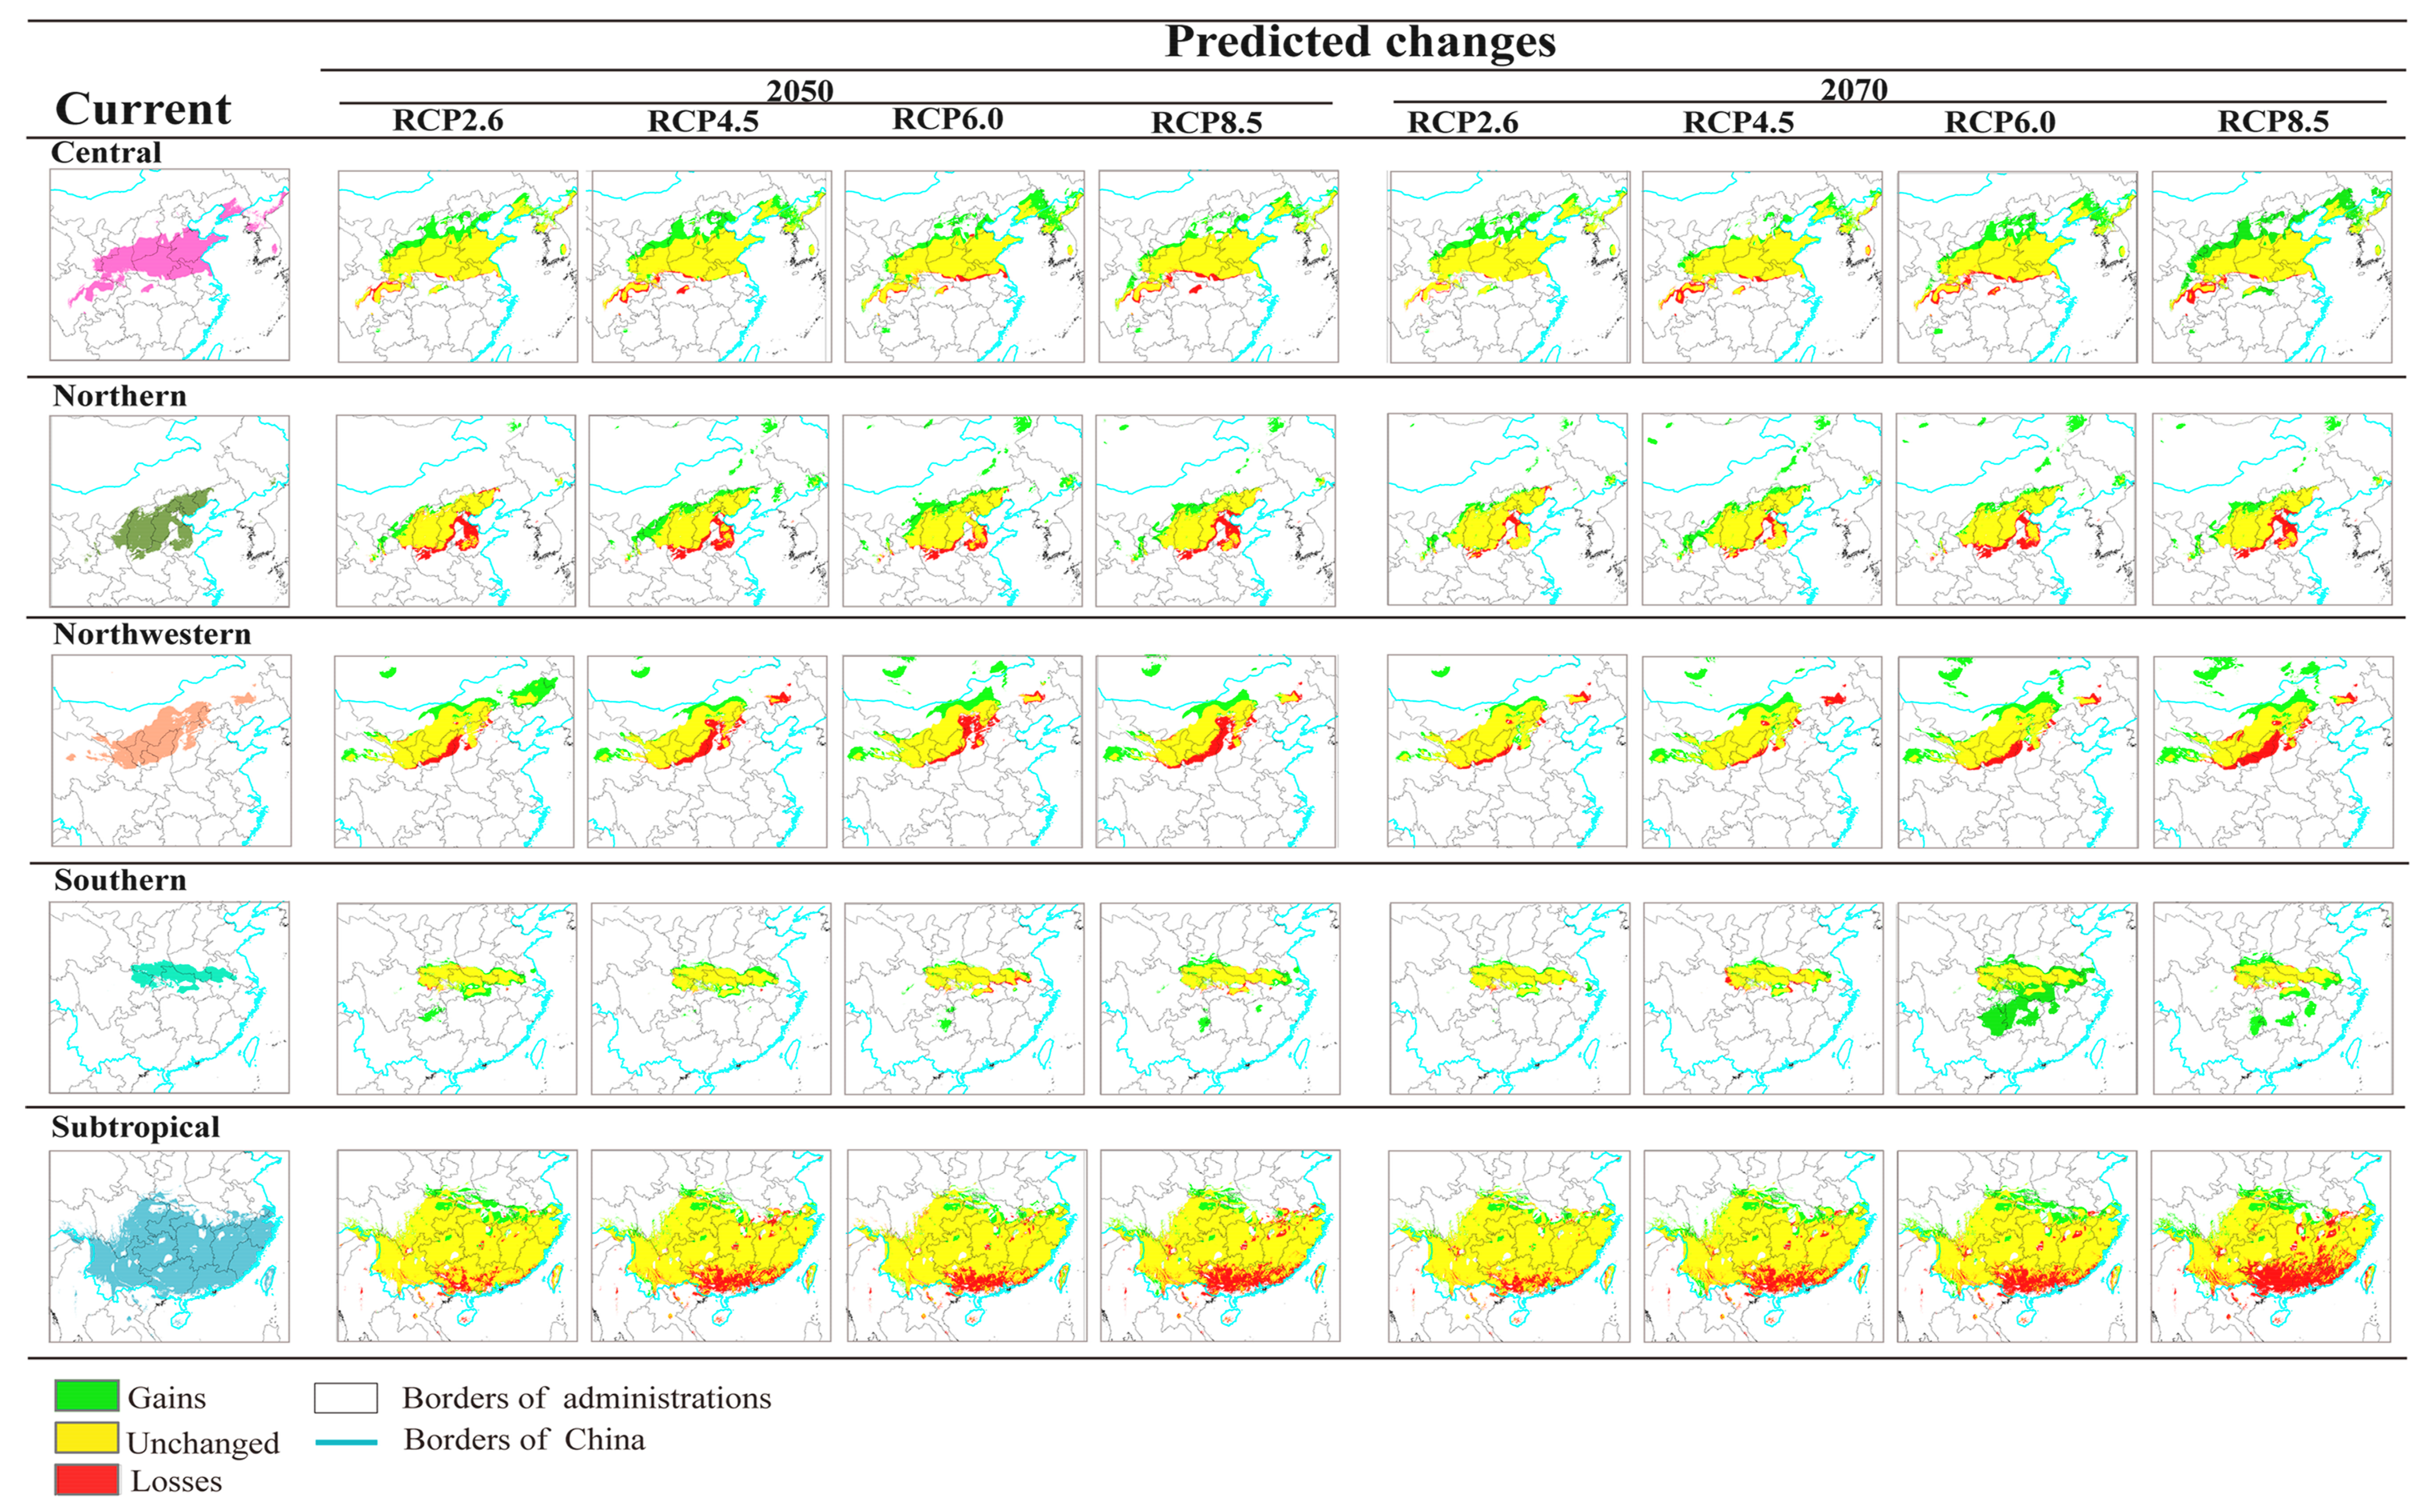
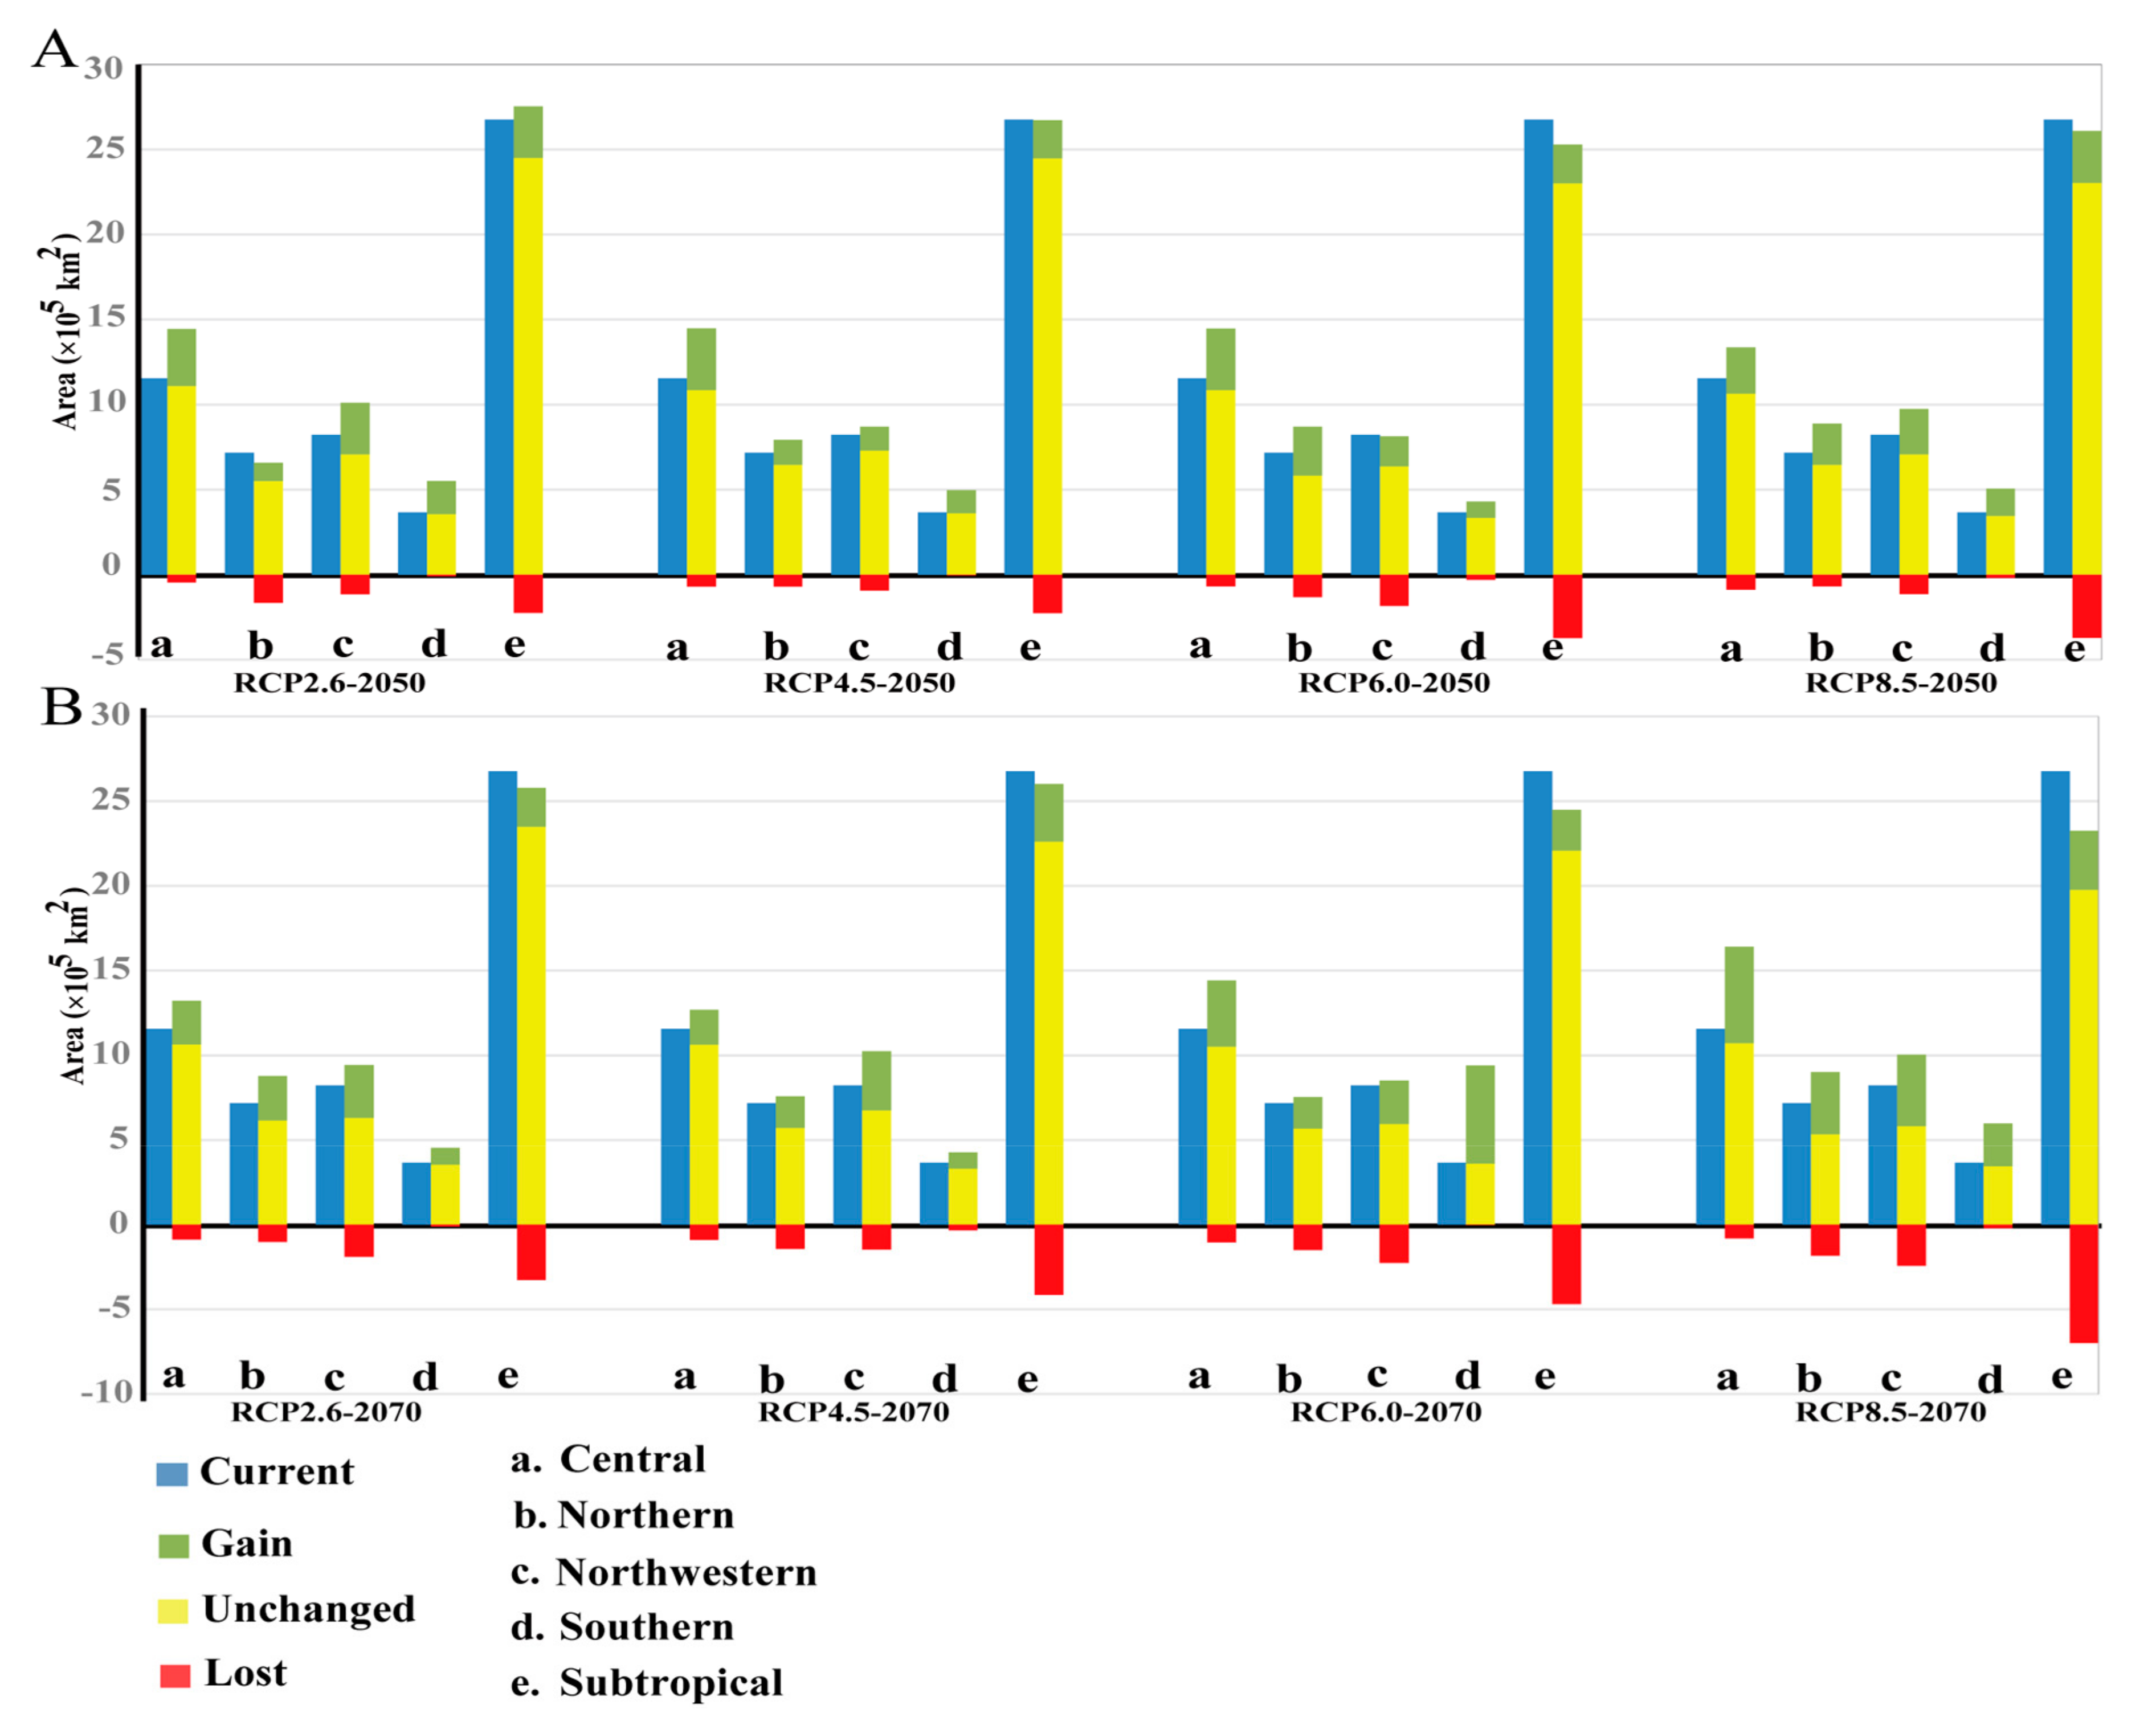
3.3. Projected Suitable Habitat and Habitat Shift under Future Climate Scenarios

Under the different future scenarios and periods (RCP2.6-2050, RCP2.6-2070, RCP4.5-2050, RCP4.5-2070, RCP6.0-2050, RCP6.0-2070, RCP8.5-2050, and RCP8.5-2070), the suitable habitat of the five seed zones were projected to respond differently (Figure S1). A certain level of range shift was projected for each seed zone and all the shifts were northward. Projected changes in seed zone areas were quite similar among all the seed zones (Figure 3). The loss of suitable habitats for most seed zones was projected in the southern distribution margins (red shades in Figure 3). For example, the Subtropical seed zone was expected to lose a large proportion of its suitable areas at the southern suitable habitat distribution margin (even greater than the suitable area gain); however, it gained suitable habitats in its northern distribution margin (green shades in Figure 3). These results are common characteristic across all seed zones where the most area gains are concentrated in the northern sections of the seed zones (higher altitudes).
Under the different future scenarios/years assessed, most seed zones were expected to experience elevational upward shift. The average elevation increase of Northern and Northwestern seed zones was expected to be greater than other seed zones: average elevation would rise to as much as 262 and 208 m (Table S4), respectively. The average elevation increase of Central and Southern seed zones is expected to show a smoother and smaller increase than other three seed zones, with an average of 83 m and maximum (RCP8.5-2070) of 148 m for the Central seed zone, and from 10 to 77 m for the Southern seed zone (Table S4). The average elevation change of the Subtropical seed zone was more volatile with large fluctuations when compared to other seed zones (range: 37 m–228 m with peak gain value appearing in RCP8.5-2070 and the lowest in RCP2.6-2050 (Table S4)).
The suitable habitat of Northern, Northwestern, Central, and Southern seed zones showed a certain amount of expansion; however, few exceptions existed (Figure 4 and Table S5). For example, the overall suitable habitat area of Northern and Northwestern seed zones was reduced by 8.2% and 1.0% in RCP2.6-2050 and RCP6.0-2070, respectively, representing the only seed zones with area reduction. Conversely, the suitable habitat of the Southern seed zone showed dramatic expansion with a maximum expansion of 157.9% in RCP6.0-2070. The Subtropical seed zone generally showed a decrease in the overall area under all future climate scenarios (but see, RCP2.6-2050) (Figure 4 and Table S5). With the anticipated increase in greenhouse gas intensity (e.g., RCP2.6 to RCP8.5), this is expected to cause a wave-like geographic area expansion pattern in the Central seed zone between 15.7% (minimum) and 25.4% (maximum) by 2050; and between 9.9% and 42.3% by 2070 (Figure 4 and Table S5). The responses of Northern and Northwestern seed zones to future climate scenarios were also similar with distribution expansion, but the magnitude of the geographic range change was expected to be more intense and unstable for 2070 projections (Figure 4 and Table S5). The Southern seed zone showed a dramatic increase in geographic area as compared to the other seed zones, with a 157.9% maximum expansion rate for RCP6.0-2070, between 17.6% and 50.6% in 2050, and between 17.3% and 157.9% in 2070 (Figure 4 and Table S5). The lower latitude Subtropical seed zone was the only zone showing a suitable habitat decrease under most future climate scenarios; this reduction was characterized to be intense and unstable in the longer term (2070), with the anticipated highest rate loss reaching 3.52 × 10⁵ km2 (13.2%) in RCP8.5-2070 (Figure 4 and Table S5). On the whole, the influence of future climate scenarios would be more substantial for lower latitude seed zones (i.e., Southern and Subtropical), with migration trends towards higher latitudes in the north being more obvious.

3.4. Seed Zones’ Suitable Habitat Centroid Shift in Future Climate

Under the same future scenarios/years, the shift of seed zone centroid in terms of distance and direction was different among the five seed zones. For instance, under future climate scenarios, the centroid of the Northwestern seed zone would move northwest, whereas the Subtropical centroid would move north (Figure S2). However, most of the centroids would move towards higher latitudes, a common feature when the different seed zones respond to climate change (Figure S2). While most seed zones’ suitable habitats appear to show a directional shift to more northerly latitudes, the magnitude and direction of their centroid shift differed under different future climate scenarios. However, exceptions existed, for example, the centroid of the Northern seed zone showed a shift to lower altitude regain in RCP2.6-2070, illustrating the complex effects of climate change and the uncertainty of biological response (Figure S2).

4. Discussion

Building on previous work assessing the impact of climate change at the species level, in the present study, we individually assessed such impact at population level represented by seed zones of P. orientalis, which is the unit directly relevant to the selection of seed sources for afforestation and reforestation practices. We found that the five seed zones were climatically diverged and responded differently to future climates. The pattern and magnitude of the climate change impact on suitable habitat at the seed zone level, which we revealed in this study, would not be detectable at the species level. We believe that this work constitutes a step forward in providing a scientific basis for developing forest management strategies for adaptation to climate change.
Previous studies have clearly illustrated that substantial differences exist among P. orientalis populations due to local adaptation, for example, inherent among provenance variation [69,70], environmental gradient variation (e.g., altitude and latitude) [35], the rapid growth rate and poor drought and cold resistance of eastern and southern populations, strong drought resistance of northern and northwestern provenances [44]; sensitivity of southern and eastern populations to freezing injury [71]. The results of our simulation have shown that all P. orientalis seed zones would experience habitat loss in the south of the original seed zone area (~0.7–26.1%), and habitat gain in the north (~8.3–158.7%), while about 87% of the original seed zones remained unchanged. The differences in suitable habitat expansion among seed zones under the future climate scenarios/years were also projected in the present study, and confirm the dynamic nature of the current and future ranges of different seed zones. Therefore, seed sources should be managed at population or seed zone level when considering habitat suitability for given species.
When studying the impacts of future climate change on widespread conifer species, such as P. orientalis, populations’ local adaptation should be considered as an integral part of the assessment, otherwise the impact may be underestimated. Indeed, such results which were reported for P. orientalis in response to climate change in the absence of local adaptation were estimated to be limited to only 3% of the whole suitable habitat [15]. However, within a widespread species, different populations often experience different environmental conditions, triggering variable local adaptation and responses to climate change [72]. In the present study, the rate of areal change of each seed zone averaged a gain of 32.1% and loss of 12.7%, substantially greater than that reported when the entire species was considered as a whole [15], suggesting higher vulnerability at the seed zone level than at the species level for this species. Additionally, when projected at the species level, the loss of suitable habitats is only projected in the south (low latitudes), and the gain in the north (high latitudes) [15]. In the present study, we gained more valuable information about habitat shift and potentially suitable seed sources under future climate by prediction at the seed zone level. For example, we projected that the most suitable seed for the south of the Northern and Northwestern seed zone would come from the Central seed zone in the future, and the most suitable seed for the south of the Central seed zone would come from the Southern zone in the future. Niche modeling studies suggested that the widespread species with their large population sizes, broad geographic distributions, and high fecundity may have broader adaptability to climate change, therefore, the overall change is relatively small [10,73]. Seed zones representing a restricted geographic region with local adapted populations make them more susceptible to climate change, thus strengthening our approach for assessing climate change impact at the seed zone level.
The contrasting prediction for the Southern and Subtropical seed zones with their anticipated substantial expansion (with a minimum expansion rate of 17.3%) and contraction (overall, areas generally showed a decrease under all future climate scenarios) of suitable habitat is of interest, specifically when compared to the other seed zones. The emergence of these two extremes may be attributable to their lower latitude compared to other seed zones. Populations located in the northern subtropical and mid-subtropical humid areas may experience greater precipitation and temperature under climate change [74]; this situation was predicted in our study as we concluded that Bio12 (annual precipitation) and Bio1 (annual mean air temperature) were the major bioclimatic variables contributing to the potential suitable habitat geographic distribution areas. Results consistent with previous studies indicate that trees located on the southern edge of their distributional range are expected to display growth declines, while increased growth is anticipated for those on the northern edge [19,64,75,76,77].
A commonly observed pattern in biogeography is that populations become less abundant toward a species’ range periphery, and there are also differences in responses to climate changes [78,79]. However, studies have increasingly found that genetic variability is not correlated with population location with respect to the range periphery [80,81,82]. We did not find substantial difference in response to climate change between central and peripheral seed zones. Dozens of studies have similar results, e.g., Wagner et al. analyzed AFLP fingerprint patterns in 319 individuals from 20 large and abundant populations in the core, in Kazakhstan, and 23 small and isolated populations at the periphery, in Central Europe, and they found that the central and peripheral populations did not differ in genetic diversity [80]; Garner et al. carried out an investigation of population genetic diversity in a vertebrate species, the Italian agile frog, Rana latastei, sampled comprehensively across its entire range, and found that genetic variability is not correlated with population location with respect to the range periphery [81]; Eckert et al. found that the difference in genetic diversity between the central and peripheral population was not large, after reviewing 134 studies representing 115 species that tested for declines in within-population genetic diversity and/or increases in among-population differentiation towards range margins using nuclear molecular genetic markers [82].
The current seed zone and seed transfer protocols of P. orientalis were developed through provenance testing trials conducted in the 1980s [35]; however, climate change has the potential to cause changes for each seed zone. Our study predictions are in line with previous studies indicating that species in the northern hemispheres are expected to migrate to higher latitudes and elevations as the climate warms [10,83,84], therefore, it is essential to adjust seed zone protocols for the spatial and temporal dynamics associated with current climate change. For reforestation practitioners, providing information about climatic change impacts on species’ suitable habitat distribution is essential for proper decision making. Decisions such as adopting assisted migration are important since seed transfer guidelines are needed for the development of safe transfer distances which are necessary to avoid maladaptation [85]. Our study provides a reference point for the adjustment of seed sourcing under future climates by showing that most P. orientalis seed zones will shift to higher elevations and more northerly latitudes and also points out the anticipated migration direction and spatial dynamics of the seed zones which may prove useful in seed sourcing adjustment. These changes suggest that moderate distance migration could contribute to maintaining or possibly increasing P. orientalis productivity through properly matching seed sources to the anticipated new climatic conditions. For the two future time periods (2050 and 2070), we projected the future climatic suitability distributions for each seed zone under four future climate scenarios. These projections provided comprehensive information for guidance in seed resource allocation. For example, the areas in the north of the Northern seed zone (northwestern Shaanxi province and northern Shanxi and Hebei provinces) are not suitable for P. orientalis under current climate conditions. However, they would be suitable for the seeds from the Northern seed zone in the case of the future climate scenario of RCP2.6 in 2050. Similarly, the areas in the south of the Northern seed zone (north of Henan and Shandong provinces, and south of Hebei province) would be suitable for seeds from the Central seed zone under the same scenario.
We projected that the climate habitat for P. orientalis seed zones is expected to experience average geographic area gain and loss of 32.1% and 12.7%, respectively, relative to the seed zones’ original areas, resulting in total seed zone expansion as the climate becomes more suitable at higher elevations and latitudes. Our findings agree with previous projections, such as those made for Douglas-fir (Pseudotsuga menziesii) in British Columbia, Canada, where more dramatic expansion was projected as the northeastern boreal ecosystem climate transitioned to a climate suitable for interior Douglas-fir ecosystems [83]. Substantial expansion was also predicted for grasslands, dry forests, and moist continental cedar–hemlock forests in northwestern Canada in the future (2020s, 2050s, 2080s) [84]. P. orientalis is commonly used for ecological restoration in arid mountain landscapes of northern China, where the species is used for sand stabilization and soil erosion control. Expansion of the future climatic suitable habitats for P. orientalis seed zones suggests that it would be appropriate to reforest at logged sites or barren mountains with this species over a much larger geographic area than in the past. According to Chinese vegetation division (http://www.nsii.org.cn/mapvege), part of the temperate grass zones and mid temperate desert climate zone will be suitable for this conifer. The ecological risks of P. orientalis range expansion are considered sufficiently low because of its relatively slow growth rate. Thus, P. orientalis does not pose a threat to the growth of other species. P. orientalis is often the preferred choice for afforestation in barren hill and ecological restoration in north China and there is social acceptance of this expansion in public lands [31,33], therefore, our research is a significant step towards facilitating increased planting over larger areas. Our research gives a comprehensive forecast for four possible climate change scenarios by providing a complete statistical and detailed analysis of the areal changes, the spatial shifts, and the migration path of the geometric center for all P. orientalis seed zones.
Our present study provides a useful basis for forest management purposes (i.e., reforestation, seeds allocation and assisted migration) for P. orientalis. Further studies should involve the collection of more distributional data within seed zones, more data from provenance trials and genomic information of genetic variations to refine the delineation of the seed zones and to re-assess their adaptability to a changing climate. Furthermore, we recommend that future studies should also employ phylogeographic analyses of P. orientalis’ intraspecific variation and local adaptation to better understand how past range expansion and contraction events contribute to genetic variation among current seed zones.

5. Conclusions

A climate niche model was developed and used for projecting the geographic distributions of a suitable climate habitat for future climates for each of the five P. orientalis seed zones under various climate change scenarios. Differences were detected among the five seed zones in terms of climate niches and their future projections. Substantial shifts in the geographic distributions of their suitable climate habitats are expected to occur in the next 50 to 70 years and provided evidence of a gain in the net area suitable for P. orientalis. Assisted migration is recommended to match seed sources to their suitable habitats, thus revision of the existing seed transfer guidelines is needed.

Supplementary Materials

The following are available online at www.mdpi.com/1999-4907/8/12/471/s1, Figure S1: Projected suitable habitats for five seed zones in eight future climate scenarios/years. Each row corresponds the simulation results under one future climate scenario; each column represents a seed zone. Figure S2: The centroid shifts of the seed zone habitats under future climate scenarios/years. (A) The centroid shift of the Northwestern seed zone; (B) The centroid shift of the Northern seed zone; (C) The centroid shift of the Central seed zone; (D) The centroid shift of the Southern seed zone; (E) The centroid shift of the Subtropical seed zone. Table S1: Part of the detailed provenance tests data of p. orientalis. Table S2: Occurrence records of P. orientalis in five seed zones used for ecological modeling. Table S3: Divergence on independent niche axes between group pairs. Table S4: The average altitude changes of five seed zones under the different future climate scenarios/years. Table S5: Dynamics of spatial changes of predicted habitats for the five seed zones under future climate scenarios/years.

Acknowledgments

This study was funded by Fundamental Research Funds for the Central Universities (No. YX2013-41). We thank Prof. Xiao-Ru Wang and Prof. Xiang-Yang Kang for their valuable suggestions.

Author Contributions

J.-F.M., T.W., Y.A.E.-K. and Y.L. conceived and designed the study; X.-G.H., S.-S.L., S.-Q.J., K.-H.J., S.-S.Z. and Y.J. conducted the experiments; X.-G.H., J.-F.M., T.W., and Y.A.E.-K. wrote the manuscript.

Conflicts of Interest

The authors declare no conflict of interest.

References

  1. Woodward, F.I.; Williams, B.G. Climate and plant-distribution at global and local scales. Vegetatio 1987, 69, 189–197. [Google Scholar] [CrossRef]
  2. Peterson, A.T.; Soberon, J.; Sanchez-Cordero, V. Conservatism of ecological niches in evolutionary time. Science 1999, 285, 1265–1267. [Google Scholar] [CrossRef] [PubMed]
  3. Pearson, R.G.; Dawson, T.P. Predicting the impacts of climate change on the distribution of species: Are bioclimate envelope models useful? Glob. Ecol. Biogeogr. 2003, 12, 361–371. [Google Scholar] [CrossRef]
  4. Araujo, M.B.; Peterson, A.T. Uses and misuses of bioclimatic envelope modeling. Ecology 2012, 93, 1527–1539. [Google Scholar] [CrossRef] [PubMed]
  5. Parmesan, C. Ecological and evolutionary responses to recent climate change. Annu. Rev. Ecol. Evol. Syst. 2006, 37, 637–669. [Google Scholar] [CrossRef]
  6. Allen, S.K.; Plattner, G.-K.; Nauels, A.; Xia, Y.; Stocker, T.F. Climate change 2013: The physical science basis. An overview of the working group 1 contribution to the fifth assessment report of the intergovernmental panel on climate change (IPCC). In Proceedings of the European Geosciences Union (EGU) General Assembly Conference, Vienna, Austria, 7–12 April 2013; EGU General Assembly Conference Abstracts. Cambridge University Press: New York, NY, USA, 2013; Volume 16, pp. 143–151. [Google Scholar]
  7. Wang, T.; Wang, G.; Innes, J.; Nitschke, C.; Kang, H. Climatic niche models and their consensus projections for future climates for four major forest tree species in the Asia-Pacific region. For. Ecol. Manag. 2016, 360, 357–366. [Google Scholar] [CrossRef]
  8. Rehfeldt, G.E.; Jaquish, B.C.; Lopez-Upton, J.; Saenz-Romero, C.; St Clair, J.B.; Leites, L.P.; Joyce, D.G. Comparative genetic responses to climate for the varieties of Pinus ponderosa and Pseudotsuga menziesii: Realized climate niches. For. Ecol. Manag. 2014, 324, 126–137. [Google Scholar] [CrossRef]
  9. Booth, T.H. Estimating potential range and hence climatic adaptability in selected tree species. For. Ecol. Manag. 2016, 366, 175–183. [Google Scholar] [CrossRef]
  10. Aitken, S.N.; Yeaman, S.; Holliday, J.A.; Wang, T.; Curtis-McLane, S. Adaptation, migration or extirpation: Climate change outcomes for tree populations. Evol. Appl. 2008, 1, 95–111. [Google Scholar] [CrossRef] [PubMed]
  11. Gray, L.K.; Gylander, T.; Mbogga, M.S.; Chen, P.Y.; Hamann, A. Assisted migration to address climate change: Recommendations for aspen reforestation in western Canada. Ecol. Appl. 2011, 21, 1591–1603. [Google Scholar] [CrossRef] [PubMed]
  12. Keenan, R.J. Climate change impacts and adaptation in forest management: A review. Ann. For. Sci. 2015, 72, 145–167. [Google Scholar] [CrossRef]
  13. Kawecki, T.J. Adaptation to marginal habitats. Annu. Rev. Ecol. Evol. Syst. 2008, 39, 321–342. [Google Scholar] [CrossRef]
  14. Banta, J.A.; Ehrenreich, I.M.; Gerard, S.; Chou, L.; Wilczek, A.; Schmitt, J.; Kover, P.X.; Purugganan, M.D. Climate envelope modelling reveals intraspecific relationships among flowering phenology, niche breadth and potential range size in Arabidopsis thaliana. Ecol. Lett. 2012, 15, 769–777. [Google Scholar] [CrossRef] [PubMed]
  15. Hu, X.-G.; Jin, Y.; Wang, X.-R.; Mao, J.-F.; Li, Y. Predicting impacts of future climate change on the distribution of the widespread conifer Platycladus orientalis. PLoS ONE 2015, 10. [Google Scholar] [CrossRef] [PubMed]
  16. Khanum, R.; Mumtaz, A.; Kumar, S. Predicting impacts of climate change on medicinal asclepiads of Pakistan using maxent modeling. Acta Oecol. 2013, 49, 23–31. [Google Scholar] [CrossRef]
  17. O’Neill, G.A.; Hamann, A.; Wang, T. Accounting for population variation improves estimates of the impact of climate change on species’ growth and distribution. J. Appl. Ecol. 2008, 45, 1040–1049. [Google Scholar] [CrossRef]
  18. Coops, N.; Waring, R. Assessing forest growth across southwestern Oregon under a range of current and future global change scenarios using a process model, 3-pg. Glob. Chang. Biol. 2001, 7, 15–29. [Google Scholar] [CrossRef]
  19. Briceno-Elizondo, E.; Garcia-Gonzalo, J.; Peltola, H.; Matala, J.; Kellomäki, S. Sensitivity of growth of Scots pine, Norway spruce and Silver birch to climate change and forest management in boreal conditions. For. Ecol. Manag. 2006, 232, 152–167. [Google Scholar] [CrossRef]
  20. Howe, G.T.; Aitken, S.N.; Neale, D.B.; Jermstad, K.D.; Wheeler, N.C.; Chen, T.H. From genotype to phenotype: Unraveling the complexities of cold adaptation in forest trees. Can. J. Bot. 2003, 81, 1247–1266. [Google Scholar] [CrossRef]
  21. Valladares, F.; Matesanz, S.; Guilhaumon, F.; Araújo, M.B.; Balaguer, L.; Benito-Garzón, M.; Cornwell, W.; Gianoli, E.; Kleunen, M.; Naya, D.E. The effects of phenotypic plasticity and local adaptation on forecasts of species range shifts under climate change. Ecol. Lett. 2014, 17, 1351–1364. [Google Scholar] [CrossRef] [PubMed] [Green Version]
  22. Carter, K. Provenance tests as indicators of growth response to climate change in 10 north temperate tree species. Can. J. For. Res. 1996, 26, 1089–1095. [Google Scholar] [CrossRef]
  23. Mátyás, C. Modeling climate-change effects with provenance test data. Tree Physiol. 1994, 14, 797–804. [Google Scholar] [CrossRef] [PubMed]
  24. Serra-Varela, M.J.; Alía, R.; Daniels, R.R.; Zimmermann, N.E.; Gonzalo-Jiménez, J.; Grivet, D. Assessing vulnerability of two mediterranean conifers to support genetic conservation management in the face of climate change. Divers. Distrib. 2017, 23, 507–516. [Google Scholar] [CrossRef]
  25. Wang, T.; Hamann, A.; Yanchuk, A.; O’Neill, G.A.; Aitken, S.N. Use of response functions in selecting Lodgepole pine populations for future climates. Glob. Chang. Biol. 2006, 12, 2404–2416. [Google Scholar] [CrossRef]
  26. Morgenstern, E.K.B. Geographic Variation in Forest Trees: Genetic Basis and Application of Knowledge in Silviculture, 1st ed.; University of British Columbia Press: Vancouver, BC, Canada, 1996; pp. 106–111. [Google Scholar]
  27. Parker, W.H. Focal point seed zones: Site-specific seed zone delineation using geographic information systems. Can. J. For. Res. 1992, 22, 267–271. [Google Scholar] [CrossRef]
  28. Hamann, A.; Gylander, T.; Chen, P.Y. Developing seed zones and transfer guidelines with multivariate regression trees. Tree Genet. Genomes 2011, 7, 399–408. [Google Scholar] [CrossRef]
  29. McKenney, D.; Pedlar, J.; O’Neill, G. Climate change and forest seed zones: Past trends, future prospects and challenges to ponder. For. Chron. 2009, 85, 258–266. [Google Scholar] [CrossRef]
  30. Williams, M.I.; Dumroese, R.K. Preparing for climate change: Forestry and assisted migration. J. For. 2013, 111, 287–297. [Google Scholar] [CrossRef]
  31. The Editorial Board of Forest in China. Coniferous forests. In Forest in China, 1st ed; Wu, Z.L. (Ed.) China Forestry Publishing House: Beijing, China, 1998; Volume 2, p. 1065. [Google Scholar]
  32. Delectis Florae Reipublicae Popularis Sinicae Agendae Academiae Sinicae Edita. Cupressaceae. In Flora Reipublicae Popularis Sinicae, 1st ed; Science Press: Beijing, China, 1978; Volume 7, pp. 322–325. (In Chinese)
  33. Dong, T.M.; Chen, X.Y.; Zhang, X.M.; Li, Z.R.; Kong, W.H.B. Platycladus orientalis, 1st ed.; Henan Science and Technology Press: Zhengzhou, China, 1990; pp. 16–59. (In Chinese) [Google Scholar]
  34. Wu, X.-M. Geographic variation of Platycladus orientalis (L.) franco. J. Beijing For. Univ. 1986, 8, 1–16. (In Chinese) [Google Scholar]
  35. Shi, W.; Shi, X. Seed Zones of Chinese Forest Trees—Seed zones of Platycladus orientalis (Linn.) Franco. Available online: http://www.spsp.gov.cn/page/P393/71.shtml (accessed on 28 August 2017). (In Chinese)
  36. Liang, Y.; Chen, Z. Geographical variation trend of Platycladus orientalis provenances. J. Fujian Coll. For. 1989, 9, 134–139. (In Chinese) [Google Scholar]
  37. Fu, J.; Shen, X. Study on the variation of seed and seedling characters among different Platycladus orientalis provenances. J. Beijing For. Univ. 1987, 2, 133–139. (In Chinese) [Google Scholar]
  38. Fu, J.; Shen, X. Study on the growth rhythm of seedling height in Platycladus orientalis’s provenance tests. J. Beijing For. Univ. 1989, 2, 72–79. (In Chinese) [Google Scholar]
  39. The National Cooperation Group of Platycladus orientalis. Study on the Seedling Growth and Overwintering Characters of National Platycladus orientalis Provenances. J. Beijing For. Univ. 1986, 2, 72–79. (In Chinese) [Google Scholar]
  40. Chen, X.; Shen, X.; Shi, W. The growth and overwintering performance of different provenances’ Platycladus orientalis in Beijing. J. Beijing Univ. Agric. 1990, 1, 19–27. (In Chinese) [Google Scholar]
  41. Chen, X.; Shen, X. Study on the afforestation survival rate and growth variation of young forest of Platycladus orientalis. J. Beijing For. Univ. 1994, 1, 20–29. (In Chinese) [Google Scholar]
  42. Wu, X.; Ma, J. The differences of photosynthetic characteristics and the responses of seed germination to water stress among different provenances of Platycladus orientalis. Sci. Silvae Sin. 1988, 4, 448–453. (In Chinese) [Google Scholar]
  43. Luo, W.-X.; He, W.-X.; Zhou, J.-L. Studies on the provenance trial of Platycladus orientalis (L.) at seedling stage. Shaanxi For. Sci.Techonl. 1988, 16, 1–6. (In Chinese) [Google Scholar]
  44. Shi, X.-B.; Qu, X.-K. Studies on the provenance trial of Platycladus orientalis (L.) at seedling stage. For. Sci. Technol. 1987, 7, 15–16. (In Chinese) [Google Scholar]
  45. Wang, R.-Z.; Wang, M. Preliminary report on provenance test on Platycladus orientalis (L.). J. Hebei For. Sci. Technol. 1990, 18, 30–34. (In Chinese) [Google Scholar]
  46. Nunes, L.A.; Pearson, R.G. A null biogeographical test for assessing ecological niche evolution. J. Biogeogr. 2017, 44, 1331–1343. [Google Scholar] [CrossRef]
  47. Farber, O.; Kadmon, R. Assessment of alternative approaches for bioclimatic modeling with special emphasis on the mahalanobis distance. Ecol. Model. 2003, 160, 115–130. [Google Scholar] [CrossRef]
  48. Hijmans, R.J.; Van Etten, J.R. Geographic Analysis and Modeling with Raster Data: R Package. Available online: https://cran.r-project.org/web/packages/raster/raster.pdf (accessed on 28 August 2017).
  49. Ihaka, R.; Gentleman, R. R: A language for data analysis and graphics. J. Comput. Graph. Stat. 1996, 5, 299–314. [Google Scholar]
  50. Hijmans, R.J.; Cameron, S.E.; Parra, J.L.; Jones, P.G.; Jarvis, A. Very high resolution interpolated climate surfaces for global land areas. Int. J. Climatol. 2005, 25, 1965–1978. [Google Scholar] [CrossRef]
  51. Mao, J.-F.; Wang, X.-R. Distinct niche divergence characterizes the homoploid hybrid speciation of Pinus densata on the Tibetan plateau. Am. Nat. 2011, 177, 424–439. [Google Scholar] [CrossRef] [PubMed]
  52. Flato, G.; Marotzke, J.; Abiodun, B.; Braconnot, P.; Chou, S.C.; Collins, W.; Cox, P.; Driouech, F.; Emori, S.; Eyring, V.; et al. Evaluation of climate models. In Climate Change 2013: The Physical Science Basis. Contribution of Working Group i to the Fifth Assessment Report of the Intergovernmental Panel on Climate Change, 1st ed.; Cambridge University Press: London, UK, 2013; Volume 9, pp. 741–866. [Google Scholar]
  53. Weyant, J.; Azar, C.; Kainuma, M.; Kejun, J.; Nakicenovic, N.; Shukla, P.; La Rovere, E.; Yohe, G. Report of 2.6 VERSUS 2.9 watts/m2 rcpp Evaluation Panel; Technical Report; Intergovernmental Panel on Climate Change (IPCC): Geneva, Switzerland, 2009. [Google Scholar]
  54. Conover, W. Practical nonparametric statistics. Q. Rev.Biol. 1971, 14, 332–333. [Google Scholar]
  55. Anderson, M.J.; Robinson, J. Permutation tests for linear models. Aust. N. Z. J. Stat. 2001, 43, 75–88. [Google Scholar] [CrossRef]
  56. Romesburg, H.C. Exploring, confirming, and randomization tests. Comput. Geosci. 1985, 11, 19–37. [Google Scholar] [CrossRef]
  57. McCormack, J.E.; Zellmer, A.J.; Knowles, L.L. Does niche divergence accompany allopatric divergence in Aphelocoma jays as predicted under ecological speciation?: Insights from tests with niche models. Evolution 2010, 64, 1231–1244. [Google Scholar] [PubMed]
  58. Hijmans, R.J.; Phillips, S.; Leathwick, J.; Elith, J. Dismo: Species Distribution Modeling. R Package Version 1.0-12. 2015. Available online:http://cran. r-project. org (accessed on 28 August 2017).
  59. Dray, S.; Dufour, A.; Leeuw, J.D.; Zeileis, A. The Ade4 Package: Implementing the Duality Diagram for Ecologists. J. Stat. Softw. 2007, 22, 1–20. [Google Scholar] [CrossRef]
  60. Fay, M.P.; Shaw, P.A. Exact and asymptotic weighted logrank tests for interval censored data: The interval R package. J. Stat. Softw. 2010, 36, 1–34. [Google Scholar] [CrossRef]
  61. Phillips, S.J.; Anderson, R.P.; Schapire, R.E. Maximum entropy modeling of species geographic distributions. Ecol. Model. 2006, 190, 231–259. [Google Scholar] [CrossRef]
  62. Jane, E.; Catherine, H.G.; Robert, P.A.; Miroslav, D.; Simon, F.; Antoine, G.; Robert, J.H.; Falk, H.; John, R.L.; Anthony, L.; et al. Novel methods improve prediction of species’ distributions from occurrence data. Ecography 2006, 29, 129–151. [Google Scholar]
  63. Kumar, S.; Stohlgren, T.J. Maxent modeling for predicting suitable habitat for threatened and endangered tree Canacomyrica monticola in New Caledonia. J. Ecol. Nat. Environ. 2009, 1, 94–98. [Google Scholar]
  64. Pearson, R.G.; Raxworthy, C.J.; Nakamura, M.; Townsend Peterson, A. Predicting species distributions from small numbers of occurrence records: A test case using cryptic geckos in Madagascar. J. Biogeogr. 2007, 34, 102–117. [Google Scholar] [CrossRef]
  65. Elith, J.; Phillips, S.J.; Hastie, T.; Dudík, M.; Chee, Y.E.; Yates, C.J. A statistical explanation of maxent for ecologists. Divers. Distrib. 2011, 17, 43–57. [Google Scholar] [CrossRef]
  66. Fielding, A.H.; Bell, J.F. A review of methods for the assessment of prediction errors in conservation presence/absence models. Environ. Conserv. 1997, 24, 38–49. [Google Scholar] [CrossRef]
  67. Swets, J.A. Measuring the accuracy of diagnostic systems. Science 1988, 240, 1285–1293. [Google Scholar] [CrossRef] [PubMed]
  68. Brown, J.L. Sdmtoolbox: A python-based gis toolkit for landscape genetic, biogeographic and species distribution model analyses. Methods Ecol. Evol. 2014, 5, 694–700. [Google Scholar] [CrossRef]
  69. Chen, X.; Shen, X. The study on afforestation survival rate of Platycladus orientalis provenances and genetic variation for growth traits of yong forest. J. Beijing For. Univ. 1994, 16, 20–27. (In Chinese) [Google Scholar]
  70. Mao, A.H.; Li, J.X.; Zhang, C.Y.; Li, Q.J.; Wang, S.; Chen, X.Y.; Li, Y. Geographic variation and provenance selection of Platycladus orientalis in a 19-year-old testing plantation. J. Beijing For. Univ. 2010, 1, 63–68. (In Chinese) [Google Scholar]
  71. Shi, X.; Zheng, J. Study on provenance classification of Platycladus orientalis. For. Sci. Technol. 1993, 1, 1–5. (In Chinese) [Google Scholar]
  72. Linhart, Y.B.; Grant, M.C. Evolutionary significance of local genetic differentiation in plants. Annu. Rev. Ecol Syst. 1996, 27, 237–277. [Google Scholar] [CrossRef]
  73. Alsos, I.G.; Ehrich, D.; Thuiller, W.; Eidesen, P.B.; Tribsch, A.; Schönswetter, P.; Lagaye, C.; Taberlet, P.; Brochmann, C. Genetic consequences of climate change for northern plants. Proc. R. Soc. Lond. B Biol. Sci. 2012, 279, 2042–2051. [Google Scholar] [CrossRef] [PubMed]
  74. Zheng, J.; Yin, Y.; Li, B. A new scheme for climate regionalization in China. Acta Geogr. Sin. 2010, 65, 3–12. (In Chinese) [Google Scholar]
  75. Davis, M.B.; Shaw, R.G. Range shifts and adaptive responses to quaternary climate change. Science 2001, 292, 673–679. [Google Scholar] [CrossRef] [PubMed]
  76. Rehfeldt, G.E.; Wykoff, W.R.; Ying, C.C. Physiologic plasticity, evolution, and impacts of a changing climate on Pinus contorta. Clim. Chang. 2001, 50, 355–376. [Google Scholar] [CrossRef]
  77. Ying, C.C.; Yanchuk, A.D. The development of British Columbia’s tree seed transfer guidelines: Purpose, concept, methodology, and implementation. For. Ecol. Manag. 2006, 227, 1–13. [Google Scholar] [CrossRef]
  78. Ellstrand, N.C.; Elam, D.R. Population genetic consequences of small population size: Implications for plant conservation. Annu. Rev. Ecol. Syst. 1993, 24, 217–242. [Google Scholar] [CrossRef]
  79. Sagarin, R.D.; Gaines, S.D. The ‘abundant centre’ distribution: To what extent is it a biogeographical rule? Ecol. Lett. 2002, 5, 137–147. [Google Scholar] [CrossRef]
  80. Wagner, V.; Durka, W.; Hensen, I. Increased genetic differentiation but no reduced genetic diversity in peripheral vs. central populations of a steppe grass. Am. J. Bot. 2011, 98, 1173–1179. [Google Scholar] [CrossRef] [PubMed]
  81. Garner, T.W.J.; Pearman, P.B.; Angelone, S. Genetic diversity across a vertebrate species’ range: A test of the central-Peripheral hypothesis. Mol. Ecol. 2004, 13, 1047–1053. [Google Scholar] [CrossRef] [PubMed]
  82. Eckert, C.G.; Samis, K.E.; Lougheed, S.C. Genetic variation across species’ geographical ranges: The central-marginal hypothesis and beyond. Mol. Ecol. 2008, 17, 1170–1188. [Google Scholar] [CrossRef] [PubMed]
  83. Hamann, A.; Wang, T. Potential effects of climate change on ecosystem and tree species distribution in British Columbia. Ecology 2006, 87, 2773–2786. [Google Scholar] [CrossRef]
  84. Wang, T.; Campbell, E.M.; O’Neill, G.A.; Aitken, S.N. Projecting future distributions of ecosystem climate niches: Uncertainties and management applications. For. Ecol. Manag. 2012, 279, 128–140. [Google Scholar] [CrossRef]
  85. Johnson, G.; Sorensen, F.C.; St Clair, J.B.; Cronn, R.C. Pacific northwest forest tree seed zones a template for native plants? Nativ. Plants J. 2004, 5, 131–140. [Google Scholar] [CrossRef]
Figure 1. Kernel density plots for 10 environmental parameters of the five seed zones and principal component analysis distance biplot for the 401 occurrences on 10 environmental variables. (A) Differentiation among seed zones was evaluated by a Kruskal–Wallis multiple-range test, and the results are indicated in each plot. A lack of significant difference (at the p = 0.05 level) is indicated by an equal sign, while significant differences are coded as either higher or lower; (B) The centroids of the 1.5 inertia ellipses for the occurrence groups of five seed zones illustrate the niche shift. See Table 1 for definitions of the variables.
Forests 08 00471 g001
Figure 2. Suitable habitats for the five seed zones of Platycladus orientalis (L.) under current climate conditions.
Forests 08 00471 g002
Figure 3. Projected changes in suitable habitat for each of the five seed zones (rows) under different climate scenarios/years (columns).
Forests 08 00471 g003
Figure 4. Areal changes in the projected distributions for the five seed zones under the eight future climate scenarios for 2050 (A) and 2070 (B).
Forests 08 00471 g004
Table 1. Environmental parameters used to develop climate models for the five seed zones of Platycladus orientalis (L.).
CodeNameResolutionUnitSource
Bio1Annual mean air temperature30″ × 30″°C × 10http://www.worldclim.org/
Bio2Mean diurnal air temperature range30″ × 30″°C × 10http://www.worldclim.org/
Bio3Isothermality30″ × 30″×100http://www.worldclim.org/
Bio4Air temperature seasonality30″ × 30″×100http://www.worldclim.org/
Bio5Max air temperature of the warmest month30″ × 30″°C × 10http://www.worldclim.org/
Bio12Annual precipitation30″ × 30″mmhttp://www.worldclim.org/
Bio14Precipitation of the driest month30″ × 30″mmhttp://www.worldclim.org/
Bio15Precipitation seasonality (coefficient of variation)30″ × 30″mmhttp://www.worldclim.org/
SCSoil organic carbon0.5° × 0.5° http://www.sage.wisc.edu/atlas/index.php
SpHSoil pH0.5° × 0.5° http://www.sage.wisc.edu/atlas/index.php
Table 2. Contributions of the major environmental parameters in the MaxEnt models for the five seed zones of Platycladus orientalis (L.).
Bioclimate VariablesContributions (%)
CentralNorthernNorthwesternSouthernSubtropical
Annual mean air temperature (Bio1)22.618.634.226.618.8
Mean diurnal air temperature range (Bio2)-----
Isothermality (Bio3)-18.0---
Air temperature seasonality (Bio4)19.222.0-11.617.9
Max air temperature of the warmest month (Bio5)-----
Annual precipitation (Bio12)12.319.613.431.532.2
Precipitation of the driest month (Bio14)17.6--11.813.0
Precipitation seasonality (Bio15)12.1-15.4--
Soil organic carbon (SC)-----
Soil pH (SpH)14.8-23.0--
-: Contributions < 10%.

