Article

Genetic Structure and Population Demographic History of a Widespread Mangrove Plant Xylocarpus granatum J. Koenig across the Indo-West Pacific Region

by
Yuki Tomizawa
1,†,‡,
Yoshiaki Tsuda
2,†,
Mohd Nazre Saleh
3,†,
Alison K. S. Wee
4,5,
Koji Takayama
6,
Takashi Yamamoto
4,7,
Orlex Baylen Yllano
8,
Severino G. Salmo III
9,
Sarawood Sungkaew
10,
Bayu Adjie
11,
Erwin Ardli
12,
Monica Suleiman
13,
Nguyen Xuan Tung
14,
Khin Khin Soe
15,
Kathiresan Kandasamy
16,
Takeshi Asakawa
1,
Yasuyuki Watano
1,
Shigeyuki Baba
4 and
Tadashi Kajita
4,7,*
1
Department of Biology, Graduate School of Science, Chiba University, Chiba 263-8522, Japan
2
Sugadaira Research Station, Mountain Science Center, University of Tsukuba, 1278-294 Sugadairakogen, Ueda, Nagano 386-2204, Japan
3
Faculty of Forestry, Universiti Putra Malaysia, 43400 UPM Serdang, Selangor Darul Ehsan, Malaysia
4
Iriomote Station, Tropical Biosphere Research Center, University of the Ryukyus, 870 Uehara, Taketomi-cho, Yaeyama-gun, Okinawa 907-1541, Japan
5
Guangxi Key Laboratory of Forest Ecology and Coservation, College of Forestry, Guangxi University, Nanning 530000, China
6
Museum of Natural and Environmental History, Shizuoka, 5762 Oya, Suruga-ku, Shizuoka 422-8017, Japan
7
United Graduate School of Agricultural Science, Kagoshima University, 1-21-24 Korimoto, Kagoshima 890-0065, Japan
8
Biology Department, College of Sciences and Technology, Adventist University of the Philippines, Putting Kahoy, 4118 Silang, Cavite, Philippines
9
Department of Environmental Science, School of Science and Engineering, Ateneo de Manila University, 1108 Quezon City, Philippines
10
Forest Biology Department, Faculty of Forestry, Kasetsart University, 50 Ngamwongwan Rd., ChatuChak, Bangkok 10900, Thailand
11
Bali Botanical Garden, Indonesian Institute of Sciences (LIPI), Candikuning, Baturiti, Tabanan, Bali 82191, Indonesia
12
Faculty of Biology, Jenderal Soedirman University, Jalan Dr. Suparno 63, Purwokerto 53122, Indonesia
13
Institute for Tropical Biology and Conservation, Universiti Malaysia Sabah, Jalan UMS, 88400 Kota Kinabalu, Sabah, Malaysia
14
Mangrove Ecosystem Research Centre, Hanoi National University of Education, 136 Xuan Thuy Street, Cau Giay District, Hanoi, Vietnam
15
Department of Botany, University of Yangon, Kamayut 11041, Yangon, Myanmar
16
Center of Advanced Study in Marine Biology, Faculty of Marine Science, Annamalai University, Parangipettai, 608 502 Tamil Nadu, India
*
Author to whom correspondence should be addressed.
These authors contributed equally to this work.
Present address: Seed Production Department, Kaneko Seeds Co. Ltd. 50-12, Furuichimachi 1-chome, Mabashi City 371-8503, Japan.
Forests 2017, 8(12), 480; https://doi.org/10.3390/f8120480
Submission received: 29 August 2017 / Revised: 27 November 2017 / Accepted: 29 November 2017 / Published: 5 December 2017
(This article belongs to the Special Issue Genetics and Genomics of Forest Trees)

Abstract

:
Xylocarpus granatum J. Koenig is one of the most widespread core component species of mangrove forests in the Indo-West Pacific (IWP) region, and as such is suitable for examining how genetic structure is generated across spatiotemporal scales. We evaluated the genetic structure of this species using maternally inherited chloroplast (cp) and bi-parentally inherited nuclear DNA markers, with samples collected across the species range. Both cp and nuclear DNA showed generally similar patterns, revealing three genetic groups in the Indian Ocean, South China Sea (with Palau), and Oceania, respectively. The genetic diversity of the Oceania group was significantly lower, and the level of population differentiation within the Oceania group was significantly higher, than in the South China Sea group. These results revealed that in addition to the Malay Peninsula—a common land barrier for mangroves—there is a genetic barrier in an oceanic region of the West Pacific that prevents gene flow among populations. Moreover, demographic inference suggested that these patterns were generated in relation to sea level changes during the last glacial period and the emergence of Sahul Shelf which lied northwest of Australia. We propose that the three genetic groups should be considered independent conservation units, and that the Oceania group has a higher conservation priority.

1. Introduction

Mangrove is a unique forest ecosystem that connects different habitats: land, freshwater, and ocean. Mangrove forests form the center of mangrove ecosystems, and are distributed in tropical and subtropical coastal and riverine regions of the world [1]. The ecological services and economic contribution of mangrove forests are important to many tropical and subtropical countries and provide tremendous benefits to human beings [1,2]. However, because mangroves forests are distributed close to areas of high anthropogenic disturbance and land use change, they are rapidly declining and under destruction, which results in the severe fragmentation of forests [3,4]. Thus, it is well recognized that mangrove forests have a high priority in conservation biology and forest management in many countries, not only due to human activities, but also because of recent global warming [5].
Despite the wide distribution range of mangrove forests, the number of component species is relatively small compared with other tropical forest habitats [6]. Only 30–40 species are recognized as core mangrove component species [1,2]. Even though this may be a small number, most species are widespread, enabling mangrove forests to be distributed globally across the tropics. Core groups of mangroves, such as Avicennia spp., Rhizhophora spp., Bruguiera spp., and Xylocarpus spp., are found across different continents and oceanic regions [1,3]. Each group is an important component of mangrove ecosystems, and contributes to forest formation and succession processes. One of the mechanisms by which the core mangrove species can maintain their wide distribution is due to their effective method of seed dispersal, that is, sea-dispersal. By dispersing buoyant propagules via ocean currents, mangrove species have established wide distribution ranges spanning over continents. However, the specific processes involved in the formation and maintenance of the wide distribution of core mangrove species are not well understood.
Recently, molecular studies have suggested the presence of genetically distinct units within widespread mangrove species that are formed by barriers to gene flow. A number of studies have been performed in the Indo-West Pacific (IWP) region where a higher level of mangrove species diversity exists, e.g., Ceriops tagal (Perr.) C.B.Rob. [7], Bruguiera gymnorhiza (L.) Lam. [8,9], and Rhizophora spp. [10,11,12]. These studies showed strong genetic structure in the IWP, especially across the Malay Peninsula, which is a significant biogeographic barrier that has shaped genetic structure between the Indian and Pacific oceans. An additional “cryptic barrier” [12] in the West Pacific is reported in a study of Rhizophora stylosa Griff. Distinct genetic structure between the South China Sea and Oceania has also been found in Ceriops tagal [13] and Bruguiera gymnorhiza [14]; this concordance in phylogeography may indicate shared biogeographic histories. To understand the genetic structure of mangroves across the entire IWP region, it is necessary to focus on species that are widespread across the region. Moreover, although coalescent-based population demographic inferences have started to provide a deeper understanding of the genetic diversity and structure of species and their history (e.g., [15,16,17]), this kind of approach has not yet been well conducted in mangrove species. Thus, further inferences of past demographic history of mangrove species can shed new light on not only the population genetics of mangrove species, but also mangrove forest management and conservation, as demonstrated in forest tree species [16,18,19,20].
Xylocarpus granatum J. Koenig is one of the most widespread core mangrove species in the IWP, and can provide an ideal system that allows us to test the presence of genetic structures across the region. The genus Xylocarpus is the only mangrove genus in the large mahogany family, Meliaceae. The genus occurs solely in the IWP region, from east Africa westward to Oceania, and is comprised of three accepted species, X. granatum, X. moluccensis M.Roem., and X. rumphii (Kostel.) Mabb. [21]. Xylocarpus species have small, white flowers that are most likely insect-pollinated. Unlike the iconic mangrove species in the Rhizophoraceae that disperse viviparous propagules, Xylocarpus produces large, cannonball-like, multi-seeded fruits, and their seeds are buoyant for dispersal via the ocean. Within the genus, X. granatum is the most widespread species, but the genetic diversity and structure of this species has not been examined. Therefore, this species can be a suitable model to evaluate in order to provide a deeper understanding of the genetic structure and past demographic history of the mangrove species across the IWP region.
The aims of this study are: (1) to examine the genetic structure of X. granatum over a wide distribution range across the IWP using maternally inherited cpDNA and bi-parentally inherited nuclear DNA markers; (2) to infer the past demographic history of the species to further understand any genetic structure and barriers detected; and (3) to propose conservation units to maintain local genetic diversity.

2. Materials and Methods

2.1. Sample Collection and DNA Extraction

Leaf samples of 111 individuals of X. granatum from 18 populations were collected, covering 14 countries across the entire distribution range of X. granatum in the Indo-West Pacific (Table 1, Figure 1). Total DNA was extracted from silica-dried leaves using a modified cetyltrimethylammonium bromide (CTAB) method [22]. The extracted DNA was eluted in Tris-EDTA Buffer (TE) and stored at −20 °C until sequencing and genotyping. Xylocarpus moluccensis and X. rumphii were also examined in this study to evaluate whether cpDNA variation was shared among closely related species. For X. moluccensis, which is also widespread in SE Asia, 17 individuals from five populations were examined.

2.2. Chloroplast DNA Sequencing and Data Analysis

Three cpDNA intergenic regions, trnD-trnT [23], trnL-trnF [24], and accD-psaI [25], were sequenced for all of the samples using published universal primer pairs. Each polymerase chain reaction (PCR) was performed in a total volume of 10 μL with 1.0 μL of 10× Ex Taq buffer (Takara Bio Inc., Shiga Prefecture, Japan), 0.8 μL of each 10 mM deoxynucleotide (dNTP) mixture (Takara Bio Inc., Shiga Prefecture, Japan), 0.4 μL of each 10 pM primer pair, 0.05 μL of TaKaRa Ex Taq (Takara Bio Inc., Shiga Prefecture, Japan), and 6.35 μL of sterilized water mixed with 1.0 μL of template DNA. The PCR protocol used was initial denaturation at 95 °C for 60 s, followed by 35 cycles of 95 °C for 45 s, 55 °C for 45 s, and 72 °C for 60 s, and a final elongation at 72 °C for 10 min. The PCR products were purified using ExoSAP-IT (USB Corporation, Cleveland, OH, USA) and cycle sequencing was performed on the purified product using the BigDye cycle sequencing kit ver. 3.1 (Applied Biosystems, Foster City, CA, USA). Subsequently, the nucleotide sequence was determined with an ABI3500 Genetic Analyzer (Applied Biosystems, Foster City, CA, USA). Raw sequence data was imported into Auto Assembler ver. 2.1.1 (Applied Biosystems, Foster City, CA, USA), and peak calling was visually corrected. The sequence data of the three regions were concatenated and aligned using the ClustalW algorithm [26] incorporated within MEGA5 [27]. The haplotype of each individual was identified using the final concatenated sequence by considering only base substitution and indels. A statistical parsimony network was constructed, using the final concatenated sequences of 1702 bp by TCS 1.21 [28] to visualize the relationships among the cpDNA haplotypes. Genetic diversity (h) was calculated for each population. Genetic differentiation among populations was evaluated by calculating FST [29] and its standardized value, F’ST, which always ranges from 0 to 1 [30], using GenAlEx 6.5 (hereafter, GenAlEx [31]).

2.3. Nuclear SSR Genotyping and Data Analysis of X. Granatum

We obtained Short Sequence Repeat (SSR) data for a total of 13 populations of X. granatum (Table 1). The SSR data of nine populations for 11 loci was obtained from Tomizawa et al. [32] (Table 1). The remaining four populations—5-Phuket, 14-Airai, 17-Baie de Tare, and 18-Daintree—were genotyped with the eleven SSR loci based on the PCR and fragment analysis protocol in Tomizawa et al. [32]. Allele calling was done using GeneMapper ver. 4.1 (Applied Biosystems, Foster City, CA, USA). The apportionment of genetic variation among group (FRT), among populations within a group (FSR), and among individuals within populations (FST) were evaluated based on a Bayesian model-based clustrering analysis results of K = 2 (Indian Ocean–South China Sea, and Oceania groups) and K = 3 (Indian Ocean, South China Sea, and Oceania groups) (see results for details) using an analysis of molecular variance (AMOVA, [33]) implemented in GenAlEx. The AMOVA was also conducted for each pair of the three groups at K = 3. The standardized values of F’RT and FST were also calculated using GenAlEx. The genetic relationships among populations were evaluated by generating a neighbor-joining (NJ) tree based on the Nei's genetic distances (DA) [34] using Populations 1.2.30 beta software [35]. The statistical confidence in the topology of the tree was evaluated by 1000 bootstraps derived using the same software (Figure S1). The NJ tree was reconstructed on a topographic map using Mapmaker and GenGIS2 software [36]. Individual-level genetic relationships were analyzed with principal coordinates analysis (PCoA) using GenAlEx. Individual-based genetic structure was evaluated using a Bayesian model-based clustering algorithm implemented in the software STRUCTURE v. 2.3.4 [37,38]. STRUCTURE analysis was performed using the admixture model [38], with 20 runs for each number of subpopulations (K), from K = 1 to 13. Each run consisted of 30,000 replicates via the Markov chain Monte Carlo (MCMC) method after a burn-in of 20,000 replicates. STRUCTURE HARVESTER [39] was employed to evaluate the probability of the data (LnP (D)) for each K, and to calculate ΔK according to the method described by Evanno et al. [40]. Multimodality among runs and major clustering patterns at each K were evaluated using the CLUMPAK server [41].

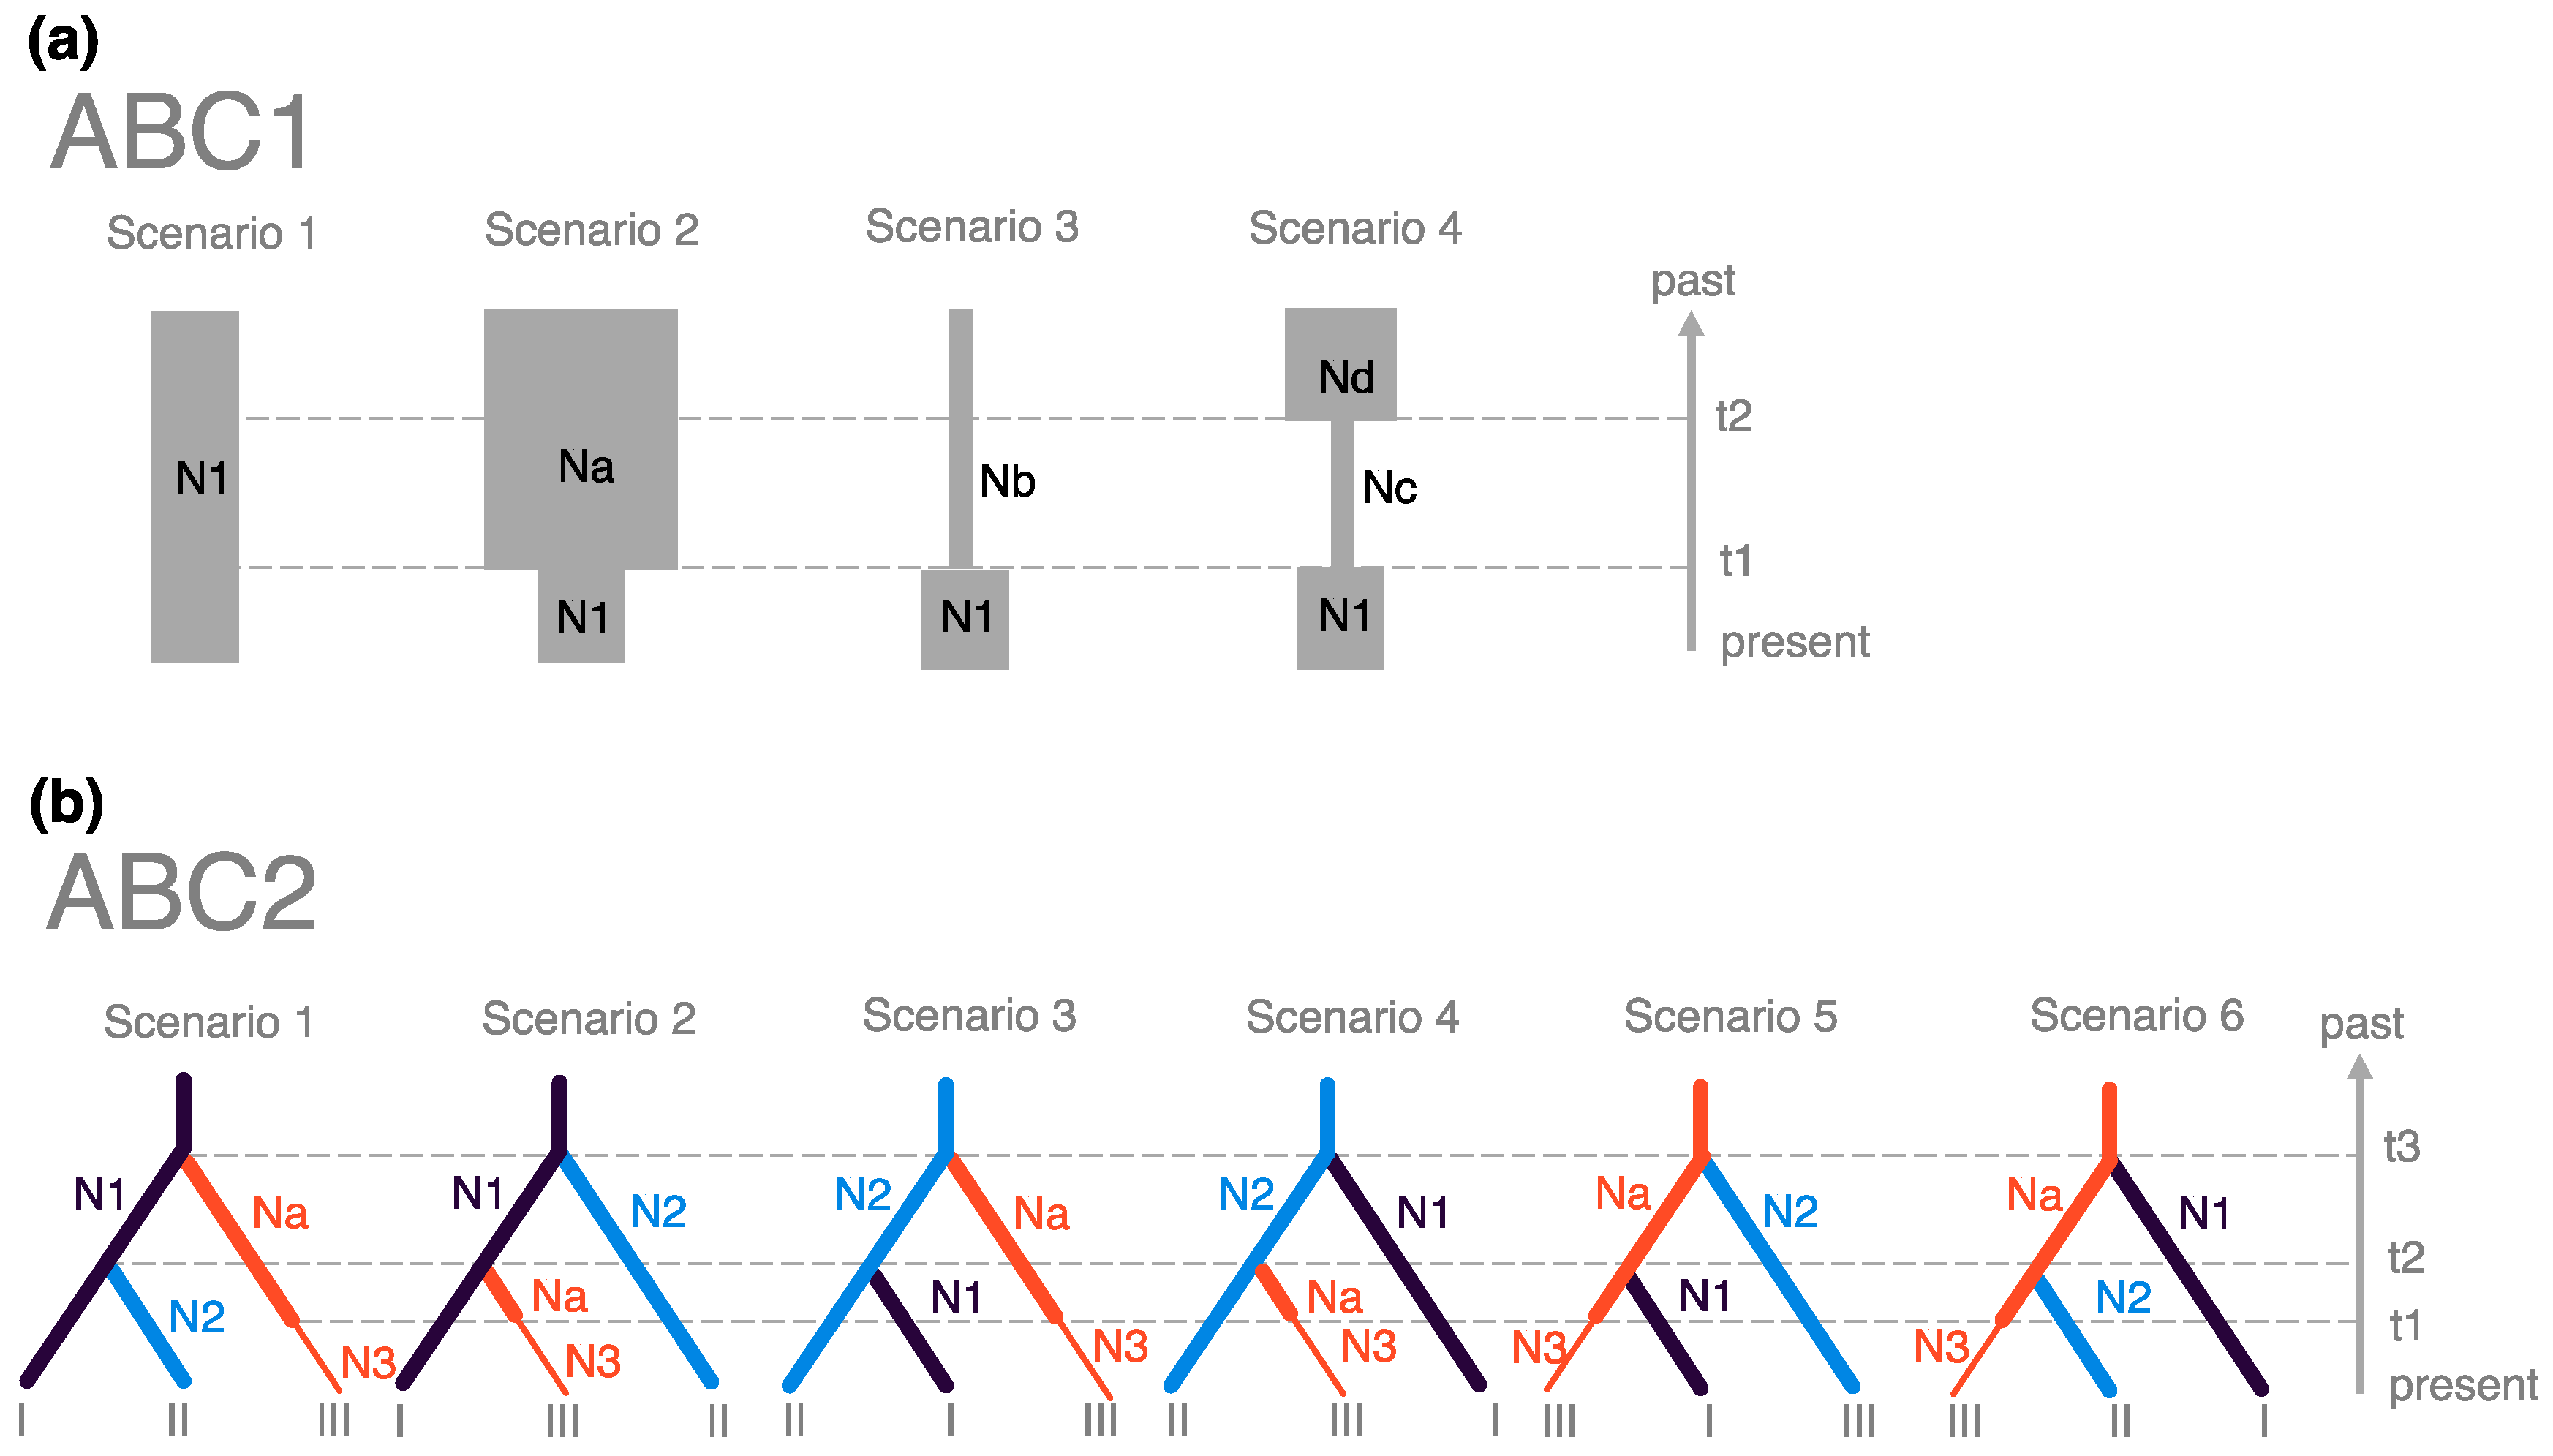
2.4. Inference of Demographic History

The software DIYABC v2.0 [42,43] was used to analyze the nuclear SSR data of X. granatum to infer demographic history based on the approximate Bayesian computation (ABC) approach. To keep the scenarios in the ABC analysis simple, three groups were defined based on the result of the STRUCTURE analysis: Pop I (Pop IDs 2, 4, 5 and 6), Pop II (Pop IDs 7, 8, 11, 13 and 14), and Pop III (Pop IDs 15, 16, 17 and 18). The main aims were: 1) to infer population size change through time for each group, and 2) to infer the order of splitting into the three groups with their time scale, to understand how the modern genetic structure of X. granatum, as shown in the NJ tree and the STRUCTURE analysis, was generated (Figure 3a,b). Thus, we conducted two analyses: ‘ABC1– Inference of population size change in each regional group’, and ‘ABC2– Inference of population demographic history among regional groups’. In all of the scenarios, t# represented the time scale, measured by generation time, and N# represented the effective population size of the corresponding populations (PopI, II, and III) during the relevant time period (e.g., 0–t1, t1–t2, and t2–t3).
ABC1—Inference of population size change in each regional group.
Four simple scenarios were tested for each group (Figure 4a). The scenarios were as follows:
  • Scenario 1—Constant population size model: The effective population size of Pop# was constant at N1 from the past to the present.
  • Scenario 2—Population shrinkage model: The effective population size of Pop# reduced from Na to N1 at t1.
  • Scenario 3—Population expansion model: The effective population size of Pop# increased from Nb to N1 at t1.
  • Scenario 4—Bottleneck model: The effective population size of Pop# experienced a bottleneck from Nd to Nc at t2 followed by population size recovery from Nc to N1 at t1.
ABC2—Inference of population demographic history among regional groups.
Six simple population demographic scenarios were tested with considering all the possible hierarchical population splits and populations to be traced back to the common ancestral population (Figure 4b). As population shrinkage was detected in Pop III in ABC1 (see results), population shrinkage for Pop III at t1 was added to all the scenarios, giving Na and N3 for the effective population size before and after the population size reduction, respectively. The change in the number of repeats followed a generalized stepwise mutation model (GSM; [44]) and single nucleotide indels (SNI) were also allowed. The mutation rate of the former was assumed to be higher than the mutation rate of the latter. The default values of the priors were used for all of the parameters (Table S1) except t2, according to our preliminary test runs (data not shown). The mean values of the expected heterozygosity (HE), the number of alleles, the size of variance among the alleles, and Garza and Williamson’s M [45] were used as summary statistics for each of the three populations in ABC1 and 2. As for summary statistics for each of the population pairs in ABC2, we used HE, A, Garza and Williamson’s M, FST, genotype likelihood, shared allele distance, and (δμ)2 distance [46]. One million simulations were performed for each scenario, and the most likely scenario was evaluated by comparing posterior probabilities with the logistic regression method. The goodness-of-fit of the scenarios was also assessed by principal component analysis (PCA) using the option “model checking” in DIYABC.

3. Results

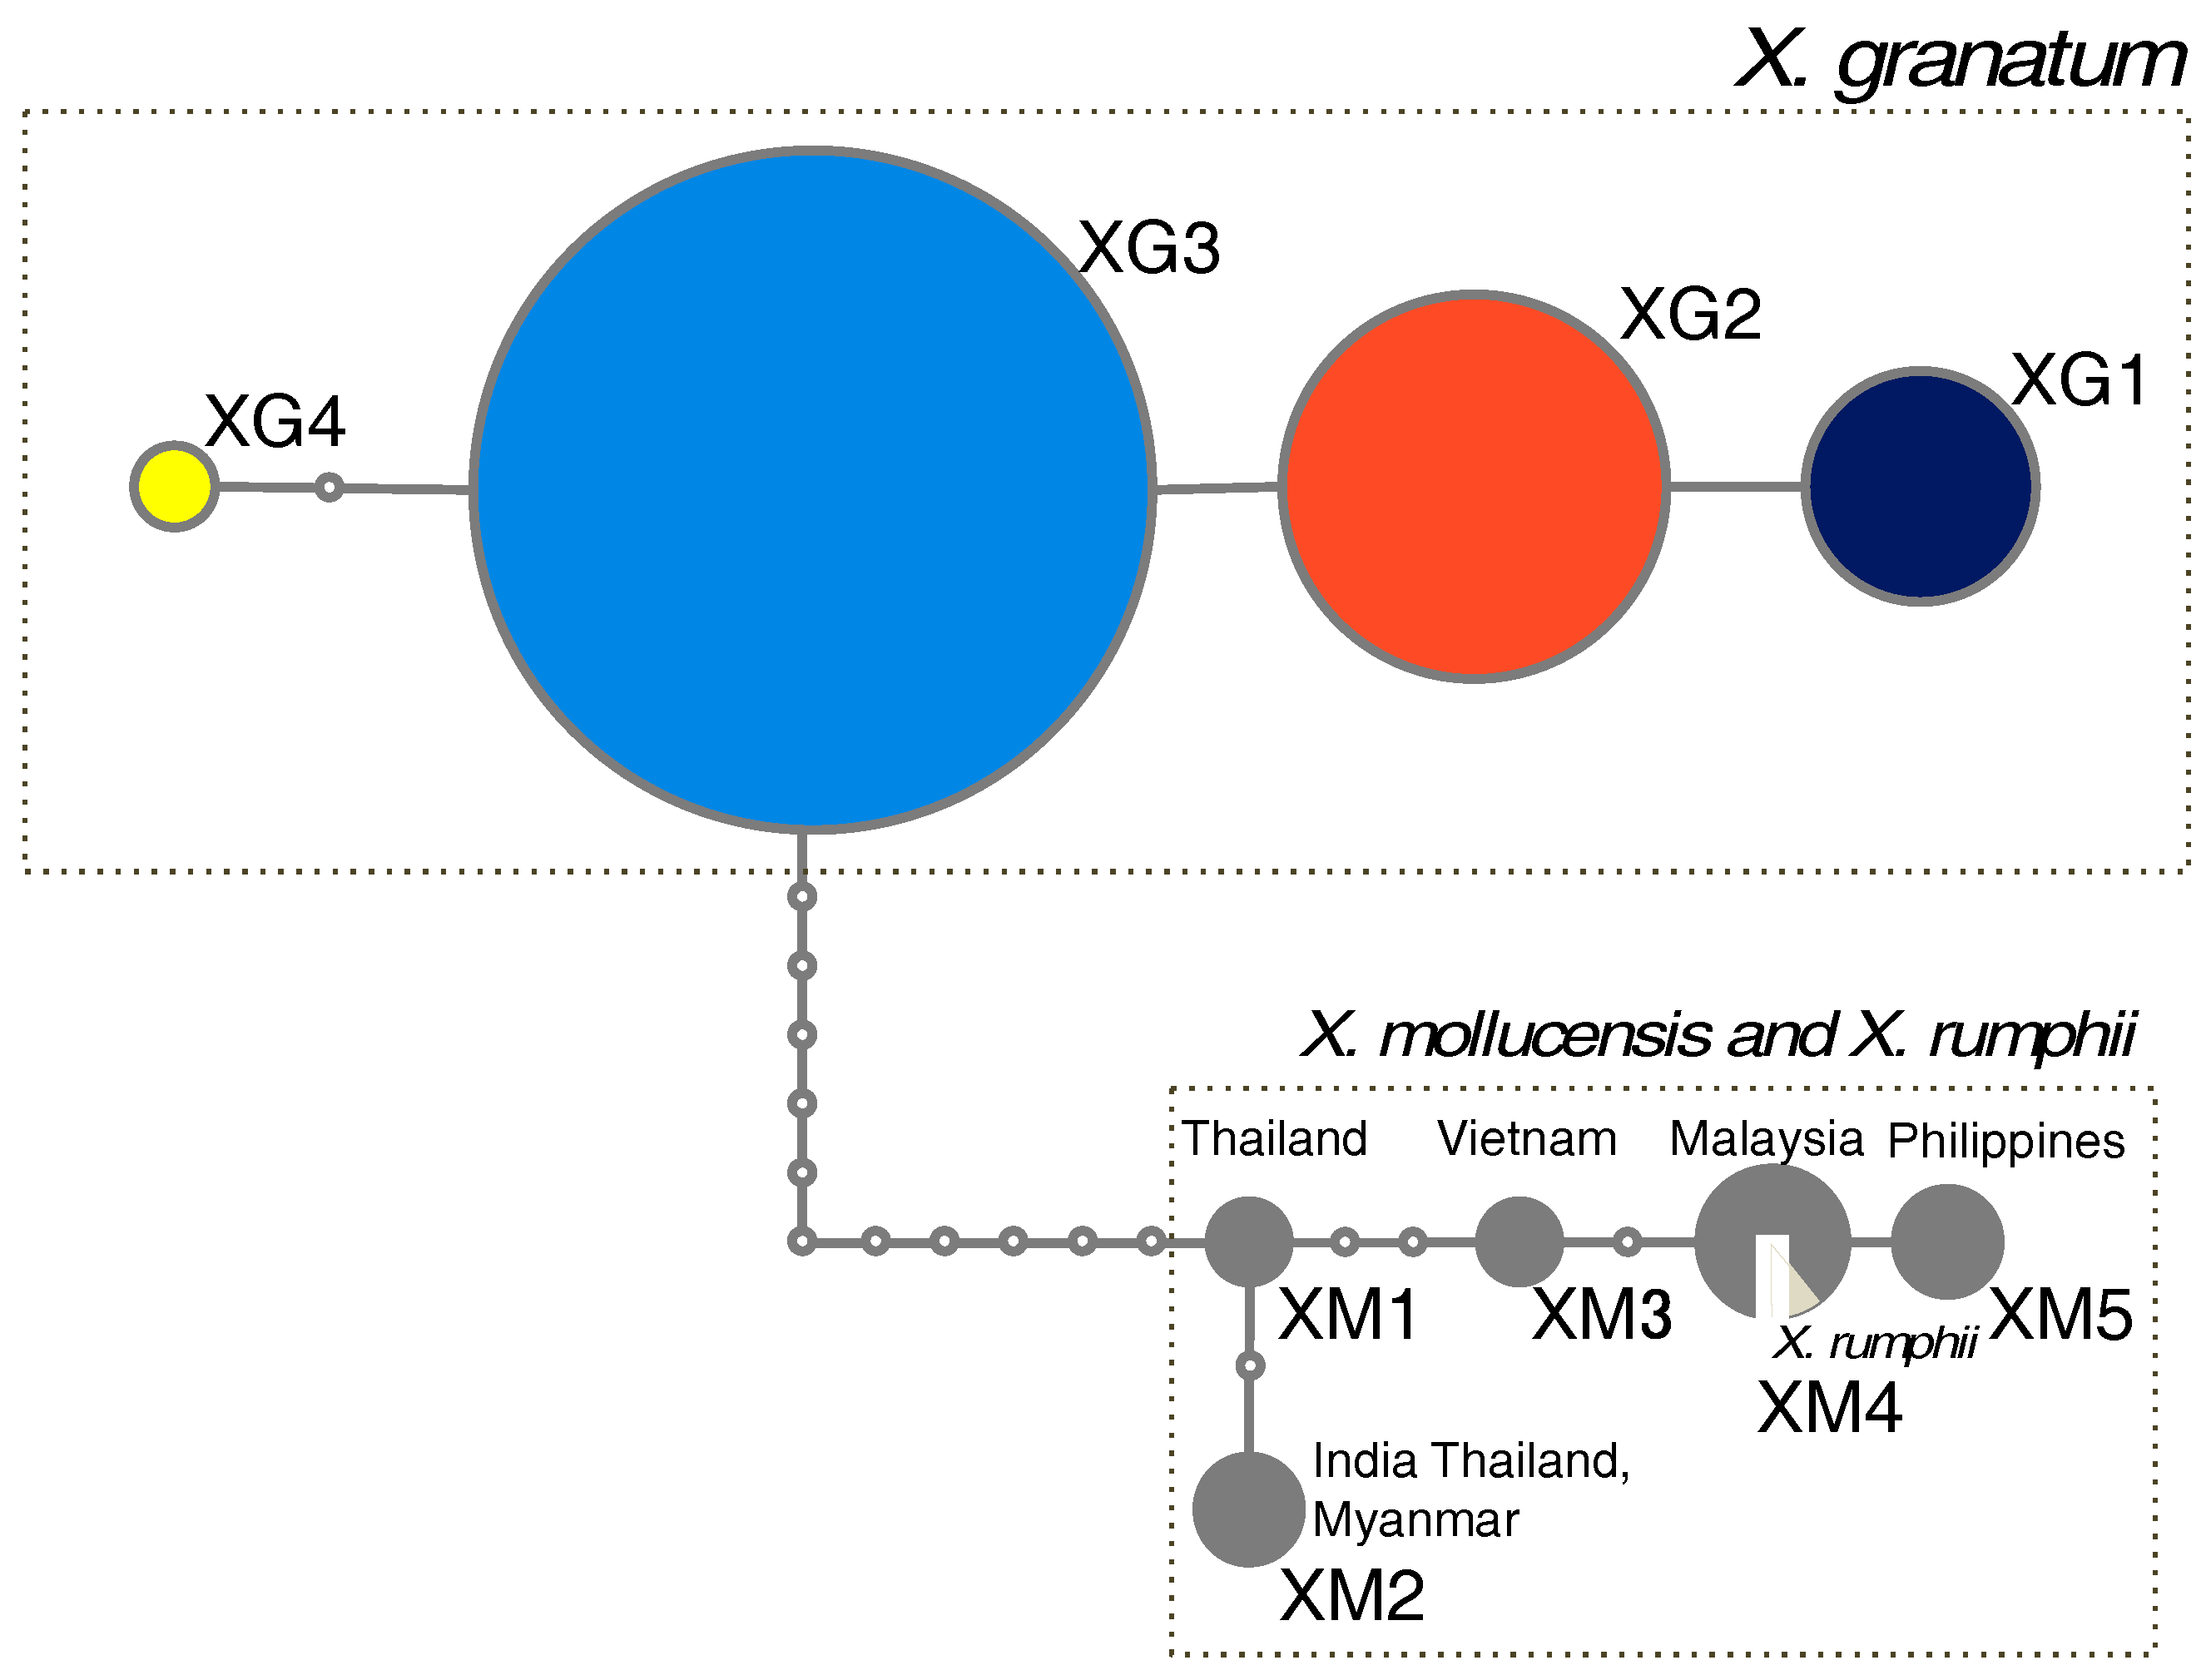
3.1. Phylogenetic Relationships of the cpDNA Haplotypes in Xylocarpus

A total of 1702 bp of cpDNA sequence was used for analysis, including 687 bp of trnD–trnT Intergenic Spacer (IGS), 435 bp of trnL–trnF IGS, and 580 bp of accD–psaI. In X. granatum, four haplotypes (XG1–XG4) were characterized based on four nucleotide substitutions; while in X. moluccensis, five haplotypes (XM1–XM5) were characterized based on six nucleotide substitutions and one indel (Table 2). The two species did not share any haplotypes, but the haplotype of X. rumphii used in this study was the same as a haplotype of X. moluccensis (XM4).
The statistical parsimony network constructed by TCS showed that X. granatum and X. moluccensis are clearly differentiated. In X. granatum, haplotype XG2 and XG4 were derived from the major haplotype XG3, and haplotype XG1 was derived from XG2 (Figure 2). There were only one or two steps between neighboring haplotypes. In X. moluccensis and X. rumphii, nearby haplotypes were differentiated by one to three steps.

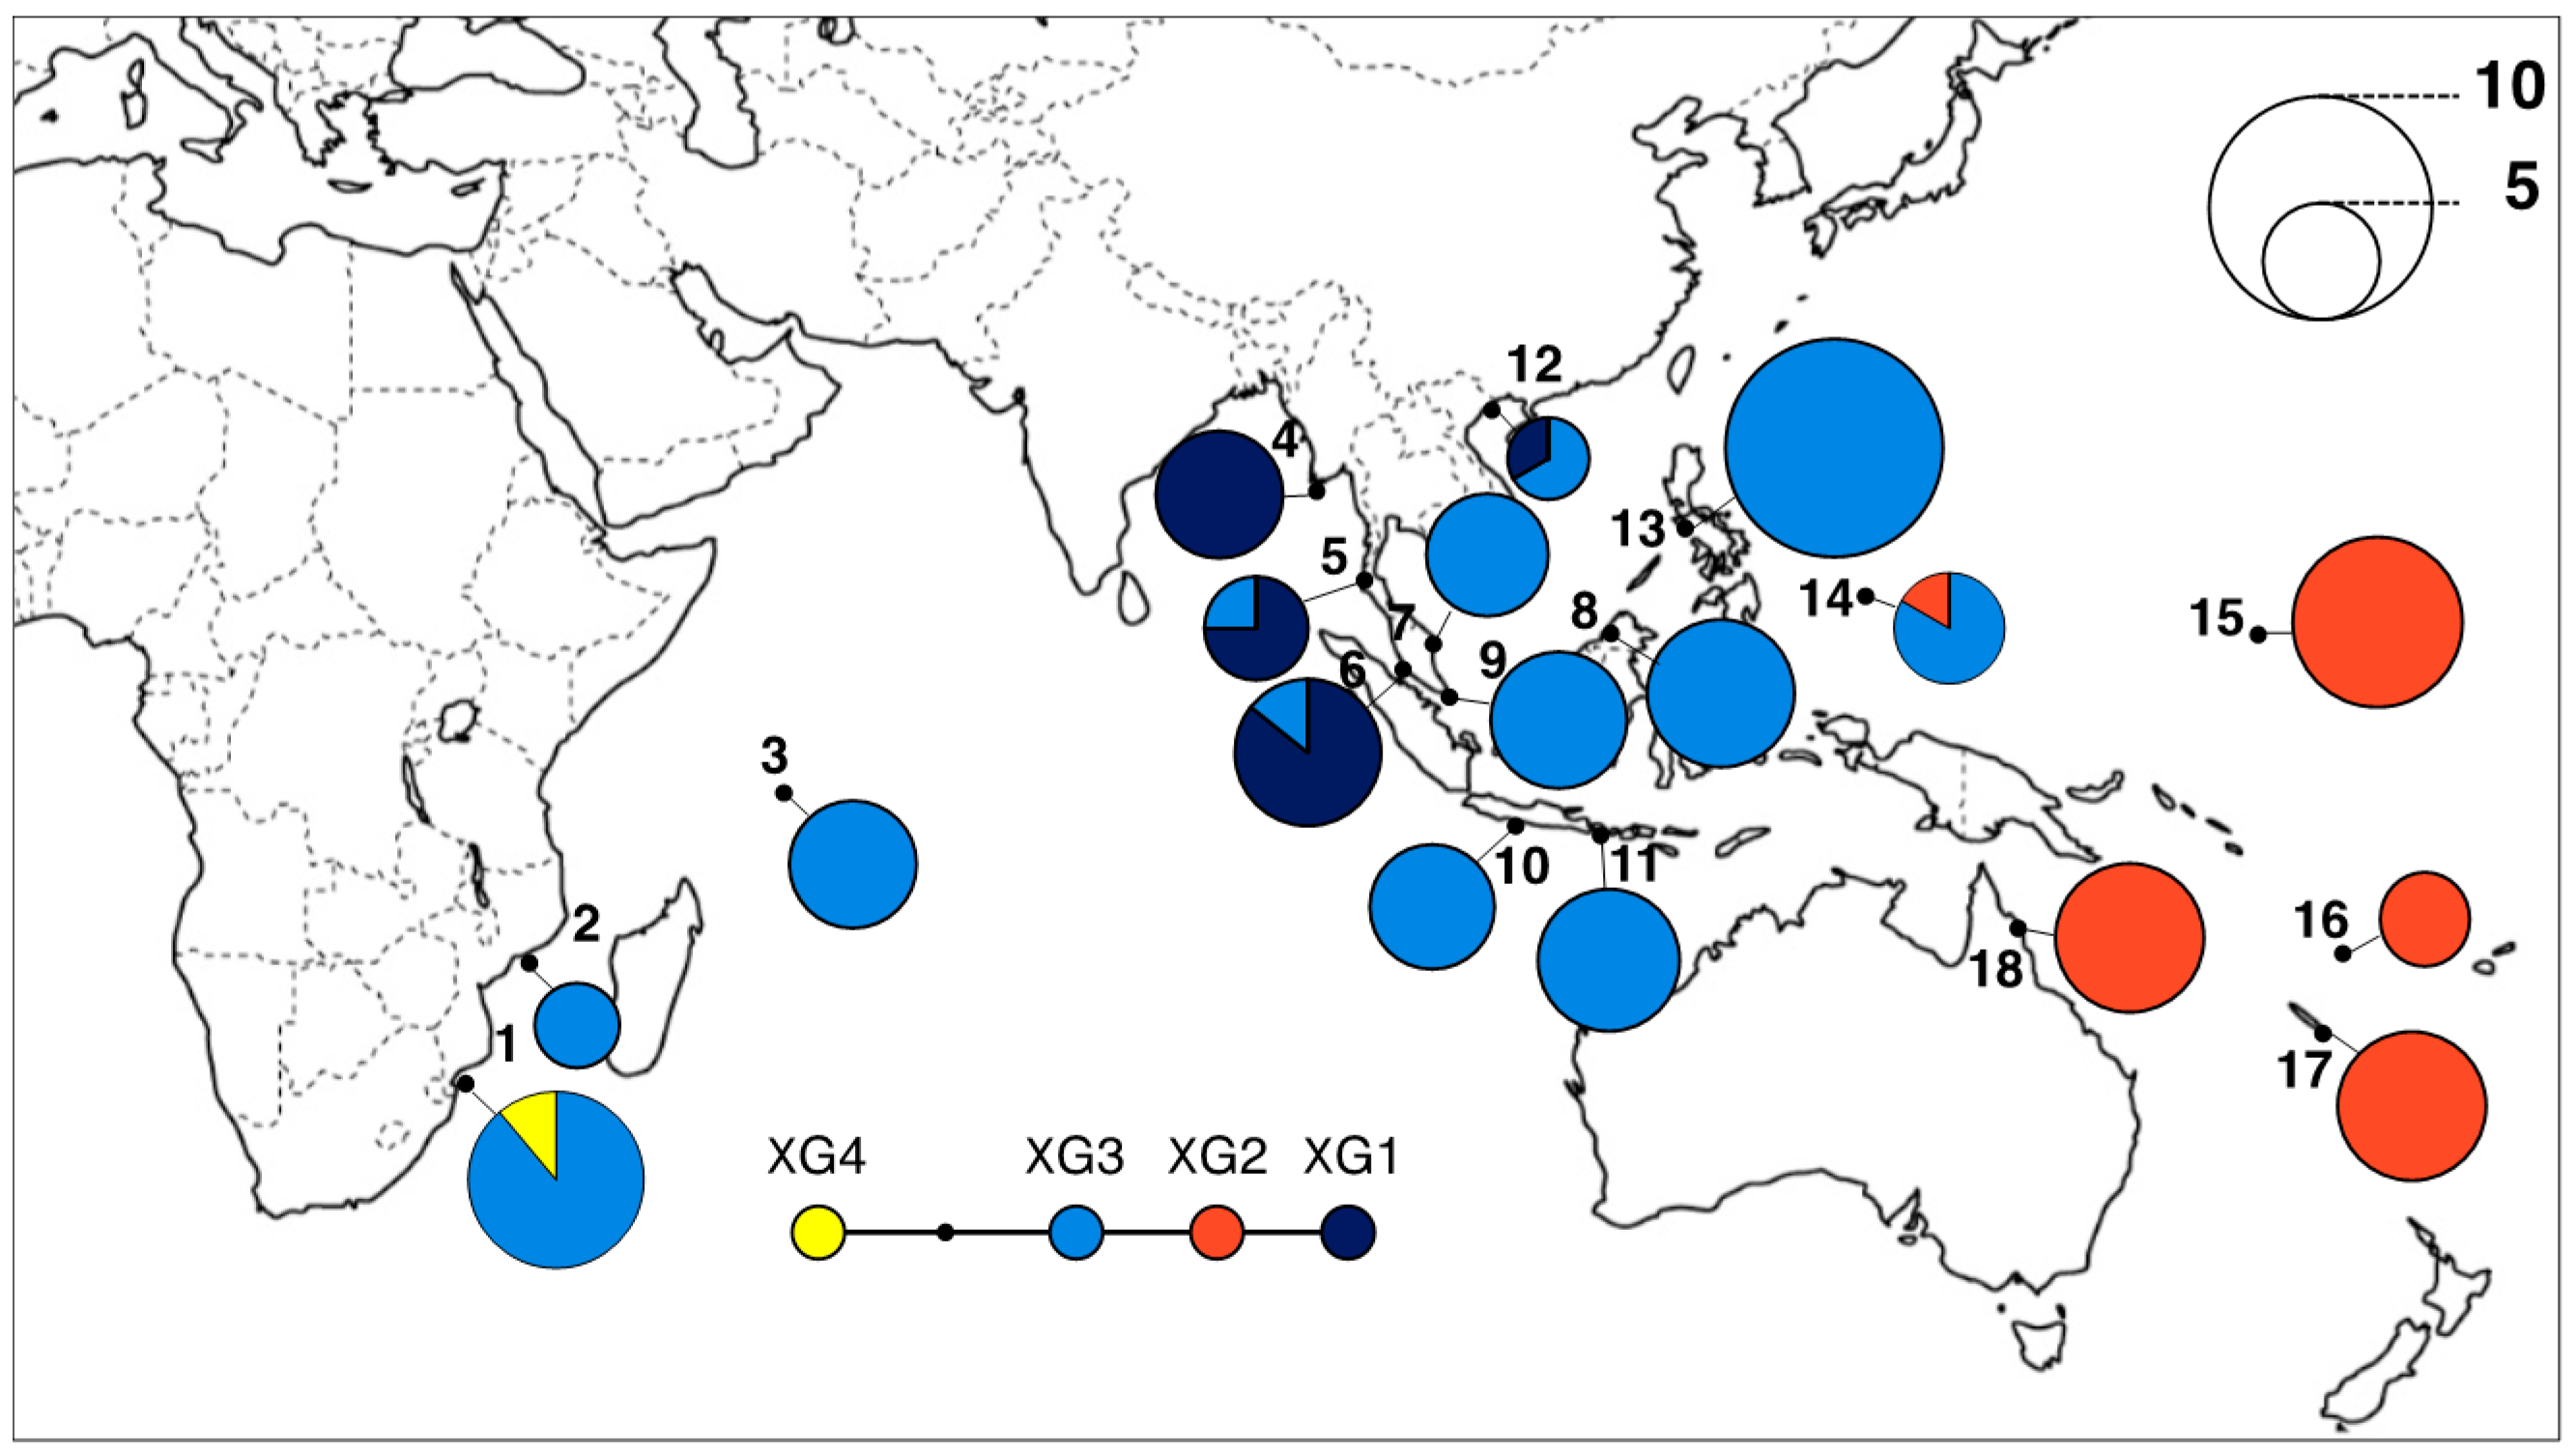
3.2. Geographical Distribution of cpDNA Haplotypes

The geographical distribution of the haplotypes for the 18 populations of X. granatum revealed that haplotype XG3 was widely distributed across the Indo-West Pacific (Table 1, Figure 1). The distribution of haplotypes demonstrated no clear genetic break between the Indian and Pacific Oceans (due to the presence of XG3 in both). Instead, we observed a localized distribution in the other three haplotypes, with XG1 and XG2 largely confined to the Andaman Sea (4-Ayeyarwady, 5-Phuket, 6-Klang, and 12-Dong Rui) and in Oceania (14-Airai, 15-Kosrae, 16-Malatie, 17-Baie de Tare, and 18-Daintree), respectively, while XG4 was found in only one individual from Mozambique (1-Maputo). Haplotypes XG1 and XG2 were fixed in one population (4-Ayeyarwady), and four populations (15-Kosrae, 16-Malatie, 17-Baie de Tare, and 18-Daintree), respectively. The values of FST and F’ST calculated among populations by cpDNA data were 0.853 and 0.933, respectively, suggesting the level of population differentiation was high.

3.3. Genetic Structure Revealed by SSR Markers

The total number of alleles detected was five to 20 per locus. Although the highest ΔK was detected at K = 2, the Ln P(D) values increased together with the number of K up to around K = 9 in the STRUCTURE analysis (Figure S2), and genetic clustering patterns were clear from K = 2 to 9. At K = 2, the geographic pattern of the two clusters was clear; cluster 1 (C1 in blue color) was distributed in the Indian Ocean and South China Sea, while cluster 2 (C2 in orange color) was distributed in Oceania, consisting of 15-Kosrae (Micronesia), 16-Malatie (Vanuatu), 17-Baie de Tare (New Caledonia), and 18-Daintree (Australia). One exception was the 14-Airai (Palau) population, which clustered into C1 despite its location in Oceania (Figure 3a). At K = 3, C1 at K = 2 was further divided into two clusters, which corresponded to the Indian Ocean (C3 in dark blue color), consisting of 2-Quelimane (Mozambique), 4-Ayeyarwady (Myanmar), 5-Phuket (Thailand), and 6-Klang (Malaysia); and the South China Sea, consisting of 7-Kemaman (Malaysia), 8-Sabah (Malaysia), 11-Bali (Indonesia), 13-Panay (Philippines), and 14-Airai (Palau). A similar pattern to the results of K = 3 was also detected by the NJ tree for 13 populations (Figure 3b). Although more local genetic clusters were detected up to K = 9, the NJ tree for nine clusters revealed the same three genetic groups detected at K = 3 and the NJ tree for 13 populations. An individual level PCoA analysis demonstrated three well-segregated groups in the plot of the second two axes (1 vs. 3 explained 26.56% of the total variation) (Figure 3c) and the first two axes (1 vs. 2 explained 27.92%). Thus, finally, the 13 populations were clustered into three groups: Pop I, II, and III, prior to conducting ABC analyses (as stated in the Materials and Methods). In concordance with the cpDNA data, a genetic break was detected at the boundary between the South China Sea and Oceania. The cpDNA haplotypes from both regions were detected in population 14-Airai, which is located between the two regions, and this population also revealed a small amount of admixture between the Indian Ocean–South China Sea cluster and the Oceania cluster in the nuclear DNA data.
The overall value of FST was 0.404, suggesting that the level of population differentiation among the 13 populations was high, especially when considering the standardized F’ST value of 0.802 (Table 3). The value of FST among the four populations in Oceania was significantly higher than among the five populations in the South China Sea, while significant differences were neither detected among the three groups nor between other pairs of groups. There was relatively high genetic differentiation among the populations within groups (F’SR values were 0.678 and 0.610 for K = 2 and 3, respectively), although larger differentiation was detected among groups (F’RT values were 0.748 and 0.648 for K = 2 and 3, respectively) (Table 3). For all of the comparisons, FST values are always two to three times higher, which can be due to higher variation among individuals than among populations or groups. Moreover, the AMOVA for each group pair suggested that genetic differentiation between the South China Sea and Oceania (F’RT = 0.815) was much higher than that between the Indian Ocean and the South China Sea (F’RT = 0.389), and the Indian Ocean and Oceania (F’RT = 0.416).

3.4. Inferences of Demographic History

When considering the changes in the temporal population size in each regional group in ABC1, scenario 1 (constant population size model) showed the highest posterior probability in Pop1 (Indian Ocean) and 2 (South East Asia), and summary statistics and the PCA suggested that this scenario best described the data (Table 4, Figures S3b and S4b). However, the 95% confidence interval (CI) of scenario 1 overlapped with other scenarios in these two groups (Table 4). Regarding Pop3 (Oceania), scenario 2 (population shrinkage model) showed the highest posterior probability (0.3917) and its 95% CI (0.3858–0.3977) did not overlap with other scenarios. In this scenario, the effective population size after the shrinkage was estimated to be 2310 (95% hyper probability density (HPD), 806–6960), and the population shrinkage was inferred to have occurred 12800 (95% HPD, 888–29,200) generations ago (Table S3, Figure S5a). This time scale can be translated to 128,000 years Before Present (BP) (95% HPD, 8880–292,000) under the assumption of a generation time of 10 years for X. granatum. The median values of the mean mutation rate of SSR, mean P (the parameter of the geometric distribution to generate multiple stepwise mutations) and SNI were estimated to be 4.53 × 10⁻⁴ (95% CI: 1.30 × 10⁻⁴–9.65 × 10⁻⁴), 0.254 (95% CI: 0.128–0.300) and 2.54 × 10⁻⁷ (95% CI: 1.18 × 10⁻⁸–7.72 × 10⁻⁶), respectively. The summary statistics and the PCA suggested the good fit of the scenario (Table S4, Figure S5b). All four summary statistics in this scenario were not significantly differentiated from the observed value, and the PCA showed that the observed data point (yellow) was in the middle of a small cluster of datasets from the posterior predictive distribution (red, Figure S5b), suggesting scenario 2 fits the observed data well in Pop3.
In the inference of population demographic history among regional groups (ABC2), the highest posterior probability was detected for scenario 1 (0.3794, 95% CI, 0.3712–0.3877) without overlapping with the 95% CI of other scenarios (Table 5). In this scenario, the median values of N1, N2, N3, and Na were estimated as 4090 (95% HPD, 1680–7610), 7880 (95% HPD, 4140–9850), 3090 (95% HPD, 822–8510) and 7840 (95% HPD, 3740–9910), respectively. However, Na was not well estimated (Table S5, Figure S6a). The median values of the time scales for the population shrinkage of Pop3 (t1), the splitting of Pop1 and Pop2 (t2), and the splitting of Pop1 and Pop3 (t3) were 4810 (95% HPD, 191–25,400), 4990 (95% HPD, 1460–18,500), and 15500 (95% HPD, 4590–44,300) generations ago, respectively, corresponding to 48,100 (95% HPD, 1910–254,000), 49,900 (95% HPD, 14,600–185,000), and 155,000 (95% HPD, 45,900–443,000) years BP, respectively, although t1 was not well estimated. The median values of the mean mutation rate of SSR, mean P (the parameter of the geometric distribution to generate multiple stepwise mutations), and SNI were estimated to be 3.47 × 10⁻⁴ (95% CI: 1.58 × 10⁻⁴–7.82 × 10⁻⁴), 0.248 (95% CI: 0.134–0.300), and 1.13 × 10⁻⁷ (95% CI: 1.11 × 10⁻⁸–2.89 × 10⁻⁶), respectively. All 36 summary statistics for this scenario were not significantly differentiated from the observed value, and the PCA suggested a good fit of the scenario (Table S6, Figure S6b). Moreover, the PCA showed that the observed data point (yellow) was in the middle of a small cluster of datasets from the posterior predictive distribution (light green, Figure S6b), suggesting that scenario 1 fits the observed data well.

4. Discussion

4.1. Genetic Structure of a Widespread Mangrove Plant, X. granatum, across the IWP Region

This study detected clear genetic structure with three genetic clusters across the distribution of Xylocarpus granatum, namely the Indian Ocean, the South China Sea, and Oceania clusters, in both cp and nuclear DNA datasets. In particular, a genetic break with high genetic differentiation (F’RT = 0.815) was detected between the South China Sea and Oceania in the West Pacific, suggesting limited gene flow by sea-dispersed propagules between these two regions. This genetic break could be recognized as the “cryptic barrier” [12] that might have historically prevented gene flow between South East Asia and Oceania, as shown in Rhizophora stylosa [12], Bruguiera gymnorhiza [14], Sonneratia alba Griff. [47], and Vigna marina (Burm.) Merr. [48].
Although it is difficult to compare the exact location of genetic breaks among these mangrove species due to studies having different sampling locations, the presence of genetic breaks in a similar oceanic region is surprising, because all of the core mangrove species are sea-dispersed plants that can utilize oceans as corridors for migration. Sea dispersal is considered to be one of the most effective modes of seed dispersal for land plants, with dispersal ranges reaching over 100 km [49]. Indeed, long-distance dispersal by sea dispersal is well supported in population genetic studies in extremely widespread plants, especially for the pantropical plants with sea drifted seeds that have vast distribution ranges across the tropics, such as Hibiscus tiliaceus L. [50,51], Ipomoea pes-caprae (L.) R. Br. subsp. brasiliensis (L.) van Ooststr. [52] and the genus Rhizophora [10]. However, topographic barriers can act as genetic barriers even in these species. For example, Takayama et al. [10] detected the Central American Isthmus as a genetic barrier dividing the Pacific and Atlantic groups of Rhizophora mangle L. and Rhizophora racemose G. Mey. in both cp and nuclear DNA, while extended gene flow was suggested within those groups.

4.2. Inferences of the Demographic History of X. granatum

Our results suggest a clear genetic break between the South China Sea and Oceania, despite no obvious topographic barrier in this oceanic area. The ABC inference of past demographic history is helpful to try and understand this pattern. The inferred divergence time of 155,000 (95% HPD, 45,900–443,000) years BP between the South China Sea and Oceania groups suggests that the shallow sea between the Australian continent and New Guinea (the Torres Strait) might have acted as a significant land geographic and genetic barrier during and since the last glacial maximum (LGM, ca. 20,000 years BP), when the entire Sahul Shelf was exposed [53]. The past influence of the Sahul Shelf, compounded by the present large geographic distance among oceanic islands, may have resulted in the observed genetic differentiation of multiple core mangrove species over the West Pacific region. Furthermore, the westward Equatorial Current that bifurcates north and south as it approaches the Indo-Malay Archipelago [54] could be a strong barrier preventing the gene dispersal of haplotype XG2 beyond Palau. Thus, although we need to be cautious about uncertainties in the ABC inferences, such as the generation time of species, overlapping of generations, and wide 95% CI of inferred parameters in the assumed model [16], the present results suggest that genetic differentiation caused by a genetic barrier between the South China Sea and Oceania was generated by episodes of eustatic change in sea levels in relation to ice ages over the past several hundred thousand years. Moreover, population shrinkage was detected in the Oceania group (estimated 128,000 years BP (95% HPD, 8880–292,000)), suggesting that effective population size was reduced following genetic divergence from the South China Sea. In addition, as the mean value of FST among populations within Oceania (0.4090) was significantly higher than within the South China Sea (0.1800), higher genetic isolation within the Oceania group might have also contributed to a decrease in the regional effective population size in Oceania. Regarding the assumed model in the ABC, DIYABC does not consider gene flow after divergence, and it may bias the inferred temporal parameters [16,20]. However, as genetic differentiation between the South China Sea and Oceania is high enough with less gene flow (F’RT = 0.815), this bias may be limited. In addition, since no consideration of gene flow after divergence may underestimate divergence times [16], the main discussion here would not be changed with the population split still occurring before the Last Glacial Maximum (LGM). Finally, although the ABC approach in this study revealed the demographic history of the species, the results obtained in this study might be based on the limited sample size in this study. Thus, further analysis would be required with more loci and more sample sizes in future studies in order to obtain a deeper understanding of the demography of the species.
The population in Palau (14-Airai) revealed a unique genetic composition, and the cpDNA showed a partial mixture of two haplotypes (XG2 and 3), which were dominant in the South China Sea and Oceania, respectively. In addition, nuclear DNA revealed that this population was clustered with the South China Sea group, although it is located in Oceania. As Palau is geographically located close to the boundary between the South China Sea and Oceania, a mixture of cpDNA haplotypes might be reasonable when seed flow between them is considered. Indeed, a mixture of cpDNA halotypes from different lineages has been commonly detected around the boundary areas of lineages in many plant populations (e.g., [48,55,56]). However, nuclear DNA showed only a small amount of admixture between the South China Sea and Oceania clusters, and was basically grouped with the South China Sea cluster. Thus, although the limited sample size examined in this study should be considered, this pattern could be due to differential gene flow between pollen and seeds between the South China Sea and Oceania groups, or incomplete sorting of cpDNA haplotypes. These scenarios need to be further tested with more extended sample collections that cover the species distribution.

4.3. Malay Peninsula as a Common Barrier to Widespread Mangrove Plants

The results of the NJ tree, PCoA, and the STRUCTURE analysis of nuclear SSR data showed clear genetic structure between the Indian Ocean and South China Sea, suggesting that the Malay Peninsula also acts as a barrier for gene flow in X. granatum. The Malay Peninsula has been reported as a clear land barrier for several mangrove species, such as B. gymnorhiza [8,9,14] and Ceriops tagal [7]. This land barrier emerged in this region during the LGM, and has been routinely evoked as an explanation for the genetic structure of mangrove plants across the Malay Peninsula [57]. Indeed, the inferred divergence time of 49,900 (95% HPD, 14,600–185,000) years BP in the ABC generally supports this hypothesis. Although cpDNA generally showed similar patterns to the nuclear DNA, cpDNA did not suggest clear genetic structure across the Malay Peninsula, especially when considering the presence of the widespread haplotype, XG3, from East Africa to Palau (Figure 1). The presence of the widespread haplotype over this wide range implies either frequent long-distance migration, or less variation (resolution) of the molecular marker.

4.4. Relationships with Other Xylocarpus Species

Similar to other mangrove groups, Xylocarpus granatum has its closely related species, X. moluccensis, in a core group of mangroves that has overlapping distribution with X. granatum [21]. Another species, X. rumphii, is also recognized as a mangrove, but is not very common, and the distribution is scattered. In these results, X. granatum and X. moluccensis formed two clear clades, and X. rumphii shared the same haplotype with X. moluccensis (Figure 2, Table 2). Perhaps it is necessary to further study the taxonomic status of X. rumphii with extensive sampling from its distribution range. Only cpDNA data was collected for X. moluccensis, and the haplotype distribution map shows genetic structure across the Malay Peninsula (Figure S7), which also suggests that the Peninsula plays a role as a barrier for the seed dispersal of mangroves, as discussed above. It is interesting that no evidence of hybridization between X. granatum and X. moluccensis was detected, from field observations or with molecular data, despite collecting samples from the same area and population in some cases (Philippines and Malaysia). In general, core mangrove species tend to have a sister mangrove species, e.g., Bruguiera gymnorhizaB. sexangula, Rhizophora stylosaR. mucronata, and Rhizophora mangleR. racemosa [58]. The distribution ranges of the sister species often overlap, and when they grow in the same location, hybrids are sometimes formed. Hybrid formation is quite common, especially for the mangrove species of Rhizophoraceae. Hybrid formation can be an important phenomena for plants to increase variation and promote speciation, but may not occur in Xylocarpus.

5. Conclusions

In this study, a clear genetic structure was detected within the distribution range of one of the most widespread and core component species of mangrove forests in the IWP. The genetic structure was shaped not only by the Malay Peninsula, a common land barrier for mangroves, but also by a cryptic barrier across the West Pacific. Moreover, the demographic inferences revealed that genetic divergence across the West Pacific was older than that across the Malay Peninsula, implying that a common factor such as the Sahul Shelf acted to shape the genetic structure of sea-dispersed mangrove plants. Other factors that generated genetic structure also need to be considered and evaluated in future studies, including adaptation to the local environment, ancient ocean currents, the location of refugia during the ice ages, and expansion routes during oscillation cycles. However, although further study would be needed, this study has provided tentative information on conservation genetics from a neutral genetic variation point of view, and the three groups detected in this study should be treated as independent conservation units in order to maintain local genetic diversity. In addition, conservation priority should be given to the Oceania region, as genetic diversity is lower and genetic isolation among populations is more prominent than in other areas.

Supplementary Materials

The following are available online at www.mdpi.com/1999-4907/8/12/480/s1, Figure S1: Neighbor-joining (NJ) tree for 18 populations of Xylocarpus granatum based on nuclear SSR dataset. Genetic distances were calculated by Populations 1.2.30. Statistical confidence of the topology was evaluated by 1000 bootstrap replicates. Figure S2: Plot of LnP(D) and ΔK calculated for K ranging from 1 to 13. See text for detail. Figure S3: (a) The prior and posterior distributions for each parameter and (b) Principal Component Analysis (PCA) of “model checking” for the scenario 1 in ABC1 obtained for Pop1 using DIYABC. Priors and posterior probability densities are shown in the Y-axis., Figure S4: (a) The prior and posterior distributions for each parameter and (b) Principal Component Analysis (PCA) of “model checking” for the scenario 1 in ABC1 obtained for Pop2 using DIYABC. Priors and posterior probability densities are shown in the Y-axis., Figure S5: (a) The prior and posterior distributions for each parameter and (b) Principal Component Analysis (PCA) of “model checking” for the scenario 2 in ABC1 obtained for Pop3 using DIYABC. Priors and posterior probability densities are shown in the Y-axis. Figure S6: (a) The prior and posterior distributions for each parameter and (b) Principal Component Analysis (PCA) of “model checking” for the scenario 1 in ABC2 using DIYABC. Priors and posterior probability densities are shown in the Y-axis. Figure S7: Geographical distributions of the five cpDNA haplotypes of Xylocarpus moluccensis. The size of the pie charts indicates sample size of the population. Population ID are defined in Table 1. The inset (bottom) denotes the haplotype network of XM1–5 extracted from Figure 2. Table S1: Prior distributions of the parameters used in ABC1, Table S2: Prior distributions of the parameters used in ABC2, Table S3: Demographic parameters of the most likely scenario in each region in ABC1 obtained by DIYABC, Table S4: Comparison of summary statistics for the observed data set and posterior simulated data sets in the most likely scenario in each region in ABC1, Table S5: Demographic parameters of the scenario 1 in ABC2 obtained by DIYABC, Table S6: Comparison of summary statistics for the observed data set and posterior simulated data sets in the scenario 2 in ABC2.

Acknowledgments

The authors thank Sankararamasubramanian Halasya Meenakshisundaram, Myint Aung, Ian Cowie, Sanjay Deshmukh, Norman Duke, Kyaw Kyaw Khaung, Jurgenne Primavera, Vando Márcio da Silva, Norhaslinda Malekal, Sengo Murakami, Hoho Takayama, Masaru Banba, Sabah Forestry Department (SFD), M. S. Swaminathan Research Foundation, and the Department of Environment and Natural Resources, Region VI for participation in fieldwork to collect materials. This work was supported by JSPS KAKENHI 22405005, 25290080 and 17H01414 to TK, JSPS JENESYS Programme 2009 and 2011 to the Graduate School of Science of Chiba University (coordinated by T.K.), TBRC Joint Usage Project Grant and the Collaborative Research Grant 2016 of the Tropical Biosphere Research Center, University of the Ryukyus (to T.K. and to Y.Ts.). This study is a part of the MSc dissertation of Y.To. at Chiba University. JSPS KAKENHI 17H01414 (to T.K.) covered the costs to publish this work in open access.

Author Contributions

Y.To., Y.Ts., K.T. and T.K. designed the study; Y.To., M.N.S. and K.T. conducted experiments; Y.To., Y.Ts., T.Y. and T.K. performed analyses; Y.To., M.N.S., A.K.S.W., K.T., O.B.Y., S.G.S., S.S., B.A., E.A., M.S., N.X.T., K.K.S., K.K., T.A., Y.W., S.B. and T.K. contributed to sampling; Y.Ts., M.N.S., A.K.S., K.T., T.Y. and T.K. wrote the paper.

Conflicts of Interest

The authors have no conflicts of interest to declare.

References

  1. Spalding, M. World Atlas of Mangroves; Routledge: Abingdon, UK, 2010. [Google Scholar]
  2. Duke, N.C.; Meynecke, J.-O.; Dittmann, S.; Ellison, A.M.; Anger, K.; Berger, U.; Cannicci, S.; Diele, K.; Ewel, K.C.; Field, C.D.; et al. A World without Mangroves? Science 2007, 317, 41–43. [Google Scholar] [CrossRef] [PubMed] [Green Version]
  3. Polidoro, B.A.; Carpenter, K.E.; Collins, L.; Duke, N.C.; Ellison, A.M.; Ellison, J.C.; Farnsworth, E.J.; Fernando, E.S.; Kathiresan, K.; Koedam, N.E.; et al. The loss of species: Mangrove extinction risk and geographic areas of global concern. PLoS ONE 2010, 5, e10095. [Google Scholar] [CrossRef] [PubMed] [Green Version]
  4. Richards, D.R.; Friess, D.A. Rates and drivers of mangrove deforestation in Southeast Asia, 2000–2012. Proc. Natl. Acad. Sci. USA 2016, 113, 344–349. [Google Scholar] [CrossRef] [PubMed]
  5. Gilman, E.L.; Ellison, J.; Duke, N.C.; Field, C. Threats to mangroves from climate change and adaptation options: A review. Aquat. Bot. 2008, 89, 237–250. [Google Scholar] [CrossRef]
  6. Duke, N.C.; Ball, M.C.; Ellison, J.C. Factors influencing biodiversity and distributional gradients in mangroves. Glob. Ecol. Biogeogr. Lett. 1998, 7, 27–47. [Google Scholar] [CrossRef]
  7. Liao, P.-C.; Havanond, S.; Huang, S. Phylogeography of Ceriops tagal (Rhizophoraceae) in Southeast Asia: The land barrier of the Malay Peninsula has caused population differentiation between the Indian Ocean and South China Sea. Conserv. Genet. 2007, 8, 89–98. [Google Scholar] [CrossRef]
  8. Minobe, S.; Fukui, S.; Saiki, R.; Kajita, T.; Changtragoon, S.; Ab Shukor, N.A.; Latiff, A.; Ramesh, B.R.; Koizumi, O.; Yamazaki, T. Highly differentiated population structure of a Mangrove species, Bruguiera gymnorhiza (Rhizophoraceae) revealed by one nuclear GapCp and one chloroplast intergenic spacer trnF-trnL. Conserv. Genet. 2010, 11, 301–310. [Google Scholar] [CrossRef]
  9. Urashi, C.; Teshima, K.M.; Minobe, S.; Koizumi, O.; Inomata, N. Inferences of evolutionary history of a widely distributed mangrove species, Bruguiera gymnorrhiza, in the Indo-West Pacific region. Ecol. Evol. 2013, 3, 2251–2261. [Google Scholar] [CrossRef] [PubMed]
  10. Takayama, K.; Tamura, M.; Tateishi, Y.; Webb, E.L.; Kajita, T. Strong genetic structure over the American continents and transoceanic dispersal in the mangrove genus Rhizophora (Rhizophoraceae) revealed by broad-scale nuclear and chloroplast DNA analysis. Am. J. Bot. 2013, 100, 1191–1201. [Google Scholar] [CrossRef] [PubMed]
  11. Ng, W.L.; Onishi, Y.; Inomata, N.; Teshima, K.M.; Chan, H.T.; Baba, S.; Changtragoon, S.; Siregar, I.Z.; Szmidt, A.E. Closely related and sympatric but not all the same: Genetic variation of Indo-West Pacific Rhizophora mangroves across the Malay Peninsula. Conserv. Genet. 2015, 16, 137–150. [Google Scholar] [CrossRef]
  12. Wee, A.K.S.; Takayama, K.; Chua, J.L.; Asakawa, T.; Meenakshisundaram, S.H.; Onrizal, B.A.; Ardli, E.R.; Sungkaew, S.; Malekal, N.B.; Tung, N.X.; et al. Genetic differentiation and phylogeography of partially sympatric species complex Rhizophora mucronata Lam. and R. stylosa Griff. using SSR markers. BMC Evol. Biol. 2015, 15. [Google Scholar] [CrossRef] [PubMed]
  13. Huang, Y.; Tan, F.; Su, G.; Deng, S.; He, H.; Shi, S. Population genetic structure of three tree species in the mangrove genus Ceriops (Rhizophoraceae) from the Indo West Pacific. Genetica 2008, 133, 47–56. [Google Scholar] [CrossRef] [PubMed]
  14. Ono, J.; Tsuda, Y.; Wee, A.K.S.; Takayama, K.; Onrizal, B.A.; Ardli, E.R.; Sungkaew, S.; Suleiman, M.; Tung, N.X.; Salmo, S.G., III; et al. Genetic structure of a widespread mangrove species Bruguiera gymnorhiza suggests limited gene flow by sea-dispersal in oceanic regions. Unpublished work. 2017. [Google Scholar]
  15. Budde, K.B.; González-Martínez, S.C.; Hardy, O.J.; Heuertz, M. The ancient tropical rainforest tree Symphonia globulifera L. f. (Clusiaceae) was not restricted to postulated Pleistocene refugia in Atlantic Equatorial Africa. Heredity 2013, 111, 66–76. [Google Scholar] [CrossRef] [PubMed]
  16. Tsuda, Y.; Nakao, K.; Ide, Y.; Tsumura, Y. The population demography of Betula maximowicziana, a cool-temperate tree species in Japan, in relation to the last glacial period: Its admixture-like genetic structure is the result of simple population splitting not admixing. Mol. Ecol. 2015, 24, 1403–1418. [Google Scholar] [CrossRef] [PubMed]
  17. Gutiérrez-Ortega, J.S.; Yamamoto, T.; Vovides, A.P.; Pérez-Farrera, A.M.; Martínez, J.F.; Molina-Freaner, F.; Watano, Y.; Kajita, T. Aridification as a driver of biodiversity: A case study for the cycad genus Dioon (Zamiaceae). Ann. Bot. 2017. [Google Scholar] [CrossRef] [PubMed]
  18. Bagnoli, F.; Tsuda, Y.; Fineschi, S.; Bruschi, P.; Magri, D.; Zhelev, P.; Paule, L.; Simeone, M.C.; González-Martínez, S.C.; Vendramin, G.G. Combining molecular and fossil data to infer demographic history of Quercus cerris: Insights on European eastern glacial refugia. J. Biogeogr. 2016, 43, 679–690. [Google Scholar] [CrossRef]
  19. Soliani, C.; Tsuda, Y.; Bagnoli, F.; Gallo, L.A.; Vendramin, G.G.; Marchelli, P. Halfway encounters: Meeting points of colonization routes among the southern beeches Nothofagus pumilio and N. antarctica. Mol. Phylogenet. Evol. 2015, 85, 197–207. [Google Scholar] [CrossRef] [PubMed]
  20. Tsuda, Y.; Semerikov, V.; Sebastiani, F.; Vendramin, G.G.; Lascoux, M. Multispecies genetic structure and hybridization in the Betula genus across Eurasia. Mol. Ecol. 2017, 26, 589–605. [Google Scholar] [CrossRef] [PubMed]
  21. Mabberley, D.J.; Pannell, C.M.; Sing, A.M. Flora Malesiana: Series I. Spermatophyta Volume 12, Part 1, 1995. Meliaceae; Rijksherbarium, Foundation Flora Malesiana: Leiden, The Netherlands, 1995; ISBN 9071236269. [Google Scholar]
  22. Doyle, J.J.; Doyle, J.L. A rapid DNA isolation procedure for small quantities of fresh leaf tissue. Phytochem. Bull. 1987, 19, 11–15. [Google Scholar]
  23. Demesure, B.; Sodzi, N.; Petit, R.J. A set of universal primers for amplification of polymorphic non-coding regions of mitochondrial and chloroplast DNA in plants. Mol. Ecol. 1995, 4, 129–131. [Google Scholar] [CrossRef] [PubMed]
  24. Taberlet, P.; Gielly, L.; Pautou, G.; Bouvet, J. Universal primers for amplification of three non-coding regions of chloroplast DNA. Plant Mol. Biol. 1991, 17, 1105–1109. [Google Scholar] [CrossRef] [PubMed]
  25. Small, R.L.; Ryburn, J.A.; Cronn, R.C.; Seelanan, T.; Wendel, J.F. The tortoise and the hare: Choosing between noncoding plastome and nuclear Adh sequences for phylogeny reconstruction in a recently diverged plant group. Am. J. Bot. 1998, 85, 1301–1315. [Google Scholar] [CrossRef] [PubMed]
  26. Thompson, J.D.; Gibson, T.J.; Higgins, D.G. Multiple sequence alignment using ClustalW and ClustalX. Curr. Protoc. Bioinform. 2002. [Google Scholar] [CrossRef]
  27. Tamura, K.; Peterson, D.; Peterson, N.; Stecher, G.; Nei, M.; Kumar, S. MEGA5: Molecular evolutionary genetics analysis using maximum likelihood, evolutionary distance, and maximum parsimony methods. Mol. Biol. Evol. 2011, 28, 2731–2739. [Google Scholar] [CrossRef] [PubMed]
  28. Clement, M.; Posada, D.; Crandall, K.A. TCS: A computer program to estimate gene genealogies. Mol. Ecol. 2000, 9, 1657–1659. [Google Scholar] [CrossRef] [PubMed]
  29. Weir, B.S.; Cockerham, C.C. Estimating F-statistics for the analysis of population structure. Evolution 1984, 38, 1358–1370. [Google Scholar] [CrossRef] [PubMed]
  30. Meirmans, P.G.; Hedrick, P.W. Assessing population structure: FST and related measures. Mol. Ecol. Resour. 2011, 11, 5–18. [Google Scholar] [CrossRef] [PubMed]
  31. Peakall, R.; Smouse, P.E. GenAlEx 6.5: Genetic analysis in Excel. Population genetic software for teaching and research-an update. Bioinformatics 2012, 28, 2537–2539. [Google Scholar] [CrossRef] [PubMed]
  32. Tomizawa, Y.; Shinmura, Y.; Wee, A.K.S.; Takayama, K.; Asakawa, T.; Yllano, O.B.; Salmo, S.G., III; Ardli, E.R.; Tung, N.X.; Binti Malekal, N.; et al. Development of 11 polymorphic microsatellite markers for Xylocarpus granatum (Meliaceae) using next-generation sequencing technology. Conserv. Genet. Resour. 2013, 5, 1159–1162. [Google Scholar] [CrossRef]
  33. Excoffier, L.; Smouse, P.E.; Quattro, J.M. Analysis of molecular variance inferred from metric distances among DNA haplotypes: Application to human mitochondrial DNA restriction data. Genetics 1992, 131, 479–491. [Google Scholar] [CrossRef] [PubMed]
  34. Nei, M.; Tajima, F.; Tateno, Y. Accuracy of estimated phylogenetic trees from molecular data. J. Mol. Evol. 1983, 19, 153–170. [Google Scholar] [CrossRef] [PubMed]
  35. Langella, O. Populations 1.2.30: Population Genetic Software (Individuals or Population Distances, Phylogenetic Trees). 2007. Available online: http://bioinformatics.org/~tryphon/populations/ (accessed on 25 July 2017).
  36. Parks, D.H.; Porter, M.; Churcher, S.; Wang, S.; Blouin, C.; Whalley, J.; Brooks, S.; Beiko, R.G. GenGIS: A geospatial information system for genomic data. Genome Res. 2009, 19, 1896–1904. [Google Scholar] [CrossRef] [PubMed]
  37. Pritchard, J.K.; Stephens, M.; Donnelly, P. Inference of population structure using multilocus genotype data. Genetics 2000, 155, 945–959. [Google Scholar] [CrossRef] [PubMed]
  38. Falush, D.; Stephens, M.; Pritchard, J.K. Inference of population structure using multilocus genotype data: Linked loci and correlated allele frequencies. Genetics 2003, 164, 1567–1587. [Google Scholar] [CrossRef] [PubMed]
  39. Earl, D.A.; von Holdt, B.M. STRUCTURE HARVESTER: A website and program for visualizing STRUCTURE output and implementing the Evanno method. Conserv. Genet. Resour. 2012, 4, 359–361. [Google Scholar] [CrossRef]
  40. Evanno, G.; Regnaut, S.; Goudet, J. Detecting the number of clusters of individuals using the software STRUCTURE: A simulation study. Mol. Ecol. 2005, 14, 2611–2620. [Google Scholar] [CrossRef] [PubMed]
  41. Kopelman, N.M.; Mayzel, J.; Jakobsson, M.; Rosenberg, N.A.; Mayrose, I. CLUMPAK: A program for identifying clustering modes and packaging population structure inferences across K. Mol. Ecol. Resour. 2015, 15, 1179–1191. [Google Scholar] [CrossRef] [PubMed]
  42. Cornuet, J.-M.; Santos, F.; Beaumont, M.A.; Robert, C.P.; Marin, J.-M.; Balding, D.J.; Guillemaud, T.; Estoup, A. Inferring population history with DIY ABC: A user-friendly approach to approximate Bayesian computation. Bioinformatics 2008, 24, 2713–2719. [Google Scholar] [CrossRef] [PubMed]
  43. Cornuet, J.-M.; Pudlo, P.; Veyssier, J.; Dehne-Garcia, A.; Gautier, M.; Leblois, R.; Marin, J.-M.; Estoup, A. DIYABC v2.0: A software to make approximate Bayesian computation inferences about population history using single nucleotide polymorphism, DNA sequence and microsatellite data. Bioinformatics 2014, 30, 1187–1189. [Google Scholar] [CrossRef] [PubMed]
  44. Estoup, A.; Jarne, P.; Cornuet, J.-M. Homoplasy and mutation model at microsatellite loci and their consequences for population genetics analysis. Mol. Ecol. 2002, 11, 1591–1604. [Google Scholar] [CrossRef] [PubMed]
  45. Garza, J.C.; Williamson, E.G. Detection of reduction in population size using data from microsatellite loci. Mol. Ecol. 2001, 10, 305–318. [Google Scholar] [CrossRef] [PubMed]
  46. Goldstein, D.B.; Ruiz Linares, A.; Cavalli-Sforza, L.L.; Feldman, M.W. Genetic absolute dating based on microsatellites and the origin of modern humans. Proc. Natl. Acad. Sci. USA 1995, 92, 6723–6727. [Google Scholar] [CrossRef] [PubMed]
  47. Wee, A.K.S.; Teo, J.X.H.; Chua, J.L.; Takayama, K.; Asakawa, T.; Meenakshisundaram, S.H.; Onrizal, B.A.; Ardli, E.R.; Sungkaew, S.; Suleiman, M.; et al. Vicariance, oceanic barriers and geographic distance drive contemporary genetic structure of widespread mangrove species Sonneratia alba in the Indo-West Pacific. Forests 2017, in press. [Google Scholar]
  48. Yamamoto, T.; Tsuda, Y.; Takayama, K.; Nagashima, R.; Tateishi, Y.; Kajita, T. The presence of a cryptic barrier in the West Pacific Ocean suggests the effect of glacial climate changes on a widespread sea-dispersed plant, Vigna marina (Fabaceae). Ecol. Evol. 2017. under review. [Google Scholar]
  49. Harwell, M.C.; Orth, R.J. Long-distance dispersal potential in a marine macrophyte. Ecology 2002, 83, 3319–3330. [Google Scholar] [CrossRef]
  50. Takayama, K.; Kajita, T.; Murata, J.; Tateishi, Y. Phylogeography and genetic structure of Hibiscus tiliaceus—speciation of a pantropical plant with sea-drifted seeds. Mol. Ecol. 2006, 15, 2871–2881. [Google Scholar] [CrossRef] [PubMed]
  51. Takayama, K.; Tateishi, Y.; Murata, J.; Kajita, T. Gene flow and population subdivision in a pantropical plant with sea-drifted seeds Hibiscus tiliaceus and its allied species: Evidence from microsatellite analyses. Mol. Ecol. 2008, 17, 2730–2742. [Google Scholar] [CrossRef] [PubMed]
  52. Miryeganeh, M.; Takayama, K.; Tateishi, Y.; Kajita, T. Long-distance dispersal by sea-drifted seeds has maintained the global distribution of Ipomoea pes-caprae subsp. brasiliensis (Convolvulaceae). PLoS ONE 2014, 9, e91836. [Google Scholar] [CrossRef] [PubMed]
  53. Voris, H.K. Maps of Pleistocene sea levels in Southeast Asia: Shorelines, river systems and time durations. J. Biogeogr. 2000, 27, 1153–1167. [Google Scholar] [CrossRef]
  54. Wyrtki, K. Physical Oceanography of the Southeast Asian Waters; Scientific Results of Marine Investigations of the South China Sea and the Gulf of Thailand; University of California, Scripps Institution of Oceanography: San Diego, CA, USA, 1961; Volume 2, p. 195. [Google Scholar] [CrossRef]
  55. Magri, D.; Vendramin, G.G.; Comps, B.; Dupanloup, I.; Geburek, T.; Gömöry, D.; Latałowa, M.; Litt, T.; Paule, L.; Roure, J.M.; et al. A new scenario for the Quaternary history of European beech populations: Palaeobotanical evidence and genetic consequences. New Phytol. 2006, 171, 199–221. [Google Scholar] [CrossRef] [PubMed]
  56. Tsuda, Y.; Ide, Y. Chloroplast DNA phylogeography of Betula maximowicziana, a long-lived pioneer tree species and noble hardwood in Japan. J. Plant Res. 2010, 123, 343–353. [Google Scholar] [CrossRef] [PubMed]
  57. Triest, L. Molecular ecology and biogeography of mangrove trees towards conceptual insights on gene flow and barriers: A review. Aquat. Bot. 2008, 89, 138–154. [Google Scholar] [CrossRef]
  58. Tomlinson, P.B. The Botany of Mangroves; Cambridge University Press: Cambridge, UK, 1986. [Google Scholar]
Figure 1. Geographical distributions of the four chloroplast (cp) DNA haplotypes of Xylocarpus granatum J. Koenig. The size of the pie charts indicates the sample size of the population. Population ID are defined in Table 1. The inset (bottom) denotes the haplotype network of the four haplotypes extracted from Figure 2.
Forests 08 00480 g001
Figure 2. A statistical parsimony network constructed using the concatenated cpDNA sequences used in this study. XG1–4 designate the haplotypes of Xylocarpus granatum J. Koenig and XM1–5 of Xylocarpus moluccensis M.Roem. XM4 was also possessed by Xylocarpus rumphii (Kostel.) Mabb.
Forests 08 00480 g002
Figure 3. Bayesian clustering analyses of nuclear simple sequence repeat (SSR) data for the 18 populations of Xylocarpus granatum J. Koenig. (a) Bar plots indicating the putative genetic ancestry of each individual in comparison with the cpDNA haplotype composition of each population. (b) Population neighbor-joining (NJ) tree reconstructed on a topographic map. Each branch was colored based on the population subdivision used for approximate Bayesian computation (ABC) analyses (Pop I: orange, Pop II: blue, and Pop III: green). (c) Plot of the second two coordinates of principal coordinates analysis (PCoA) based on the SSR data. Samples were colored according to the subdivision used for ABC analyses.
Forests 08 00480 g003
Figure 4. Scenarios tested using DIYABC in this study. (a) The four scenarios tested in ABC1. (b) The six scenarios tested in ABC2. See text for explanations. In all the scenarios, t# represents the time scale measured in number of generations, and N# represents the effective population size of the corresponding populations.
Forests 08 00480 g004
Table 1. Information of population samples used in this study.
IDCountryLocalityCoordinateChloroplast DNAhNulcear SSRs
nHnVoucher
Xylocarpus granatum J. Koenig
1MozambiqueMaputo25.85° S, E32.696° E920.198-TK10122702
2MozambiqueQuelimane17.883° S, 36.861° E410.0004TK10122504
3SeychellesMahe4.654° S, 55.403° E610.000-KT12022201
4MyanmarAyeyarwady15.95° N, 95.357° E610.0004TK11100805
5ThailandPhuket8.204° N, 98.442° E420.3754KT09121701
6MalaysiaKlang2.988° N, 101.355° E720.2454TK11121403
7MalaysiaKemaman4.65° N, 103.427° E610.0004TK11121603
8MalaysiaSabah5.945° N, 118.022° E610.0004TK11072202
9SingaporeSungei Buloh1.448° N, 103.73° E510.000-KT09111202
10IndonesiaJava7.709° S, 108.9° E610.000-KT09111508
11IndonesiaBali8.734° S, 115.197° E810.0004KT09111704
12VietnamDong Rui21.226° N, 107.375° E320.444-TK10050104
13PhilippinesPanay11.802° N, 122.207° E1110.0004TK11062404
14PalauAirai7.368° N, 134.576° E520.3204YT60917
15MicronesiaKosrae5.279° N, 162.973° E810.0003TK11121601
16VanuatuMalatie17.55° S, 168.341° E310.0004KT10073101
17New CaledoniaBaie de Taare22.259° S, 167.013° E710.0004KT13022607
18AustraliaDaintree River16.258° S, 145.399° E710.0003KT13031902
Total 111 Total 50
Xylocarpus moluccensis M.Roem.
19IndiaPichavaram11.431° N, 79.794° E210.000-TK10112308
20ThailandTrat12.165° N, 102.482° E220.500-KT09121902
21MalaysiaKlang3.038° N, 101.264° E710.000-TK11121404
22VietnamCa Mau8.716° N, 104.814° E110.000-TK10042705
23PhilippinesPanay11.802° N, 122.2° E410.000-TK11062405
24MyanmarAyeyarwady15.95° N, 95.357° E110.000-KK09122608
Total 17
Xylocarpus rumphii (Kostel.) Mabb.
25MalaysiaKilim6.42° N, 99.417° E110.000-KLG20130620
n: sample size; H: number of haplotypes; h: gene diversity. See text for detail. Voucher specimens are preserved at URO (University of the Ryukyus) or UPM (University Putra Malaysia); SSR: simple sequence repeat.
Table 2. Haplotypes identified by the concatenated sequences of three cpDNA intergenic regions. Polymorphic sites are designated by columns with the positions in the alignment of concatenated sequences.
trnD–trnTtrnL–trnFaccD–psaI
HaplotypeAccession No.4185191196–201202223231232404Accession No.946950979Accession No.1222126613251525
Xylocarpus granatum J. Koenig
XG1LC217845CAA-TTAATLC217851CCCLC217857GCA-
XG2LC217846CAC-TTAATLC217851CCCLC217857GCA-
XG3LC217846CAC-TTAATLC217851CCCLC217858GCG-
XG4LC217846CAC-TTAATLC217852TACLC217858GCG-
Xylocarpus moluccensis M. Roem.
XM1LC217847TCCAAAGGAAGAAGLC217853TCGLC217859GGG-
XM2LC217847TCCAAAGGAAGAAGLC217854CCCLC217859GGG-
XM3LC217848TCCAAAGGAAGGAGLC217854CCCLC217860AGGT
XM4LC217848TCCAAAGGAAGGAGLC217855TACLC217860AGGT
XM5LC217849TCCAAAGGAAGGGGLC217855TACLC217860AGGT
Xylocarpus rumphii (Kostel.) Mabb.
XR (XM4)LC217850TCCAAAGGAAGGAGLC217856TACLC217861AGGT
Table 3. Analysis of molecular variance (AMOVA) for 50 individuals of X. granatum based on 11 nuclear SSRs.
Source of VariationTotal Variance (%)F-Statisticsp-ValueF'-Value
13 populations
Among populations40.4%FST = 0.4040.001F'ST = 0.802
Among individuals within populations59.6%---
K = 2
Among group19.8%FRT = 0.1980.001F'RT = 0.748
Among population within groups27.2%FSR = 0.3390.001F'SR = 0.678
Among individuals within populations53.0%FST = 0.4700.001-
K = 3
Among group18.3%FRT = 0.1830.001F'RT = 0.648
Among population within groups24.9%FSR = 0.3020.001F'SR = 0.610
Among individuals within populations56.8%FST = 0.4320.001-
Between the Indian Ocean (Pop 2,4,5 and 6) and the South China Sea (Pop 7,8,11,13 and 14)
Among group10.4%FRT = 0.1040.001F'RT = 0.389
Among population within groups23.9%FSR = 0.2660.001F'SR = 0.577
Among individuals within populations65.8%FST = 0.3420.001-
Between the Indian Ocean (Pop 2,4,5 and 6) and Oceania (Pop 15,16,17 and 18)
Among group11.6%FRT = 0.1160.001F'RT = 0.416
Among population within groups23.5%FSR = 0.2660.001F'SR = 0.567
Among individuals within populations64.9%FST = 0.3510.001-
Between the South China Sea (Pop 7,8,11,13 and 14) and Oceania (Pop 15,16,17 and 18)
Among group25%FRT = 0.2460.001F'RT = 0.815
Among population within groups21%FSR = 0.2830.001F'SR = 0.572
Among individuals within populations54%FST = 0.4590.001-
SSR: simple sequence repeat.
Table 4. Posterior probability of each scenario in ABC1 and its 95% hyper probability density (HPD) based on the logistic estimate by DIYABC v2.0 [42,43]. The scenarios tested in ABC1 are shown in Figure 4.
ABC1Posterior Probability (95% Confidence Interval (Lower–Upper))
ScenarioRegion 1Region 2Region 3
10.2640 (0.2586–0.2693)0.2564 (0.2477–0.2651)0.2554 (0.2500–0.2607)
20.2543 (0.2491–0.2596)0.2645 (0.2482–0.2660)0.3917 (0.3858–0.3977)
30.2340 (0.2288–0.2392)0.2221 (0.2136–0.2305)0.1624 (0.1579–0.1669)
40.2477 (0.2420–0.2533)0.2571 (0.2482–0.2660)0.1905 (0.1858–0.1952)
Table 5. Posterior probability of each scenario in ABC2 and its 95% hyper probability density (HPD) based on the logistic estimate by DIYABC v2.0 [42,43]. The scenarios tested in ABC2 are shown in Figure 4.
ABC2
ScenarioPosterior Probability (95% Confidence Interval: Lower–Upper)
10.3794 (0.3712–0.3877)
20.0839 (0.0784–0.0893)
30.3111 (0.3031–0.3190)
40.0877 (0.0821–0.0934)
50.0590 (0.0541–0.0639)
60.0789 (0.0734–0.0844)

