Fire-Driven Decline of Endemic Allosyncarpia Monsoon Rainforests in Northern Australia

Darwin Centre for Bushfire Research, Charles Darwin University, Darwin, NT 0909, Australia
*
Author to whom correspondence should be addressed.
Forests 2017, 8(12), 481; https://doi.org/10.3390/f8120481
Submission received: 29 September 2017
/
Revised: 16 November 2017
/
Accepted: 1 December 2017
/
Published: 5 December 2017
(This article belongs to the Section Forest Ecology and Management)
Abstract
:Although contemporary fire regimes in fire-prone Australian savannas are recognised as having major impacts on an array of biodiversity and environmental values, a number of studies have observed significant monsoon rainforest expansion in recent decades. Here we assess the status of a locally extensive endemic monsoon rainforest type, dominated by Allosyncarpia ternata (Myrtaceae), restricted to sandstone terrain including in the World Heritage property, Kakadu National Park. We undertook assessments of: (1) geographic correlates of Allosyncarpia forest distribution; (2) change in canopy cover at 40 representative forest patches at topographically exposed sites with reference to a 60-year aerial photo and fine-scale image archive, and fire mapping data; and (3) structural characteristics associated with sites exhibiting stable, contracting, and increasing canopy cover. Mean canopy cover at sampled forest patches declined by 9.5% over the study period. Most canopy loss occurred at the most fire-susceptible patches. Assessment of structural characteristics at sampled sites illustrated that canopy expansion represented vegetative recovery rather than expansion de novo. The study (1) confirms the vulnerability of exposed margins of this forest type to fire incursions; (2) illustrates the magnitude of, and describes solutions for addressing, the regional conservation management challenge; and (3) serves as a reminder that, in savanna environments, severe fire regimes can substantially outweigh the woody growth-enhancing effects of other regional (e.g., increased rainfall) and global-scale (e.g., atmospheric CO2 fertilisation) drivers.
1. Introduction
Fire regimes are recognised as being a major driver affecting the dynamics of savanna systems, including the balance of tree-grass components and the relative stability of savanna—forest margins. In the absence of burning, or even under conditions of frequent low intensity fires, substantial increases in savanna woody biomass, or extensive forest invasion of surrounding savanna vegetation, have been reported worldwide from a large number of observational and experimental studies [1,2,3,4,5,6,7,8,9,10,11]. Given that savannas contribute 30% of terrestrial net primary production [12] and the majority of global fire emissions [13], understanding the effects of savanna fire regimes and interactions with other drivers of savanna biomass change (e.g., land use, climate, CO2 fertilisation) assumes increasing significance in an age of accelerating climate change including rising atmospheric CO2 [14,15,16].
A substantial body of evidence indicates that contemporary anthropogenic fire regimes are causing significant impacts on a wide range of fire-vulnerable biodiversity elements in north Australia’s relatively unmodified savannas, including: avifauna [17,18]; small mammals [19,20], and obligate seeding flora [21,22,23]. In large part, these recent fire regime impacts can be attributed to widespread Aboriginal societal collapse from the end of the nineteenth century, and associated breakdown of former systematic fire management approaches focusing on imposing fine-scale spatial patchiness over the annual burning season [24,25,26]. In the absence of such intensive management, north Australian savanna fire regimes today are characterised generally by the incidence of frequent, extensive and relatively intense late dry season fires, especially in biodiverse higher-rainfall northern regions [27,28].
Despite these observed fire impacts, recent assessments suggest that contemporary regional fire regimes have had limited effects on vegetation structural attributes at landscape scales. For example, a recent meta-analysis incorporating a number of local and regional studies suggests there has been a general, if weak, trend of woody thickening in regional savannas in recent decades [29], especially in higher rainfall locations [10].
Likewise, many north Australian studies have reported expansion of typically small (<10 ha) patches or larger tracts of monsoon rainforest vegetation within the savanna matrix, particularly under higher rainfall conditions [5,6,7,30,31,32,33,34,35]. In different situations, such expansion has been attributed variously to reduced burning or browsing pressure, increased rainfall in recent decades, possible CO2 fertilisation, and interactions between these. Although severe fires can incur significant impacts especially on closed forest margins [36], monsoon rainforest expansion has been observed in conjunction with frequent, presumably lower severity fires under relatively moist, productive site conditions [5,37].
Here, we present a reassessment of reported recent expansion of monsoon rainforest occupying mostly rugged sandstone uplands in the Top End of the Northern Territory, Australia. This monsoon rainforest type, dominated by the regional endemic Allosyncarpia ternata S.T. Blake (Myrtaceae), occupies an area of 113,800 ha [38], representing ~25% of all monsoon rainforest in northern and north-western Australia [36]. For a smaller region describing the western-most extent of Allosyncarpia’s range in Kakadu National Park, Bowman and Dingle [33] reported a net 21% expansion of this forest type based on analysis of canopy cover change at 12 sampled areas using the available aerial photographic record, 1964–2004. While observing that forest expansion was negatively correlated with fire activity, these authors attributed the expansion to a regionally wetter climate since the mid-20th century and elevated CO2. Expansion of this forest type contrasts with other regional observations concerning current fire regime impacts on: (1) the catastrophic decline of the fire-sensitive conifer, Callitris intratropica, in adjoining savannas and on Allosyncarpia forest margins [21,39,40,41,42]; (2) stable or slightly contracting Allosyncarpia forest boundaries associated with decadal long-term monitoring plot observations [43]; and (3) contiguous extensive regional heathland floral diversity and associated fauna, now listed nationally as an Endangered Community with frequent wildfire identified as the key threatening process [22,44,45].
Given the critical regional biodiversity conservation management implications of these contrasting observations, in this paper we reassess decadal-scale Allosyncarpia forest change based on the available aerial photo record 1950–2010 at 40 exposed sites and associated fire records, and detailed on-ground vegetation structure sampling. The assessment seeks to address whether, in unmodified savanna landscape contexts, the influence of regional fire regimes may strongly outweigh climatic and global drivers.
2. Materials and Methods
2.1. Study Area
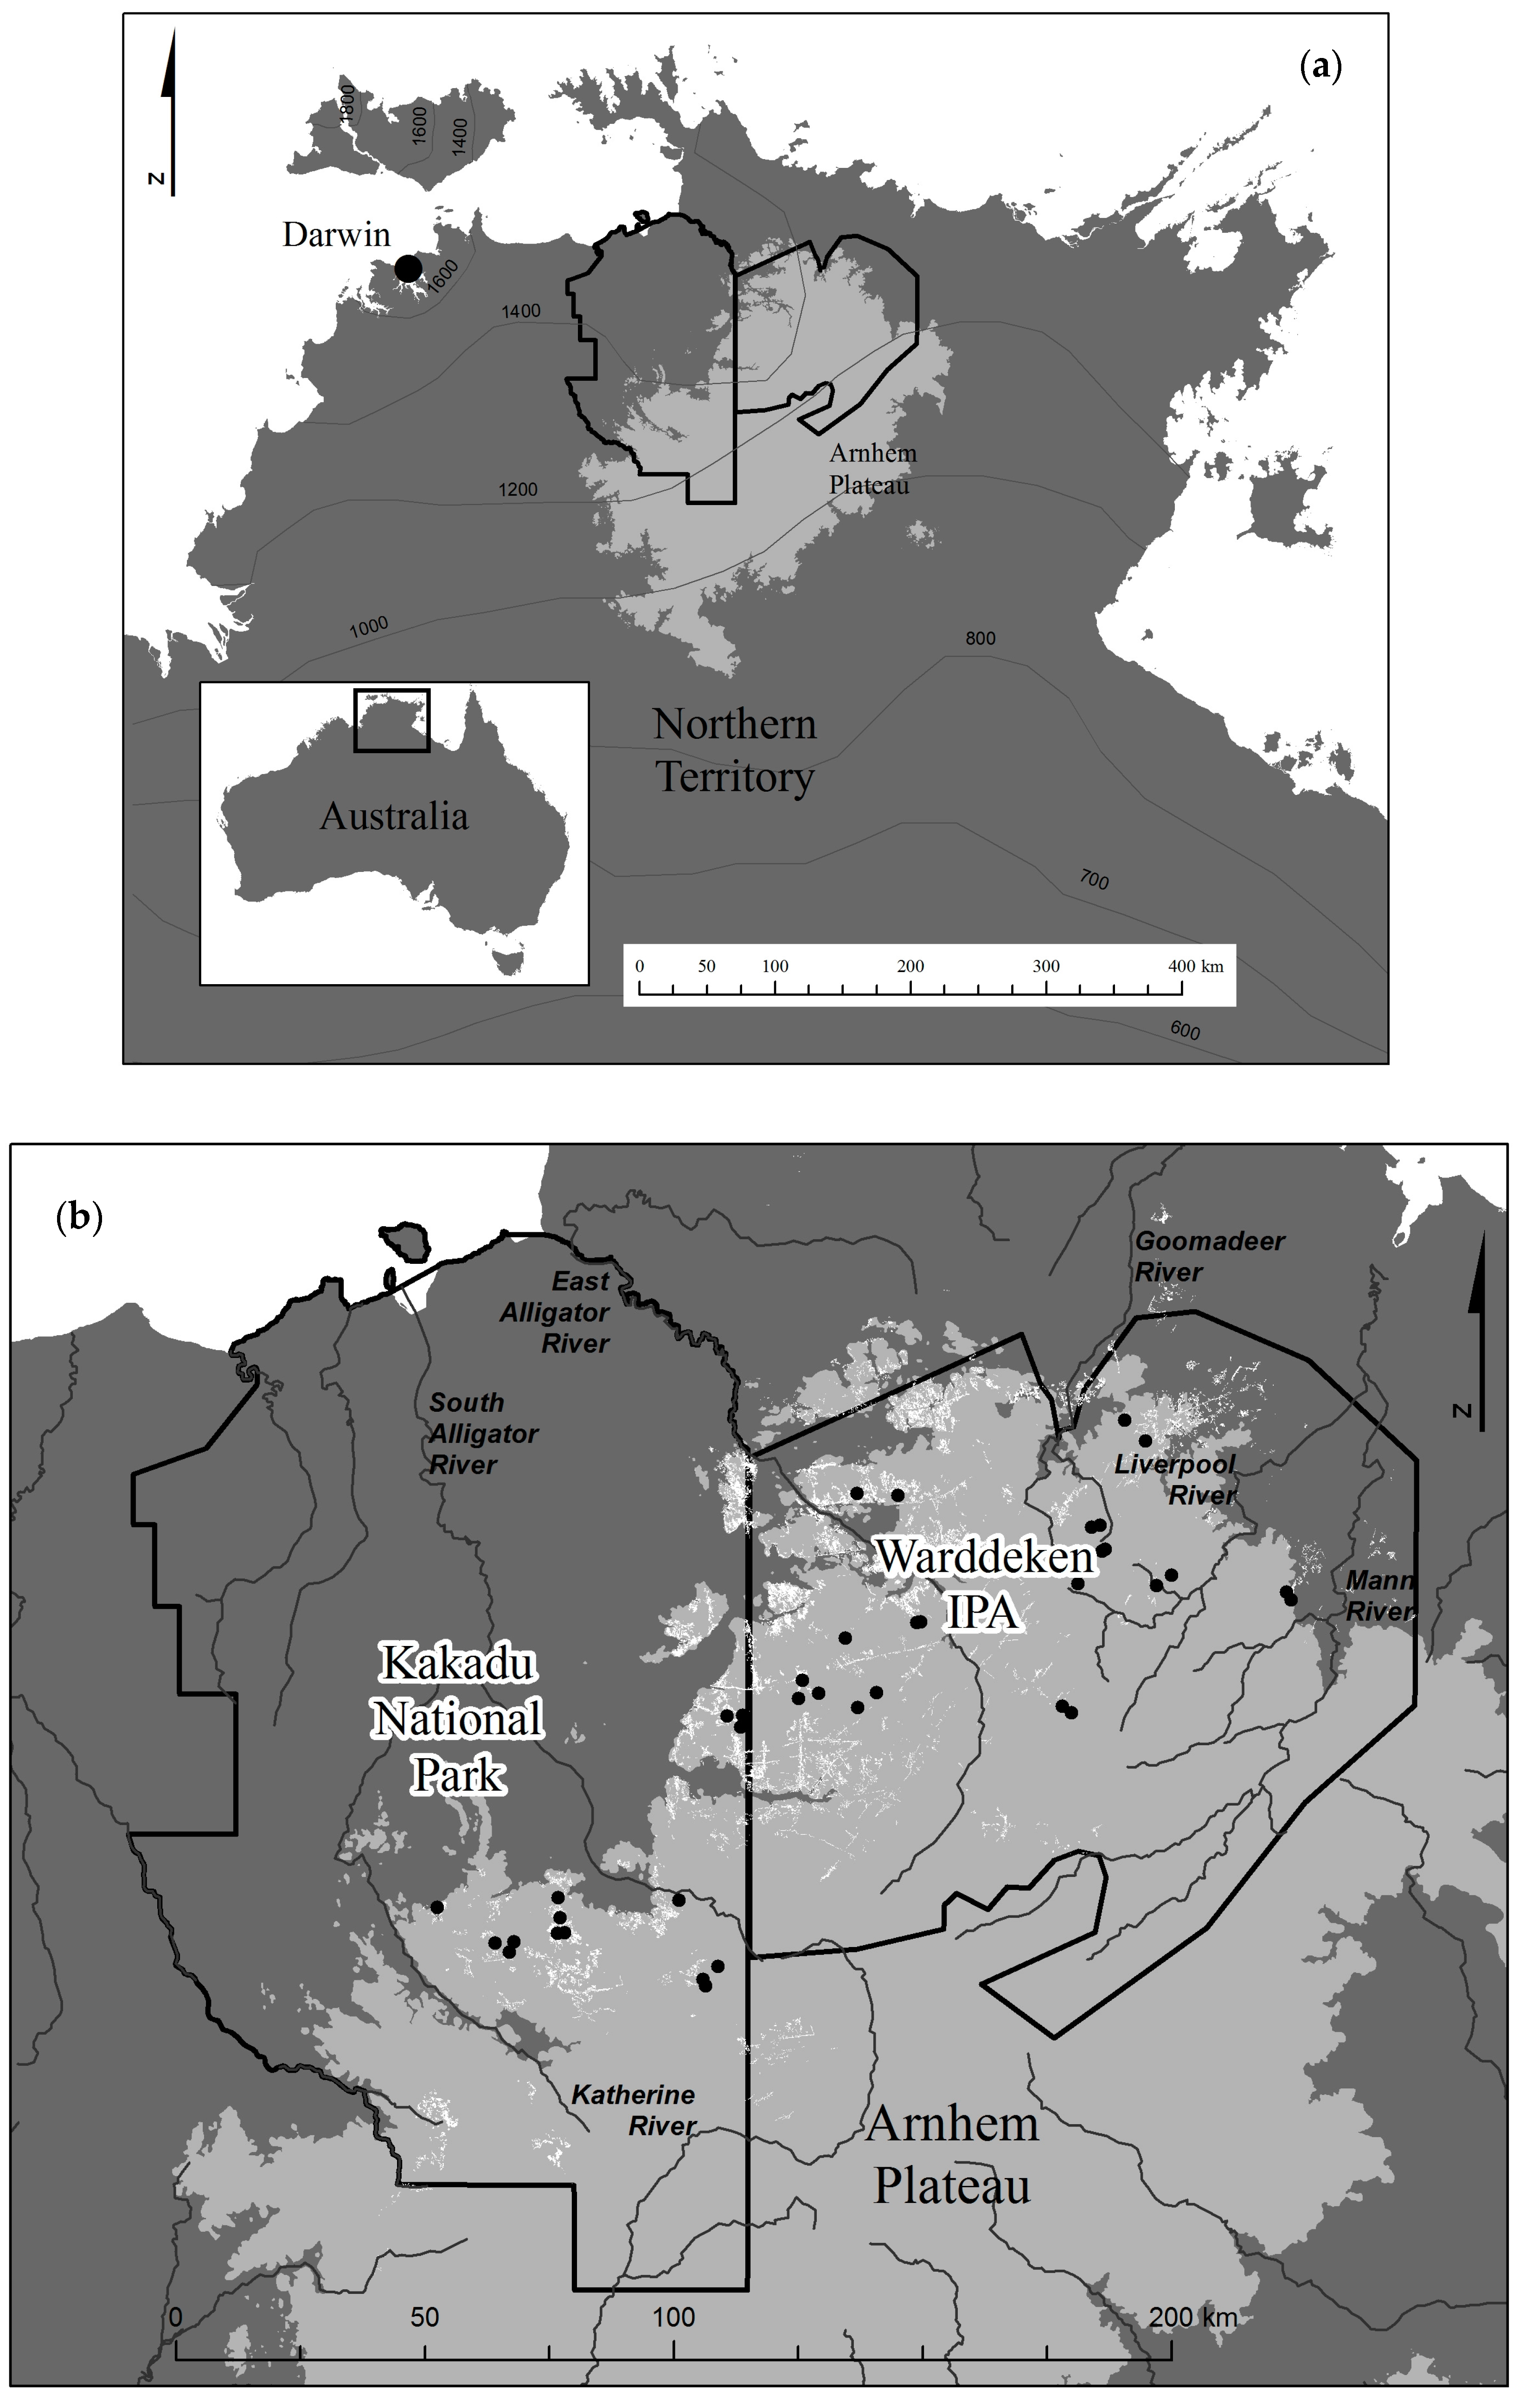
The Arnhem Plateau study area is located in Australia’s remote tropical north, 350 km to the east of Darwin (Figure 1a). The Arnhem Plateau mostly comprises an extensive Proterozoic sandstone platform at 200–400 m elevation, covering approximately 25,000 km2. This study focuses on an area of 29,600 km2, slightly larger than the nationally mapped Arnhem Plateau Bioregion [46], home to around 1000 animal and 2000 plant taxa (Atlas of Living Australia: www.ala.org.au/). The region is recognised nationally and internationally for its biodiversity values [44,45,47,48].
The plateau is sharply defined on its western and northern edges by cliffs but less clearly defined in the south and east. It is dissected by major drainage lines and is topographically characterised by rocky gorges and extensive areas of heavily eroded rocky outcrops, platforms, and extensive areas of savanna plains. The sandstone rock is both porous and permeable which allows for significant ground water infiltration [49].
The regional climate is tropical monsoonal with temperatures consistently over 30 °C year-round [50]. Nearly all rain falls in the wet season between October and April, with peak rainfall from December to March. The region receives around 1450 mm of rainfall per annum with declining falls to the south and west of around 1200 mm.
Vegetation of the Arnhem Plateau is dominated by extensive savanna woodlands and open forests on shallow to deeper sandy soils, with tracts of shrubby heath vegetation occurring on shallow sandsheets and skeletal, rocky substrates [51]. Allosyncarpia forests occupy a range of sandstone-derived substrates, from moist valley sediments to steep, freely draining, rocky sites. Allosyncarpia is especially dominant on seasonally dry substrates where it provides over 80% basal area and effectively the entire canopy [38]. It is commonly associated with the obligate seeder conifer, Callitris intratropica. Although Allosyncarpia is relatively fire-tolerant given that established juveniles re-sprout prolifically after fire [52], termite-affected over-mature adults are susceptible to fire mortality once stems are ignited [41].
Climatic conditions promote rapid grass and litter fuel accumulation such that fires may recur within 1–3 years of having been burnt previously [53,54]. Fire severity generally increases with the progression of the dry season given increasingly severe fire weather (stronger winds, higher temperatures, lower humidity), and lower fuel moisture conditions [55]. Over much of the study region fire is a recurrent disturbance, especially in the south and south-east associated with more flat topography and prevailing south-easterly winds in the dry season [56]. Densities of browsing and grazing feral animals (Asian water buffalo [Bubalus bubalis], cattle [Bos Taurus, B. indicus]) were largely uncontrolled over the study period, and are consistently high in localised situations in western Arnhem Land, especially along watercourses [57].
Known by its Aboriginal custodians as warddewardde, the ‘stone country’ is also rich in cultural assets. The Arnhem Plateau region has been continuously occupied by people for at least 60,000 years [58,59], and use of fire over thousands of years is integral to the regional ecology. Fire usage was, and in some localised regions of the Arnhem Plateau especially, remains multifaceted and intricate [26,40,57,60,61]. Allosyncarpia forests, or anbinik anngarre, are highly valued as important camping, food and cultural sites. Individual forest patches are known to have been actively protected by site-specific traditional burning practices [61]. Following major Aboriginal depopulation of the region from the late 19th century [25,62], breakdown of the traditional fire regime has resulted in less frequent but extensive late dry season wildfires sweeping across the region, with significant impacts on fire-sensitive species and vegetation types [21,42,45,57].
2.2. Allosyncarpia Distribution Mapping
To provide a geographic context for the study as a whole, we utilised new 1:25,000 mapping of the distribution of Allosyncarpia-dominated forest extent across its entire range (J. Freeman, unpublished) and the geographic relationships between Allosyncarpia forest distribution mapping at 1:25,000, with available cadastral and biophysical Geographic Information System (GIS) datasets. Allosyncarpia forest patches are characterised by distinctive dense, closed canopies, which can be readily mapped (Figure 2). The new Allosyncarpia mapping was undertaken predominantly by manual digitisation of sub-1m Digital Globe (Worldview and GeoEye satellites imagery (October 2014), supplemented with small sections derived from Quickbird (0.6–2.4 m) imagery. A minimum of four identifiable canopy trees in a cluster (~1 ha) was used as the smallest area to be digitised; open areas with Allosyncarpia canopy-free areas larger than 50 × 50 m were excised. Based on extensive validation assessments, reliability of the revised Allosyncarpia distribution map was found to be >99%, and boundary locational errors ±3 m. Greater detail on mapping methods will be available in a forthcoming paper.
The 1:25,000 Allosyncarpia map was intersected with available and derived GIS datasets, including: digital elevation and slope (derived from the SRTM 1 s (30 m) Digital Elevation Model (DEM) [63], tenure boundaries, biogeographic regions (after Thackway and Cresswell [46]), geology [64], and assembled hydrology and rainfall surfaces. A drainage map layer covering the study area, at 1:100,000, was derived from the DEM (using the hydrology functions: ESRI 2011. ArcGIS Desktop: Release 10. Redlands, CA: Environmental Systems Research Institute, USA). This was refined with reference to existing topographical maps and high-resolution imagery. Drainage lines were allocated a stream order, with an order of 5 or above defined as a ‘major’ waterway. Using the same DEM, slope angles were classified as flat (0–5°), rugged (5–20°), and steep (>20°). Available multi-decadal rainfall data for 11 regional rainfall stations (Source:Bureau of Meteorology, Commonwealth of Australia), were used to create an interpolated annual rainfall map for the study area. A GIS layer of 10,000 random points occurring within Allosyncarpia forest patches was used to determine relationships between the regional distribution of Allosyncarpia forest with above geographic descriptors.
2.3. Canopy Cover Change Assessment
Based on mapping described above of Allosyncarpia forest extent, targeted aerial photo analyses and associated field surveys were undertaken at a subset of sites in topographically exposed and semi-exposed situations. Initial selection of potential study sites was conducted via a stratified GIS process designed to produce wide geographic sampling and to meet the requirements of sound aerial photography interpretation. The study aimed to map canopy dynamics of distinct individual forest patches, with topographically unimpeded capacity for expansion; e.g., we did not sample sites located in steep terrain (>20°), including cliffs and deeply dissected canyons, which significantly inhibit potential forest expansion into adjacent vegetation, and where aerial photo interpretation of canopy change can be difficult to assess.
A total of 40 discrete Allosyncarpia patches, covering a total area of 1201 ha in 1950, were selected for canopy change assessment based on set criteria (Table 1). Size criteria included selection of larger patches (10–150 ha extent), at least 100 m from another patch (>10 ha). Patch shape criteria were applied to exclude highly complex or elongated forest patches based on edge/area, calculated as the percentage of patch perimeter (km) to patch area (ha); and threshold criteria were applied to patches of different sizes (Table 1). Allosyncarpia forest associated with major rivers, and within 50 km of the coast, were omitted to exclude effects of potential flooding and cyclonic impacts, respectively. Approximately equal numbers of patches were selected to be representative of relatively rugged sandstone (24 patches), and open sandy (16 patches) terrain, and in eastern (14 patches), western (14 patches) and southern (12 patches) regions.
For comparative purposes, near-consistent sample dates were required for images, as well as functionally similar scales of photography or imagery to provide comparable image resolution (Table 1). A GIS database of rectified aerial photo flight line diagrams was created, and pertinent air photos from 1950 (1:50,000), 1982/87 (1:50,000/1:60,000), and high-resolution satellite images from 2010 (sub-1 m pixels), were obtained.
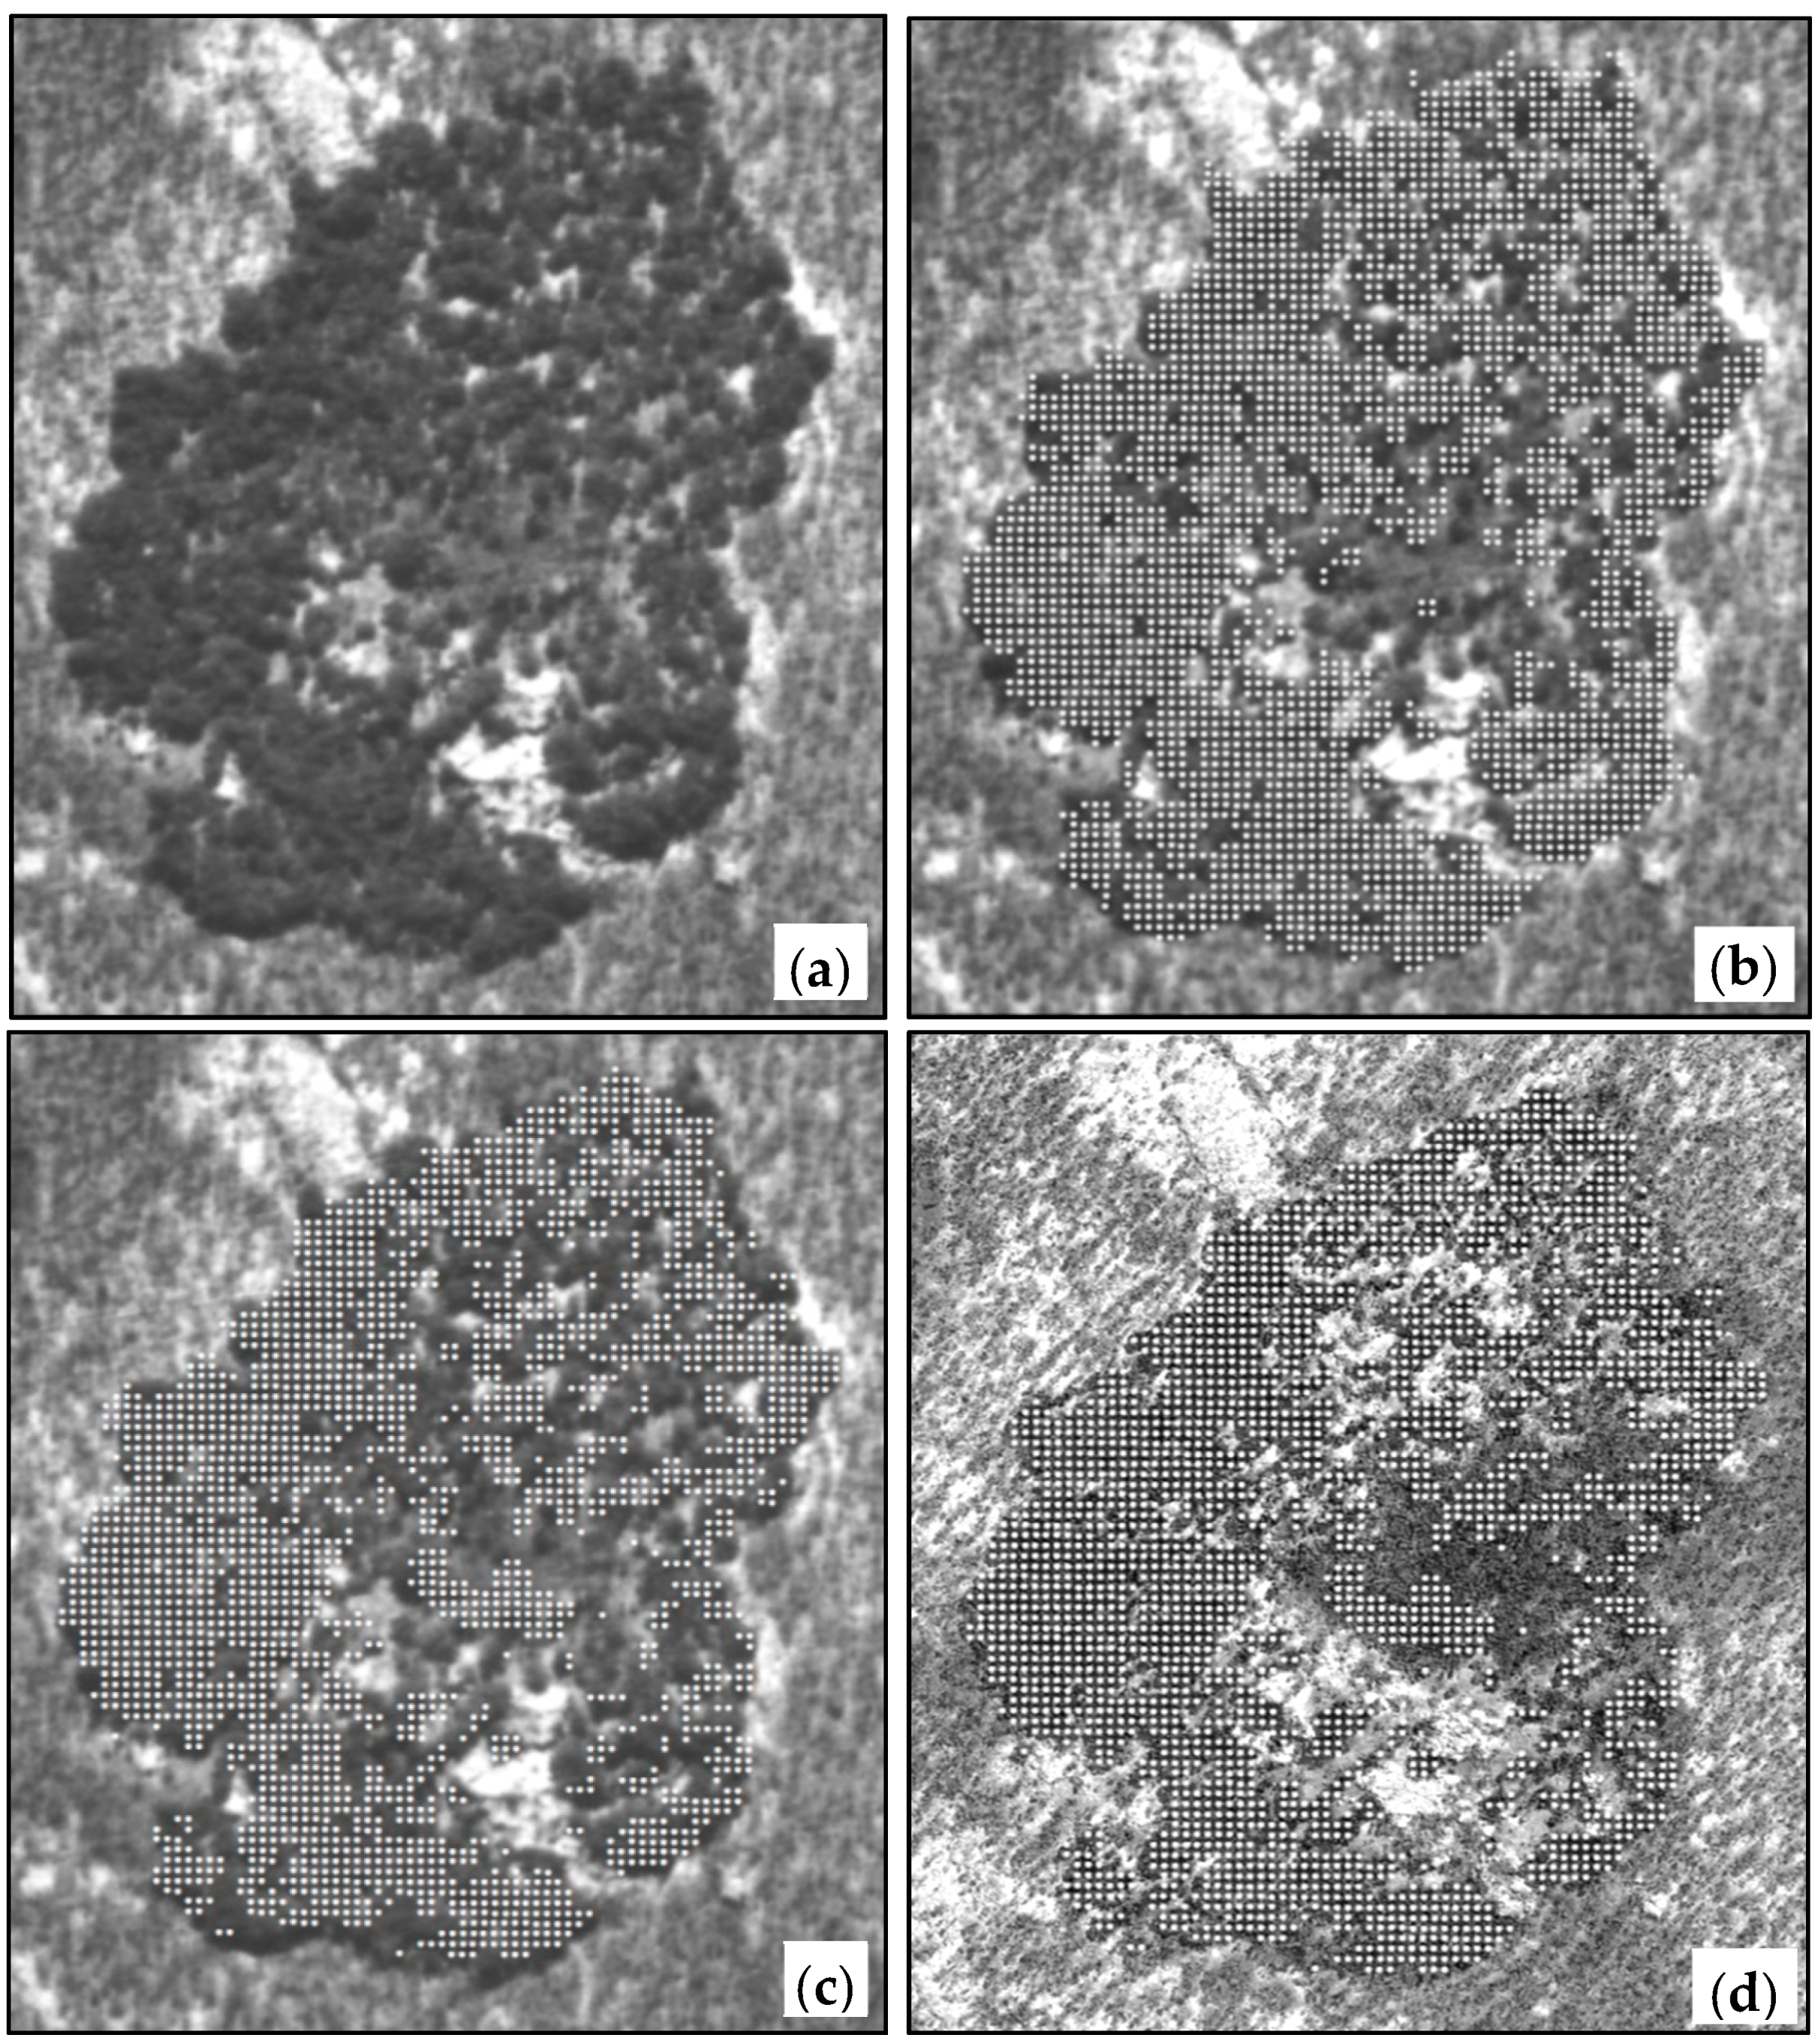
Scanned aerial photos and satellite images were standardised to 1 m resolution in a GIS, and used to determine whole-of-patch canopy cover for each site. The 2010 imagery operated as the base layer, and historical aerial photos were rectified onto these with very high accuracy (RMS error consistently <2 m). A 10 m grid-point GIS overlay was created for each selected site and period, with attribution of each point as ‘canopy’ or ‘not canopy’ (Figure 2). Attribution was undertaken visually since the human eye’s capacity to pick up colour, tone, shadow, shape, texture and context exceeds current automated methods [65]. Sampling of ~120,000 points for 3 time periods was undertaken for this assessment. Net change in canopy cover extent was assessed for respective sample patches and time intervals.
Relationships between canopy cover change and frequency of annual and seasonal fire incidence at respective study sites were assessed with reference to the available Landsat imagery archive covering the second canopy cover change assessment period, 1982/87–2009, where: (1) the commencement year for fire incidence assessment was dependent on whether suitable aerial photo coverage was available for respective patches from either 1982 or 1987; (2) the end year describing the last fire season before Allosyncarpia mapping imagery was captured in 2010; (3) fire incidence was recorded from available fire mapping data (see below) for each instance where fire mapping overlapped with any portion of Allosyncarpia forest canopy extent. Fire mapping data were derived from published records [42,66], supplemented by Landsat imagery available from the online USGS Landsat Look viewer (https://landsatlook.usgs.gov/). Fire seasonality was determined from available imagery and recorded as occurring in either the early dry season (EDS; before end of July), or late dry season (LDS; August onwards). Fire seasonality is strongly correlated with fire intensity and resultant severity, with LDS fires typically being substantially more severe [55,67]. Two-tailed t-tests were used to assess the significance of net canopy cover change at the 40 sites over the assessment period.
The fire susceptibility of respective patches was derived, using the GIS, with reference to an index describing the proportion of a 250 m buffer surrounding each forest patch exposed to flammable savanna vegetation; i.e., not including unvegetated rocky terrain. For illustrative purposes, the fire susceptibility of respective patches exposed to flammable savanna was rated as low (<30%), moderate (30–49%), or high (≥50%). At all selected sites, at least some proportion of respective forest patch margins was exposed to flammable savanna vegetation and to allow for topographically unimpeded canopy expansion. Simple linear regressions were used to test for relationships between canopy cover change and EDS and LDS fire incidence in the second assessment period, 1982/87–2010. Differences in canopy cover change at sites with boundaries relatively little exposed to fire versus those more substantially exposed were assessed with two-tailed t-tests.
2.4. On-Ground Vegetation Structure Assessment of Canopy Change
Canopy cover change assessments derived from aerial photos at the 40 study sites identified areas where canopy extent had decreased, increased or was stable, using a threshold change in area of at least 2.5%. Considering net canopy cover change data only for the second assessment period, 1982/87–2010, on-ground assessments of Allosyncarpia size-class structures were conducted in 2011 at 29 locations from 10 of the 40 study sites broadly representative of Allosyncarpia’s geographic distributional envelope. Survey transects (50 × 20 m) were established parallel with and within patch margins, randomly at 14 locations exhibiting decreased canopy extent, 7 exhibiting increased canopy extent, and 8 where canopy extent was stable.
Numbers of established Allosyncarpia ‘juveniles’ (i.e., individuals without cotyledons) were recorded in ten 5 × 4 m quadrats along the central core of each 50 m transect in three classes (<50 cm tall; 50–200 cm tall; >200 cm–<10 cm DBH [diameter at breast height, 1.3 m]). Given the lack of clonal capacity in Allosyncarpia, each established juvenile represents an individual developed from seed [52]. The DBH of living and non-living Allosyncarpia tree stems ≥10 cm DBH was measured in consecutive 5 × 10 m quadrats either side of a central tape. Where (dead) stumps were <1.3 height, an estimate of their basal diameter was recorded. Assessments concerning localised impacts of Asian water buffalo were also undertaken but, as considered further in Discussion, impacts were not evident at the great majority of surveyed patches and minor in others.
3. Results
3.1. Allosyncarpia Forest Distribution
The revised 1:25,000 Allosyncarpia distribution map, based on high resolution (metre-scale) imagery, provides a major refinement over earlier mapping and resulting in a substantial reduction on an earlier estimate of 113,800 ha [38] to 73,500 ha. Using this revised mapping, we determined that 62% of Allosyncarpia forest is in the Warddeken Indigenous Protected Area, 32% in Kakadu National Park, and the remainder on adjacent indigenously owned lands. Allosyncarpia forest occurrence is evenly distributed within the 1600–1300 mm rainfall isohyets despite only 35% of the Arnhem Plateau receiving mean annual rainfall in excess of 1400 mm (Table 2).
Despite sandstone surfaces comprising only just over half of the study area, 90% of Allosyncarpia forest occurs on rocky sandstone surfaces, with the remainder on sandy sedimentary surfaces. Whilst terrain classified as Steep and Rugged comprise 3% and 23% respectively of the plateau surface, they account for 73% of Allosyncarpia forest extent; 27% of Allosyncarpia extent is located on flat terrain. Just 1% of Allosyncarpia forest occurs within 250 m of a major river, and 8% within 25 m of a drainage line (Table 2).
3.2. Canopy Cover Change
Canopy change assessment was undertaken at 40 sites, mostly (62.5%) on flat surfaces, and generally evenly distributed in Rocky and Sandy terrain (Table 2). The distribution of these sample sites, broadly representative of the geographic span of Allosyncarpia forest across the north-west sector of the Arnhem Plateau, is given in Figure 1b. Over the 60-year assessment period, canopy cover declined significantly by a mean of 9.5% at the 40 sample sites (t-test, p = 0.04), including a net 3.7% (ns) in the first period 1950–1982/87, and a net 6.1% (ns) in the second period ending in 2010, (Table 3). Over the whole period, canopy cover declined by >2.5% at 29 patches, increased at 8, and was stable at 3, (Table A1). Canopy cover declined disproportionately at patches occurring under lower rainfall conditions, on flat terrain, and in the generally less rugged (and more fire-vulnerable) eastern sector (Table 3). Collectively, sample sites represented 1.6% of total mapped Allosyncarpia extent, and 86% of Allosyncarpia forest occurrence (i.e., in non-steep locations) (Table 2).
No significant relationships between canopy cover change and fire incidence were observed in the second assessment period, 1982/87–2010, either with frequency of all fires (F = 3.1; p = 0.1), or with just LDS fires (F = 1.2; p = 0.7). However, there was an observable difference (t-test; p =0.003) in canopy cover change between those patches with boundaries relatively little exposed to fire (mean = +2%) versus those more substantially exposed (mean = −11%) (Figure 3).
3.3. On-Ground Assessment
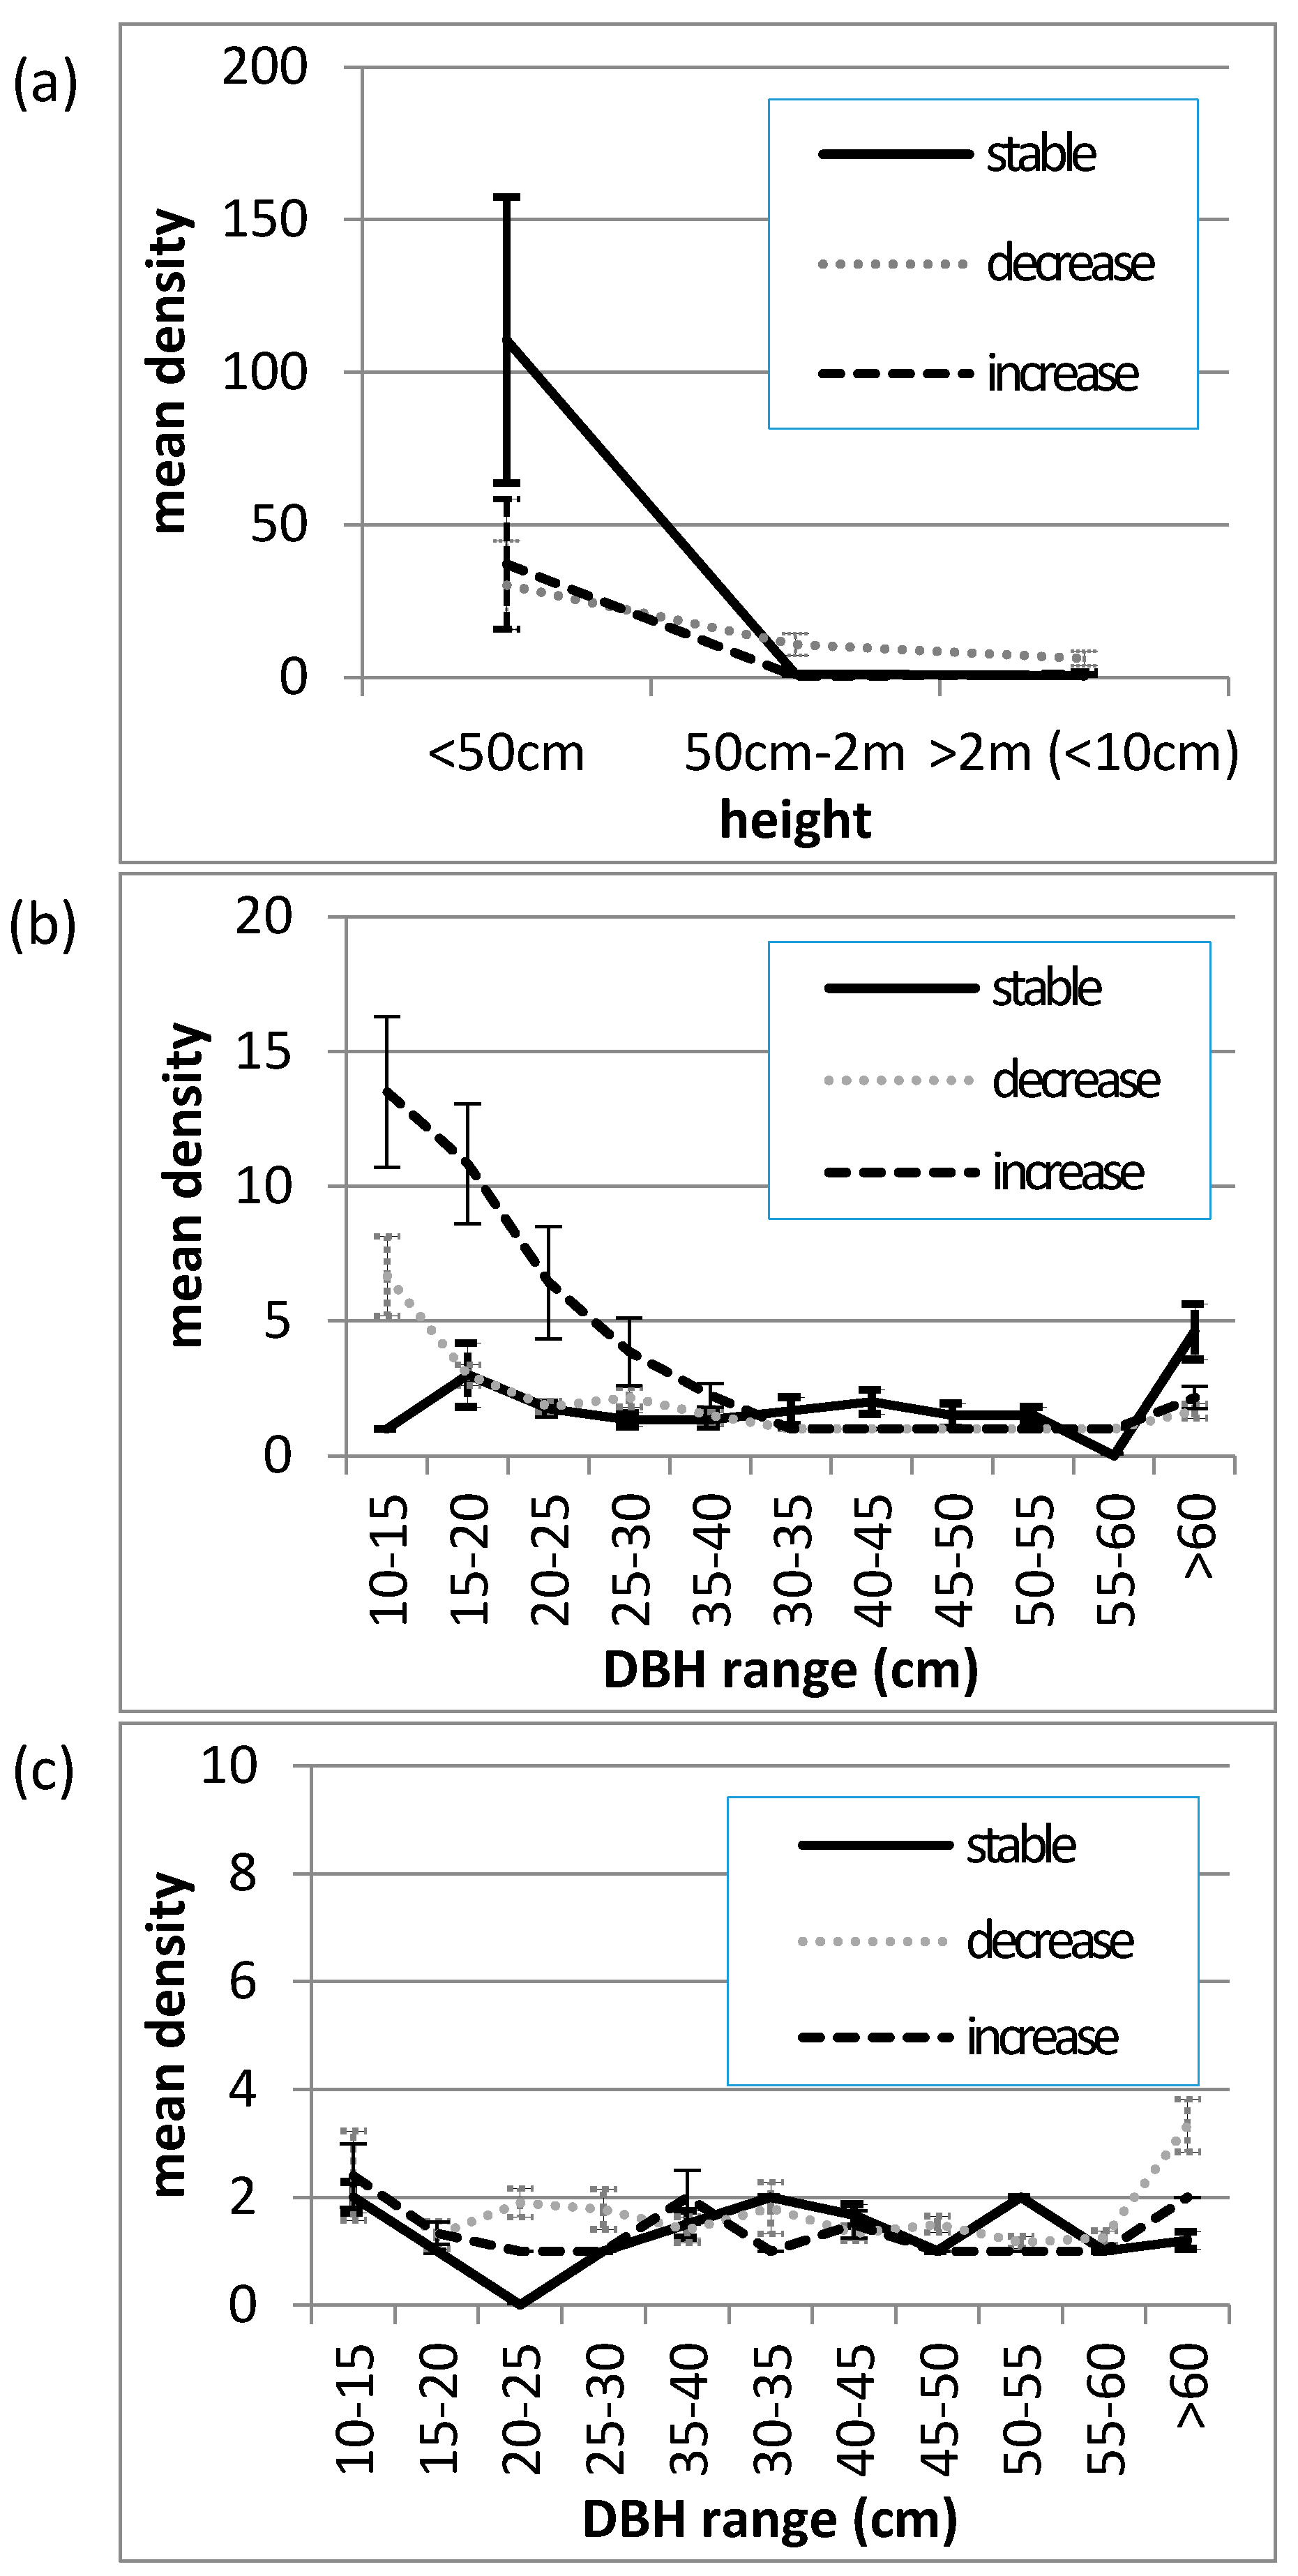
The size-class distribution of Allosyncarpia juveniles, and living and dead tree stems (≥10 cm DBH) at the time of survey in 2010, is given in Figure 4. Relative to transects exhibiting stable canopy conditions over the 1982/87–2010 assessment period, assembled data illustrate: (i) significantly less individuals in the <50 cm juvenile class at both decrease and increase canopy cover sites; (ii) significantly less very large (>60 cm DBH) living stems at both decrease and increase canopy cover sites; (iii) substantially more stems in younger tree size classes (10–30 cm DBH) at increase canopy cover sites; and (iv) relatively similar distributions of dead stems at decrease and increase canopy cover sites. Collectively, the occurrence at increase canopy sites of very large dead stems together with large numbers of smaller-sized tree stems is indicative that these transects sampled sites undergoing recovery.
4. Discussion
Current evidence indicates that across the relatively unmodified savanna landscapes of northern Australia (where tree clearing has, to date, been limited), there has been a general, if weak, trend of woody thickening in recent decades [29]. Such an assessment, however, disguises considerable regional variability, for example: little evidence for woody biomass change under lower rainfall conditions [10,68]; marked woody biomass tree death and resultant woody biomass stochasticity under drought conditions especially in lower rainfall savannas [69]; and substantial variability in regional woody biomass dynamics across the 426,000 km2 mesic (>1000 mm y−1) northern savannas associated with contemporary fire severity patterning [28].
Similarly, many regional studies support the observation of recent monsoon rainforest expansion in a variety of regional, climatic and topographic contexts [5,6,7,30,31,32,33,34,35]. In various cases, the observed expansion of monsoon rainforests has occurred under relatively fire-prone conditions (e.g., [32,33,35]), indicating that enhanced growing conditions associated with increased regional rainfall especially from the 1950s [70,71], reduced evaporation from at least the 1970s [72], global CO2 fertilisation [14,73], but see [74], and possibly grazing interactions through reducing fuel loads, are likely to have been contributory. Trends of recent woody thickening and encroachment in savanna systems have been reported globally [75].
In contrast, observations reported here indicate that, since at least the 1950s, there has been substantial net decline in the canopy cover of especially relatively fire-susceptible Allosyncarpia forest patches. Decline in canopy cover occurred particularly on flat terrain, in regions exposed to predominantly fire-carrying south-easterly dry season winds, and under more marginal rainfall conditions (Table 3). Notably, mean canopy cover increased slightly at topographically less fire-susceptible sites but declined by >10% at 44% of more susceptible sites (Figure 3). Over the period 1990–2009, remote sensing-based studies describing fire regimes encompassing most of the Arnhem Plateau report regional mean fire frequencies of at least 0.37 y−1, of which >60% occurred in the LDS period [42,56]. In the Arnhem Plateau study region, such fire regimes have resulted in significant impacts to fire-vulnerable fauna [44], obligate seeder taxa [5,21,22,39,42,56,76,77], habitats and communities [44,45].
Our observations contrast substantially with those of Bowman and Dingle [33] who reported 21% expansion of Allosyncarpia forest over four decades in Kakadu National Park, in the western sector of our study region. A number of methodological issues likely contribute to this disparity. Firstly, Bowman and Dingle [33] (p 709) undertook their canopy cover change, over a 40 year study period (1964–2004), through assessment at 12 geographically distinct sites containing sizeable tracts of Allosyncarpia forest ‘designed to capture the environmental variation of A. ternata forests in [the park]’. With knowledge of the study sites used by Bowman and Dingle [33] we calculate that their sample included ~58% rugged and steep sites compared to 38% (all rugged) in this study (Table 2). Canopy cover change detection is difficult to assess reliably in steep situations [78].
By contrast, the assessment method in the present study sampled discrete forest patches at seasonally dry sites in both flat and rugged terrain representative of >80% of Allosyncarpia’s current distribution, explicitly in fire-susceptible situations. Although not directly assessed here, topographically protected sites are generally associated with very rugged terrain (including deep gorges and scarps), especially in the north-western sector of the Arnhem Plateau (Figure 1b). Those locations support the bulk of Allosyncarpia’s current distribution [56], and are infrequently burnt [56].
Similarly, whereas Bowman and Dingle [33] (p. 710) undertook their aerial photo assessment in each period with respect to a grid of 519 one ha random samples containing Allosyncarpia in which canopy cover was estimated (in 5% intervals), the present study applied a lattice of 10 × 10 m cells over entire patches (totaling ~120,000 sample points per period), where canopy cover was scored in each cell as either present or absent. In short, the two approaches differ in geographic scope, purpose, and the precision with which canopy cover estimates were derived.
Based on vegetation structure surveys at sites representative of stable, increase, and decrease canopy cover (Figure 5a–c), the present study found that, in contrast to Bowman and Dingle [33], all ‘increase’ sites examined exhibited characteristic post-disturbance recovery size-class distributions (Figure 4)—as opposed to distributions lacking large-sized (mature) dead individuals indicative of canopy or boundary expansion de novo. The capacity for Allosyncarpia to establish new forest sites through dispersal, or for rapid Allosyncarpia forest boundary expansion at decadal scales, is severely restricted, given: short-lived (weeks) dry seeds with no evidence of animal dispersal [79]; gravity-based dispersal is generally limited (except through down-slope and water transport) to beneath, or within metres of adult canopies [79,80]; intolerance of germinants to open insolation [79,80]; intolerance of young juveniles (without lignotubers) to fire [52,80,81]; very slow juvenile growth rates on typical seasonally harsh sites, until individuals develop lignotubers with deep roots [52,82]; and lack of clonal (e.g., rhizomatous) regenerative capacity [38,52]. As illustration, over a ten-year observational period for 20 long-term monitoring plots located across Allosyncarpia/savanna boundaries, mean change in the location of outer Allosyncarpia canopies was just −0.2 m—with a maximum of +3 m at a recovering site, and minima of −3 m at two sites damaged by fire [43].
Fire impacts observed directly at ‘decrease’ and ‘increase’ field assessment sites were self-evidently substantial given large numbers of burnt dead stems (Figure 4). Otherwise relationships between canopy cover change and frequency of fire incidence derived from the Landsat imagery record were not particularly strong—perhaps reflecting that the minimum incidence of fire occurrence observed at all sampled sites was still 0.21 fires y−1 (Figure 3). As observed here and in other studies, exposed sites are most vulnerable to fire incursions, particularly but not exclusively due to typically severe late dry season fires [33,38,41,43,76,80,83]. Even fires of low intensity can effect stem death, especially where old, large stems are hollowed out by termites [41]. Death of a single large Allosyncarpia tree has significant impacts on canopy cover; e.g., from observed relationships between canopy extent, cover and stem size, the loss of a tree 100 cm DBH can immediately reduce canopy cover by ~300 m2, or 3% of a 1 ha-sized forest patch (J. Freeman, unpublished data).
Other disturbances affecting Allosyncarpia forests in the present era include localised major impacts from cyclones and severe storms, and lesser browsing and trampling impacts associated with Asian water buffalo. Immediate effects of severe storms on forest vegetation, exemplified by severe Cyclone Monica in 2006, include substantial tree death, wind-throw and defoliation, whereas longer-term effects include invasion of flammable grasses and increased fire susceptibility [84,85]. Although most cyclonic-scale wind events occur within 50–100 km of the coast, effects of Cyclone Monica were evident up to 130 km inland. Based on historical records for a coastal area immediately to the west of our study region, Cook and Goyens [86] estimated that, within 25 km of the coast, the average recurrence interval for severe events (incurring as much as 40% wind-throw) is ~100 years.
As noted in other studies, significant buffalo impacts on regional closed forests typically are confined to sites with available surface water. At seasonally dry sites (which characterise nearly all Allosyncarpia forest (Table 2), buffalo grazing has been observed to reduce grassy fuel loads (hence fire risk) in surrounding savanna, as well as promote grass and weed invasion (hence increase fire risk) along ‘fire tongue’ thoroughfares through the interior of forest patches [57,87,88].
In sum, given the generally favourable climatic conditions that have prevailed over the study period, and absence of other evident significant disturbance (e.g., browsing, trampling; disease) drivers, we conclude that fire regimes in the contemporary era have been a major cause driving the landscape-scale decline of especially fire-susceptible Allosyncarpia forest sites. A large body of ethnographic and ecologic evidence suggests that contemporary fire regimes over the Arnhem Plateau arose through the latter half of the twentieth century associated with Aboriginal depopulation and the replacement of former intensive fire management practices with a boom and bust wildfire cycle [5,25,26,39,40,57,60,61,62,77]. Such observations stand in contrast to many other savanna regions, including in Australia, where key drivers influencing woody thickening and encroachment trends have involved reduced or no burning typically in combination with intense pastoral utilisation, enhanced rainfall and evapotranspiration conditions, and possible CO2 fertilisation [11,29,75,89,90,91]. The present study serves as a useful reminder that, in fire-prone savanna landscapes, severe fire regimes can substantially outweigh the woody growth-enhancing effects of other regional and global-scale drivers.
Conservation Management
Despite the vast majority of Allosyncarpia’s distribution occurring today in regional conservation reserves (Figure 1b), very significant logistical challenges confront the implementation of conservation-effective fire management over this vast, very sparsely inhabited, rugged region. Fire management in Kakadu National Park’s sandstone uplands has proceeded progressively with establishment of three main Park Stages, 1979–1987. Kakadu is responsible for conservation management of 32% of Allosyncarpia forest extent (Table 2). Recent assessment of fire regimes affecting Allosyncarpia forest in Kakadu show that effective management, as measured against specific performance criteria, increased progressively over the period 1989–2011 [92], but has then declined significantly [93]. The latter study demonstrates that over a 10-year assessment period, 2006–2015, fire management of Allosyncarpia forest has consistently not met minimum ecological criteria (i.e., <10% of forest extent should be affected by one severe fire in any five-year period), including the years leading up to 2011.
The great majority (62%) of Allosyncarpia forest is included in Aboriginal-owned lands of the Warddeken Indigenous Protected Area (IPA), established in 2009. From the early 20th century until 2006, very limited fire management was undertaken in the Warddeken IPA region, its Aboriginal landowners mostly having dispersed to surrounding settlements [62]. Fire regimes were dominated by very extensive LDS wildfires [23], with Allosyncarpia forest margins being burnt a mean frequency of 0.2 y−1, including 0.16 y−1 in the LDS, over the period 1990–2005 [42]. Thereafter, fire regimes in the Warddeken IPA have improved markedly associated with the implementation of a commercial landscape-scale fire management project aimed at reducing greenhouse gas emissions; for example, in the period 2010–2014 just a third of all fire extent in sandstone areas (annual mean = 0.26 fires y−1) occurred as LDS fires [94]. That program has also involved reinstatement of preventative fire management around culturally significant Allosyncarpia forest sites.
Although it is still too early to assess the longer-term ecological benefits associated with the re-imposition of more conservative fire regimes in the Warddeken IPA, one lesson is clear: strategically implemented commercial savanna burning projects can substantially help reduce the frequency of LDS wildfires. As of 2017, two new savanna burning projects managed by Aboriginal people are in the process of being established in Kakadu National Park.
5. Conclusions
In summary, we report that through a multi-temporal change detection process, mean canopy cover of 40 sampled representative Allosyncarpia ternata patches decreased by 9.5% since the 1950’s, where canopy loss was greatest at the most fire-susceptible patches. Importantly, canopy expansion represents vegetation recovery, rather than patch expansion. The study demonstrates the vulnerability to wildfire of exposed Allosyncarpia margins, and the magnitude of the effect, over and above regional and global drivers of woody growth enhancement.
Acknowledgments
We thank the staff and other Traditional Owners of the Warddeken Indigenous Protected Area and Kakadu National Park who provided generous guidance, logistical support and field assistance. We would also like to thank Diane Pearson (formerly of Charles Darwin University) and Peter Cooke (formerly Warddeken Land Management Ltd.) for their support. The Nature Conservancy and Charles Darwin University financially supported this research, with further support from the North Australian Indigenous Land and Sea Management Alliance Ltd (NAILSMA). The paper was substantially improved by the insights and suggestions of anonymous reviewers.
Author Contributions
J.F. undertook this work as part of a post-graduate thesis (PhD). J.F. conceived and designed and performed the experiments with PhD supervision from J.R.-S.; J.F. analyzed the data with assistance from A.C.E. and J.R.-S.; J.F. wrote the paper with substantial support from J.R.-S.
Conflicts of Interest
The authors declare no conflict of interest.
Appendix A

Table A1.
The 40 individual Allosyncarpia ternata sites describing: the position (longitude and latitude) of the centroid of the patch; the initial patch area in 1950; the change in the patch area between the three assessment periods (1950–1980, 1980–2010 and 1950–2010); the proportion of the patch perimeter surrounded by fire-prone vegetation; and the categorical fire susceptibility based on the proportion of surrounding fire-prone vegetation and the topographic position of the patch. The site name lettering (a–e) infers a sub-patch of Allosyncarpia within a given local area.
| %Change | ||||||||
|---|---|---|---|---|---|---|---|---|
| Site Name | Long. | Lat. | Area in 1950 (ha) | 1950–1980’s | 1980’s–2010 | 1950–2010 | %Fire–Prone | Fire Susceptibility |
| Mimolorrk a | 133.7130 | −12.4673 | 79 | 0% | −12% | −12% | 25 | Low |
| Mimolorrk b | 133.6800 | −12.4266 | 29 | 2% | −18% | −16% | 35 | Moderate |
| Tin camp south a | 133.1920 | −12.5620 | 24 | 3% | 1% | 4% | 40 | Moderate |
| Tin camp south b | 133.1920 | −12.5620 | 32 | −5% | −9% | −14% | 35 | Moderate |
| Korbelak a | 133.6180 | −12.6217 | 27 | −10% | −29% | −36% | 60 | High |
| Korbelak b | 133.6320 | −12.6204 | 48 | −7% | −22% | −28% | 75 | High |
| Kondulgai a | 133.7610 | −12.7112 | 23 | −2% | −20% | −22% | 55 | High |
| Andulgai b | 133.7360 | −12.7289 | 14 | −7% | 13% | 5% | 10 | Low |
| Makkalarl head a | 133.6410 | −12.6631 | 15 | 3% | 0% | 3% | 45 | Moderate |
| Makkalarl tail b | 133.6410 | −12.6631 | 35 | −5% | −42% | −46% | 75 | High |
| Nakarriken b | 133.5880 | −12.7226 | 36 | −10% | −11% | −20% | 80 | High |
| Yidngarremanrneng a | 133.9770 | −12.7566 | 122 | −16% | 9% | −9% | 60 | High |
| Yidngarremanrneng b | 133.9680 | −12.7414 | 35 | −8% | 18% | 9% | 2 | Low |
| East alligator a | 133.3040 | −12.7953 | 14 | 12% | 19% | 32% | 25 | Low |
| East alligator b | 133.3100 | −12.7935 | 22 | −8% | 14% | 5% | 30 | Moderate |
| Maguk a | 132.4050 | −13.3153 | 13 | 2% | −14% | −13% | 40 | Moderate |
| Maguk b | 132.4120 | −13.3102 | 8 | −1% | 1% | 0% | 55 | High |
| Magela creek a | 133.1690 | −12.8224 | 12 | −6% | −2% | −7% | 65 | High |
| Namarrgon creek a | 133.1190 | −12.9210 | 14 | −8% | −6% | −14% | 30 | Moderate |
| Namarrgon creek b | 133.1190 | −12.9210 | 15 | −2% | −5% | −7% | 5 | Low |
| Namarrgon creek d | 133.0990 | −12.8991 | 12 | 0% | 1% | 1% | 25 | Low |
| Hill u662 a | 133.1930 | −12.9500 | 13 | 10% | −13% | −4% | 25 | Low |
| Hill u663 b | 133.2280 | −12.9214 | 32 | −5% | −8% | −12% | 25 | Low |
| Deaf Adder north b | 132.5700 | −13.3727 | 4 | −6% | −2% | −8% | 70 | High |
| Deaf Adder north c | 132.9590 | −12.9667 | 15 | 0% | −4% | −4% | 25 | Low |
| Deaf Adder north d | 132.9850 | −12.9641 | 24 | 5% | −9% | −5% | 5 | Low |
| Deaf Adder north e | 132.9850 | −12.9641 | 10 | −1% | −9% | −9% | 40 | Moderate |
| Kunbambuk a | 133.5820 | −12.9612 | 5 | −5% | −9% | −14% | 60 | High |
| Kunbambuk b | 133.5780 | −12.9576 | 36 | −21% | −29% | −44% | 60 | High |
| Kunbambuk c | 133.5630 | −12.9465 | 18 | −26% | −18% | −40% | 60 | High |
| Round jungle a | 133.0990 | −12.8991 | 148 | 1% | 1% | 2% | 65 | High |
| Round jungle b | 132.6550 | −13.3294 | 37 | −3% | −7% | −10% | 50 | High |
| Round jungle c | 132.6480 | −13.2931 | 55 | 4% | −1% | 3% | 55 | High |
| Round jungle d | 132.6480 | −13.2931 | 5 | 10% | 0% | 10% | 25 | Low |
| Barramundie gorge a | 132.5620 | −13.3912 | 22 | −5% | −3% | −8% | 50 | High |
| Barramundie gorge c | 132.5700 | −13.3727 | 9 | 6% | −26% | −21% | 33 | Moderate |
| Barramundie gorge d | 132.5700 | −13.3727 | 21 | −8% | 4% | −4% | 15 | Low |
| Gimbat north a | 133.3100 | −12.7935 | 57 | −5% | −12% | −17% | 40 | Moderate |
| Gimbat north b | 132.9190 | −13.4550 | 35 | −3% | 0% | −3% | 40 | Moderate |
| Gimbat north c | 132.9400 | −13.4172 | 26 | −22% | 16% | −9% | 20 | Low |
References
- Trapnell, C.G. Ecological results of woodland burning experiments in northern Rhodesia. J. Ecol. 1959, 47, 129–168. [Google Scholar] [CrossRef]
- Rose-Innes, R. Fire in West African vegetation. In Proceedings of the Tall Timbers Fire Ecology Conference, Tallahassee, FL, USA, 22–23 April 1972. [Google Scholar]
- San Jose, J.J.; Farinas, M.R.; Rosales, J. Spatial patterns of trees and structuring factors in a Trachypogon savana of the Orinoco Llanos. Biotropica 1991, 23, 114–123. [Google Scholar] [CrossRef]
- Swaine, M.D.; Hawthorne, W.D.; Orgle, T.K. The effects of fire exclusion on savanna vegetation at Kpong, Ghana. Biotropica 1992, 24, 166–172. [Google Scholar] [CrossRef]
- Bowman, D.M.J.S.; Price, O.; Whitehead, P.J.; Walsh, A. The “wilderness effect” and the decline of Callitris intratropica on the Arnhem Land Plateau, northern Australia. Aust. J. Bot. 2001, 49, 665–672. [Google Scholar] [CrossRef]
- Bowman, D.M.; Murphy, B.P.; Banfai, D.S. Has global environmental change caused monsoon rainforests to expand in the Australian monsoon tropics? Landsc. Ecol. 2010, 25, 1247–1260. [Google Scholar] [CrossRef]
- Russell-Smith, J.; Stanton, A.C.; Whitehead, P.J. Rain forest invasion of eucalypt-dominated woodland savanna, Iron Range, north-eastern Australia: II. Rates of landscape change. J. Biogeogr. 2004, 31, 1305–1316. [Google Scholar] [CrossRef]
- Russell-Smith, J.; Whitehead, P.J.; Cook, G.D.; Hoare, J.L. Response of Eucalyptus-dominated savanna to frequent fires: Lessons from Munmarlary, 1973–1996. Ecol. Monogr. 2003, 73, 349–375. [Google Scholar] [CrossRef]
- Higgins, S.I.; Bond, W.J.; February, E.C.; Bronn, A.; Euston-Brown, D.I.W.; Esline, B.; Govender, N.; Rademan, L.; O’Regan, S.; Potgieter, A.L.F.; et al. Effects of four decades of fire manipulation on woody vegetation structure in savanna. Ecology 2007, 88, 1119–1125. [Google Scholar] [CrossRef] [PubMed]
- Lehmann, C.E.; Prior, L.D.; Bowman, D.M. Decadal dynamics of tree cover in an Australian tropical savanna. Austral Ecol. 2009, 34, 601–612. [Google Scholar] [CrossRef]
- Stevens, N.; Erasmus, B.; Archibald, S.; Bond, W. Woody encroachment over 70 years in South African savannahs: Overgrazing, global change or extinction aftershock? Philos. Trans. R. Soc. B 2016, 371. [Google Scholar] [CrossRef] [PubMed]
- Grace, J.; José, J.S.; Meir, P.; Miranda, H.S.; Montes, R.A. Productivity and carbon fluxes of tropical savannas. J. Biogeogr. 2006, 33, 387–400. [Google Scholar] [CrossRef]
- Van der Werf, G.; Randerson, J.L.; Collatz, G.; Mu, M.; Kasibhatla, P.; Morton, D.; Defries, R.; Jin, Y.; van Leeuwen, T. Global fire emissions and the contribution of deforestation, savanna, forest, agricultural, and peat fires (1997–2009). Atmos. Chem. Phys. 2010, 10, 11707–11735. [Google Scholar] [CrossRef] [Green Version]
- Higgins, S.I.; Scheiter, S. Atmospheric CO2 forces abrupt vegetation shifts locally, but not globally. Nature 2012, 488, 209–212. [Google Scholar] [CrossRef] [PubMed]
- Scheiter, S.; Higgins, S.; Beringer, J.; Hutley, L.B. Climate change and long-term fire management impacts on Australian savannas. New Phytol. 2015, 205, 1211–1226. [Google Scholar] [CrossRef] [PubMed]
- Beringer, J.; Hutley, L.B.; Abramson, D.; Arndt, S.K.; Briggs, P.; Bristow, M.; Canadell, J.G.; Cernusak, L.A.; Eamus, D.; Edwards, A.C.; et al. Fire in Australian savannas: From leaf to landscape. Glob. Chang. Biol. 2015, 21, 62–81. [Google Scholar] [CrossRef] [PubMed] [Green Version]
- Franklin, D.C.; Whitehead, P.J.; Pardon, G.; Matthews, J.; McMahon, P.; McIntyre, D. Geographic patterns and correlates of the decline of granivorous birds in northern Australia. Biol. Conserv. 2005, 90, 53–68. [Google Scholar] [CrossRef]
- Woinarski, J.C.Z.; Legge, S. Rowley Review: The impacts of fire on birds in Australia’s tropical savannas. Emu 2013, 113, 319–352. [Google Scholar] [CrossRef]
- Woinarski, J.C.Z.; Legge, S.; Fitzsimons, J.A.; Traill, B.J.; Burbidge, A.A.; Fisher, A.; Firth, R.S.C.; Gordon, I.J.; Griffith, A.D.; Johnson, C.N.; et al. The disappearing mammal fauna of Australia: Context, cause, and response. Conserv. Lett. 2011, 4, 192–201. [Google Scholar] [CrossRef]
- Ziembicki, M.R.; Woinarski, J.C.Z.; Webb, J.K.; Vanderduys, E.; Tuft, K.; Smith, J.; Ritchie, E.G.; Reardon, T.B.; Radford, I.J.; Preece, N.; et al. Stemming the tide: Progress towards resolving the causes of decline and implementing management responses for the disappearing mammal fauna of northern Australia. Therya 2015, 6, 169–225. [Google Scholar] [CrossRef]
- Bowman, D.M.J.S.; Panton, W.J. Decline of Callitris intratropica in the Northern Territory: Implications for pre- and post-European colonization fire regimes. J. Biogeogr. 1993, 20, 373–381. [Google Scholar] [CrossRef]
- Russell-Smith, J.; Ryan, P.G.; Cheal, D.C. Fire regimes and the conservation of sandstone heath in monsoonal northern Australia: Frequency, interval, patchiness. Biol. Conserv. 2002, 104, 91–106. [Google Scholar] [CrossRef]
- Yates, C.P.; Edwards, A.C.; Russell-Smith, J. Big fires and their ecological impacts in Australian savannas: Size and frequency matters. Int. J. Wildland Fire 2008, 17, 768–781. [Google Scholar] [CrossRef]
- Bowman, D.M.J.S. The impact of Aboriginal landscape burning on the Australian biota. New Phytol. 1998, 140, 385–410. [Google Scholar] [CrossRef]
- Ritchie, D. Things Fall Apart: The End of an Era of Systematic Indigenous Fire Management. In Culture, Ecology and Economy of Savanna Fire Management in Northern Australia: Rekindling the Wurrk Tradition; Russell-Smith, J., Whitehead, P.J., Cooke, P.M., Eds.; CSIRO Publications: Melbourne, Australia, 2009. [Google Scholar]
- Yibarbuk, D.; Whitehead, P.J.; Russell-Smith, J.; Jackson, D.; Godjuwa, C.; Fisher, A.; Cooke, P.; Choquenot, D.; Bowman, D. Fire ecology and Aboriginal land management in central Arnhem Land, Northern Australia: A tradition of ecosystem management. J. Biogeogr. 2001, 28, 325–343. [Google Scholar] [CrossRef]
- Russell-Smith, J.; Yates, C.P.; Whitehead, P.J.; Smith, R.; Craig, R.; Allan, G.E.; Thackway, R.; Frakes, I.; Cridland, S.; Meyer, M.C.P.; et al. Bushfires ‘down under’: Patterns and implications of contemporary Australian landscape burning. Int. J. Wildland Fire 2007, 16, 361–377. [Google Scholar] [CrossRef]
- Edwards, A.; Russell-Smith, J.; Meyer, M. Contemporary fire regime risks to key ecological assets and processes in north Australian savannas. Int. J. Wildland Fire 2015, 24, 857–870. [Google Scholar] [CrossRef]
- Murphy, B.P.; Lehmann, C.E.R.; Russell-Smith, J.; Lawes, M.J. Fire regimes and woody biomass dynamics in northern Australian savannas. J. Biogeogr. 2014, 41, 133–144. [Google Scholar] [CrossRef]
- Russell-Smith, J.; Stanton, P.J.; Whitehead, P.J.; Edwards, A.C. Rain forest invasion of eucalypt-dominated woodland savanna, Iron Range, north-eastern Australia: I. Successional Processes. J. Biogeogr. 2004, 31, 1293–1303. [Google Scholar] [CrossRef]
- Woinarski, J.C.Z.; Risler, J.; Kean, L. Response of vegetation and vertebrate fauna to 23 years of fire exclusion in a tropical Eucalyptus open forest, Northern Territory, Australia. Austral Ecol. 2004, 29, 156–176. [Google Scholar] [CrossRef]
- Banfai, D.; Bowman, D. Forty years of lowland monsoon rainforest expansion in Kakadu National Park, Northern Australia. Biol. Conserv. 2006, 131, 553–565. [Google Scholar] [CrossRef]
- Bowman, D.M.; Dingle, J.K. Late 20th century landscape-wide expansion of Allosyncarpia ternata (Myrtaceae) forests in Kakadu National Park, northern Australia. Aust. J. Bot. 2006, 54, 707–715. [Google Scholar] [CrossRef]
- Brook, B.W.; Bowman, D.M. Postcards from the past: Charting the landscape-scale conversion of tropical Australian savanna to closed forest during the 20th century. Landsc. Ecol. 2006, 21, 1253–1266. [Google Scholar] [CrossRef]
- Ondei, S.; Prior, L.D.; Vigilante, T.; Bowman, D.M. Fire and cattle disturbance affects vegetation structure and rain forest expansion into savanna in the Australian monsoon tropics. J. Biogeogr. 2017, 44, 2331–2342. [Google Scholar] [CrossRef]
- Russell-Smith, J.; Stanton, P. Fire Regimes and Fire Management of Rainforest Communities across Northern Australia: A Review. In Flammable Australia: The Fire Regimes and Biodiversity of a Continent; Bradstock, R.A., Williams, J.E., Gill, A.M., Eds.; Cambridge University Press: Cambridge, UK, 2002. [Google Scholar]
- Banfai, D.S.; Bowman, D.M.J.S. Drivers of rain-forest boundary dynamics in Kakadu National Park, northern Australia: A field assessment. J. Trop. Ecol. 2007, 23, 73–86. [Google Scholar] [CrossRef]
- Russell-Smith, J.; Lucas, D.E.; Brock, J.; Bowman, D.M.J.S. Allosyncarpia-dominated rain forest in monsoonal northern Australia. J. Veg. Sci. 1993, 4, 67–82. [Google Scholar] [CrossRef]
- Haynes, C.D. The pattern and ecology of munwag: Traditional aboriginal fire regimes in north-central Arnhem Land. In Ecology of the Wet-Dry Tropics, Proceedings of the Ecological Society of Australia 13, 1985; CSIRO: Melbourne, Australia, 1985. [Google Scholar]
- Bowman, D.; Prior, L. Impact of Aboriginal landscape burning on woody vegetation in Eucalyptus tetrodonta savanna in Arnhem Land, northern Australia. J. Biogeogr. 2004, 31, 807–817. [Google Scholar] [CrossRef]
- Prior, L.D.; Bowman, D.M.J.S.; Brook, B.W. Growth and survival of two north Australian relictual tree species, Allosyncarpia ternata (Myrtaceae) and Callitris intratropica (Cupressaceae). Ecol. Res. 2007, 22, 228–236. [Google Scholar] [CrossRef]
- Edwards, A.C.; Russell-Smith, J. Ecological thresholds and the status of fire-sensitive vegetation in western Arnhem Land, northern Australia: Implications for management. Int. J. Wildland Fire 2009, 18, 127–146. [Google Scholar] [CrossRef]
- Russell-Smith, J.; Edwards, A.C.; Woinarski, J.C.Z.; McCartney, J.; Kerin, S.; Winderlich, S.; Murphy, B.P.; Watt, F. An assessment of the first ten years of the three parks (Kakadu, Litchfield, Nitmiluk) fire regime and biodiversity monitoring. In Culture, Ecology and Economy of Fire Management in North Australian Savannas: Rekindling the WURRK Tradition; Russell-Smith, J., Whitehead, P., Cooke, P., Eds.; CSIRO Publishing: Melbourne, Australia, 2009. [Google Scholar]
- Woinarski, J.C.; Russell-Smith, J.; Andersen, A.N.; Brennan, K. Fire management and biodiversity of the western Arnhem Land Plateau. In Culture, Ecology and Economy of Fire Management in North Australian Savannas: Rekindling the Wurrk Tradition; Russell-Smith, J., Whitehead, P.J., Cooke, P.M., Eds.; CSIRO Publishing: Melbourne, Australia, 2009; pp. 201–228. [Google Scholar]
- Commonwealth of Australia. The Nationally Protected Arnhem Plateau Sandstone Shrubland Complex; Department of Sustainability, Environment, Water, Population and Communities, Australian Government: Canberra, Australia, 2012. Available online: http://www.environment.gov.au/resource/nationally-protected-arnhem-plateau-sandstone-shrubland-complex (accessed on 10 April 2015).
- Thackway, R.; Cresswell, I. An Interim Biogeographic Regionalisation for Australia: A Framework for Establishing the National System of Reserves; Version 4.0; Australian Nature Conservation Agency: Canberra, Australia, 1995; p. 88.
- Ingwersen, F. Kakadu-Alligator Rivers Region, Northern Territory. In Centres of Plant Diversity: A Guide and Strategy for Their Conservation. Vol. 2. Asia, Australasia and the Pacific; Davis, S.D., Hamilton, A.C., Eds.; WWF and IUCN: Cambridge, UK, 1995; pp. 471–475. [Google Scholar]
- Crisp, M.D.; Laffan, S.; Linder, H.P.; Monro, A. Endemism in the Australian flora. J. Biogeogr. 2001, 28, 183–198. [Google Scholar] [CrossRef]
- Emerson, D.; Mills, K.; Miyakawa, K.; Hallett, M.L.; Cao, L. The petrophysics, geophysics and structure of the Koongarra site, Northern Territory. Explor. Geophys. 1993, 24, 1–71. [Google Scholar] [CrossRef]
- McAlpine, J.R. Climate and water balance. In Land Systems of the Alligator Rivers Area, Northern Territory; Land Research Series No. 38; Story, R., Ed.; CSIRO: Melbourne, Australia, 1976; pp. 35–49. [Google Scholar]
- Finlayson, C.M.; von Oertzen, I. Landscape and Vegetation Ecology of the Kakadu Region, Northern Australia; Springer Science & Business Media: Berlin/Heidelberg, Germany, 2012; Volume 23. [Google Scholar]
- Russell-Smith, J.; Setterfield, S.A. Monsoon rain forest seedling dynamics, northern Australia: Contrasts with regeneration in eucalypt-dominated savannas. J. Biogeogr. 2006, 33, 1597–1614. [Google Scholar] [CrossRef]
- Russell-Smith, J.; Ryan, P.G.; Klessa, D.; Waight, G.; Harwood, R. Fire regimes, fire-sensitive vegetation, and fire management of the sandstone Arnhem Plateau, monsoonal northern Australia. J. Appl. Ecol. 1998, 35, 829–846. [Google Scholar] [CrossRef]
- Russell-Smith, J.; Whitehead, P.; Cooke, P. Managing Fire Regimes in North Australian Savannas—Ecology, Culture, Economy. Rekindling the Wurrk Tradition; Russell-Smith, J., Whitehead, P., Cooke, P., Eds.; CSIRO Publishing: Canberra, Australia, 2009. [Google Scholar]
- Russell-Smith, J.; Edwards, A.C. Seasonality and fire severity in savanna landscapes of monsoonal northern Australia. Int. J. Wildland Fire 2006, 15, 541–550. [Google Scholar] [CrossRef]
- Russell-Smith, J.; Edwards, A.C.; Price, O.F. Simplifying the savanna: The trajectory of fire-sensitive vegetation mosaics in northern Australia. J. Biogeogr. 2012, 39, 1303–1317. [Google Scholar] [CrossRef]
- Trauernicht, C.; Murphy, B.P.; Tangalin, N.; Bowman, D.M. Cultural legacies, fire ecology, and environmental change in the Stone Country of Arnhem Land and Kakadu National Park, Australia. Ecol. Evol. 2013, 3, 286–297. [Google Scholar] [CrossRef] [PubMed]
- Roberts, R.G.; Jones, R.; Smith, M.A. Thermoluminescence dating of a 50,000-year-old human occupation site in northern Australia. Nature 1990, 345, 153–156. [Google Scholar] [CrossRef]
- Clarkson, C.; Jacobs, Z.; Marwick, B.; Fullagar, R.; Wallis, L.; Smith, M.; Roberts, R.G.; Hayes, E.; Lowe, K.; Carah, X. Human occupation of northern Australia by 65,000 years ago. Nature 2017, 547, 306–310. [Google Scholar] [CrossRef] [PubMed]
- Russell-Smith, J.; Lucas, D.; Gapindi, M.; Gunbunuka, B.; Kapirigi, N.; Namingum, G.; Lucas, K.; Giuliani, P.; Chaloupka, G. Aboriginal resource utilization and fire management practice in western Arnhem Land, monsoonal northern Australia: Notes for prehistory, lessons for the future. Hum. Ecol. 1997, 25, 159–196. [Google Scholar] [CrossRef]
- Garde, M.; Nadjamerrek, L.B.; Kolkkiwarra, M.; Kalarriya, J.; Djandjomerr, J.; Birriyabirriya, B.; Bilindja, R.; Kubarkku, M.; Biless, P. The Language of Fire: Seasonality, Resources and Landscape Burning on the Arnhem Land Plateau. In Managing Fire Regimes in North Australian Savannas—Ecology, Culture, Economy; Russell-Smith, J., Whitehead, P., Eds.; CSIRO Publishing: Canberra, Australia, 2009; pp. 86–164. [Google Scholar]
- Cooke, P.M. Buffalo and Tin, Baki and Jesus: The Creation of a Modern Wilderness. In Culture, Ecology and Economy of Savanna Fire Management in Northern Australia: Rekindling the Wurrk Tradition; Russell-Smith, J., Whitehead, P.J., Cooke, P.M., Eds.; CSIRO Publications: Melbourne, Australia, 2009. [Google Scholar]
- Geoscience Australia. 1 Arc Second—Digital Elevation Model; US National Geospatial-Intelligence Agency (NGA), US National Aeronautics and Space Administration (NASA), Eds.; Geoscience Australia: Canberra, Australia, 2000.
- Geoscience Australia. Australia 1:250,000 Geological Series; Geoscience Australia: Canberra, Australia, 1963–1998.
- Morgan, J.L.; Gergel, S.E.; Coops, N.C. Aerial photography: A rapidly evolving tool for ecological management. BioScience 2010, 60, 47–59. [Google Scholar] [CrossRef]
- Russell-Smith, J.; Ryan, P.G.; Durieu, R. A LANDSAT MSS-derived fire history of Kakadu National Park, monsoonal northern Australia, 1980–94: Seasonal extent, frequency and patchiness. J. Appl. Ecol. 1997, 34, 748–766. [Google Scholar] [CrossRef]
- Williams, R.J.; Gill, A.M.; Moore, P.H.R. Fire Behaviour. In Fire in Tropical Savannas: The Kapalga Experiment; Andersen, A., Cook, G., Williams, R., Eds.; Springer: New York, NY, USA, 2003; pp. 33–46. [Google Scholar]
- Fensham, R.; Fairfax, R. Assessing woody vegetation cover change in north-west Australian savanna using aerial photography. Int. J. Wildland Fire 2003, 12, 359–367. [Google Scholar] [CrossRef]
- Fensham, R.; Fairfax, R.; Ward, D. Drought-induced tree death in savanna. Glob. Chang. Biol. 2009, 15, 380–387. [Google Scholar] [CrossRef]
- Smith, I. An assessment of recent trends in Australian rainfall. Aust. Meteorol. Mag. 2004, 53, 163–173. [Google Scholar]
- Bureau of Meteorology. Climate Change Trend Maps. Available online: http://www.bom.gov.au/climate/change/index.shtml#tabs=Tracker&tracker=trend-maps (accessed on 5 August 2016).
- Roderick, M.L.; Farquhar, G.D. Changes in Australian pan evaporation from 1970 to 2002. Int. J. Climatol. 2004, 24, 1077–1090. [Google Scholar] [CrossRef]
- Lewis, S.L.; Lloyd, J.; Sitch, S.; Mitchard, E.T.; Laurance, W.F. Changing ecology of tropical forests: Evidence and drivers. Annu. Rev. Ecol. Evol. Syst. 2009, 40, 529–549. [Google Scholar] [CrossRef]
- Van Der Sleen, P.; Groenendijk, P.; Vlam, M.; Anten, N.P.; Boom, A.; Bongers, F.; Pons, T.L.; Terburg, G.; Zuidema, P.A. No growth stimulation of tropical trees by 150 years of CO2 fertilization but water-use efficiency increased. Nat. Geosci. 2015, 8, 24–28. [Google Scholar] [CrossRef]
- Stevens, N.; Lehmann, C.E.; Murphy, B.P.; Durigan, G. Savanna woody encroachment is widespread across three continents. Glob. Chang. Biol. 2017, 23, 235–244. [Google Scholar] [CrossRef] [PubMed]
- Russell-Smith, J.; Price, O.; Murphy, B.P. Managing the matrix: Decadal responses of eucalypt-dominated mesic savanna to ambient fire regimes. Ecol. Appl. 2010, 20, 1615–1632. [Google Scholar] [CrossRef] [PubMed]
- Trauernicht, C.; Murphy, B.P.; Prior, L.D.; Lawes, M.J.; Bowman, D.M. Human-imposed, fine-grained patch burning explains the population stability of a fire-sensitive conifer in a frequently burnt northern Australia savanna. Ecosystems 2016, 19, 896–909. [Google Scholar] [CrossRef]
- Kennedy, R.E.; Townsend, P.A.; Gross, J.E.; Cohen, W.B.; Bolstad, P.; Wang, Y.Q.; Adams, P. Remote sensing change detection tools for natural resource managers: Understanding concepts and tradeoffs in the design of landscape monitoring projects. Remote Sens. Environ. 2009, 113, 1382–1396. [Google Scholar] [CrossRef]
- Russell-Smith, J. The Forest in Motion: Exploratory Studies in Western Arnhem Land, Northern Australia. In The Forest in Motion: Exploratory Studies in Western Arnhem Land, Northern Australia; Australian National University: Canberra, Australia, 1986. [Google Scholar]
- Bowman, D.M.J.S. Environmental determinants of Allosyncarpia ternata forests that are endemic to western Arnhem Land, northern Australia. Aust. J. Bot. 1991, 39, 575–589. [Google Scholar] [CrossRef]
- Fordyce, I.R.; Eamus, D.; Duff, G.A.; Williams, R.J. The role of seedling age and size in the recovery of Allosyncarpia ternata following fire. Aust. J. Ecol. 1997, 22, 262–269. [Google Scholar] [CrossRef]
- Fordyce, I.R.; Eamus, D.; Duff, G.A. Episodic seedling growth in Allosyncarpia ternata, a lignotuberous monsoon rainforest tree of tropical Australia. Austral Ecol. 2000, 25, 25–35. [Google Scholar] [CrossRef]
- Bowman, D.M.J.S. Preliminary observations on the mortality of Allosyncarpia ternata stems on the Arnhem Land plateau, northern Australia. In Australian Forestry; Institute of Foresters of Australia: Perth, Australia, 1994; pp. 62–64. [Google Scholar]
- Wilson, B.A.; Bowman, D.M.J.S. Fire, storm, flood and drought: The vegetation ecology of Howards Peninsula, Northern Territory, Australia. Aust. J. Ecol. 1987, 12, 165–174. [Google Scholar] [CrossRef]
- Hutley, L.; Evans, B.; Beringer, J.; Cook, G.; Maier, S.; Razon, E. Impacts of an extreme cyclone event on landscape-scale savanna fire, productivity and greenhouse gas emissions. Environ. Res. Lett. 2013, 8. [Google Scholar] [CrossRef]
- Cook, G.D.; Goyens, C.M. The impact of wind on trees in Australian tropical savannas: Lessons from Cyclone Monica. Austral Ecol. 2008, 33, 462–470. [Google Scholar] [CrossRef]
- Russell-Smith, J. The Status and Condition of Monsoon Vine-Forests in the Kakadu Region: A Management Report. In Unpublished Report to Australian National Parks and Wildlife Service, Canberra; Australian National Parks and Wildlife Service: Canberra, Australia, 1984. [Google Scholar]
- Petty, A.; Werner, P.; Lehmann, C.; Riley, J.; Banfai, D.; Elliott, L. Savanna responses to feral buffalo in Kakadu National Park, Australia. Ecol. Monogr. 2007, 77, 441–463. [Google Scholar] [CrossRef]
- Archer, S.; Schimel, D.S.; Holland, E.A. Mechanisms of shrubland expansion: Land use, climate or CO2? Clim. Chang. 1995, 29, 91–99. [Google Scholar] [CrossRef]
- Scholes, R.J.; Archer, S.R. Tree-grass interactions in savannas. Annu. Rev. Ecol. Syst. 1997, 28, 517–544. [Google Scholar] [CrossRef]
- Bond, W.J.; Midgley, G.F. A proposed CO2-controlled mechanism of woody plant invasion in grasslands and savannas. Glob. Chang. Biol. 2000, 6, 865–869. [Google Scholar] [CrossRef]
- Murphy, B.P.; Cochrane, M.A.; Russell-Smith, J. Prescribed burning protects endangered tropical heathlands of the Arnhem Plateau, northern Australia. J. Appl. Ecol. 2015, 52, 980–991. [Google Scholar] [CrossRef]
- Russell-Smith, J.; Evans, J.; Edwards, A.C.; Simms, A. Assessing ecological performance thresholds in fire-prone Kakadu National Park, northern Australia. Ecosphere 2017, 8, e01856. [Google Scholar] [CrossRef]
- Russell-Smith, J.; Yates, C.P.; Edwards, A.C.; Whitehead, P.J.; Murphy, B.P. Deriving multiple benefits from carbon market-based savanna fire management: An Australian example. PLoS ONE 2015, 10, e0143426. [Google Scholar] [CrossRef] [PubMed]
Figure 1.
(a) Study region in the Northern Territory, Australia, including mean seasonal rainfall isohyets (mm); and (b) the mapped distribution of Allosyncarpia forest outlined in white, and the location of 40 sample sites used for the canopy cover change assessment.
Figure 1.
(a) Study region in the Northern Territory, Australia, including mean seasonal rainfall isohyets (mm); and (b) the mapped distribution of Allosyncarpia forest outlined in white, and the location of 40 sample sites used for the canopy cover change assessment.

Figure 2.
Assessing change at an Allosyncarpia sample site: (a) 1950 aerial photo; (b) 1950 image with 1982 canopy cover points; (c) 1950 photo with 2010 canopy cover points; (d) 2010 photo with 2010 canopy cover points.
Figure 2.
Assessing change at an Allosyncarpia sample site: (a) 1950 aerial photo; (b) 1950 image with 1982 canopy cover points; (c) 1950 photo with 2010 canopy cover points; (d) 2010 photo with 2010 canopy cover points.

Figure 3.
Relationship between fire frequency and canopy cover change (1982/87–2010) at 40 sampled patches, for sites of low vs. moderate/high susceptibility to fire.
Figure 3.
Relationship between fire frequency and canopy cover change (1982/87–2010) at 40 sampled patches, for sites of low vs. moderate/high susceptibility to fire.
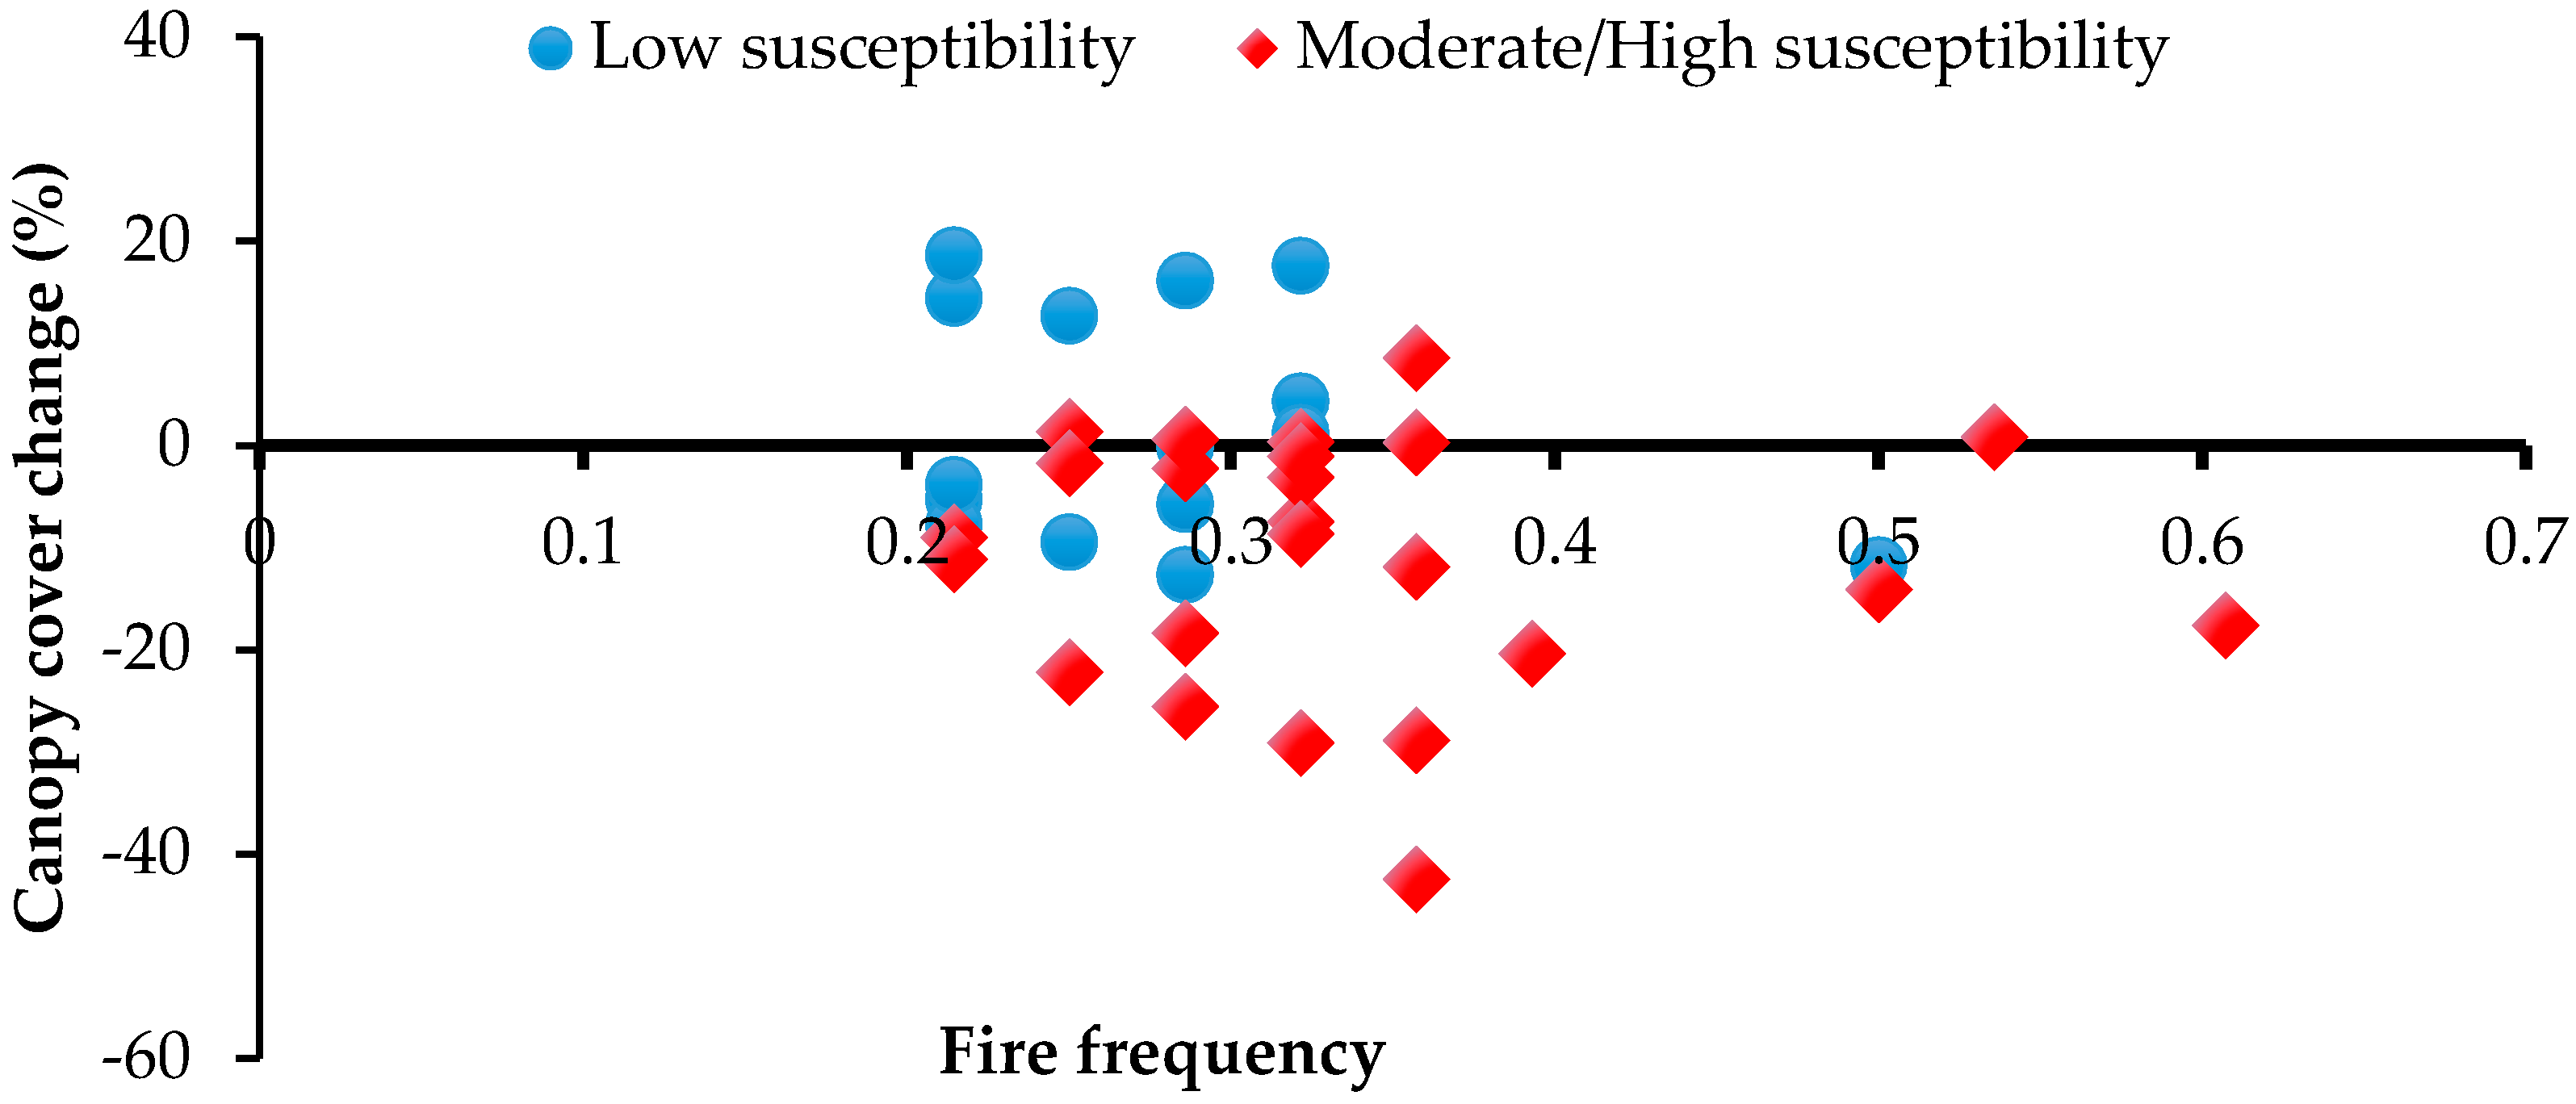
Figure 4.
Mean size-class distributions of Allosyncarpia ternata (a) juveniles (<10 cm DBH); (b) living stems; (c) dead stems, at 0.1 ha transects (n = 29) describing stable (n = 8), decreasing (n = 14), and increasing (n = 7) canopy cover conditions, over the period 1982/87–2010. (Error bars represent the standard error of the mean).

Figure 5.
Photos illustrating examples of (a) stable; (b) decrease canopy; (c) increase canopy (recovery) sites, noting: (a) stable site—typical example of sharply defined Allosyncarpia forest boundary embedded in savanna matrix; (b) decrease site—recently fire-killed small stems and very large Allosyncarpia stem; (c) increase site—recovery region in foreground interspersed with standing dead Allosyncarpia stems, with mature (stable) Allosyncarpia forest at rear.
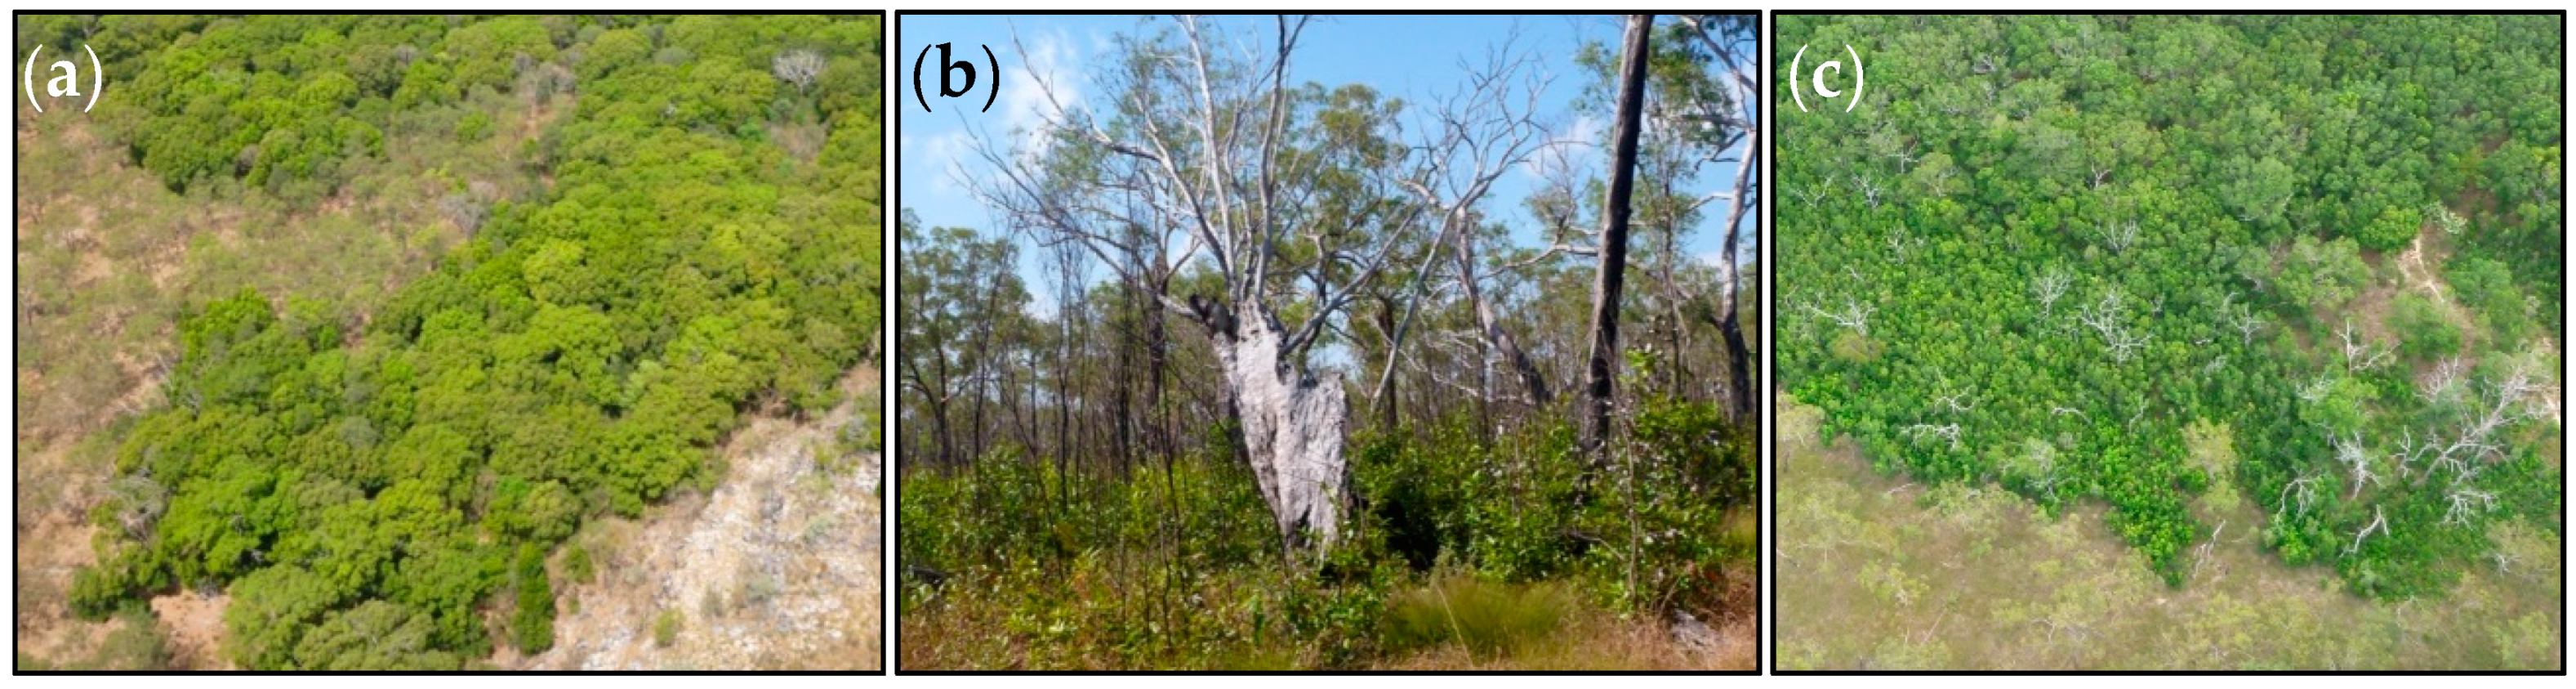
Table 1.
Selection criteria for canopy cover change assessments.
| Selection Criteria | Metric |
|---|---|
| Functional analysis size | Area 10–150 ha |
| Distinct, isolated, forest patch | Minimum 100 m distance from another patch >10 ha |
| Functional shape | Patch perimeter (km): area (ha) ratio within parameters, as below: Patch 10–39 ha: <15 Patch 40–79 ha: <12.5 Patch 80–150 ha: <10 |
| Broad geographic distribution | Patches from western, eastern, southern regions, as defined by contiguous 1:250,000 topographic mapping covering the majority of Allosyncarpia’s range |
| Not associated with major river | Exclude patches associated with stream order >5 |
| Not in path of major cyclone, especially very damaging Cyclone Monica in 2006 | Exclude patches <50 km from coast |
| Topographic variation | Include patches both in relatively subdued sandstone, and open sandy terrain, but exclude patches in steep (>20°) terrain to ensure assessment reliability |
| Image availability | Available historical aerial photos at consistent scales, and 2010 high resolution satellite imagery |
| Image quality | Amenable for visual interpretation |
| Cost efficiency | If possible, select more than one patch meeting above criteria per imagery sample |
Table 2.
Geographic affinities of the total distribution of Allosyncarpia on the Arnhem Plateau (29,600 km2), and 40 Allosyncarpia forest patches sampled for the canopy cover assessment.
Table 2.
Geographic affinities of the total distribution of Allosyncarpia on the Arnhem Plateau (29,600 km2), and 40 Allosyncarpia forest patches sampled for the canopy cover assessment.
| Geographic Context | Arnhem Plateau Study Area (%) | Allosyncarpia Distribution (%) | Sampled Forest Patches (%; No. of Sites Given in Parentheses) |
|---|---|---|---|
| Mean annual rainfall (mm) | |||
| 1200–1300 | 23.0% | 0 | 0 |
| 1300–1400 | 42.0% | 34.0% | 35.0% (14) |
| 1400–1500 | 25.0% | 32.0% | 37.5% (15) |
| 1500–1600 | 10.0% | 33.0% | 27.5% (11) |
| Proximity to Drainage | |||
| <250 m from major river | 1.0% | 0 | |
| <25 m from stream | 8.0% | 8 sites | |
| Terrain | |||
| steep: >20% | 3.0% | 14.0% | 0% |
| rugged: 5–20% | 23.0% | 59.0% | 37.5% (15) |
| flat: <5% | 74.0% | 27.0% | 62.5% (25) |
| Surface type | |||
| Rocky | 51.5% | 90.0% | 60.0% (23) |
| Sandy | 48.5% | 10.0% | 40.0% (17) |
| Interaction between terrain and surface | |||
| Steep rocky | 2.0% | 12.0% | 0% |
| Steep x sandy | 1.0% | 2.0% | 0% |
| Rugged x rocky | 17.0% | 54.5% | 37.5% (15) |
| Rugged x sandy | 5.0% | 4.5% | 0.0% |
| Flat x rocky | 32.5% | 23.0% | 22.5% (9) |
| Flat x sandy | 42.5% | 4.0% | 40.0% (16) |
Table 3.
Summary of canopy cover change, 1950–2010, at 40 study sites. Numbers in parentheses = % ± S.E.M.
Table 3.
Summary of canopy cover change, 1950–2010, at 40 study sites. Numbers in parentheses = % ± S.E.M.
| Canopy Cover Change | ||||
|---|---|---|---|---|
| Geographic Context | No. of Patches | 1950–1982/87 | 1982/87–2010 | 1950–2010 |
| Patch trend summary | ||||
| Mean trend | 40 | (−3.7 ± 1.3) | (−6.1 ± 2.1) | (−9.5 ± 2.4) |
| No. declining patches | 22 | 23 | 29 | |
| No. increasing patches | 8 | 7 | 8 | |
| No. stable patches | 10 | 10 | 3 | |
| Warddeken IPA 1 | 24 | (−4.9 ± 1.5) | (−8.4 ± 2.4) | (−8.4 ± 2.2) |
| Kakadu National Park | 16 | (−1.6 ± 0.5) | (−4.1 ± 1.4) | (−6.0 ± 1.9) |
| Rainfall zone | ||||
| 1300–1400 mm | 14 | −8.1 ± 2.7 | −12.2 ± 3.9 | −19.2 ± 6.1 |
| 1400–1500 mm | 15 | −2.3 ± 0.5 | −2.0 ± 0.7 | −4.6 ± 1.5 |
| 1500–1600 mm | 11 | 0.0 ± 0.2 | −3.8 ± 1.2 | −3.8 ± 1.6 |
| Terrain | ||||
| Steep: >20° | 0 | |||
| Rugged: 5–20° | 10 | (−2.2 ± 0.8) | (−1.7 ± 0.6) | (−4.1 ± 1.4) |
| Flat: <5° | 19 | (−7.5 ± 2.3) | (−7.7 ± 2.3) | (−14.3 ± 4.3) |
| Mixed (Flat and Rugged) | 11 | (1.4 ± 0.5) | (−7.2 ± 2.5) | (−6.1 ± 2.1) |
| Surface type | ||||
| Sandstone/Rocky | 25 | (−3.8 ± 1.0) | (−5.3 ± 1.4) | (−10.3 ± 0.5) |
| Sandy plain | 15 | (−3.5 ± 1.6) | (−7.3 ± 2.5) | (−9 ± 3.0) |
1 Indigenous Protected Area.
© 2017 by the authors. Licensee MDPI, Basel, Switzerland. This article is an open access article distributed under the terms and conditions of the Creative Commons Attribution (CC BY) license (http://creativecommons.org/licenses/by/4.0/).
Share and Cite
MDPI and ACS Style
Freeman, J.; Edwards, A.C.; Russell-Smith, J. Fire-Driven Decline of Endemic Allosyncarpia Monsoon Rainforests in Northern Australia. Forests 2017, 8, 481. https://doi.org/10.3390/f8120481
AMA Style
Freeman J, Edwards AC, Russell-Smith J. Fire-Driven Decline of Endemic Allosyncarpia Monsoon Rainforests in Northern Australia. Forests. 2017; 8(12):481. https://doi.org/10.3390/f8120481
Chicago/Turabian StyleFreeman, Jeremy, Andrew C. Edwards, and Jeremy Russell-Smith. 2017. "Fire-Driven Decline of Endemic Allosyncarpia Monsoon Rainforests in Northern Australia" Forests 8, no. 12: 481. https://doi.org/10.3390/f8120481
Note that from the first issue of 2016, this journal uses article numbers instead of page numbers. See further details here.