Article

Comprehensive Analysis of the Cork Oak (Quercus suber) Transcriptome Involved in the Regulation of Bud Sprouting

1
Centro de Biotecnologia Agrícola e Agro-alimentar do Alentejo (CEBAL), Instituto Politécnico de Beja (IPBeja), Rua Pedro Soares, s.n.-Campus IPBeja/ESAB, Apartado 6158, 7801-908 Beja, Portugal
2
Instituto de Ciências Agrárias e Ambientais Mediterrânicas (ICAAM), Universidade de Évora, Núcleo da Mitra, Apartado 94, 7006-554 Évora, Portugal
3
Instituto Nacional de Investigação Agrária e Veterinária, I.P. (INIAV), Av. da República, Quinta do Marquês (edifício sede), 2780-157 Oeiras, Portugal
4
Wellcome Trust Sanger Institute, Wellcome Genome Campus Hinxton, Cambridge CB10 1SA, UK
5
Centro de Estudos Florestais, Instituto Superior de Agronomia, Universidade de Lisboa, Tapada da Ajuda 1349-017 Lisboa, Portugal Lisboa, Portugal
6
Centre for Ecology, Evolution and Environmental Changes (cE3c), Faculdade de Ciências da Universidade de Lisboa, Edifício C2, 5° Piso, Sala 2.5.46 Campo Grande, 1749-016 Lisboa, Portugal
*
Author to whom correspondence should be addressed.
Forests 2017, 8(12), 486; https://doi.org/10.3390/f8120486
Submission received: 7 October 2017 / Revised: 20 November 2017 / Accepted: 29 November 2017 / Published: 6 December 2017
(This article belongs to the Special Issue Genetics and Genomics of Forest Trees)

Abstract

:
Cork oaks show a high capacity of bud sprouting as a response to injury, which is important for species survival when dealing with external factors, such as drought or fires. The characterization of the cork oak transcriptome involved in the different stages of bud sprouting is essential to understanding the mechanisms involved in these processes. In this study, the transcriptional profile of different stages of bud sprouting, namely (1) dormant bud and (2) bud swollen, vs. (3) red bud and (4) open bud, was analyzed in trees growing under natural conditions. The transcriptome analysis indicated the involvement of genes related with energy production (linking the TCA (tricarboxylic acid) cycle and the electron transport system), hormonal regulation, water status, and synthesis of polysaccharides. These results pinpoint the different mechanisms involved in the early and later stages of bud sprouting. Furthermore, some genes, which are involved in bud development and conserved between species, were also identified at the transcriptional level. This study provides the first set of results that will be useful for the discovery of genes related with the mechanisms regulating bud sprouting in cork oak.

1. Introduction

Cork oak (Quercus suber L.) plays an important environmental, social, and economic role in the Mediterranean ecosystems known as “Montado” and “Dehesa”, in Portugal and Spain, respectively. The ability of cork oak to produce cork in a sustainable manner is the basis for an industry that is unique in the world. However, over the last 20 years, the Iberian Peninsula has witnessed a reduction in the number of trees—due to drought, extreme temperatures, pests, and fires, among other factors, which threatens the rural economy in this part of Europe and increases the vulnerability to wildfires [1].
The vegetative bud phenology of long-lived species is crucial to their productivity, adaptability, and distribution [2]. The frequency of droughts in the Mediterranean is increasing significantly due to climate change, which suggests an aggravation of environmental conditions that are likely to increase the severity of water stress in plants [3]. Global warming is expected to modify the length of the growing season and distribution of forest tree species, changing the timing of phenological events and possibly causing frost or drought injuries, or even a failure to produce mature fruits and seeds. It was already reported that long-term exposure of young cork oak trees to contrasting temperatures impacts the leaf metabolites and gene expression profiles of key enzymes of phenolic metabolism [4]. Most Mediterranean plant species, including cork oak, have a good sprouting capacity after disturbance, displaying the ability to re-sprout from basal buds when stems or crowns are severely damaged, which is of great importance for species survival. However, cork oak is the only oak able to quickly and effectively re-sprout after fire from epicormic buds, which are positioned underneath the bark, showing a competitive advantage over coexisting woody plants. Thus, cork oak is one of the best-adapted trees persisting in ecosystems with recurrent fire-exposure, making it one of the best candidates for reforestation programs.
In pedunculate oak (Quercus robur), several QTL (quantitative trait loci) for bud burst and height growth have been identified [5], using the approach described by Saitagne and colleagues [6], based on a double-pseudo-testcross mapping strategy. Moreover, in Populus, several genes (PHYB1, PHYB2, ABI3, and ABI1B) mapped to positions where QTL for bud set and/or bud burst were identified [7], providing further support for their involvement in the regulation of bud sprouting. The PHYB1 and PHYB2 genes are phytochromes photoreceptors, which absorb both red light and far-red light and act as a biological switch to activate/deactivate plant growth. The ABI3 and ABI1B genes are required for the establishment of dormancy, both being involved in signal transduction.
Analysis of differential expression for genes involved in bud burst was performed in sessile oak (Quercus petraea), which resulted in the identification of a set of relevant candidate genes for signaling the pathway of bud burst as well as hundreds of expressed-sequence-tags (ESTs) [8]. Recently, an oak gene expression atlas was also generated for two sympatric oak species, Quercus robur (pedunculated oak) and Quercus petraea [9], which identified genes associated with vegetative bud phenology and contributed relevant information for the annotation of the pedunculated oak’s genome. The gene expression studies performed in cork oak have mainly targeted the identification of genes involved in cork formation, and several candidate genes have been revealed [10].
Furthermore, a multiple tissue transcriptome database was compiled, covering multiple developmental stages and physiological conditions [11]. Several studies have reported differentially expressed transcripts in different stages of development, such as acorn development [12].
Despite the knowledge that has been produced for oak species—the molecular mechanisms in cork oak underlying bud set, bud dormancy, and bud burst—still remain unclear. Additional information is needed to understand the genetic mechanisms underlying signaling and regulation in the transition from dormant to active bud development, as well as to characterize the genetic response to phenological events. Thus, in order to reveal the mechanisms involved in bud sprouting of cork oak, a whole transcriptome approach was carried out using data generated using the 454 sequencing platform. A total of four different stages of bud sprouting development, from bud dormant to bud burst, were analyzed, in order to assess the differences in gene expression over the stages of bud sprouting development.

2. Materials and Methods

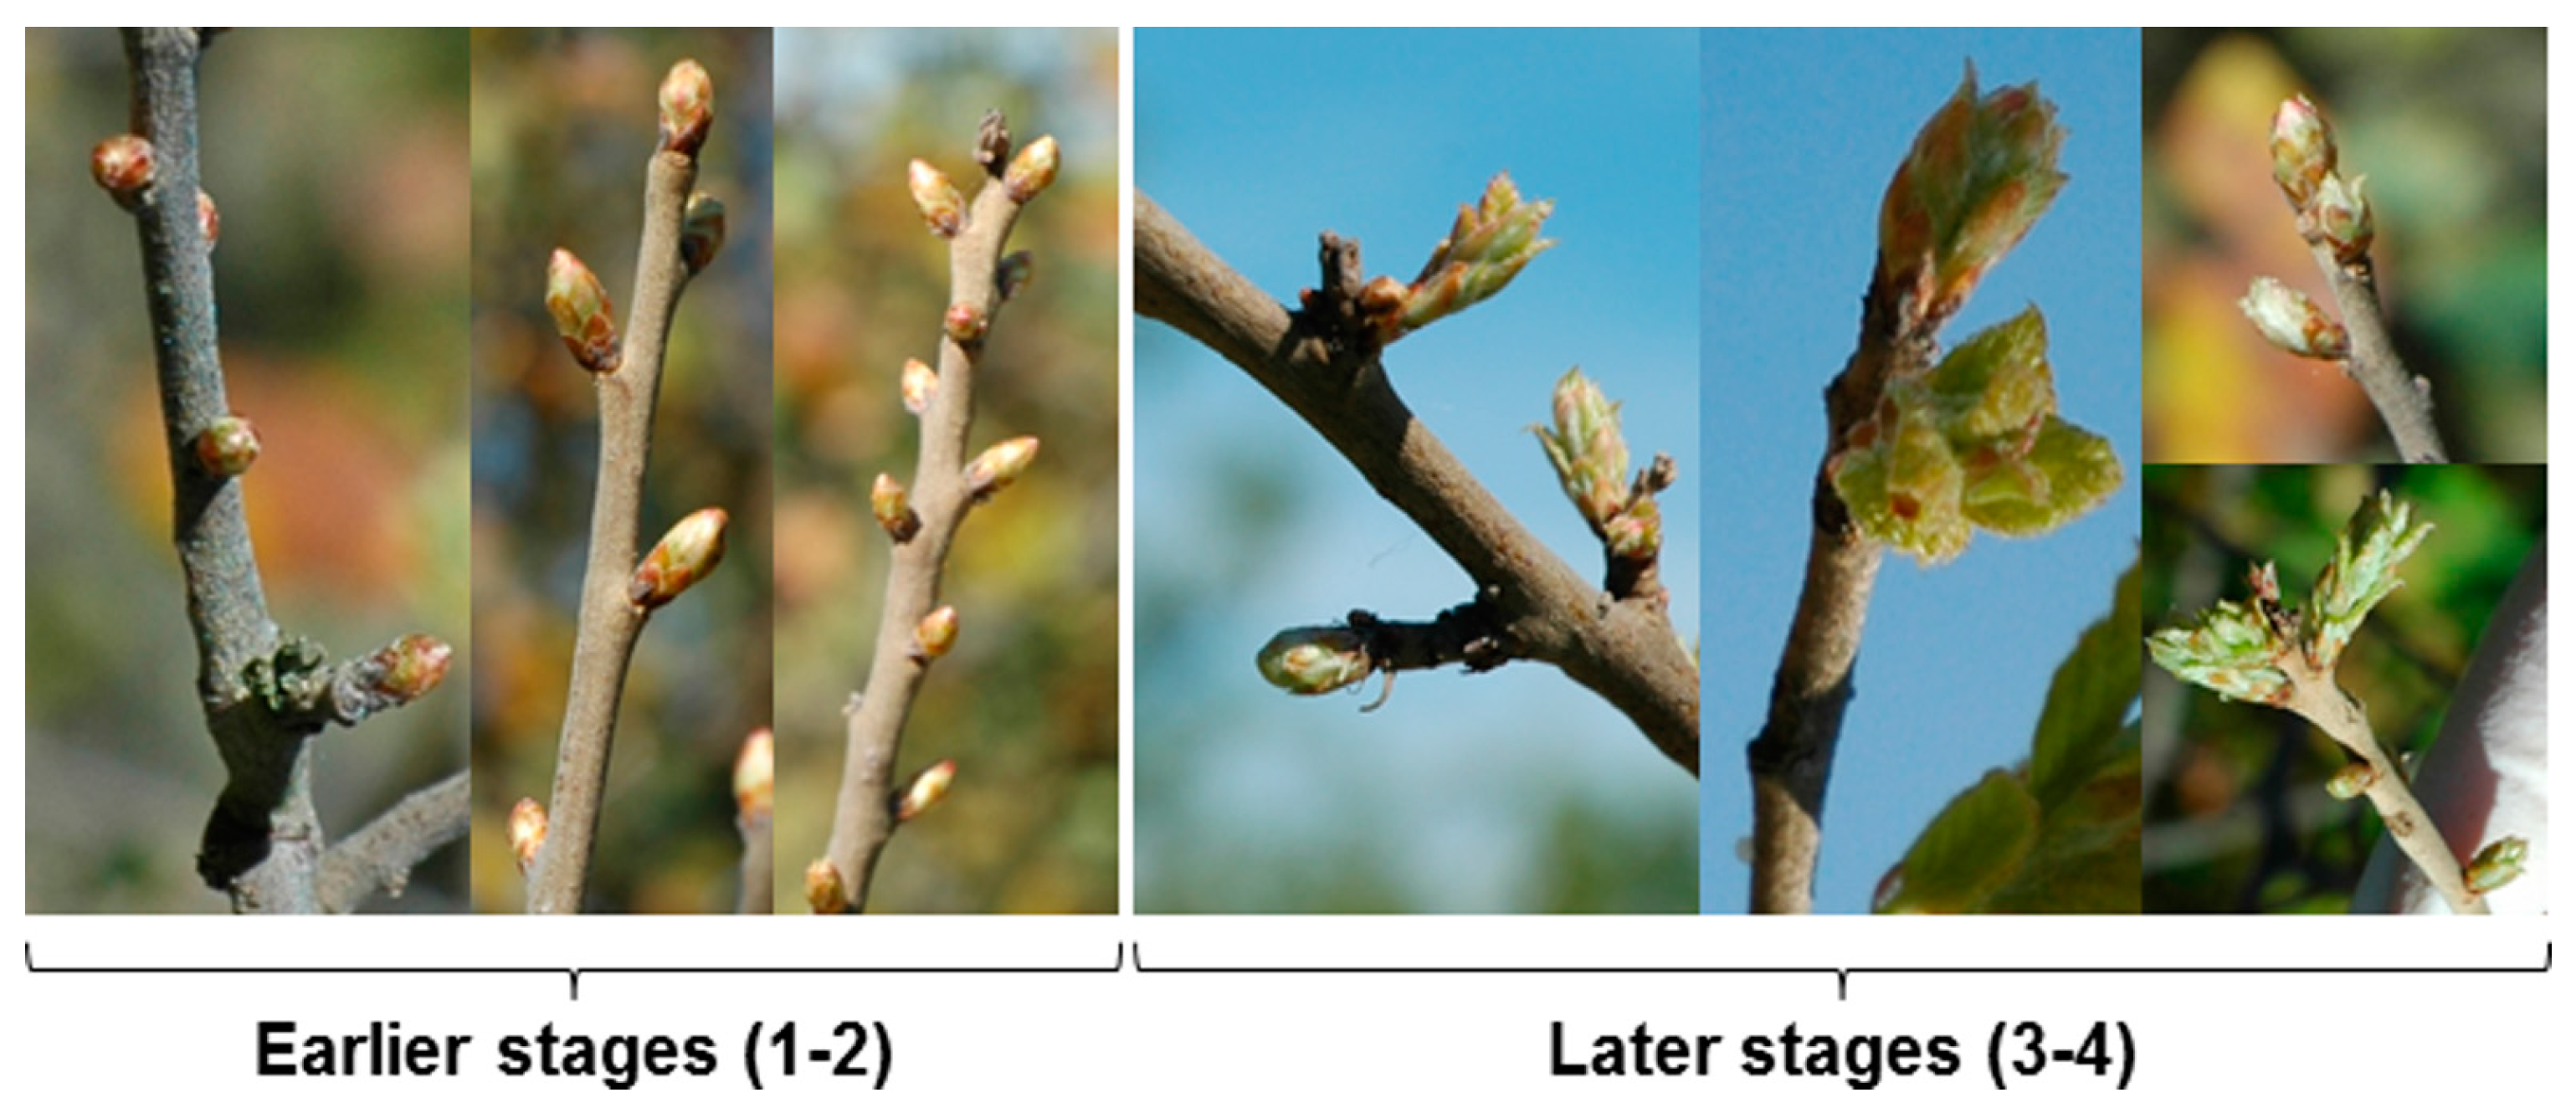
2.1. Sample Collection

Bud samples were collected from eight Quercus suber—individuals from different origins. The eight different genotypes were selected in order to capture the wider species-level transcriptomic mechanisms associated with bud sprouting development. These trees are part of a provenance assay growing under natural conditions, established in Portugal in 1998 at Monte de Fava (Ermidas do Sado, Portugal). Samples were collected in different phases of bud development. Buds were cut from selected branches presenting one of the following development stages: (1) dormant bud, (2) bud swollen, (3) red bud, and (4) open bud (Figure 1). The samples were immediately immersed in RNA Later (AMBION, Ambion, Inc., Austin, TX, USA) and, upon arrival at the lab, stored at −80 °C for RNA extraction.

2.2. Total RNA Extraction and Sequencing

Bud samples were homogenized with a speed mill (AnalyticJena, Jena, Germany). The total RNA was extracted using the RNAQUEOUS extraction kit (AMBION, Ambion, Inc., Austin, TX, USA) and analyzed for quality using a Bioanalyzer. Reverse transcription was performed with the Mint cDNA Synthesis kit from Evrogen (Evrogen JSC, Moscow, Russia), using oligo d(T) Primer. Four cDNA libraries were constructed (two from pooled stages 1 and 2, and two from pooled stages 3 and 4). One library from each pooled stage was normalized by the Duplex-Specific Nuclease-technology, which resulted in a total of four cDNA libraries (two non-normalized and two normalized). The constructed libraries were sequenced using the 454 GS FLX Titanium platform (Roche, Basel, Switzerland). The sequence data analyzed in this manuscript are available from the NCBI Sequence Read Archive under the accession numbers SRX2642267, SRX2642266, ERX143072, and ERX133073.

2.3. Sequence Data and Transcriptome Assembly

The 454 single-end read sequences from both library types, normalized and non-normalized, were pre-processed, according to different criteria, using a pipeline combining a custom Perl script (https://github.com/anausie/cebal/blob/master/preProcessing454.pl) and open-source tools, namely Mothur [13], for quality trimming, and Sequence Cleaner (https://sourceforge.net/projects/seqclean/). These procedures were performed in order to remove adaptors, barcodes, and poly-A or poly-T tails from the read sequences as well as remove/trim from the dataset reads with low average quality and a certain number of undetermined nucleotides (N’s). All the pre-processed reads were then used to perform a de novo transcriptome assembly using MIRA (Mimicking Intelligent Read Assembly) 4.9.5_2 [14], with the following parameters: -job = denovo, est, accurate, 454; -GE:not10:amm = no:mps = 100:kpmf = 90; -NW: cmrnk = warn; -SK:not = 10:mmhr = 10; -AS:mrpc = 2.

2.4. Read Mapping and Differential Expression Analysis

The pre-processed reads from each non-normalized library were aligned to the assembled contigs using BWA-mem (BWA: Burrows-Wheeler Aligner) with default parameters [15]. The mapping results were processed with Samtools [16], and only the reads that mapped to a unique location (UMR—uniquely mapped reads) were kept for further analyses. In addition, coding regions within assembled contigs were predicted with Transdecoder [17].
The featureCounts tool [18] was used to create a table with the counts for the UMRs for each transcript, required for edgeR, a Bioconductor software package [19], used to perform the differential expression analysis. Genes with low counts across the dataset were discarded, in line with edgeR guidelines (minimum of 6 reads as cutoff), and a TMM (Trimmed mean of M-values) normalization was applied to normalize library sizes before integrating them in the statistical model. EdgeR works on replicated data considering either the biological and technical variability between conditions. This variability is referred to as the Biological Coefficient Variation (BCV). Given that no replicates were available for this dataset, we considered the BCV to be 0.1, in line with edgeR recommendations. From the total list of differentially expressed genes, we filtered out those with an FDR (False Discovery Rate) value ≤0.05.

2.5. Validation of Differentially Expressed Genes by Quantitative Real-Time PCR Analysis

To confirm the differential expression results obtained with edgeR, quantitative real-time PCR (qPCR) assays were performed using 9 randomly chosen genes. The primers were designed using Primer3Plus software [20] (Table S1). Reverse transcription was performed using the QuantiTect Reverse Transcription Kit (Qiagen, Hilden, Germany) with 1 µg of Total RNA following the manufacturer’s instructions. Relative expression quantification was performed with an iQ5 system (BioRad, USA) using the SsoAdvanced Universal SYBR Green Supermix (BioRad, Hercules, CA, USA) and 250 nM of each primer in a final volume of 20 μL. All samples were run in triplicate and a no template control (NTC) was used for every primer pair.
The following program was used for all reactions: 95 °C for 10 min, 45 cycles at 95 °C for 10 s, 60 °C for 15 s, 72 °C for 15 s. A melting curve was generated for each reaction to assure specificity of the primers and the presence of primer-dimer. Primers’ efficiencies were assessed using a serial dilution of cDNA stock. The change fold was calculated using the mathematical model described by Pfaffl [21] using four reference genes (Act, CACs, EF-1α, and β-Tub) previously reported for Quercus suber L. [22].

2.6. Functional Annotation

The predicted coding sequences (CDS) from Transdecoder 2.01 were functionally annotated, using a blast against the non-redundant protein plant sequence database from NCBI, with an e-value of 1 × 10⁻⁵ [23]. InterproScan 5.18.57 was used to find the protein domains and identify the Gene Ontology (GO) terms. Additionally, it also assigned KEGG (Kyoto Encyclopedia of Genes and Genomes) information to the sequences by identifying enzymes’ EC numbers and the corresponding KEGG pathways [24]. All these results were analyzed with Cytoscape 3.3 and CateGOrizer [25,26].

3. Results

3.1. Preprocessing of the Sequence Data and De Novo Transcriptome Assembly

Four libraries (two normalized and two non-normalized) were constructed using RNA extracted from Q. suber buds were sampled at different development stages. A total of 2,245,526 reads were produced using the 454 GS FLX Titanium platform, ranging from 49 to 1201 bp (base-pairs) in length. By the end of the pre-processing step, a total of 1,772,150 reads remained in the dataset, which represented 78.9% of the initial number of reads. These results are displayed in Table 1.
A de novo assembly of the cork oak transcriptome involved in the regulation of bud sprouting was generated with MIRA 4.9.5_2. A total of 117,094 contigs were generated, of which 115,935 were larger than 200 bp.

3.2. Read Mapping, Differential Expression

The pre-processed reads from each non-normalized library were aligned to the assembled contigs using the BWA-mem algorithm. A total of 815,287 reads were mapped, which represented 95.2% of the total, while the number of UMR was 358,785. These results are indicated in Table 2.
As described above, the coding regions within transcripts were predicted, and a total of 57,034 coding regions (predicted genes) were obtained. Following the procedures for the differential expression analysis, we obtained a total of 58 differentially expressed genes between the two pools of bud development stages: 38 down-regulated—genes with a higher expression level or only expressed in early stages (pool 1)—and 20 up-regulated—genes with a higher expression level or only expressed in later stages (pool 2).

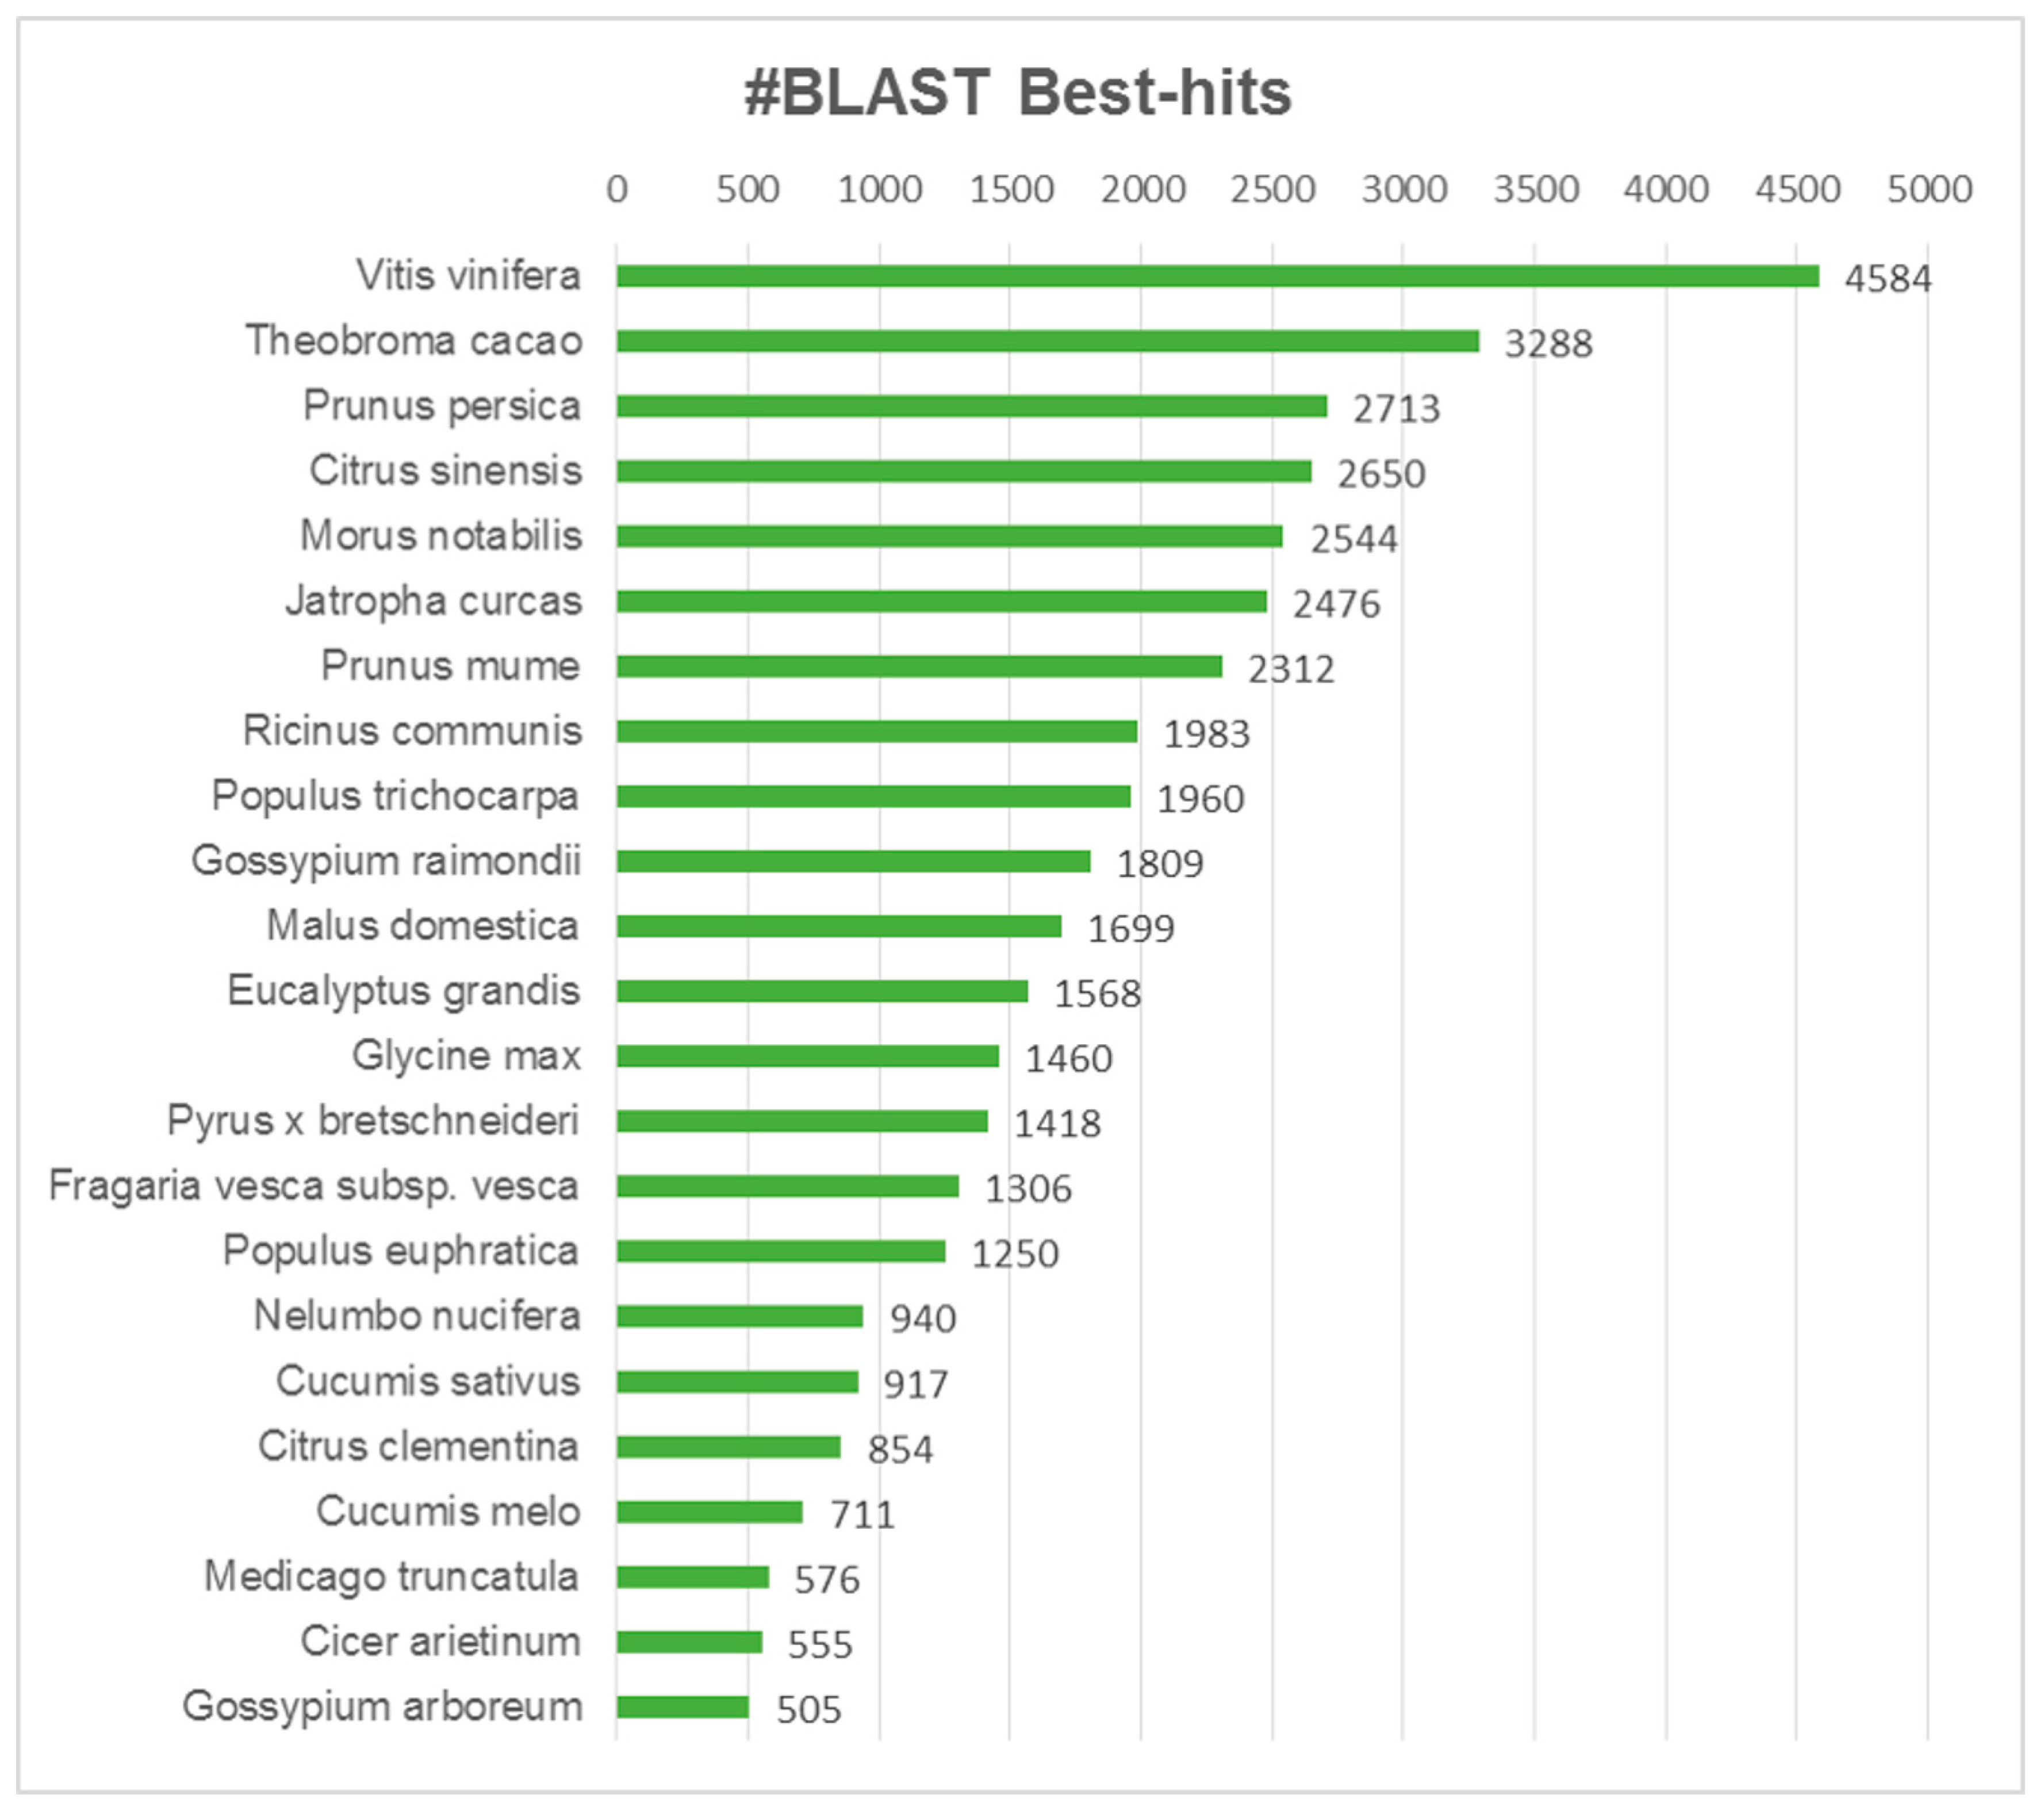
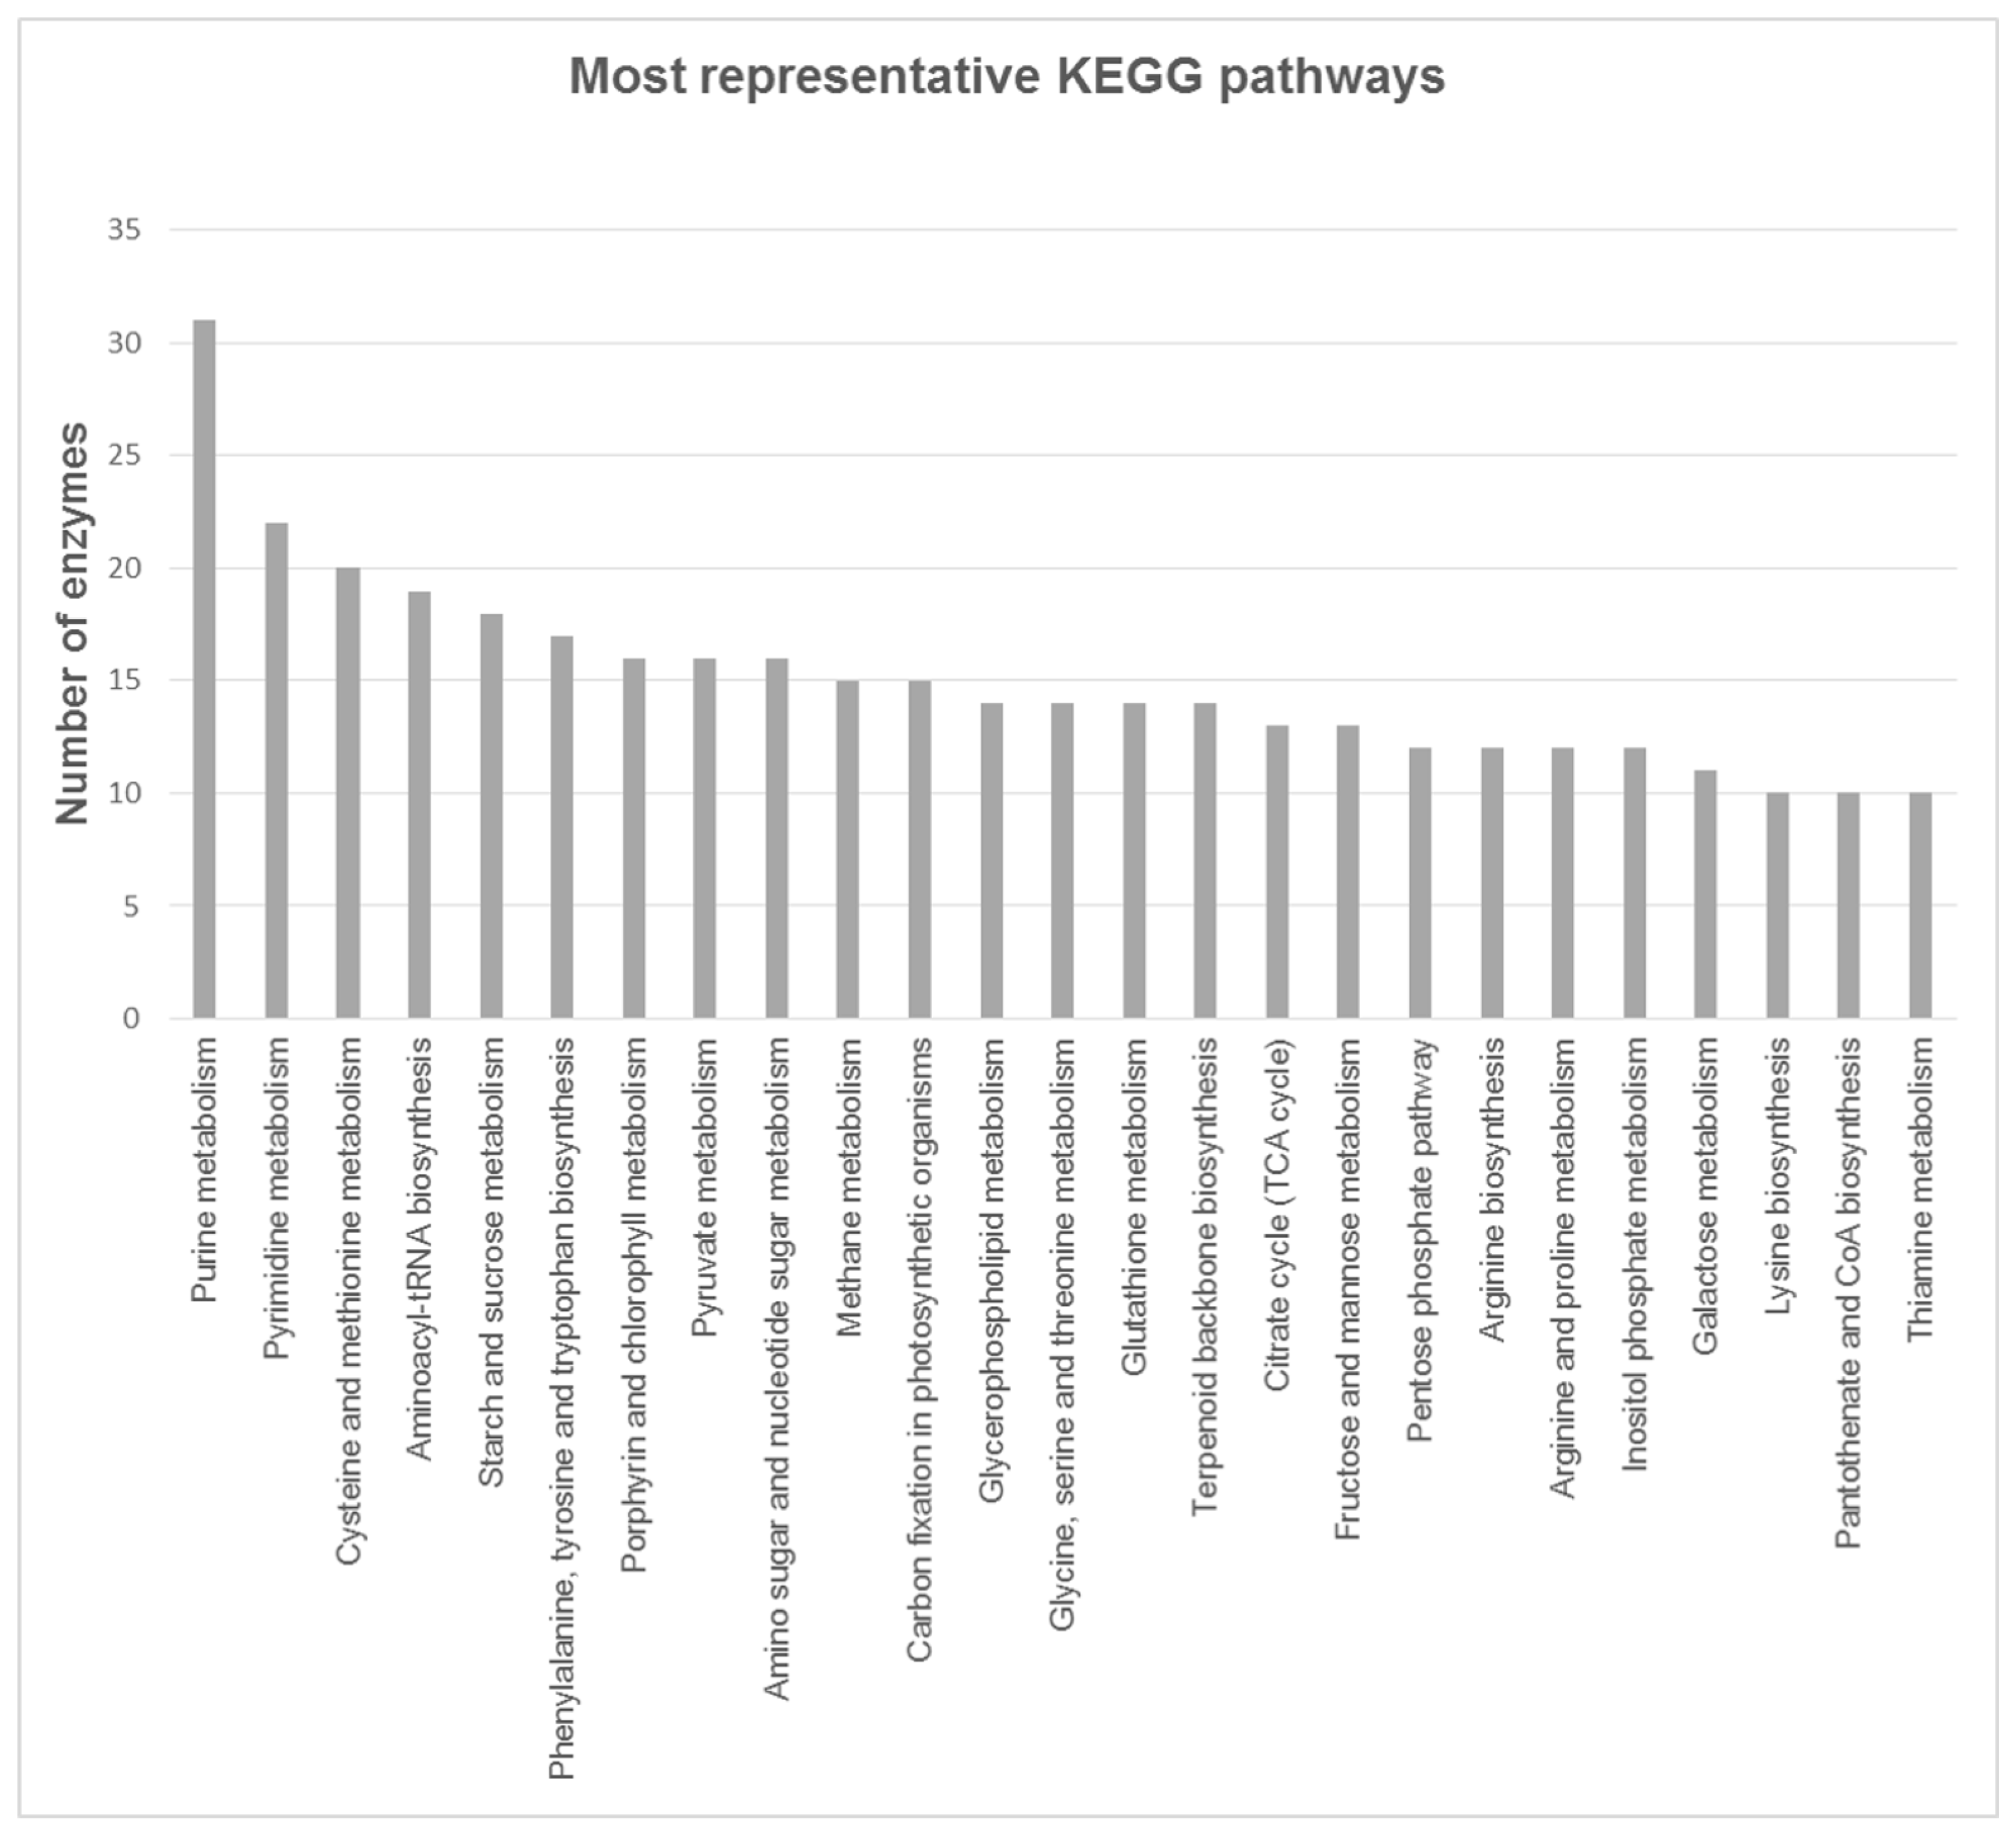
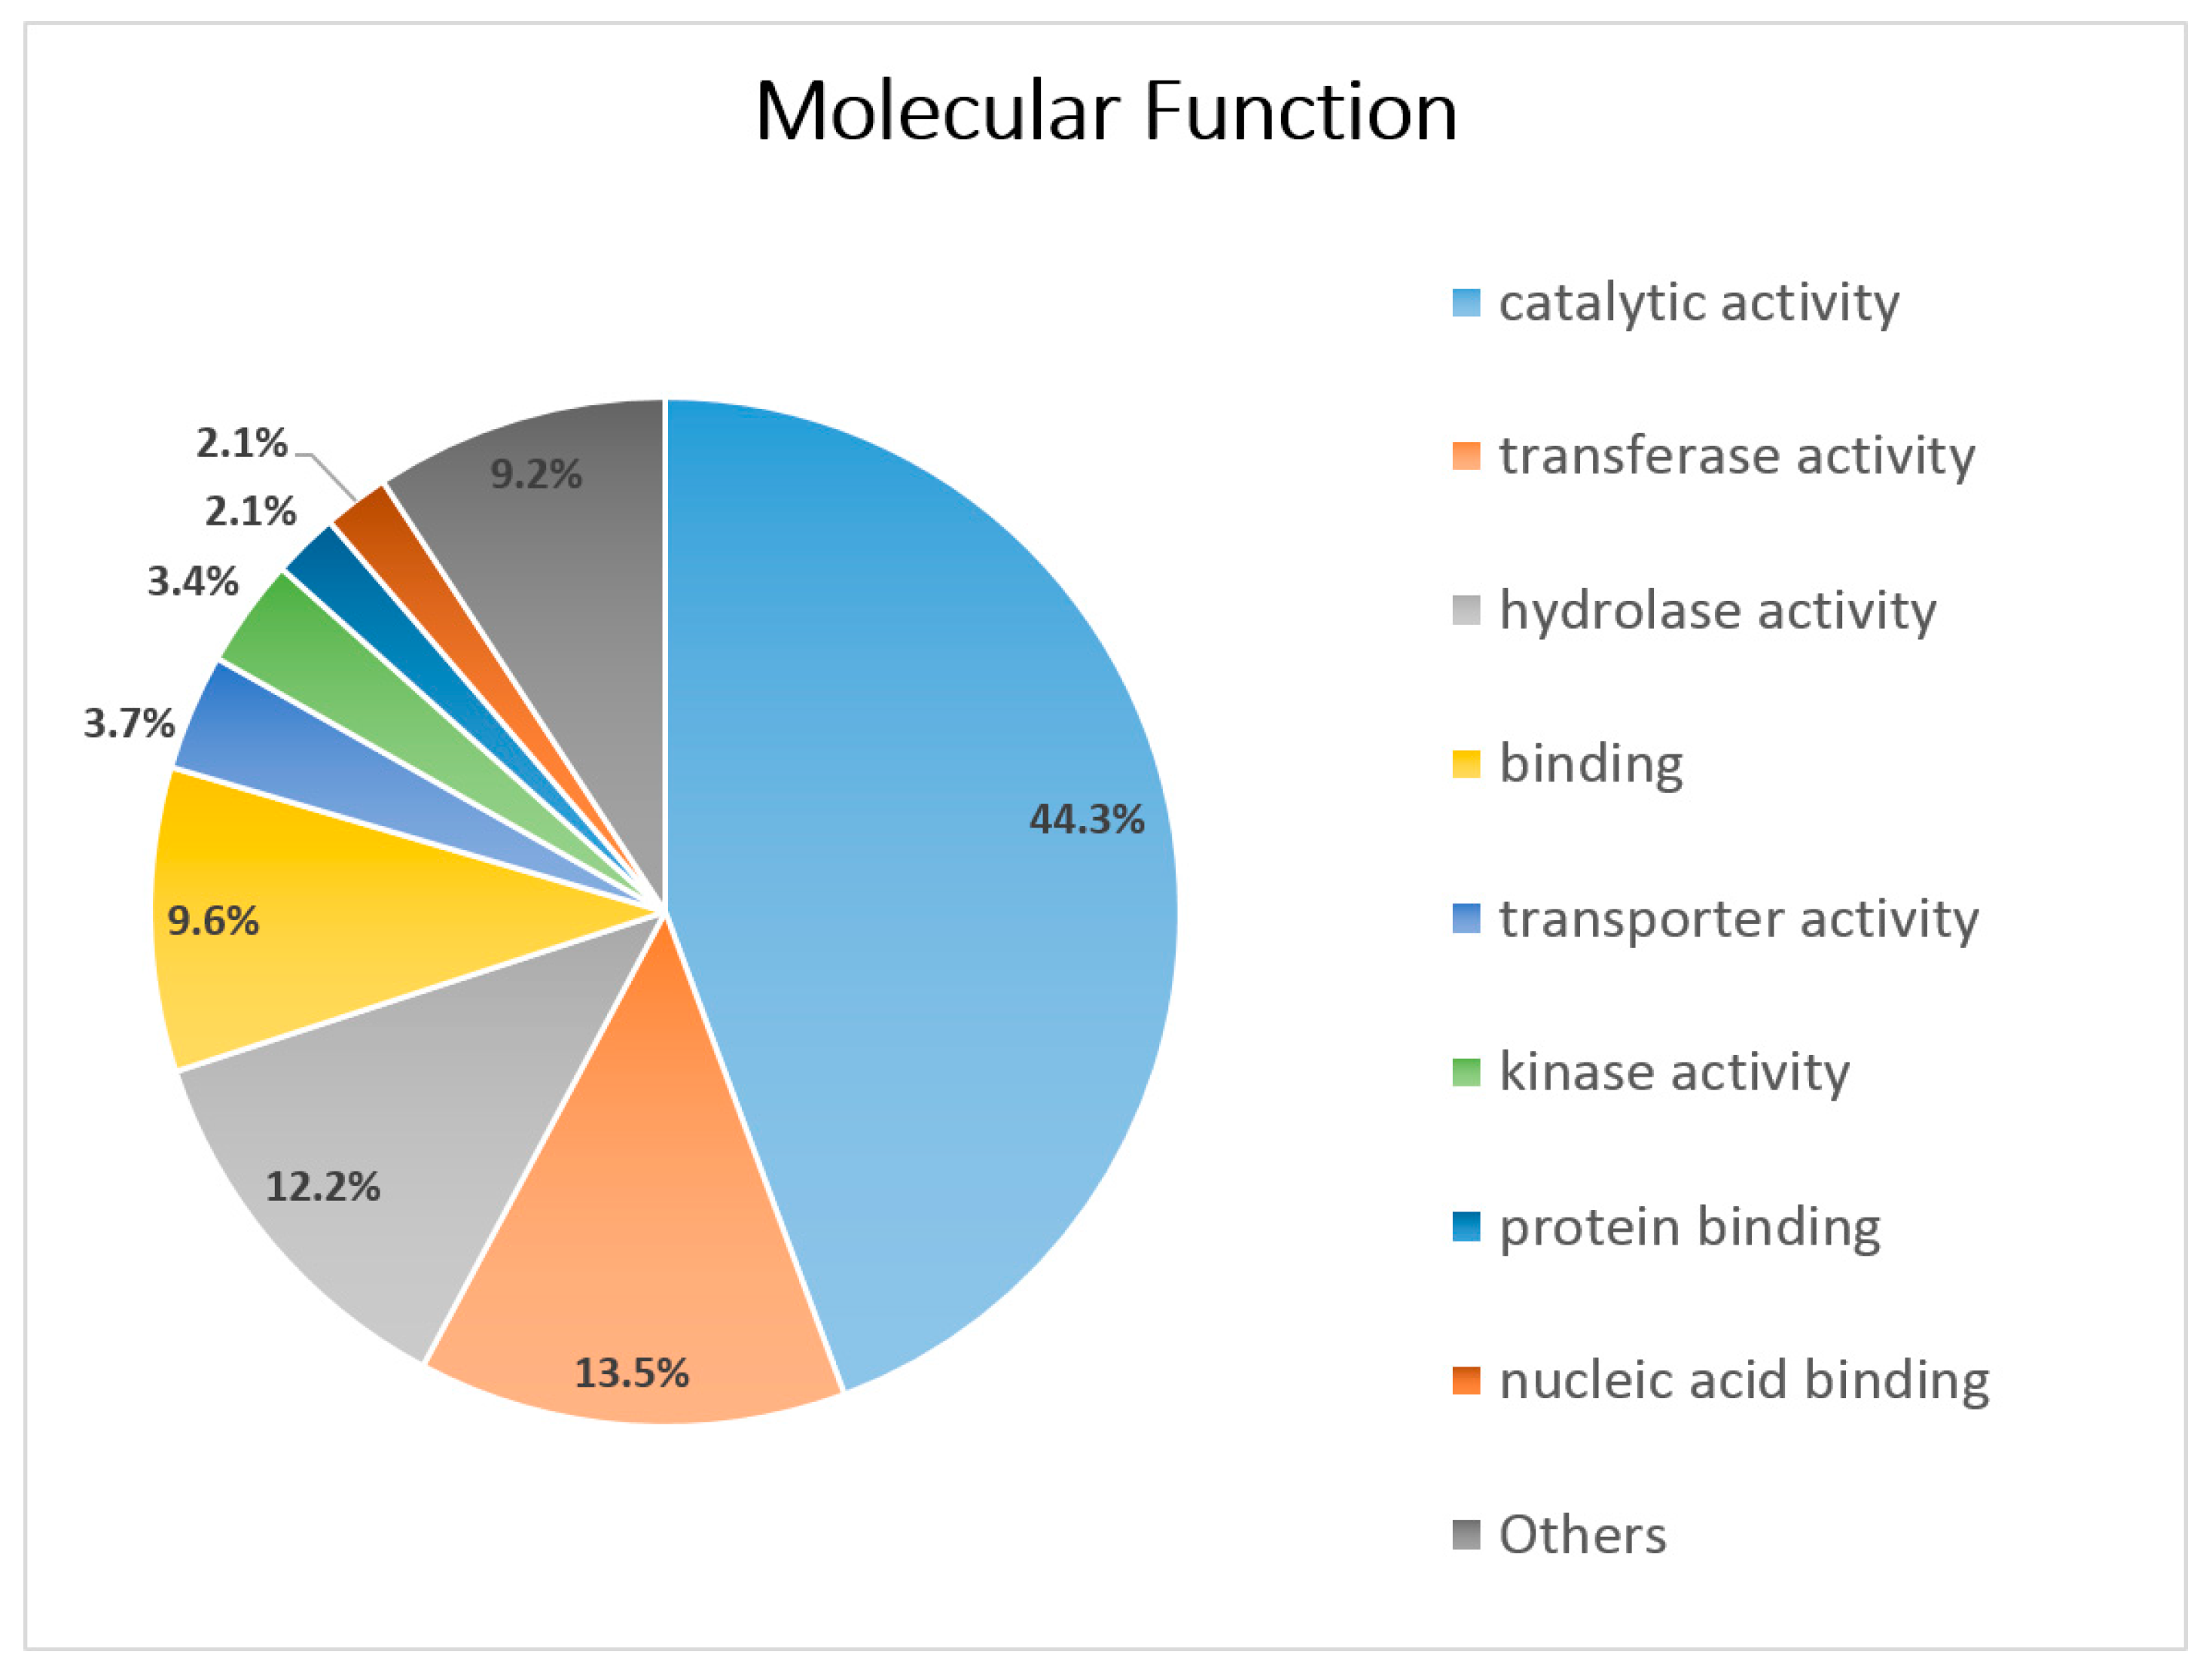
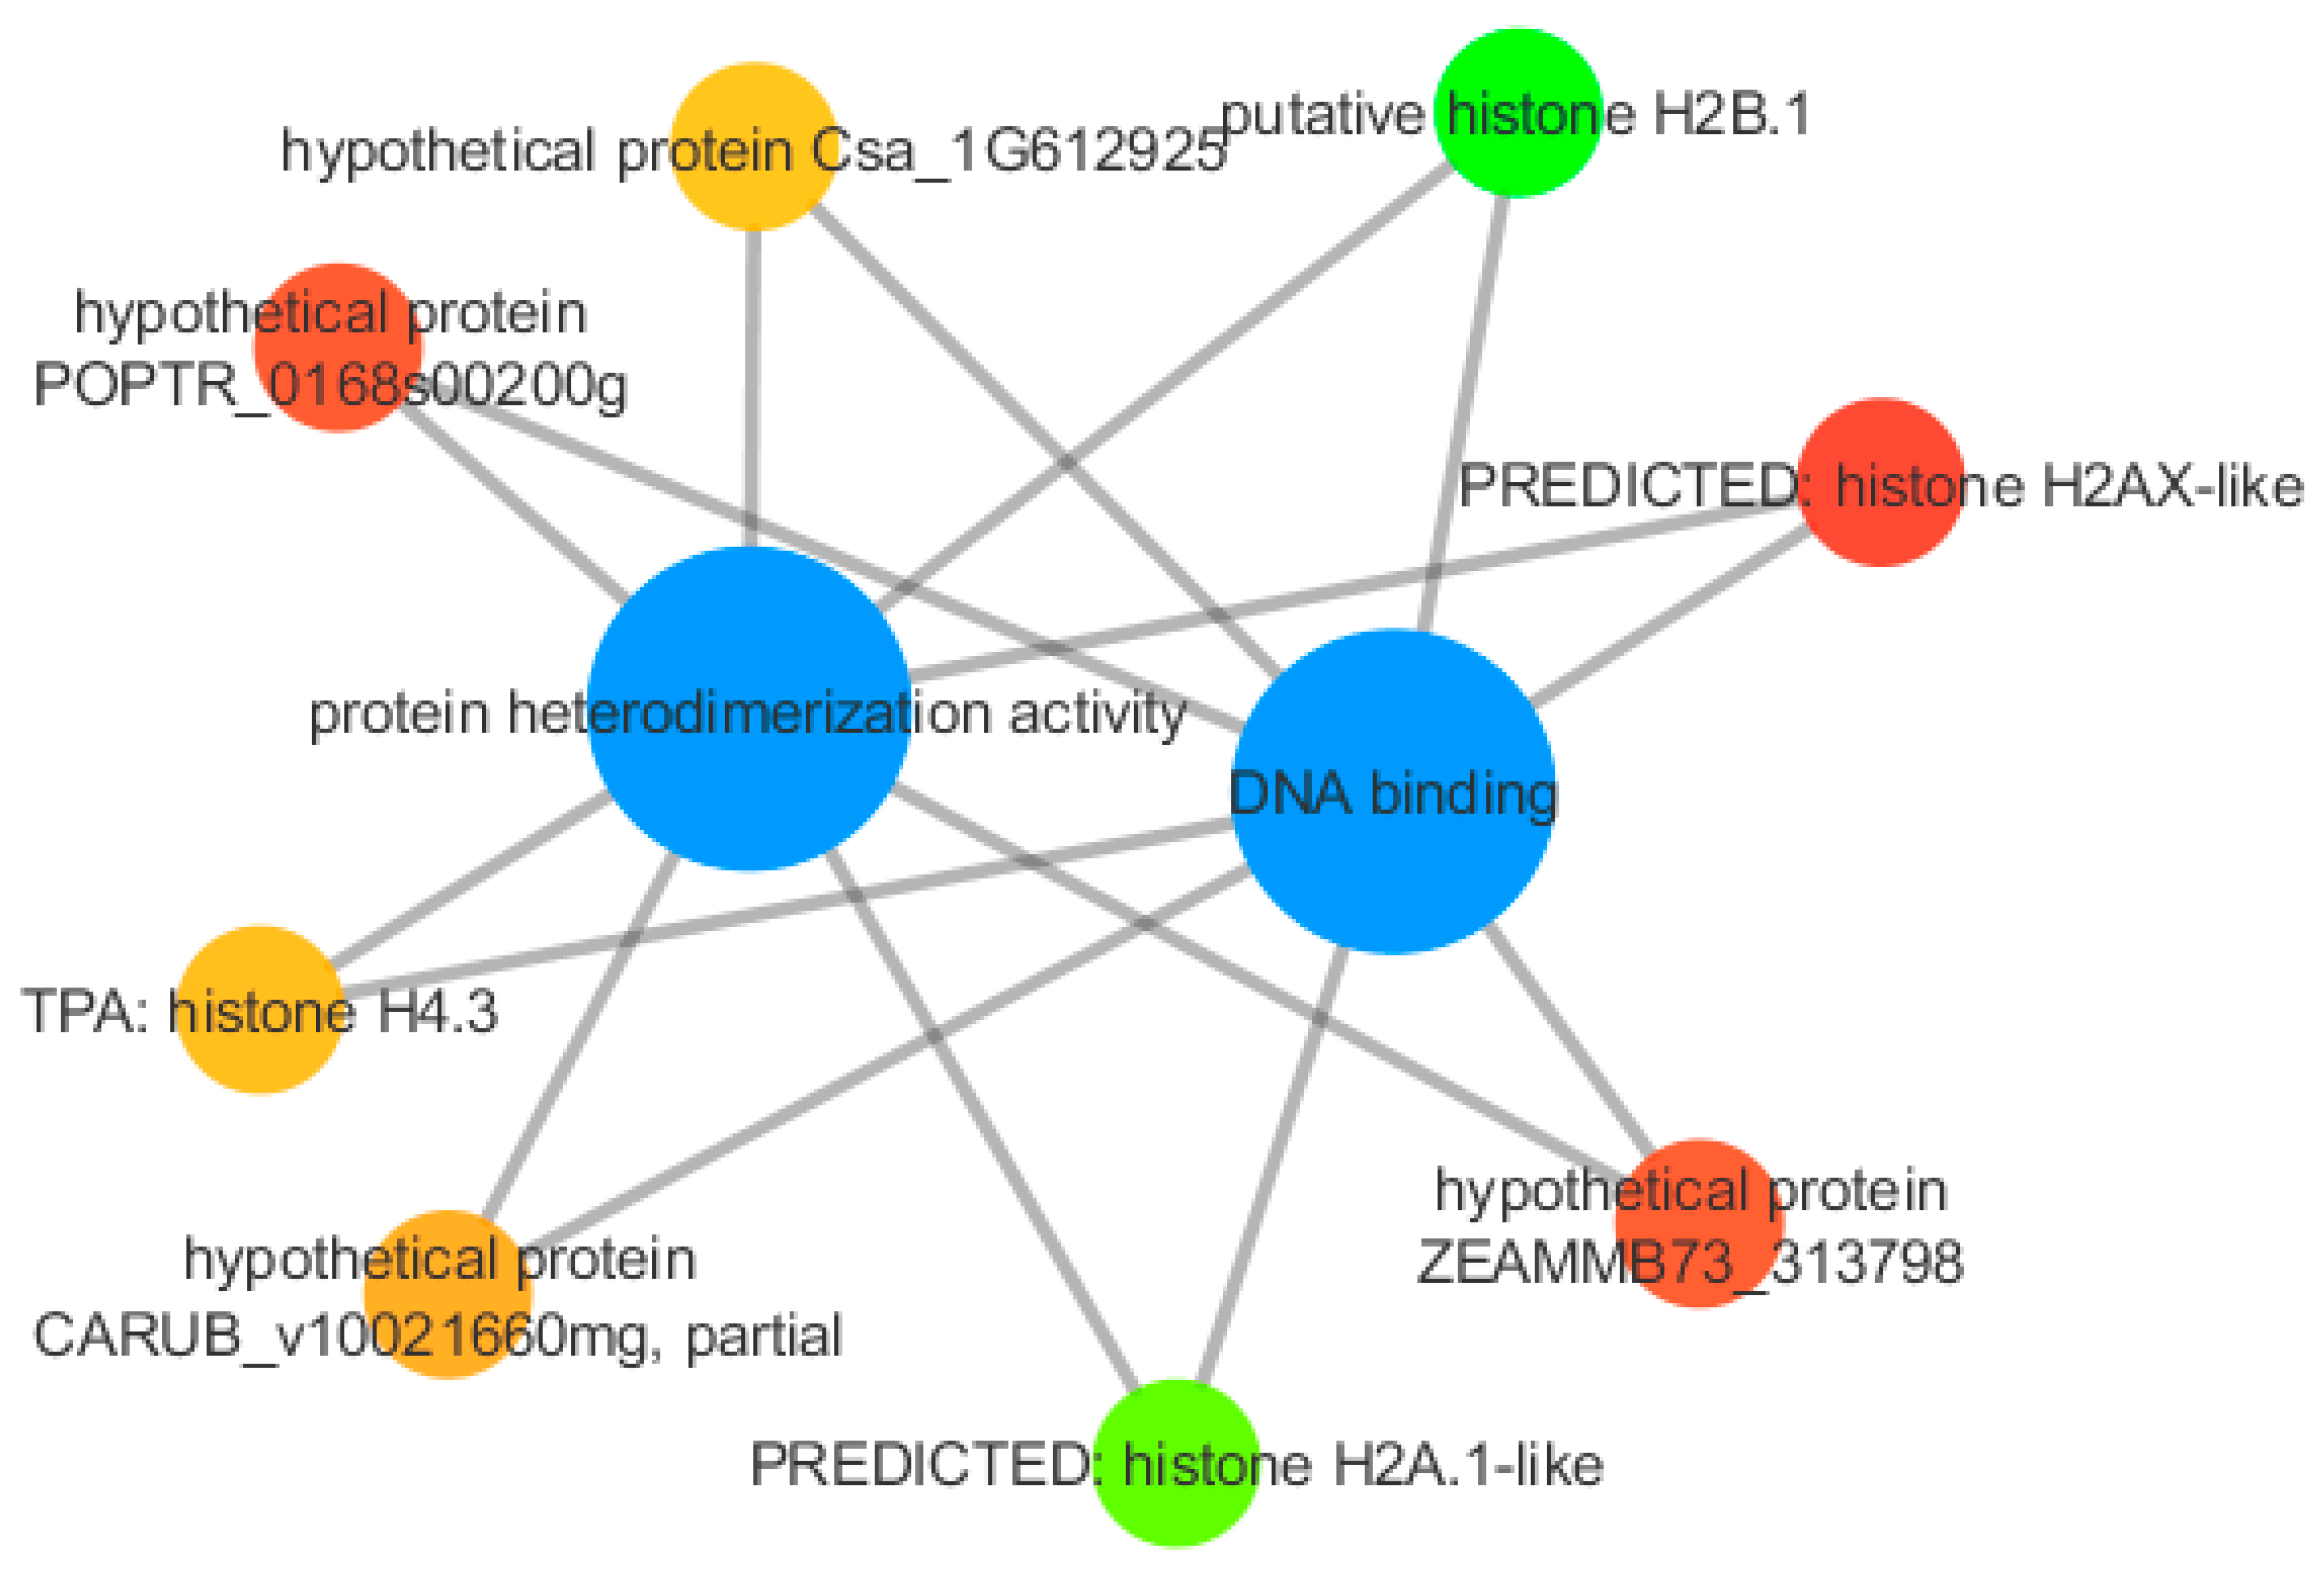
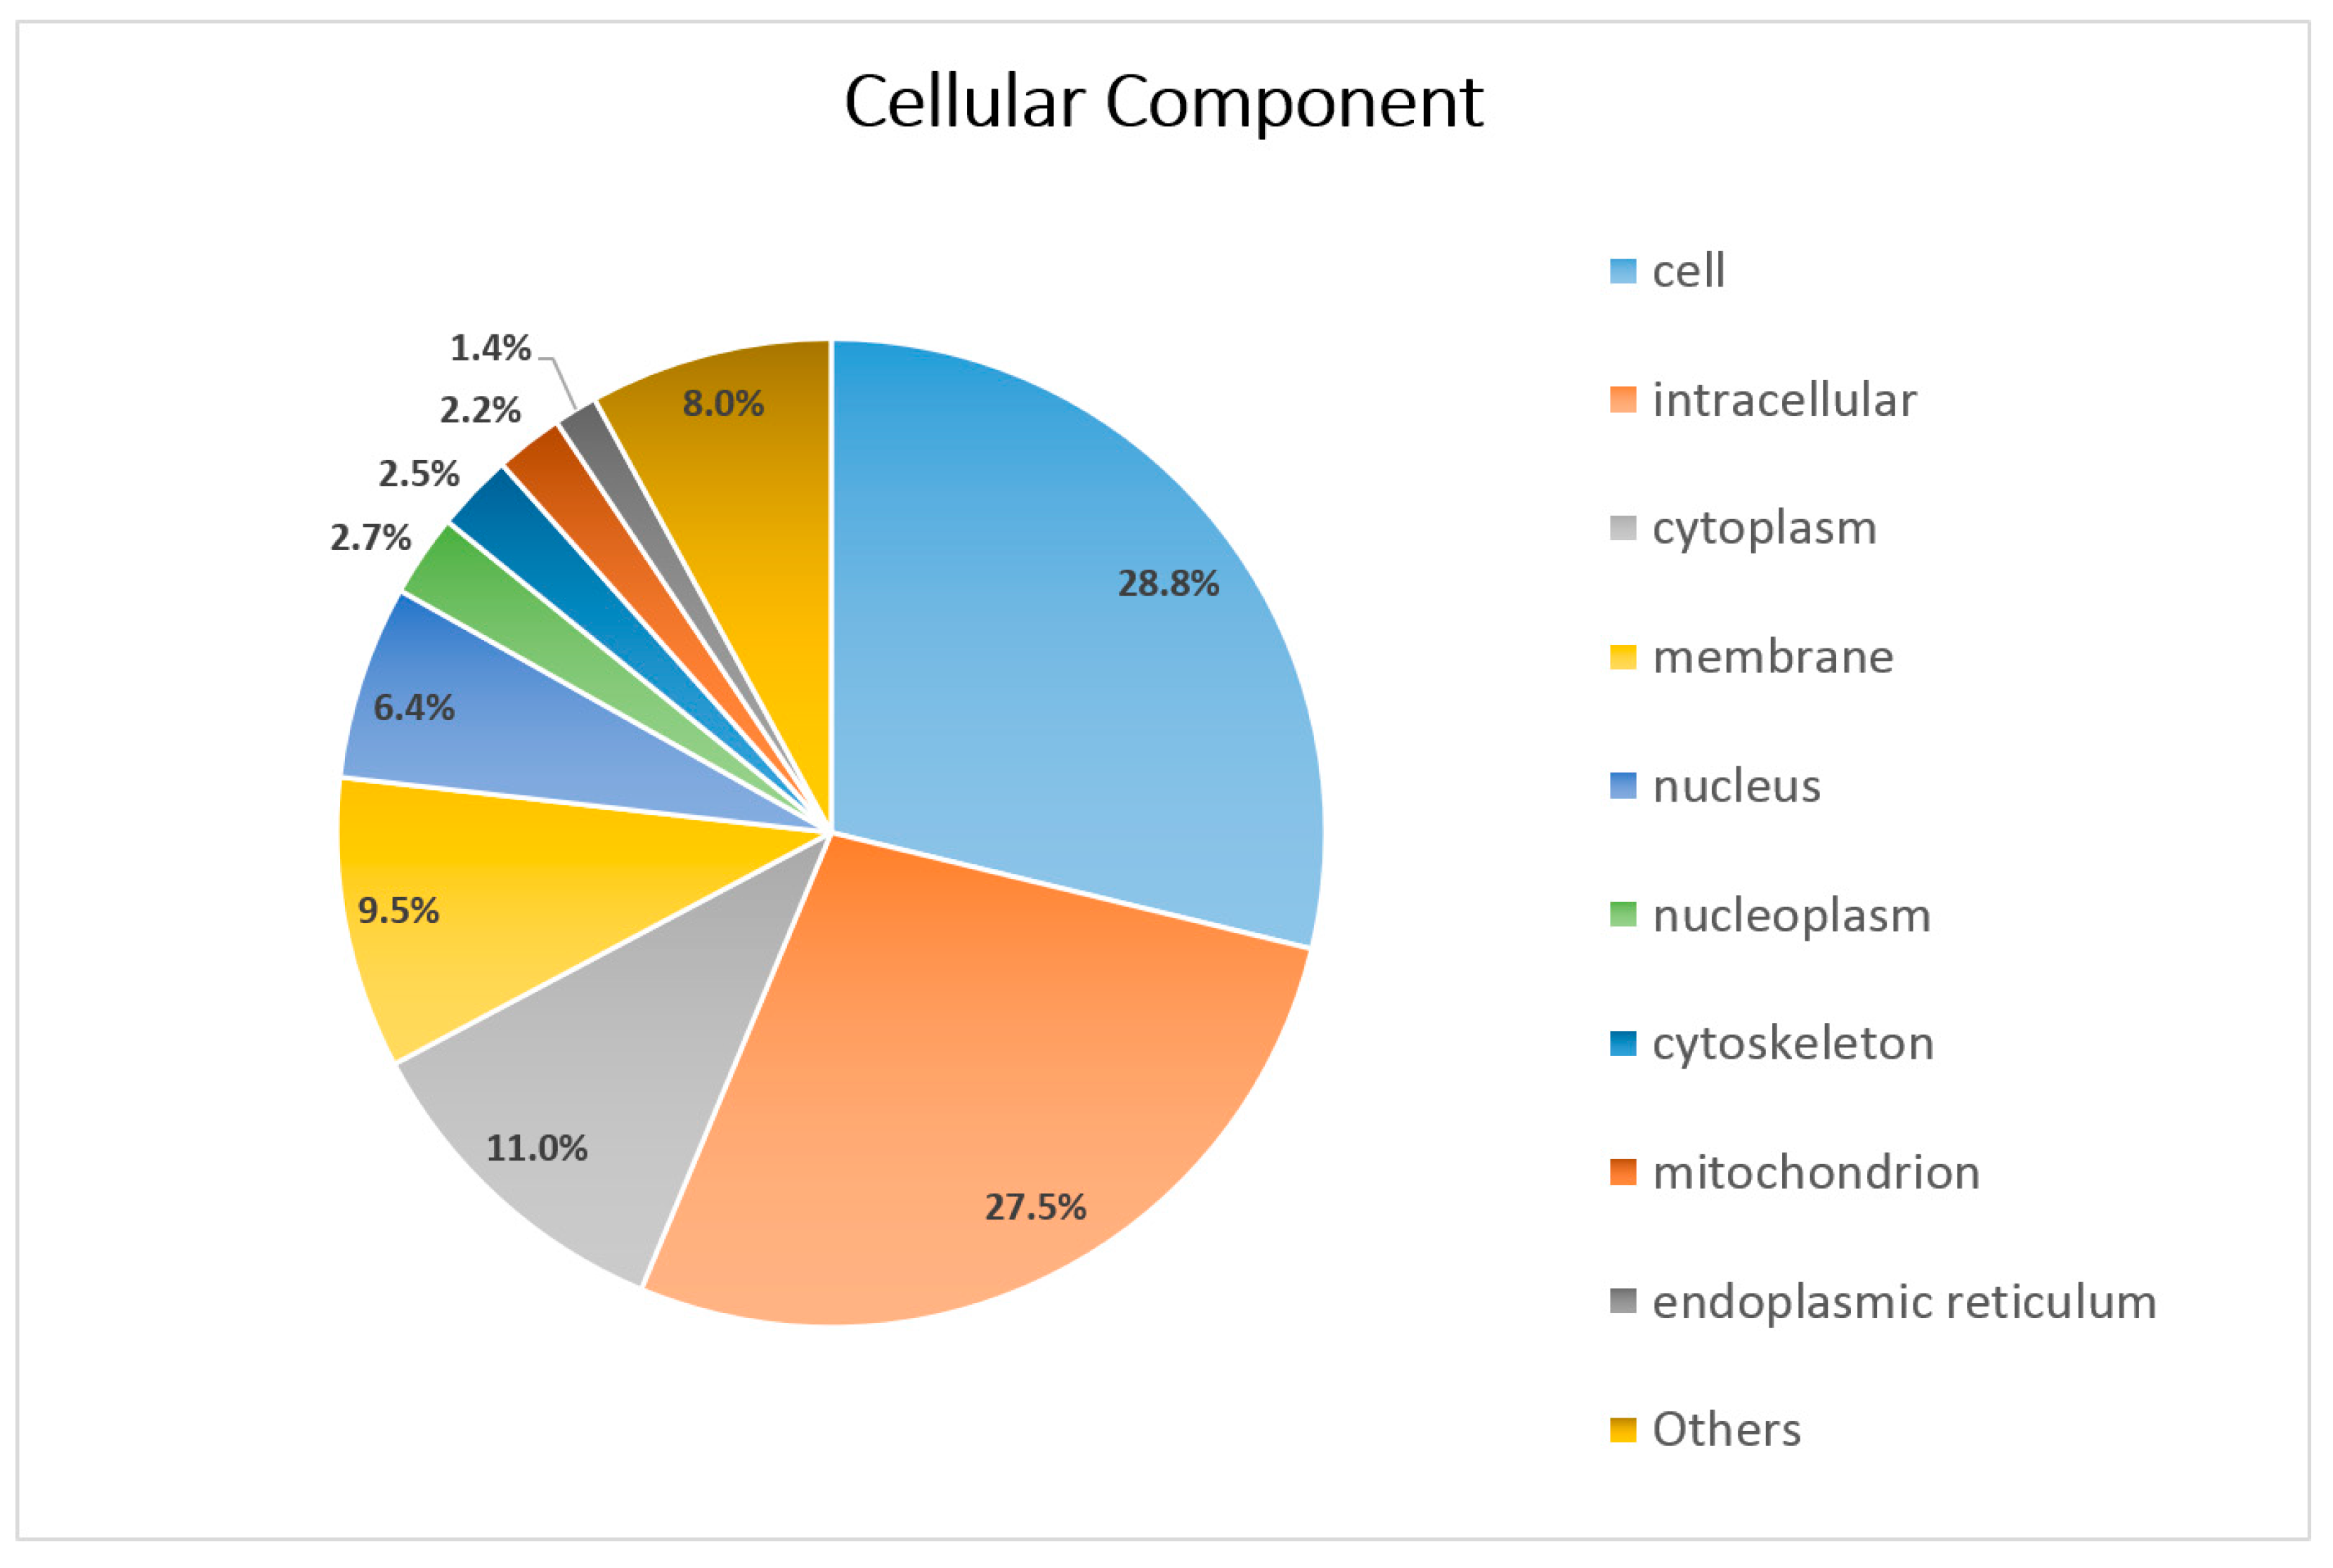
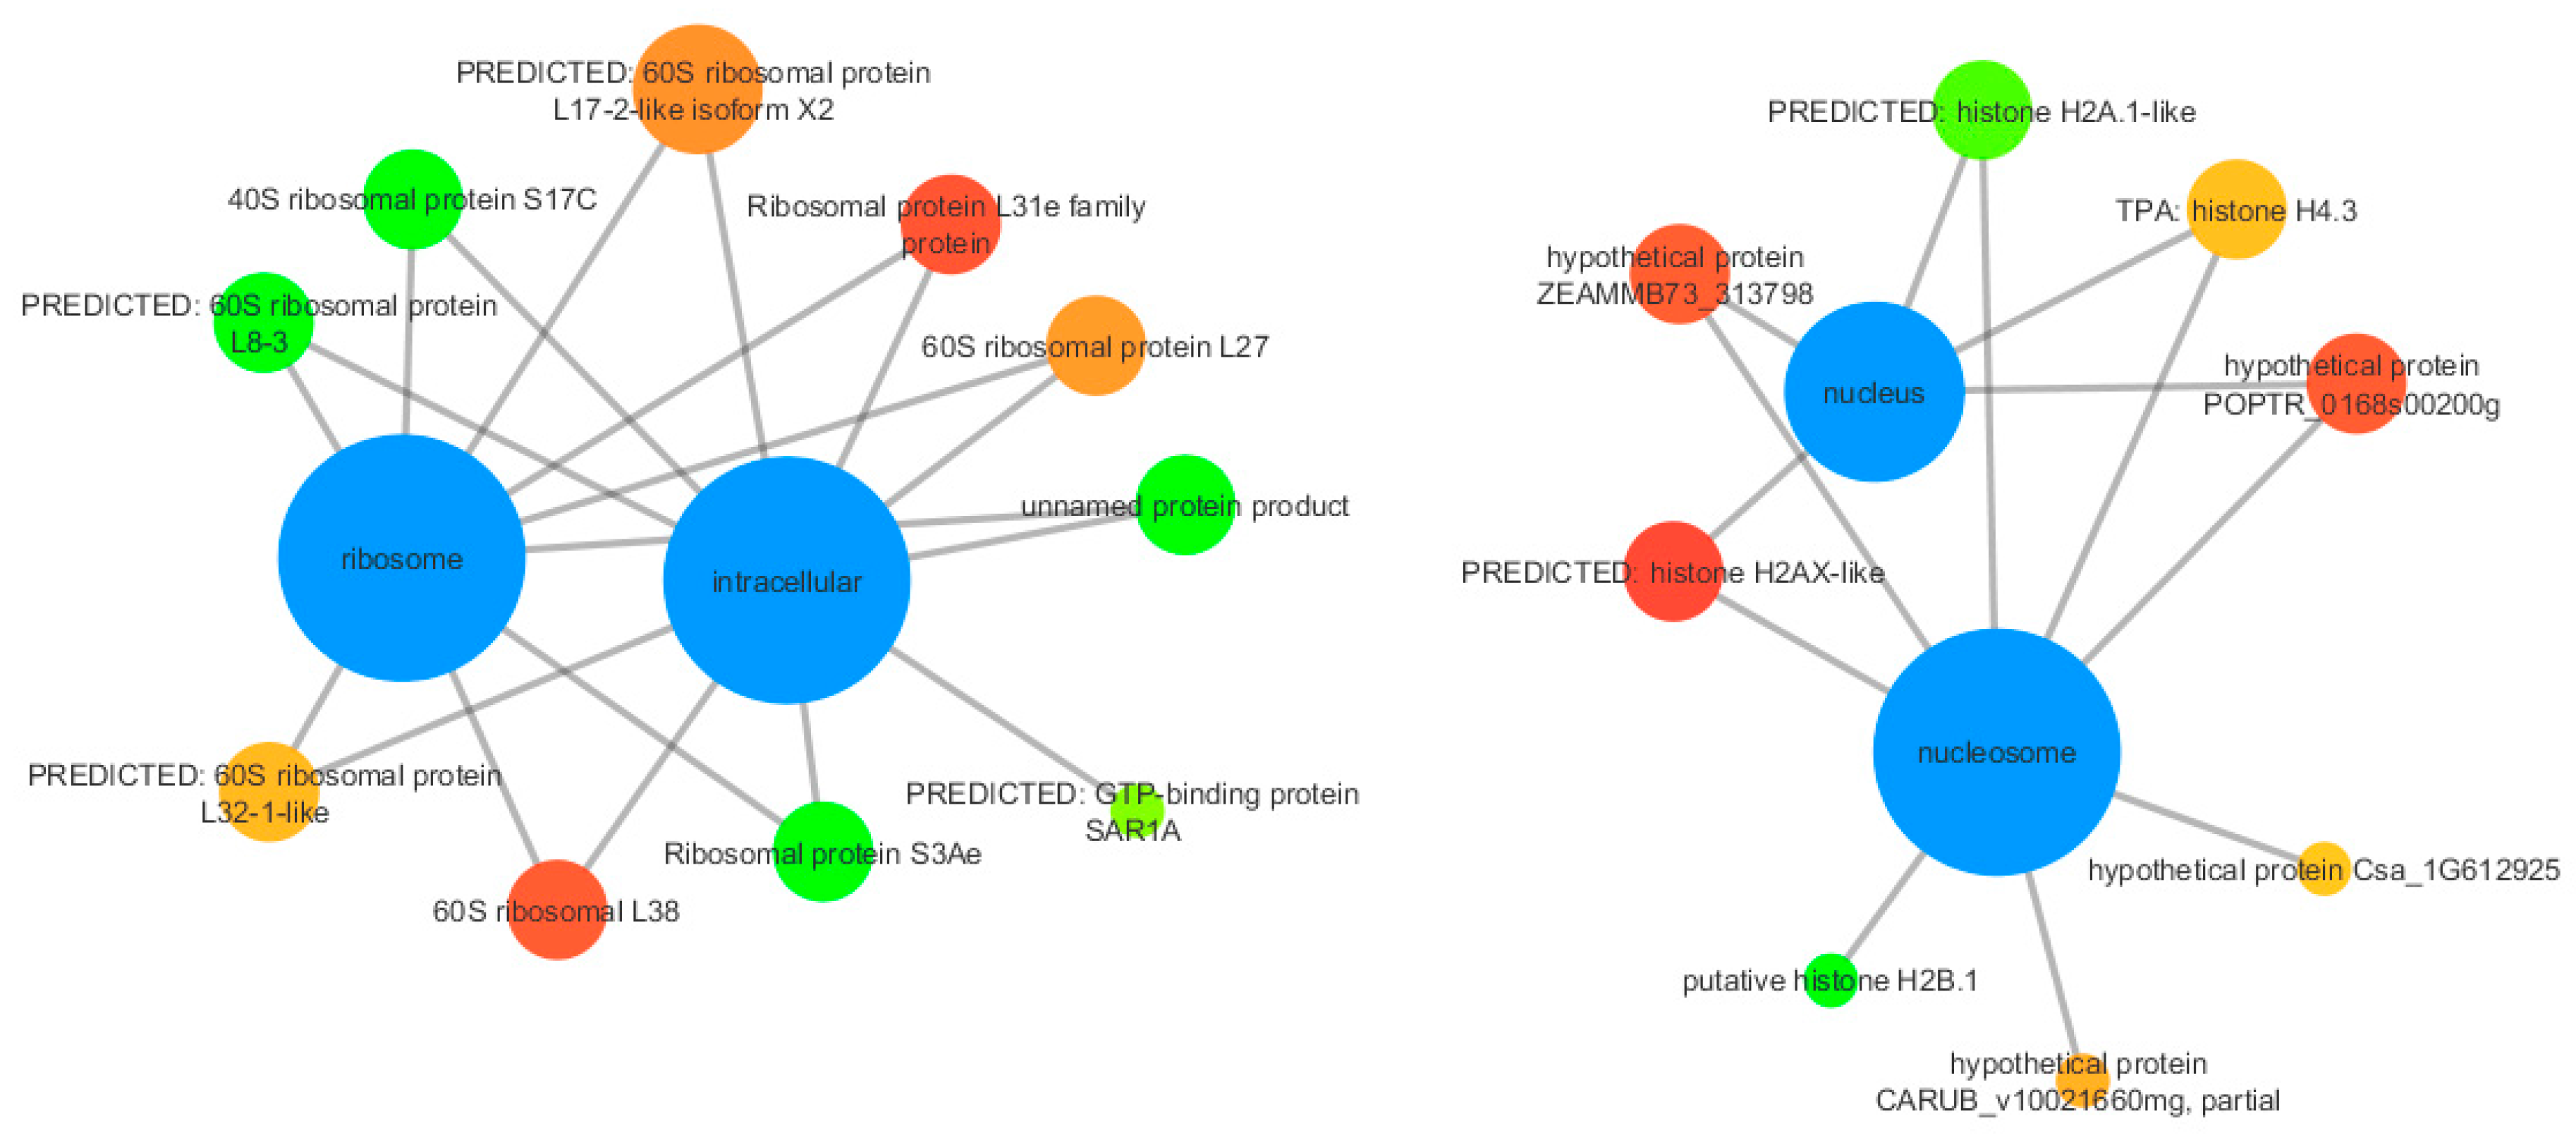
3.3. Functional Annotation

The set of protein sequences where coding regions were predicted by Transdecoder (57,034 predicted genes) was annotated with blastp (protein blast) against the non-redundant NCBI plants database, which resulted in 90.7% (51,728) of the predicted genes having at least one hit. Taking into account the best hit for each predicted gene, a distribution of occurrences over the annotated species was performed, yielding a total number of 692 plant species (Figure 2). The majority of the hits identified were against Vitis vinifera (8.9% of the best hits). Cork oak, as well as most of the species found in the top 10 of the best hits, belong to rosids, one of the major clades of order.
Additionally, InterPro was used to identify protein domains, functional classes of GOs (gene ontology) and KEGG pathways associated with the sequences of the predicted genes. A total of 48,022 sequences had at least one protein domain, and 29,383 sequences mapped to at least one GO term, covering a total of 1602 different GO terms, of which 40.4% belonged to Biological Process (BP), 47.1% to Molecular Function (MF) and 12.5% to Cellular Components (CC). Moreover, 3680 sequences were associated with at least one KEGG pathway, for a total of 114 KEGG pathways and 387 different enzymes (Figure 3).
The GO terms were further analyzed with CateGOrizer which mapped the GOs against the Plant GOSlim database. We obtained a total of 41 subcategories of GO terms belonging to BP, 24 to MF, and 24 to CC categories. BP, MF, and CC categories contained a total of 19,881, 11,169, and 25,441 gene sequences, respectively.
Regarding the 58 differentially expressed genes, 36 mapped to at least one GO over the total number of 52 different GO terms identified. CateGOrizer identified 17 subcategories of GO terms belonging to BP, 12 to MF, and 7 to CC, over 22, 2622, and 8 different GOs, respectively (Figure 4, Figure 5 and Figure 6). With respect to KEGG pathways, only four genes, codifying a different enzyme each, were associated with eight KEGG pathways.
The vast majority of differentially expressed genes associated with the MF GO terms were down-regulated and/or annotated as core histones (Figure 7). The DE (differentially expressed) genes associated with the CC GO terms with mostly down-regulated and/or annotated as r-proteins and histones (Figure 8).
Briefly, the results obtained with the differential expression analysis revealed several candidate genes related with bud sprouting, from which a subset is displayed in Table 3.

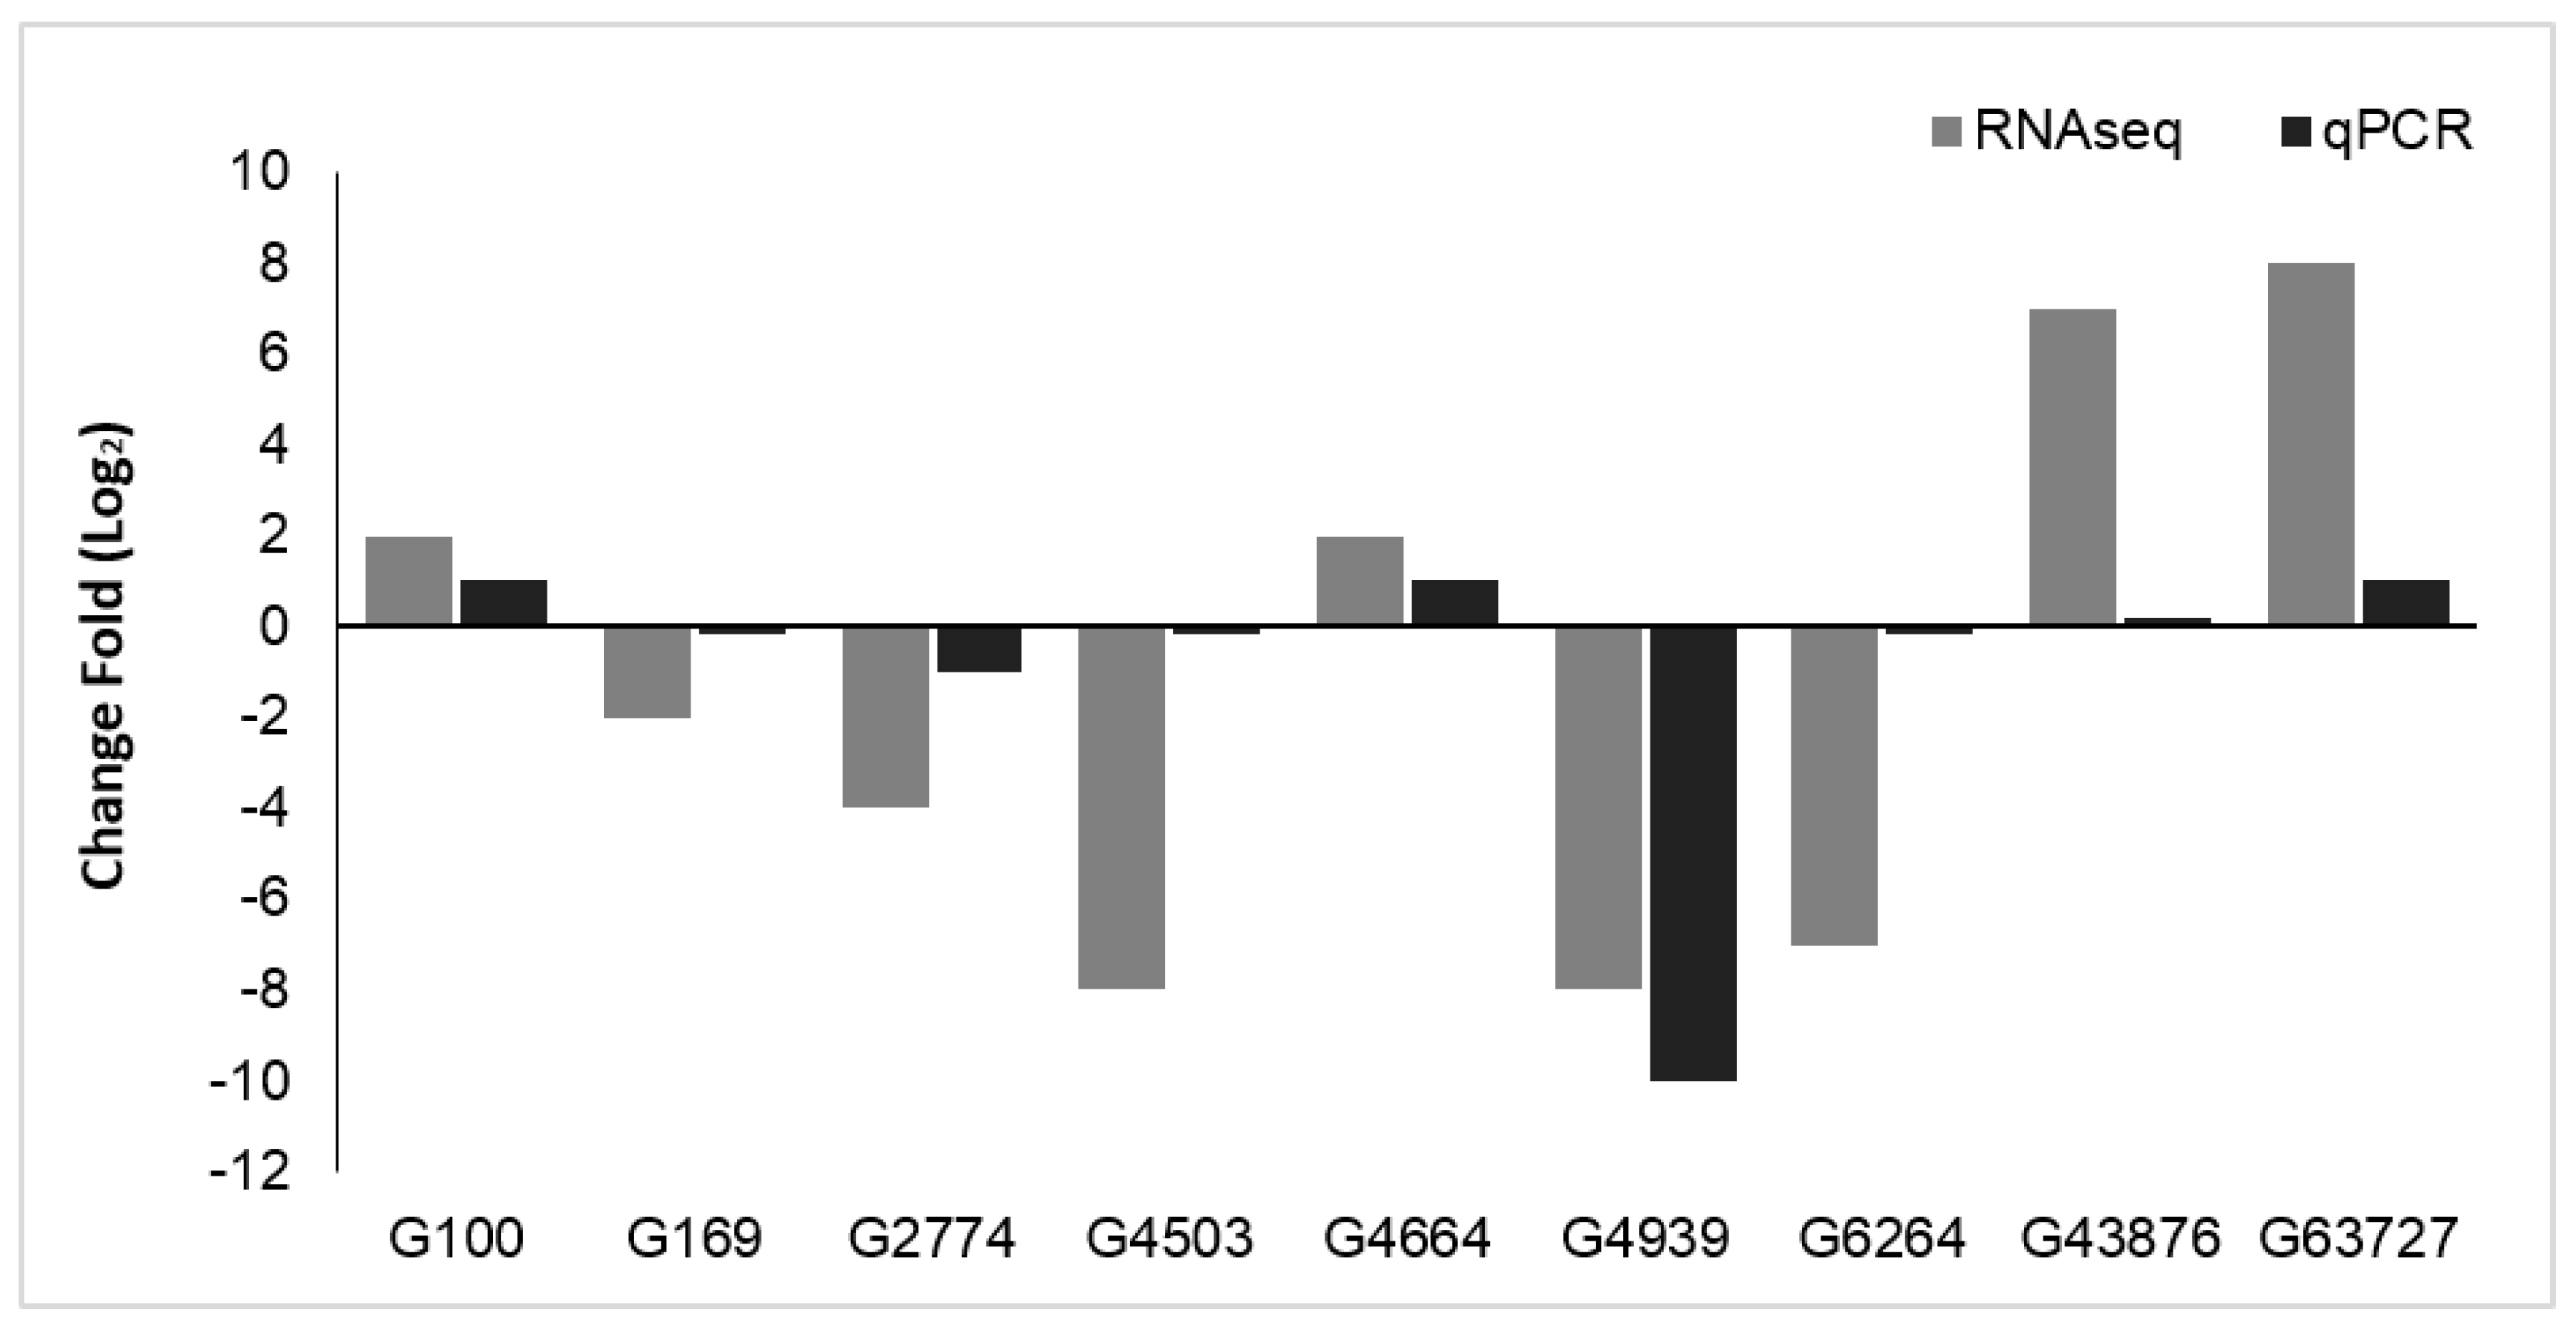
3.4. qPCR Validation

In order to validate the results obtained by the bioinformatics analyses, a total of nine DE genes were randomly selected to assess their expression by qPCR. The qPCR assay for the selected transcripts shows an expression pattern similar to the one obtained by the bioinformatics analyses. For several of the genes tested, the change fold value is higher in the RNA-seq data when compared to the qPCR results (Figure 9), which may be explained by the amplification step required for sequencing of the transcriptome as well as some degradation of the stored RNA.

4. Discussion

Cork oak is an important natural resource with economic and ecological impact in the Mediterranean area. This work adds relevant information to be used in cork oak biology, with the potential to enable genetics and genomics approaches targeting a deeper molecular knowledge of genes intervening in processes dealing with the ecosystem responses to external factors, which can affect bud sprouting.
In previous studies, several stages of bud sprouting development—such as bud burst, bud endodormancy, bud ecodormancy, and bud dormancy—were examined in other Quercus species [8,9,27] using approaches based on suppression subtract hybridization (SSH), microarrays, and ESTs. These studies identified some candidate genes involved in the regulation of bud sprouting, but the molecular mechanisms associated with bud sprouting development in cork oak remain uncharacterized.
In order to tackle this limitation, we performed a transcriptome characterization analysis in four stages, grouped as an early stage (dormant bud and bud swollen stages) and a later stage (red bud and open bud stages), after which a group of candidate genes was identified. Evidence for a differential expression pattern of genes involved in key mechanisms of cork oak bud sprouting was detected, even though the risk of false-positive results was increased by the fact that biological replicates were not available.
In order to characterize the transcriptome involved in bud sprouting development, a classification by KEGG Orthology (KO) of the most representative KEGG pathways (Figure 3) associated with the assembled transcripts was performed. The KOs identified included nucleotide metabolism, amino acid metabolism, carbohydrate metabolism, energy metabolism, and lipid metabolism. The results indicated that the transcriptome of bud sprouting development is mostly focused on the production of essential precursors and metabolites for the synthesis of macromolecules, such as polysaccharides, which represents most of the cell-wall biomass and energy production. Thus, at the initial stages, a significant effort is made to supply the plant with the means required for growth, including the considerable amount of energy needed.

4.1. A High Input of Energy Is Required during Bud Sprouting in Cork Oak

In plants, the presence of the cyclic flux of the tricarboxylic acid (TCA) cycle is not necessary if the ATP demand is low or other sources of ATP are available, such as through photosynthesis [28]. In the cork oak bud sprouting transcriptome, the cyclic flux of the TCA cycle is active since all of the enzymes involved in this cyclic flux are expressed, indicating that a high energy production is required in the development of bud sprouting.
The succinate dehydrogenase enzyme (EC 1.3.5.1), also known as complex II, plays an important role linking the TCA cycle and the electron transport system (ETS) by catalyzing the oxidation of succinate to fumarate and the reduction of ubiquinone to ubiquinol. Both the TCA cycle and ETS are involved in the production of energy for the cell via the aerobic respiratory chain [29]. In the earlier stages of development, a high consumption of energy is expected and required for growth [30]. Hence, the over-expression pattern found for this gene in the early stages is in accordance with the metabolic state and needs of the plant during the initial phases of bud burst.
Moreover, a basic blue copper family protein, belonging to the cupredoxins family, was more significantly expressed in the later stages. It is well known that cupredoxins serve as mobile electron carriers in a variety of charge transport systems [31]. This suggests that, besides linking the TCA cycle to ETS via succinate dehydrogenase in the early stages, the ETS is fully functional due to the expression of the blue copper family protein in the later stages of development.
The main role of Acetyl-CoA is to deliver the acetyl group to the TCA cycle for energy production. However, it is also used by the Acetyl-CoA carboxylase enzyme to produce malonyl-CoA. It has been generally accepted that this enzyme, expressed in the transcriptome analyzed in this study, is almost exclusively responsible for the production of malonyl-CoA. This molecule is the precursor for the formation of flavonoids, interacting with Coumoraloyl-CoA, a product of the phenylpropanoid pathway [32]. Essential enzymes required for the transformation of phenylalanine into coumoroyl-CoA are expressed in the cork oak bud sprouting transcriptome, including phenylanine ammonia lyase (EC 4.3.1.24), cinnamate 4-hydroxylase (EC 1.14.13.11), and 4-Coumarate-CoA ligase (EC 6.2.1.12), as well as several other important enzymes for flavonoid biosynthesis, such as chalcone synthase (EC 2.3.1.74), chalcone isomerase (EC 5.5.1.6), and flavanone 3-hydrolase (EC 1.14.11.9), all of which are involved in the early steps of this pathway.
Flavonoids are secondary metabolites associated with several biological functions in plants, including the signaling of plant growth and development [33] as well as the capacity to regulate the activity of proteins responsible for cell growth. The interaction of flavonoids with auxins has been established for some time, where flavonoids control the distribution of auxins influencing developmental processes [32,34,35,36,37].
Large amounts of nitrogen are required for the synthesis of nucleic acids and proteins, thus making nitrogen a limiting resource for plant growth. Arginine amino acid chemical properties make it especially suitable to store nitrogen. Several enzymes involved in the arginine biosynthesis were expressed in the present study transcriptome. El Zein and colleagues (2011), in a sessile oak study, observed that, during leaf growth, most of the nitrogen used was provided from the stored nitrogen. Therefore, during bud sprouting development, the plant seems to be storing nitrogen via arginine synthesis, in order to use it when the leaf starts to grow [38].
The role played by the translation elongation factor 1α gene in protein and actin cytoskeleton synthesis, and possibly also in plant development, has been demonstrated in a number of eukaryotes [39,40]. A previous study in tobacco plants showed that its expression was higher in younger, developing tissues than in older or more mature tissues [41]. Moreover, the same gene was also highlighted as a candidate gene for proteomic analysis of shoot apical meristem transition from dormancy to activation in Cunninghamia lanceolata (Lamb.) Hook [42]. In that study, the comparison of the reactivating and active stages with the dormant stage of shoot apical meristem demonstrated that higher levels of proteins involved in translation were present, results that provide further support for the involvement of the translation elongation factor 1α gene in the processes associated with bud burst and sprouting. Additionally, in this work, this gene was over-expressed in the early stages, results that are consistent with the ones determined in those studies.

4.2. Cork Oak Bud Burst and Development Is under Tight Hormonal Regulation

Plant growth regulators can be divided into five main groups: auxins, cytokinins, gibberellins (GAs), ethylene, and abscisic acid (ABA). Auxins, cytokinins, and GAs are the ones that largely affect plant growth [43]. Several genes codifying these hormones were expressed in the transcriptome analysis. Auxins usually act together with, or in opposition to, other plant hormones, such as GAs and cytokinins. The interaction between these three hormones plays a crucial role in the regulation of bud dormancy and bud burst in many plant species [44,45].
In our work, two superfamilies of auxins were present in the transcriptome, including auxin-binding protein (ABP) 19 and ABP20. An analysis of the ABP19 and ABP20 expression pattern in the two stages of bud sprouting suggests that ABP19 is more important in the early stage, whereas ABP20’s influence is larger in the later stage. In a previous work [46], ABP20 displayed high expression levels in buds, contrasting with the extremely low expression of ABP19, which provided evidence towards the involvement of ABP20 in the differentiation and development of both floral and vegetative buds. The identification of high expression genes codifying ABP20 in the later stage, despite the absence of statistical significance for differential expression, suggests that ABP20 plays a role in cork oak bud development.
Strigolactone, which is a carotenoid derivate hormone, displayed a pattern of higher expression in the early stages. This hormone regulates bud growth as it has more influence on the inhibition of axillary bud growth [47]. One relevant protein in strigolactone signaling is MAX2/RMS4 [48], which was codified by genes in the transcriptome. This protein is an F-box protein and regulates multiple targets at different stages of development in order to optimize plant growth and development [49]. The presence in the cork oak bud transcriptome of genes codifying enzymes involved in the ubiquitin-proteasome system, such as ubiquitin E3-ligase, expressed in the early stages of bud sprouting, could be linked with the involvement of MAX2 in strigolactone or ABA signaling, since the number of E3 ligases involved is more than any other hormone [50]. In the early stages, genes codifying indole-3-acetic acid (IAA), which, together with ubiquitin E3-ligase, plays a crucial role in auxin signaling [51], were also identified. Considering that auxins are capable of regulating the activity of strigolactones, which can inhibit bud growth, and that cytokinins can stimulate bud growth [52], it is essential to identify the intermediate steps to understand the mechanism of this antagonistic control.
The expression of the gibberellin 3-beta-dioxygenase 4 enzyme in the cork oak bud sprouting transcriptome, which produces GA1 or GA4 bioactive GAs, indicates that gibberellin synthesis is active during bud sprouting. In fact, it is well known that GAs influence varied development processes, such as stem elongation, germination, and dormancy. After dormancy release, the number of GAs increases when the sprouting stage begins. The chitin-inducible gibberellin-responsive protein (CIGR), codified by several genes expressed in this transcriptome, belongs to the GRAS family, which plays a role in plant growth and development. Specifically, this protein is associated with the regulation of plant height as well as leaf size, the latter of which contains young elongation tissues. The relation of CIGR to the regulation of leaf size may indicate the relevance of this protein in the last stages of the bud sprouting development where the leaf is starting to grow [53].
Cytokinins are fundamental in the regulation of the cell division and elongation processes that occur in buds and are considered to be promoters of sprouting [54]. In fact, their direct interaction with auxins influences bud burst, since sprouting begins when the cytokinin concentrations at the bud are higher than auxins. Additionally, there is evidence that these hormones can also be involved in tuber dormancy release [45].
ABA hormones are also related to plant growth. The expression of ABA-insensitive (ABIB) genes in the studied transcriptome is consistent with the association of ABA with bud dormancy, dormancy release, bud set, and bud break. For instance, in Populus, the ABIB1 gene was associated with bud set and bud break [7]. Moreover, there is evidence that ABA hormones regulate the synthesis of flavonoids, which, as mentioned, are also involved in plant growth and development [55].
The light-harvesting complex a/b binding protein (LHCB) is one of the most abundant membrane proteins in nature. This protein plays a fundamental role in plant adaptation to environmental stresses, protection against light stress, and control of chloroplast functions. In this study, the chlorophyll a/b binding protein was over-expressed in the early stages. The expression of the LHCB genes is regulated by multiple factors, such as the light, oxidative stress, and ABA. The expression of chlorophyll a/b binding protein can be associated with the maturation of chloroplasts, since the levels of LHCB were reported to generally increase during cold stress [56], which is a concomitant abiotic stress factor to which Mediterranean Quercus suber buds are exposed.

4.3. Genes Related to Water Status Play a Key Role in Cork Oak Bud Sprouting

The growth rate of a cell depends on the amount of water uptake and the capacity of the cell wall to extend. Extensive water requirements are needed for flushing and shoot elongation because the rehydration of meristems, cell expansion, and metabolic pathway recovery are indispensable for plant growth. Consequently, genes related to water stress, such as aquaporins (AQPs) and dehydrins (DHNs), have a fundamental role in the regulation of bud burst timing processes.
The transport of water across the membrane is a key factor for expansion growth. AQPs function as membrane channels that selectively transport water at the cellular level. They can be divided into two main groups or subfamilies, which include the plasma membrane intrinsic proteins (PIPs) and the tonoplast intrinsic proteins (TIPs) [57,58]. A relation between the PIPs and TIPs expression and cell expansion has been observed in several plant tissues [59,60]. However, the functional relation between water transport at the whole plant level and PIPs/TIPs expression still remains unclear, despite some studies demonstrating the role of various AQPs in root water transport [61,62]. Additionally, abiotic stresses, such as cold temperatures, induce changes in AQPs expression, mainly in PIPs and TIPs [63,64].
The accumulation of DHNs occurs in response to drought stress and low temperatures in plant tissues, therefore playing an important role in the winter dormancy, providing protection, as well as freezing tolerance and cold acclimation.
Thus, considering that the early stages of bud burst coincide with the period of the year when the coldest temperatures are observed, it is likely that both AQPs (such as TIP2,2, which was found only expressed in the early stages of bud sprouting) and DHNs would be crucial for survival of the buds in the initial stages of their development.

4.4. An Alternative Pathway for the Synthesis of Polysaccharides

In plants, UDP-Glucoronic Acid (GlcA) acts as an important precursor in the synthesis of many different polysaccharides, such as xylose, arabinose, and GalA, for cell-wall biomass [65]. UDP-GlcA is synthesized via two independent routes, which include the myo-inositol oxidation pathway (MIOP) and the nucleotide sugar oxidation pathway. Karkonen and colleagues [66] suggested that the predominant route can differ among species, tissues, and different development stages. It has been demonstrated that the MIOP is present in a variety of plant tissues since this pathway was first proposed about 40 years ago [67]. The MIOP is initialized by the catalyzation of the thermodynamically irreversible oxygenative cleavage of myo-inositol to GlcA by the myo-inositol oxynase (EC 1.13.99.1). The gene coding for this enzyme was found expressed in the transcriptome analyzed, providing support for the activation of this alternative pathway for the synthesis of polysaccharides. Moreover, in this work, this enzyme was over-expressed in the early stage, suggesting that MIOP activates in the earlier stages of development, which is in accordance with the findings of previous studies [68]. The production of UDP-GlcA is also required to generate a number of other sugars, which represent a large amount of cell-wall biomass.

4.5. Stress Response and Development Related Proteins Are Expressed in the Cork Oak Bud Transcriptome

Some genes involved in the response to biotic and abiotic stresses were differentially expressed in this work, such as the polyubiquitin and agglutinin genes. The former plays a relevant role in wound response, while the latter is responsible for the immobilization of non-pathogenic organisms. The polyubiquitin genes belong to the ubiquitin gene family and are also present in a wide variety of plants. The ubiquitin pathway is involved in the senescence and stress responses in plants, playing a relevant role in the modification of protein behavior during wound response. This gene is involved in protein degradation, in the chromatin structure, ribosome biogenesis, and cellular receptor proteins [69,70]. The agglutinin is considered a glycoprotein and is involved in the immobilization of non-pathogenic bacteria in the different plant tissues [71]. It was previously identified in a white oak study [53], where two stages of bud dormancy were compared. Since, in this work, the dormant bud is represented in the early stages, the over-expression of the gene codifying this protein is consistent with the results determined previously.
The protein kinases and phosphatases are involved in the signaling pathways, playing fundamental roles in stress signal transduction [72]. The serine/threonine protein kinase was over-expressed in the later stages of bud sprouting. This protein receives the information from the receptors that sense the changes of the environmental conditions and convert it into a response, altering the metabolism or the cell growth and division [70].
During plant growth and development, increased levels of protein synthesis are indispensable and the synthesis of new ribosomes is crucial to growth. In this work, different ribosomal proteins were over-expressed in the two stages of bud sprouting [73]. Similar to ribosomal proteins, histones were also over-expressed in the two stages. Both ribosomal proteins and histones were expressed in vegetative and reproductive meristems, those being the two types of proteins that are more associated with plant growth than they are with plant dormancy [74].

4.6. Common Sets of Genes Used by Different Species in the Regulation of Bud Burst and Development

An additional analysis of the genes expressed in the cork oak transcriptome studied in this work revealed the presence of genes that were previously associated with bud burst, bud dormancy, bud sprouting, and flower development in other species, such as the sessile oak (Quercus petraea) [8,9,75,76,77]. In the two studies involving the Quercus species, the set of genes for which differential expression was found encompassed genes that were also expressed in our study. These included genes such as galactinol-synthase (important for tolerance to drought, high salinity, and cold stress), SKP1 (which is described as a regulator of seed germination, dormancy or bud burst) and LEA (whose protein products act as protection from desiccation and temperature stress) in Quercus petraea [8], as well as several genes associated with ribosome biogenesis (60S ribosomal protein L14, ribosomal protein S24e, and 60S ribosomal protein L12), response to water deprivation (Bax inhibitor 1 and CBL interacting protein kinase 6) and response to auxin (auxin influx transporter) in Quercus robur [9].
Moreover, genes involved in the regulation of bud sprouting and flower development in Arabidopsis thaliana, such as FRIGIDA, SOC1, and SVP [75,76], as well as genes implicated in the transition from endodormancy to ecodormancy of leaf buds in Pyrus pyrifolia such as expansin, cellulose synthase, polygalacturonase, arabinogalactan (all of them related with the plant cell wall) and germin-like protein [77], were also expressed in the cork oak transcriptome analyzed in this study. These results highlight a set of genes whose expression during bud development and sprouting is common in different species of the Quercus genus, and likewise in Arabidopsis thaliana and Pyrus pyrifolia, despite the pattern of differential expression not being detected in this work, which could be due to biological and/or technical limitations.

5. Conclusions

In this study, a set of candidate genes for bud development in Quercus suber was identified, revealing for the first time some of the mechanisms involved in the genetic regulation of cork oak’s phenological events. The vast amount of GO terms and pathways related to bud sprouting confirms that this is a complex genetic and molecular development process. The KOs identified indicate that the transcriptome of bud sprouting development is mostly focused on the production of essential precursors and metabolites for the synthesis of macromolecules as well as energy production and where water transport seems to play an important role. The data presented here substantially increase our understanding of the complex global cellular mechanisms of bud sprouting in the particular cork producing oak Quercus suber. Indeed, these results might be useful in molecular-assisted selection, when the selection aims for pest, frost, or drought tolerance, or to avoid scenarios of an advancing spring phenology that may render young plants vulnerable to late spring frost damages in a climate change scenario.

Supplementary Materials

The following are available online at www.mdpi.com/1999-4907/8/12/486/s1, Table S1: Sequences of the primers used in the qPCR validation assays.

Acknowledgments

This project was funded by “Fundação para a Ciência e a Tecnologia” (FCT) through the projects SOBREIRO/0039/2009: “Consórcio de ESTs de sobreiro-abrolhamento e desenvolvimento foliar” and UID/AGR/00115/2013. Financial support for A. Usié, P. Barbosa, B. Meireles and A.M. Ramos was provided by Investigador FCT project IF/00574/2012/CP1209/CT0001: “Genetic characterization of national animal and plant resources using next-generation sequencing”.

Author Contributions

José Matos and Fernanda Simões conceived and designed the study. Fernanda Simões, André Folgado and Sónia Gonçalves performed the laboratorial experiments. Ana Usié performed bioinformatics analyses of the data. Ana Usié, Brígida Meireles, Pedro Barbosa, and Inês Chaves contributed in the bioinformatics analyses. A. M. Ramos coordinated the bioinformatics analyses. José Matos, Fernanda Simões, Ana Usié, Brígida Meireles, Maria H. Almeida, and A. M. Ramos interpreted the results. Ana Usié and A. M. Ramos wrote the manuscript. Brígida Meireles, Fernanda Simões, Sónia Gonçalves, and Maria H. Almeida revised the manuscript. All authors have read and approved this version of the manuscript.

Conflicts of Interest

The authors declare no conflict of interest.

References

  1. Berrahmouni, N.; Regato, P.; Stein, C. Beyond Cork—A Wealth of Resources for People and Nature, Lessons from the Mediterranean; WWF Mediterranean: Rome, Italy, 2007; Volume 118. [Google Scholar]
  2. Chuine, I.; Beaubien, E.G. Phenology is a major determinant of tree species range. Ecol. Lett. 2001, 4, 500–510. [Google Scholar] [CrossRef]
  3. Pereira, H. Cork: Biology, Production and Uses; Elsevier: Amsterdam, The Netherlands, 2007; ISBN 9780444529671. [Google Scholar]
  4. Chaves, I.; Passarinho, J.A.P.; Capitão, C.; Chaves, M.M.; Fevereiro, P.; Ricardo, C.P.P. Temperature stress effects in Quercus suber leaf metabolism. J. Plant Physiol. 2011, 168, 1729–1734. [Google Scholar] [CrossRef] [PubMed]
  5. Scotti-Saintagne, C.; Bodénès, C.; Barreneche, T.; Bertocchi, E.; Plomion, C.; Kremer, A. Detection of quantitative trait loci controlling bud burst and height growth in Quercus robur L. Theor. Appl. Genet. 2004, 109, 1648–1659. [Google Scholar] [CrossRef] [PubMed]
  6. Saintagne, C.; Bodénès, C.; Barreneche, T.; Pot, D.; Plomion, C.; Kremer, A. Distribution of genomic regions differentiating oak species assessed by QTL detection. Heredity 2004, 92, 20–30. [Google Scholar] [CrossRef] [PubMed]
  7. Chen, T.H.H.; Howe, G.T.; Bradshaw, H.D., Jr. Molecular genetic analysis of dormancy-related traits in poplars. Weed Sci. 2002, 50, 232–240. [Google Scholar] [CrossRef]
  8. Derory, J.; Léger, P.; Garcia, V.; Schaeffer, J.; Hauser, M.-T.; Salin, F.; Luschnig, C.; Plomion, C.; Glössl, J.; Kremer, A. Transcriptome analysis of bud burst in sessile oak (Quercus petraea). New Phytol. 2006, 170, 723–738. [Google Scholar] [CrossRef] [PubMed]
  9. Lesur, I.; Le Provost, G.; Bento, P.; Da Silva, C.; Leplé, J.-C.; Murat, F.; Ueno, S.; Bartholomé, J.; Lalanne, C.; Ehrenmann, F.; et al. The oak gene expression atlas: Insights into Fagaceae genome evolution and the discovery of genes regulated during bud dormancy release. BMC Genom. 2015, 16, 112. [Google Scholar] [CrossRef] [PubMed]
  10. Teixeira, R.T.; Fortes, A.M.; Pinheiro, C.; Pereira, H. Comparison of good- and bad-quality cork: Application of high-throughput sequencing of phellogenic tissue. J. Exp. Bot. 2014, 65, 4887–4905. [Google Scholar] [CrossRef] [PubMed]
  11. Pereira-Leal, J.B.; Abreu, I.A.; Alabaça, C.S.; Almeida, M.H.; Almeida, P.; Almeida, T.; Amorim, M.I.; Araújo, S.; Azevedo, H.; Badia, A.; et al. A comprehensive assessment of the transcriptome of cork oak (Quercus suber) through EST sequencing. BMC Genom. 2014, 15, 371. [Google Scholar] [CrossRef] [PubMed]
  12. Miguel, A.; de Vega-Bartol, J.; Marum, L.; Chaves, I.; Santo, T.; Leitão, J.; Varela, M.C.; Miguel, C.M. Characterization of the cork oak transcriptome dynamics during acorn development. BMC Plant Biol. 2015, 15, 158. [Google Scholar] [CrossRef] [PubMed]
  13. Schloss, P.D.; Westcott, S.L.; Ryabin, T.; Hall, J.R.; Hartmann, M.; Hollister, E.B.; Lesniewski, R.A.; Oakley, B.B.; Parks, D.H.; Robinson, C.J.; et al. Introducing mothur: Open-source, platform-independent, community-supported software for describing and comparing microbial communities. Appl. Environ. Microbiol. 2009, 75, 7537–7541. [Google Scholar] [CrossRef] [PubMed]
  14. Chevreux, B.; Pfisterer, T.; Drescher, B.; Driesel, A.J.; Müller, W.E.G.; Wetter, T.; Suhai, S. Using the miraEST assembler for reliable and automated mRNA transcript assembly and SNP detection in sequenced ESTs. Genome Res. 2004, 14, 1147–1159. [Google Scholar] [CrossRef] [PubMed]
  15. Li, H.; Durbin, R. Fast and accurate short read alignment with Burrows-Wheeler transform. Bioinformatics 2009, 25, 1754–1760. [Google Scholar] [CrossRef] [PubMed]
  16. Li, H.; Handsaker, B.; Wysoker, A.; Fennell, T.; Ruan, J.; Homer, N.; Marth, G.; Abecasis, G.; Durbin, R. The Sequence Alignment/Map format and SAMtools. Bioinformatics 2009, 25, 2078–2079. [Google Scholar] [CrossRef] [PubMed]
  17. Haas, B.J.; Papanicolaou, A.; Yassour, M.; Grabherr, M.; Blood, P.D.; Bowden, J.; Couger, M.B.; Eccles, D.; Li, B.; Lieber, M.; et al. De novo transcript sequence reconstruction from RNA-seq using the Trinity platform for reference generation and analysis. Nat. Protoc. 2013, 8, 1494–1512. [Google Scholar] [CrossRef] [PubMed]
  18. Liao, Y.; Smyth, G.K.; Shi, W. featureCounts: An efficient general purpose program for assigning sequence reads to genomic features. Bioinformatics 2014, 30, 923–930. [Google Scholar] [CrossRef] [PubMed]
  19. Robinson, M.D.; McCarthy, D.J.; Smyth, G.K. edgeR: A Bioconductor package for differential expression analysis of digital gene expression data. Bioinformatics 2009, 26, 139–140. [Google Scholar] [CrossRef] [PubMed]
  20. Untergasser, A.; Nijveen, H.; Rao, X.; Bisseling, T.; Geurts, R.; Leunissen, J.A.M. Primer3Plus, an enhanced web interface to Primer3. Nucleic Acids Res. 2007, 35, W71–W74. [Google Scholar] [CrossRef] [PubMed]
  21. Pfaffl, M.W. A new mathematical model for relative quantification in real-time RT-PCR. Nucleic Acids Res. 2001, 29, e45. [Google Scholar] [CrossRef] [PubMed]
  22. Marum, L.; Miguel, A.; Ricardo, C.P.; Miguel, C. Reference gene selection for quantitative real-time PCR normalization in Quercus suber. PLoS ONE 2012, 7, e35113. [Google Scholar] [CrossRef]
  23. Altschul, S.F.; Gish, W.; Miller, W.; Myers, E.W.; Lipman, D.J. Basic local alignment search tool. J. Mol. Biol. 1990, 215, 403–410. [Google Scholar] [CrossRef]
  24. Zdobnov, E.M.; Apweiler, R. InterProScan—An integration platform for the signature-recognition methods in InterPro. Bioinformatics 2001, 17, 847–848. [Google Scholar] [CrossRef] [PubMed]
  25. Hu, Z.-L.; Bao, J.; Reecy, J. CateGOrizer: A web-based program to batch analyze gene ontology classification categories. Online J. Bioinform. 2008, 9, 108–112. [Google Scholar]
  26. Shannon, P.; Markiel, A.; Ozier, O.; Baliga, N.S.; Wang, J.T.; Ramage, D.; Amin, N.; Schwikowski, B.; Ideker, T. Cytoscape: A software Environment for integrated models of biomolecular interaction networks. Genome Res. 2003, 13, 2498–2504. [Google Scholar] [CrossRef] [PubMed]
  27. Derory, J.; Scotti-Saintagne, C.; Bertocchi, E.; Le Dantec, L.; Graignic, N.; Jauffres, A.; Casasoli, M.; Chancerel, E.; Bodénès, C.; Alberto, F.; et al. Contrasting relationships between the diversity of candidate genes and variation of bud burst in natural and segregating populations of European oaks. Heredity 2010, 104, 438–448. [Google Scholar] [CrossRef] [PubMed]
  28. Sweetlove, L.J.; Beard, K.F.M.; Nunes-Nesi, A.; Fernie, A.R.; Ratcliffe, R.G. Not just a circle: Flux modes in the plant TCA cycle. Trends Plant Sci. 2010, 15, 462–470. [Google Scholar] [CrossRef] [PubMed]
  29. Pieczenik, S.R.; Neustadt, J. Mitochondrial dysfunction and molecular pathways of disease. Exp. Mol. Pathol. 2007, 83, 84–92. [Google Scholar] [CrossRef] [PubMed]
  30. Jardim-Messeder, D.; Caverzan, A.; Rauber, R.; de Souza Ferreira, E.; Margis-Pinheiro, M.; Galina, A. Succinate dehydrogenase (mitochondrial complex II) is a source of reactive oxygen species in plants and regulates development and stress responses. New Phytol. 2015, 208, 776–789. [Google Scholar] [CrossRef] [PubMed]
  31. Nersissian, A.M.; Immoos, C.; Hill, M.G.; Hart, P.J.; Williams, G.; Herrmann, R.G.; Selverstone Valentine, J. Uclacyanins, stellacyanins, and plantacyanins are distinct subfamilies of phytocyanins: Plant-specific mononuclear blue copper proteins. Protein Sci. 1998, 7, 71915–71929. [Google Scholar] [CrossRef] [PubMed]
  32. Peer, W.A.; Brown, D.E.; Tague, B.W.; Muday, G.K.; Taiz, L.; Murphy, A.S. Flavonoid accumulation patterns of transparent testa mutants of arabidopsis. Plant Physiol. 2001, 126, 536–548. [Google Scholar] [CrossRef] [PubMed]
  33. Broun, P. Transcriptional control of flavonoid biosynthesis: A complex network of conserved regulators involved in multiple aspects of differentiation in Arabidopsis. Curr. Opin. Plant Biol. 2005, 8, 272–279. [Google Scholar] [CrossRef] [PubMed]
  34. Jacobs, M.; Rubery, P.H. Naturally occurring auxin transport regulators. Science 1988, 241, 346–349. [Google Scholar] [CrossRef] [PubMed]
  35. Bernasconi, P. Effect of synthetic and natural protein tyrosine kinase inhibitors on auxin efflux in zucchini (Cucurbita pepo) hypocotyls. Physiol. Plant. 1996, 96, 205–210. [Google Scholar] [CrossRef]
  36. Murphy, A.; Peer, W.A.; Taiz, L. Regulation of auxin transport by aminopeptidases and endogenous flavonoids. Planta 2000, 211, 315–324. [Google Scholar] [CrossRef] [PubMed]
  37. Brown, D.E.; Rashotte, A.M.; Murphy, A.S.; Normanly, J.; Tague, B.W.; Peer, W.A.; Taiz, L.; Muday, G.K. Flavonoids act as negative regulators of auxin transport in vivo in Arabidopsis. Plant Physiol. 2001, 126, 524–535. [Google Scholar] [CrossRef] [PubMed]
  38. El Zein, R.; Breda, N.; Gerant, D.; Zeller, B.; Maillard, P. Nitrogen sources for current-year shoot growth in 50-year-old sessile oak trees: An in situ 15N labeling approach. Tree Physiol. 2011, 31, 1390–1400. [Google Scholar] [CrossRef] [PubMed]
  39. Linz, J.E.; Sypherd, P.S. Expression of three genes for elongation factor 1 alpha during morphogenesis of Mucor racemosus. Mol. Cell. Biol. 1987, 7, 1925–1932. [Google Scholar] [CrossRef] [PubMed]
  40. Hovemann, B.; Richter, S.; Walldorf, U.; Cziepluch, C. Two genes encode related cytoplasmic elongation factors 1 alpha (EF-1 alpha) in Drosophila melanogaster with continuous and stage specific expression. Nucleic Acids Res. 1988, 16, 3175–3194. [Google Scholar] [CrossRef] [PubMed]
  41. Ursin, V.M.; Irvine, J.M.; Hiatt, W.R.; Shewmaker, C.K. Developmental analysis of elongation factor-1 alpha expression in transgenic tobacco. Plant Cell 1991, 3, 583–591. [Google Scholar] [CrossRef] [PubMed]
  42. Xu, H.; Cao, D.; Chen, Y.; Wei, D.; Wang, Y.; Stevenson, R.A.; Zhu, Y.; Lin, J. Gene expression and proteomic analysis of shoot apical meristem transition from dormancy to activation in Cunninghamia lanceolata (Lamb.) Hook. Sci. Rep. 2016, 6, 19938. [Google Scholar] [CrossRef] [PubMed]
  43. Davies, P.J. The plant hormones: Their nature, occurrence, and functions. In Plant Hormones; Springer: Dordrecht, The Netherlands, 2010; pp. 1–15. [Google Scholar]
  44. O’Neill, D.P.; Davidson, S.E.; Clarke, V.C.; Yamauchi, Y.; Yamaguchi, S.; Kamiya, Y.; Reid, J.B.; Ross, J.J. Regulation of the gibberellin pathway by auxin and DELLA proteins. Planta 2010, 232, 1141–1149. [Google Scholar] [CrossRef] [PubMed]
  45. Bajji, M.; M’Hamdi, M.; Gastiny, F.; Rojas-Beltran, J.A.; du Jardin, P. Catalase inhibition accelerates dormancy release and sprouting in potato (Solanum tuberosum L.) tubers. Biotechnol. Agron. Soc. Environ. 2007, 11, 121–131. [Google Scholar]
  46. Ohmiya, A. Characterization of ABP19/20, sequence homologues of germin-like protein in Prunus persica L. Plant Sci. 2002, 163, 683–689. [Google Scholar] [CrossRef]
  47. Ongaro, V.; Leyser, O. Hormonal control of shoot branching. J. Exp. Bot. 2008, 59, 67–74. [Google Scholar] [CrossRef] [PubMed]
  48. Santner, A.; Estelle, M. The ubiquitin-proteasome system regulates plant hormone signaling. Plant J. 2010, 61, 1029–1040. [Google Scholar] [CrossRef] [PubMed]
  49. Shen, H.; Luong, P.; Huq, E. The F-Box Protein MAX2 Functions as a positive regulator of photomorphogenesis in Arabidopsis. Plant Physiol. 2007, 145, 1471–1483. [Google Scholar] [CrossRef] [PubMed]
  50. Kelley, D.; Estelle, M. Ubiquitin-mediated control of plant hormone signaling. Plant Physiol. 2012, 160, 47–55. [Google Scholar] [CrossRef] [PubMed]
  51. Mayzlish-Gati, E.; LekKala, S.; Resnick, N.; Wininger, S.; Bhattacharya, C.; Lemcoff, J.H.; Kapulnik, Y.; Koltai, H. Strigolactones are positive regulators of light-harvesting genes in tomato. J. Exp. Bot. 2010, 61, 3129–3136. [Google Scholar] [CrossRef] [PubMed]
  52. Brewera, P.B.; Koltaib, H.; Beveridge, C.A. Diverse roles of strigolactones in plant development. Mol. Plant 2013, 6, 18–28. [Google Scholar] [CrossRef] [PubMed]
  53. Ueno, S.; Klopp, C.; Leplé, J.C.; Derory, J.; Noirot, C.; Léger, V.; Prince, E.; Kremer, A.; Plomion, C.; Le Provost, G. Transcriptional profiling of bud dormancy induction and release in oak by next-generation sequencing. BMC Genom. 2013, 14, 236. [Google Scholar] [CrossRef] [PubMed]
  54. Meier, A.R.; Saunders, M.R.; Michler, C.H. Epicormic buds in trees: A review of bud establishment, development and dormancy release. Tree Physiol. 2012, 32, 565–584. [Google Scholar] [CrossRef] [PubMed]
  55. Zheng, C.; Halaly, T.; Acheampong, A.K.; Takebayashi, Y.; Jikumaru, Y.; Kamiya, Y.; Or, E. Abscisic acid (ABA) regulates grape bud dormancy, and dormancy release stimuli may act through modification of ABA metabolism. J. Exp. Bot. 2015, 66, 1527–1542. [Google Scholar] [CrossRef] [PubMed]
  56. Dhanaraj, A.L.; Slovin, J.P.; Rowland, L.J. Analysis of gene expression associated with cold acclimation in blueberry floral buds using expressed sequence tags. Plant Sci. 2004, 166, 863–872. [Google Scholar] [CrossRef]
  57. Kaldenhoff, R.; Fischer, M. Functional aquaporin diversity in plants. Biochim. Biophys. Acta Biomembr. 2006, 1758, 1134–1141. [Google Scholar] [CrossRef] [PubMed]
  58. Maurel, C.; Verdoucq, L.; Luu, D.-T.; Santoni, V. Plant Aquaporins: Membrane channels with multiple integrated functions. Annu. Rev. Plant Biol. 2008, 59, 595–624. [Google Scholar] [CrossRef] [PubMed]
  59. Ludevid, D.; Hofte, H.; Himelblau, E.; Chrispeels, M.J. The expression pattern of the tonoplast intrinsic protein gamma-tip in Arabidopsis-Thaliana is correlated with cell enlargement. Plant Physiol. 1992, 100, 1633–1639. [Google Scholar] [CrossRef] [PubMed]
  60. Phillips, A.L.; Huttly, A.K. Cloning of two gibberellin-regulated cDNAs from Arabidopsis thaliana by subtractive hybridization: Expression of the tonoplast water channel,  γ-TIP, is increased by GA3. Plant Mol. Biol. 1994, 24, 603–615. [Google Scholar] [CrossRef] [PubMed]
  61. Chaumont, F.; Moshelion, M.; Daniels, M.J. Regulation of plant aquaporin activity. Biol. Cell 2005, 97, 749–764. [Google Scholar] [CrossRef] [PubMed]
  62. Chen, G.P.; Wilson, I.D.; Kim, S.H.; Grierson, D. Inhibiting expression of a tomato ripening-associated membrane protein increases organic acids and reduces sugar levels of fruit. Planta 2001, 212, 799–807. [Google Scholar] [CrossRef] [PubMed]
  63. Afzal, Z.; Howton, T.; Sun, Y.; Mukhtar, M. The roles of aquaporins in plant stress responses. J. Dev. Biol. 2016, 4, 9. [Google Scholar] [CrossRef]
  64. Ahamed, A.; Murai-Hatano, M.; Ishikawa-Sakurai, J.; Hayashi, H.; Kawamura, Y.; Uemura, M. Cold stress-induced acclimation in rice is mediated by root-specific aquaporins. Plant Cell Physiol. 2012, 53, 1445–1456. [Google Scholar] [CrossRef] [PubMed]
  65. Reiter, W.-D. Biochemical genetics of nucleotide sugar interconversion reactions. Curr. Opin. Plant Biol. 2008, 11, 236–243. [Google Scholar] [CrossRef] [PubMed]
  66. Kärkönen, A. Biosynthesis of UDP-GlcA: Via UDPGDH or the myo-inositol oxidation pathway? Plant Biosyst. Int. J. Deal. Asp. Plant Biol. 2005, 139, 46–49. [Google Scholar] [CrossRef]
  67. Loewus, F.A.; Kelly, S.; Neufeld, E.F. Metabolism of myo-inositol in plants: Conversion to pectin, hemicellulose, d-xylose and sugar acids. Proc. Natl. Acad. Sci. USA 1962, 48, 421–425. [Google Scholar] [CrossRef] [PubMed]
  68. Roberts, R.M.; Loewus, F. The conversion of d-Glucose-6-C to cell wall polysaccharide material in Zea mays in presence of high endogenous levels of myoinositol. Plant Physiol. 1973, 52, 646–650. [Google Scholar] [CrossRef] [PubMed]
  69. Belknap, W.R.; Garbarino, J.E. The role of ubiquitin in plant senescence and stress responses. Trends Plant Sci. 1996, 10, 331–335. [Google Scholar] [CrossRef]
  70. Garbarino, J.E.; Rockhold, D.R.; Belknap, W.R. Expression of stress-responsive ubiquitin genes in potato tubers. Plant Mol. Biol. 1992, 20, 235–244. [Google Scholar] [CrossRef] [PubMed]
  71. Janse, J.D. Chapter: 3 Disease and symptoms caused by plant pathogenic bacteria. In Phytobacteriology: Principles and Practice; Janse, J.D., Ed.; CABI: Wallingford, Oxon, UK; New York, NY, USA, 2005; pp. 91–93. [Google Scholar]
  72. Kulik, A.; Wawer, I.; Krzywińska, E.; Bucholc, M.; Dobrowolska, G. SnRK2 Protein Kinases—Key regulators of plant response to abiotic stresses. OMICS 2011, 15, 859–872. [Google Scholar] [CrossRef] [PubMed]
  73. Stafstrom, J.P. Regulation of growth and dormancy in pea axillary buds. In Dormancy in Plants: From Whole Plant Behaviour to Cellular Control; Viémont, J.D., Crabbé, J., Eds.; CABI: Wallingford, Oxon, UK; New York, NY, USA, 2000; pp. 337–339. [Google Scholar]
  74. Devitt, M.; Stafstrom, J. Cell cycle regulation during growth-dormancy cycles in pea axillary buds. Plant Mol. Biol. 1995, 29, 255–265. [Google Scholar] [CrossRef] [PubMed]
  75. Horvath, D. Common mechanisms regulate flowering and dormancy. Plant Sci. 2009, 177, 523–531. [Google Scholar] [CrossRef]
  76. Kryvych, S.; Nikiforova, V.; Herzog, M.; Perazza, D.; Fisahn, J. Gene expression profiling of the different stages of Arabidopsis thaliana trichome development on the single cell level. Plant Physiol. Biochem. 2008, 46, 160–173. [Google Scholar] [CrossRef] [PubMed]
  77. Nishitani, C.; Saito, T.; Ubi, B.E.; Shimizu, T.; Itai, A.; Saito, T.; Yamamoto, T.; Moriguchi, T. Transcriptome analysis of Pyrus pyrifolia leaf buds during transition from endodormancy to ecodormancy. Sci. Hortic. 2012, 147, 49–55. [Google Scholar] [CrossRef]
Figure 1. Development stages of bud sprouting in Quercus suber. Earlier stages: (1) dormant bud and (2) bud swollen. Later stages: (3) red bud and (4) open bud.
Forests 08 00486 g001
Figure 2. Blast top hits by species. The most representative species with a minimum of 500 hits are represented.
Forests 08 00486 g002
Figure 3. The most representative KEGG pathways associated with all predicted genes. Only pathways with at least eight associated enzymes are represented.
Forests 08 00486 g003
Figure 4. Subcategories of GOs identified by CateGOrizer within the Biological Processes over the whole set of predicted genes.
Forests 08 00486 g004
Figure 5. Subcategories of GOs identified by CateGOrizer within the Molecular Function over the whole set of predicted genes.
Forests 08 00486 g005
Figure 6. Subcategories of GOs identified by CateGOrizer within the Cellular Components over the whole set of predicted genes.
Forests 08 00486 g006
Figure 7. Differentially expressed genes associated with some Molecular Function GO terms identified. Blue nodes represent the MF GO terms while the other nodes represent the associated DE genes. The color of each DE gene node follows an RGB color scale, going from the most down-regulated in red to the most up-regulated in green.
Forests 08 00486 g007
Figure 8. Differentially expressed genes associated with some Cellular Components (CC) GO terms identified. Blue nodes represent the CC GO terms while the other nodes represent the associated DE genes. The color of each DE gene node follows an RGB color scale, going from the most down-regulated in red to the most up-regulated in green.
Forests 08 00486 g008
Figure 9. Change fold for each of the transcripts tested for validation. The values are represented as the Log2 of the normalized expression value of both RNA-seq and qPCR data.
Forests 08 00486 g009
Table 1. Summary statistics of the 454 sequence data preprocessing step.
LibraryRaw ReadsProcessed Reads
Number<AL>Number<AL>
Non-normalized 1566,726574.1452,455519.9
Non-normalized 2513,382577.8404,242522.9
Normalized 1595,388568.4464,611523.8
Normalized 2570,030560.7450,842518.1
Total2,245,526-1,772,150-
<AL>: average length of reads in base pairs.
Table 2. Results obtained for read mapping, with BWA, against the transcriptome assembly.
LibraryReads UsedMapped Reads (%)UMR (%)
Non-normalized 1452,455430,935 (95.2%)197,521 (43.7%)
Non-normalized 2404,242384,352 (95.1%)161,264 (39.9%)
Total856,697815,287 (95.2%)358,785 (41.9%)
Table 3. Subset of differentially expressed genes identified between the earlier and later stages. A gene with a positive logFC (logarithm fold change) value is (more) expressed in the later stages, while a gene with a negative logFC value is (more) expressed in the earlier stages.
AnnotationLogFCp-ValueGene Identifier ID
unnamed protein product8.481.22 × 10 −12296082254
Ribosomal protein S3Ae7.884.37 × 10 −5976900419
putative histone H2B.17.837.13 × 10 −5703085592
PREDICTED: 60S ribosomal protein L8-37.451.67 × 10 −6449434174
basic blue copper family protein7.383.17 × 10 −6224054286
serin/threonine protein kinase7.383.17 × 10 −638343920
hypothetical protein PRUPE_ppa012332mg7.36.03 × 10 −6595797137
PREDICTED: pentatricopeptide repeat-containing protein At1g74750-like7.36.03 × 10 −6470127288
40S ribosomal protein S17C7.132.20 × 10 −5313586437
60S ribosomal L38−7.151.15 × 10 −5728829564
PREDICTED: succinate dehydrogenase−3.343.39 × 10 −5449455896
hypothetical protein EUGRSUZ_G02560 (myo-inositol oxynase)−4.571.55 × 10 −7629099270
Translation elongation factor 1 alpha−5.21.53 × 10 −10110224776
PREDICTED: uncharacterized protein−7.226.03 × 10 −6645275588
PREDICTED: polyubiquitin−7.226.03 × 10 −6743820616
PREDICTED: protein NUCLEAR FUSION DEFECTIVE 2−7.226.03 × 10 −6470125885
aquaporin TIP2;2−7.226.03 × 10 −6383479044
Ribosomal protein L31e family protein−7.484.66 × 10 −7590724775
RecName: Full = Agglutinin; AltName: Full = CCA−7.77.00 × 10 −848428322
PREDICTED: histone H2AX-like−7.943.11 × 10 −9658055874
agglutinin isoform−8.12.68 × 10 −1085376265
chlorophyll a/b-binding protein−8.849.97 × 10 −152804572

