Effects of Climate Change on the Climatic Niches of Warm-Adapted Evergreen Plants: Expansion or Contraction?

1
Korea Environment Institute, #830, Bldg B, 370 Sicheong-daero, Sejong-si 30147, Korea
2
Environmental Science and Ecological Engineering Department, Korea University, 145 Anam-ro, Seongbuk-gu, Seoul 02841, Korea
3
National Institute of Ecology, 1210 Geumgang-ro, Maseo-myeon, Seocheon-gun, Chungnam 33657, Korea
*
Author to whom correspondence should be addressed.
Forests 2017, 8(12), 500; https://doi.org/10.3390/f8120500
Submission received: 3 September 2017
/
Revised: 21 November 2017
/
Accepted: 27 November 2017
/
Published: 13 December 2017
(This article belongs to the Section Forest Ecology and Management)
Abstract
:Climate change has modified the structure and functions of ecosystems, affecting human well-being. Evergreen plants in the warm-temperate ecosystems will lose climatically suitable habitats under climate change but have not drawn much scholarly interest. Therefore, the present research aimed to predict the future climatic niches of eight coastal warm-adapted evergreen trees under climate change to provide information for an effective management practice. For this purpose, we used the ensemble species distribution models (SDMs) weighted by the TSS value in modelling the climatic niches of those evergreen trees and then ensembled their future distributions predicted under 20 future climate scenarios. Except for Neolitsea sericea (True Skill Statistic (TSS) = 0.79), all projections for the current climatic niches of evergreens showed excellent predictive powers (TSS > 0.85). The results showed that the climatic niches of the four evergreens—Castanopsis cuspidata, Pittosporum tobira, Raphiolepis indica var. umbellate, and Eurya emarginata—would expand to the northern part of the Korean Peninsula (KP) under climate change, but the ones of the remaining four—Kadsura japonica, Neolitsea sericea, Ilex integra, and Dendropanax morbiferus—would shrink. While the climatic niches of Pittosporum tobira showed the rapidest and greatest expansion under climate change, Dendropanax morbiferus was predicted to experience the greatest loss of habitat. On the other hand, regardless of whether the future distributions of climatically suitable habitats would expand or contract, the highly suitable habitats of all species were predicted to decline under climate change. This may indicate that further climate change will degrade habitat suitability for all species within the distribution boundary and restrict continuous habitat expansions of expanding species or accelerate habitat loss of shrinking species. In addition, the future distributions of most coastal evergreens were found to be confined to coastal areas; therefore, sea-level rise would accelerate their habitat loss under climate change. The present study provides primary and practical knowledge for understanding climate-related coastal vegetation changes for future conservation planning, particularly on the Korean Peninsula.
1. Introduction
Climate change has degraded habitat suitability for species, which causes range shifts of plants and species extinction in diverse ecosystems [1,2]. Substantial prior research on climate-related range shifts of plants has centered on cold-adapted plants inhabiting high latitude and altitude areas due to their vulnerability to climate warming [3]. By contrast, warm-adapted plants have not drawn much scholarly interest [3,4], as it has been expected that those species will expand or shift their range according to climate warming [5,6,7,8]. However, the climate-related range expansion or decline of warm-adapted plants depends on individual species; in particular, previous research reported that some warm-adapted lowland plants experienced habitat loss and that their extinction risk increased under climate change [1,4,5,6,9,10,11,12,13]. Although it was predicted that the range of warm-adapted plants would expand under climate warming, their habitat suitability decreased within the range [12,14]. Accordingly, species-specific research on climate-related range shifts is essential for the effective conservation planning of warm-adapted plants under climate change.
The habitat suitability of warm-adapted plants, particularly those inhabiting coastal zones, will be affected by climate change and a related event, sea-level rise. Such warm-adapted coastal plants could directly lose suitable habitats according to an accelerated sea-level rise and indirectly altered precipitation and temperature regimes as a result of climate change. However, even if climatic drivers—including precipitation and temperature—are among the important factors explaining the distributions of coastal plants [15,16,17,18], previous research has focused on habitat loss related to sea-level rise [15,19,20,21,22]. This is because sea-level rise has resulted in the great habitat loss of coastal plants due to inundation, flooding, a decrease in sediment elevation, and changes in salinity regimes [18,19,21,22]. But, climate change will result in changes in the climatically suitable habitats of coastal plants, and such changes will accelerate or compensate for the habitat loss of coastal plants caused by sea-level rises [15,23].
Most climate-related range shifts of plants have been forecasted with species distribution models (SDMs) [24,25,26]. However, the SDM projections have been criticized due to multiple sources of uncertainty, e.g., different projections according to the SDM algorithms (model uncertainty) [27,28,29,30], global circulation models (GCMs), and CO2 emission scenarios (climate uncertainty) [29,31], as well as the lack of ecological knowledge and imperfect data [32,33,34]. In this context, the ensemble approach has been proposed as a promising method for reducing model and climate uncertainties [29,35]. The ensemble approach identifies the projected geographic range of a species that all individual models agree on to predict a suitable habitat for a species; therefore, an ensemble forecast could minimize the potential errors originating from the predictions of individual models, reducing model uncertainty [36]. The ensemble of future climate projections, including the average of multiple GCMs and representative concentration pathway (RCP) projections, has also been used for reducing the effects of climate uncertainty on future predictions [24,37,38].
This study: (1) projects the climatically suitable habitats of warm-adapted evergreen broadleaved plants in the southern coastal zone of the Korean Peninsula using an ensemble approach; and (2) seeks to predict their potential habitat shifts under climate change, as expanding or shrinking. For these purposes, we modelled the climatically suitable habitats of eight evergreen broadleaved plants using a weighted ensemble method [39]; then, we predicted the distribution of suitable habitats under 20 future climate conditions and ensembled these 20 predictions. In view of the lack of research on the effects of climate change on warm-adapted plants, especially evergreen plants in coastal areas, the results of the present study provide valuable insight and practical knowledge for future conservation planning of warm-temperate vegetation, particularly on the Korean Peninsula.
2. Materials and Methods
2.1. Study Area and Species
The climatically suitable habitats of warm-adapted evergreen plants were modelled on the Korean Peninsula (KP), the Republic of Korea (ROK) in the south, and the Democratic People’s Republic of Korea (DPRK) in the north (Figure 1). The KP has well-developed plains and coastal wetlands in the western and southern areas [40]. The climatic conditions of the KP show distinct seasonal and spatial variations. Summers are hot and humid, while winters are cold and dry: the 30-year August mean temperature ranges from 19.1 °C to 27.1 °C and January mean temperature varies from −17.2 °C to 6.8 °C (http://web.kma.go.kr/eng/index.jsp). Most rainfall approximately 70%) occurs during summer [41]. The climate of the northern part of the KP is very cold and dry in winter and is classified as a continental climate, while the climate of the southern, southwestern, and southeastern parts of the KP is warm and humid, i.e., a maritime climate. Such seasonal and spatial characteristics of the KP climate conditions underlie three main floristic zones in the KP: warm-temperate in the southern KP, temperate in the middle KP, and cold-temperate in the northern KP [40]. The southern and southwestern parts of the peninsula, including many islands, are particularly warm and humid and are dominated by warm-adapted plants.
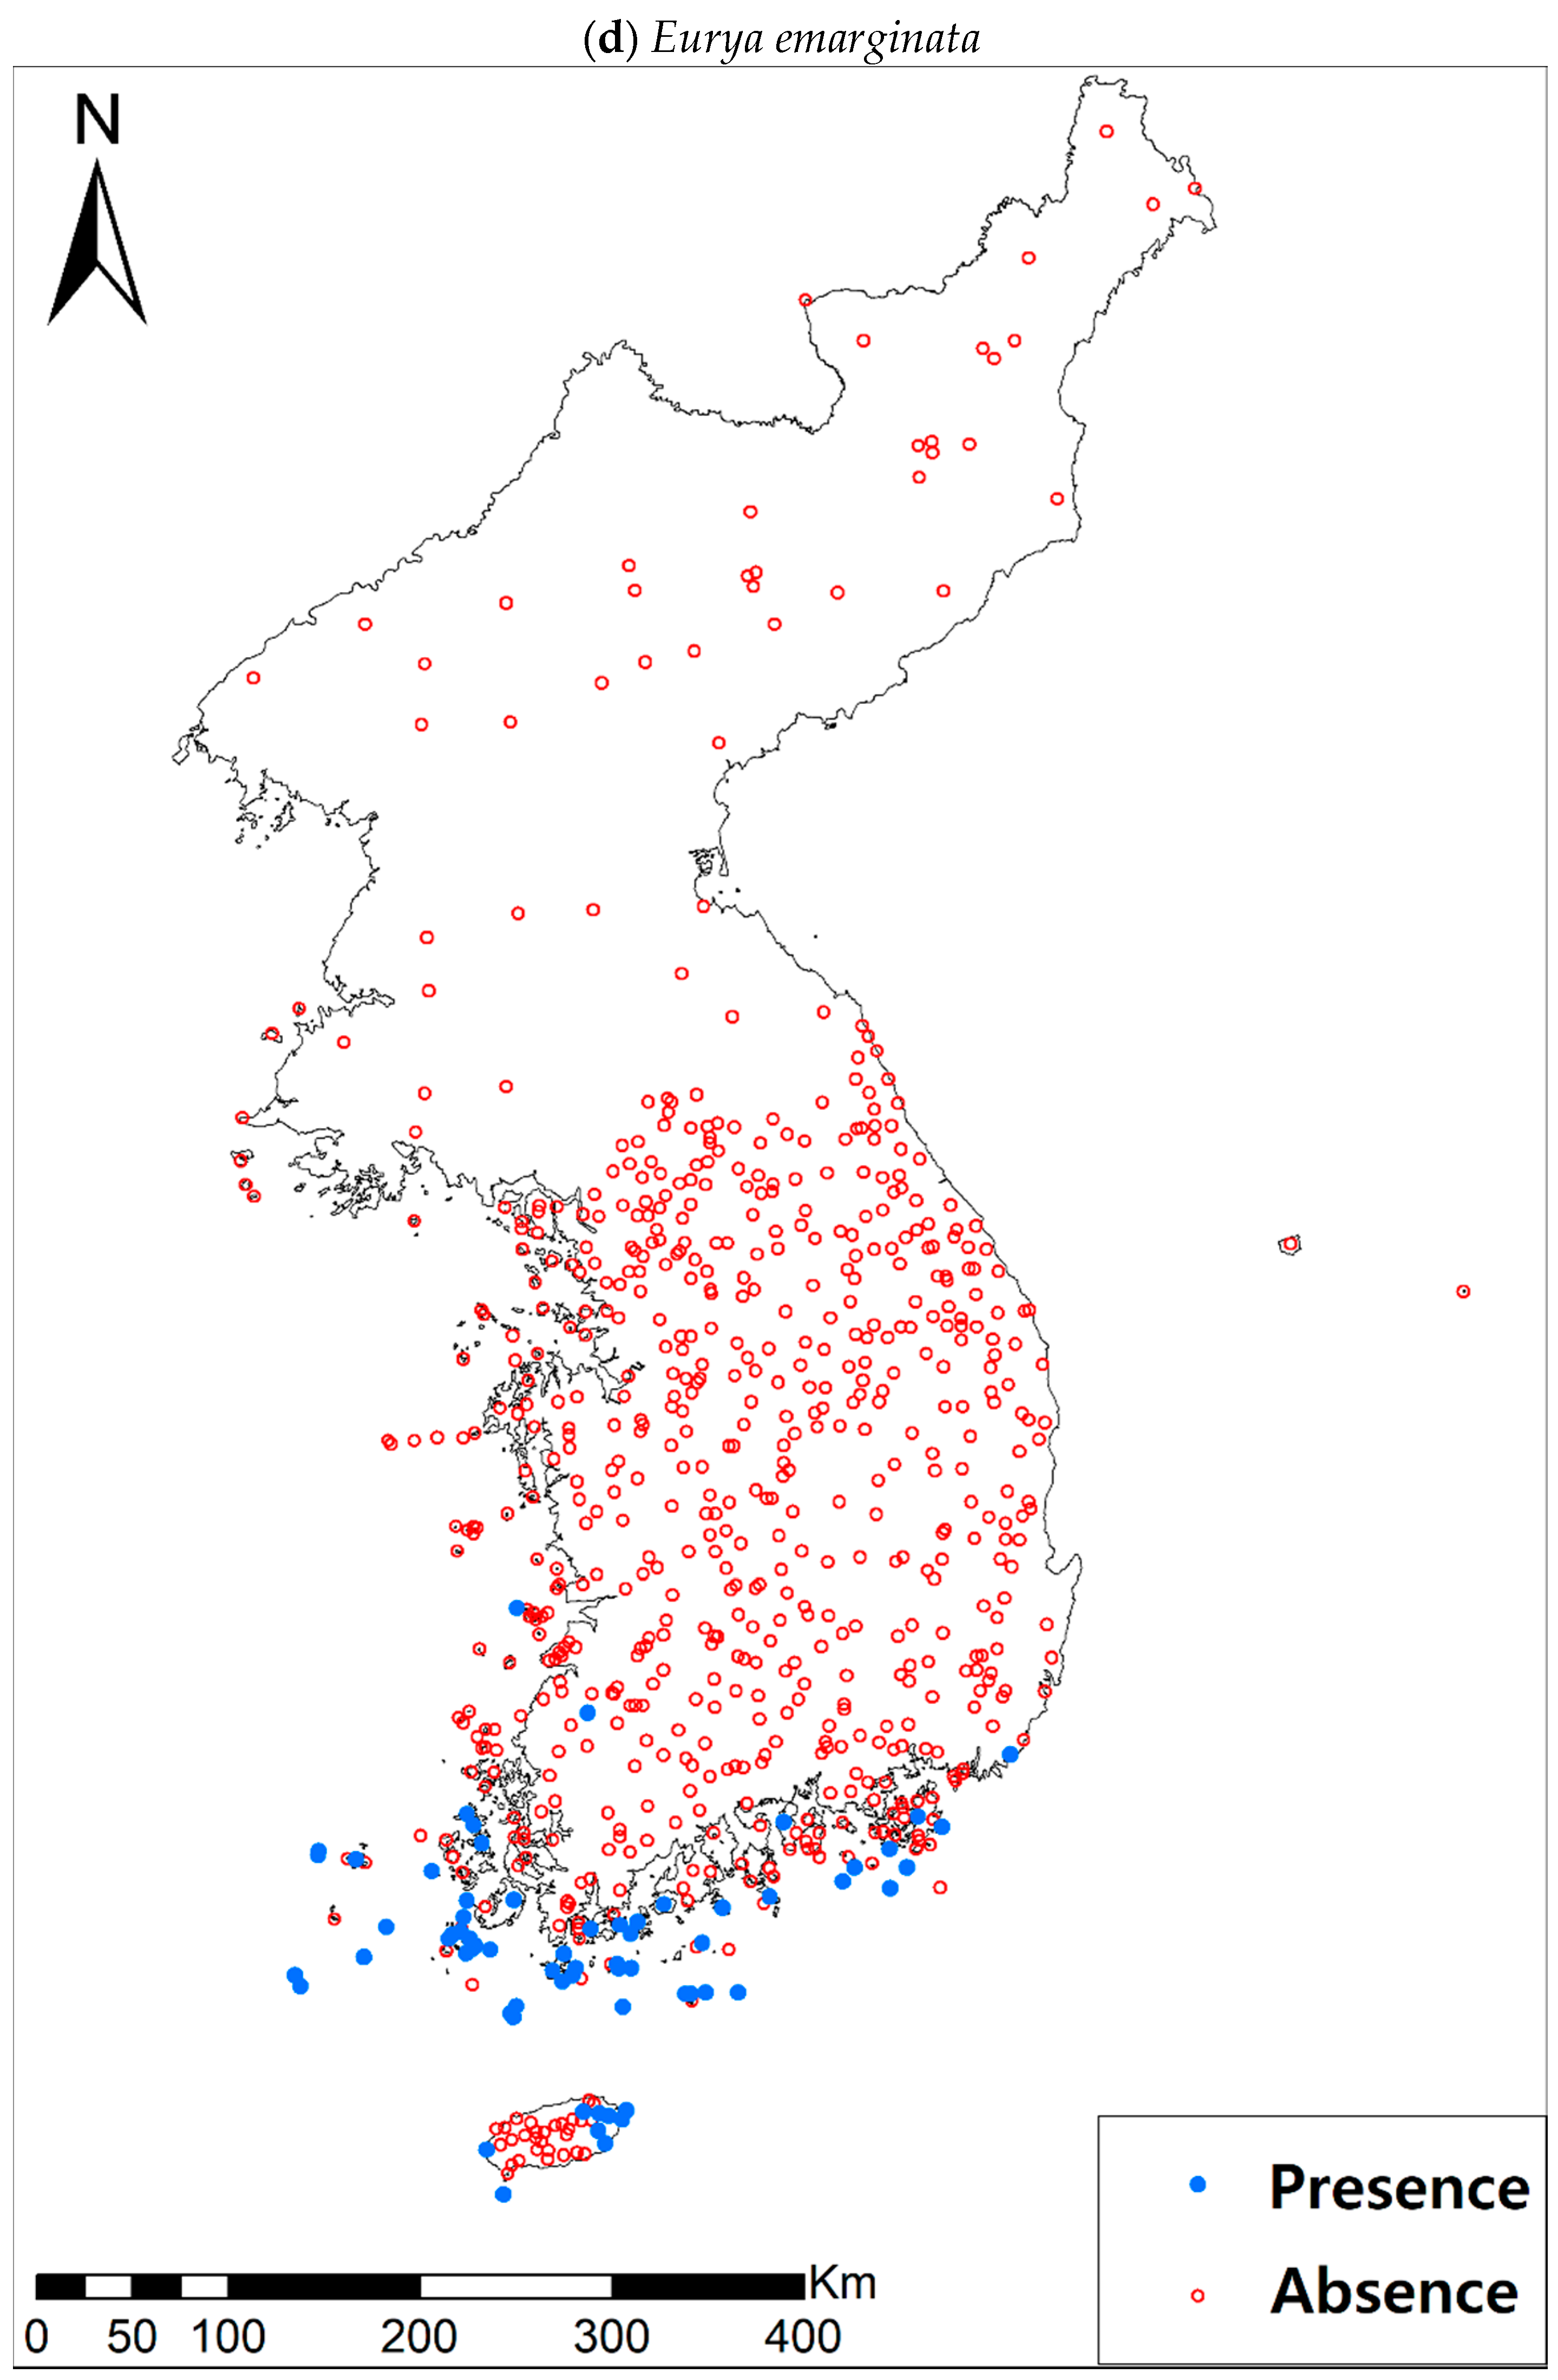
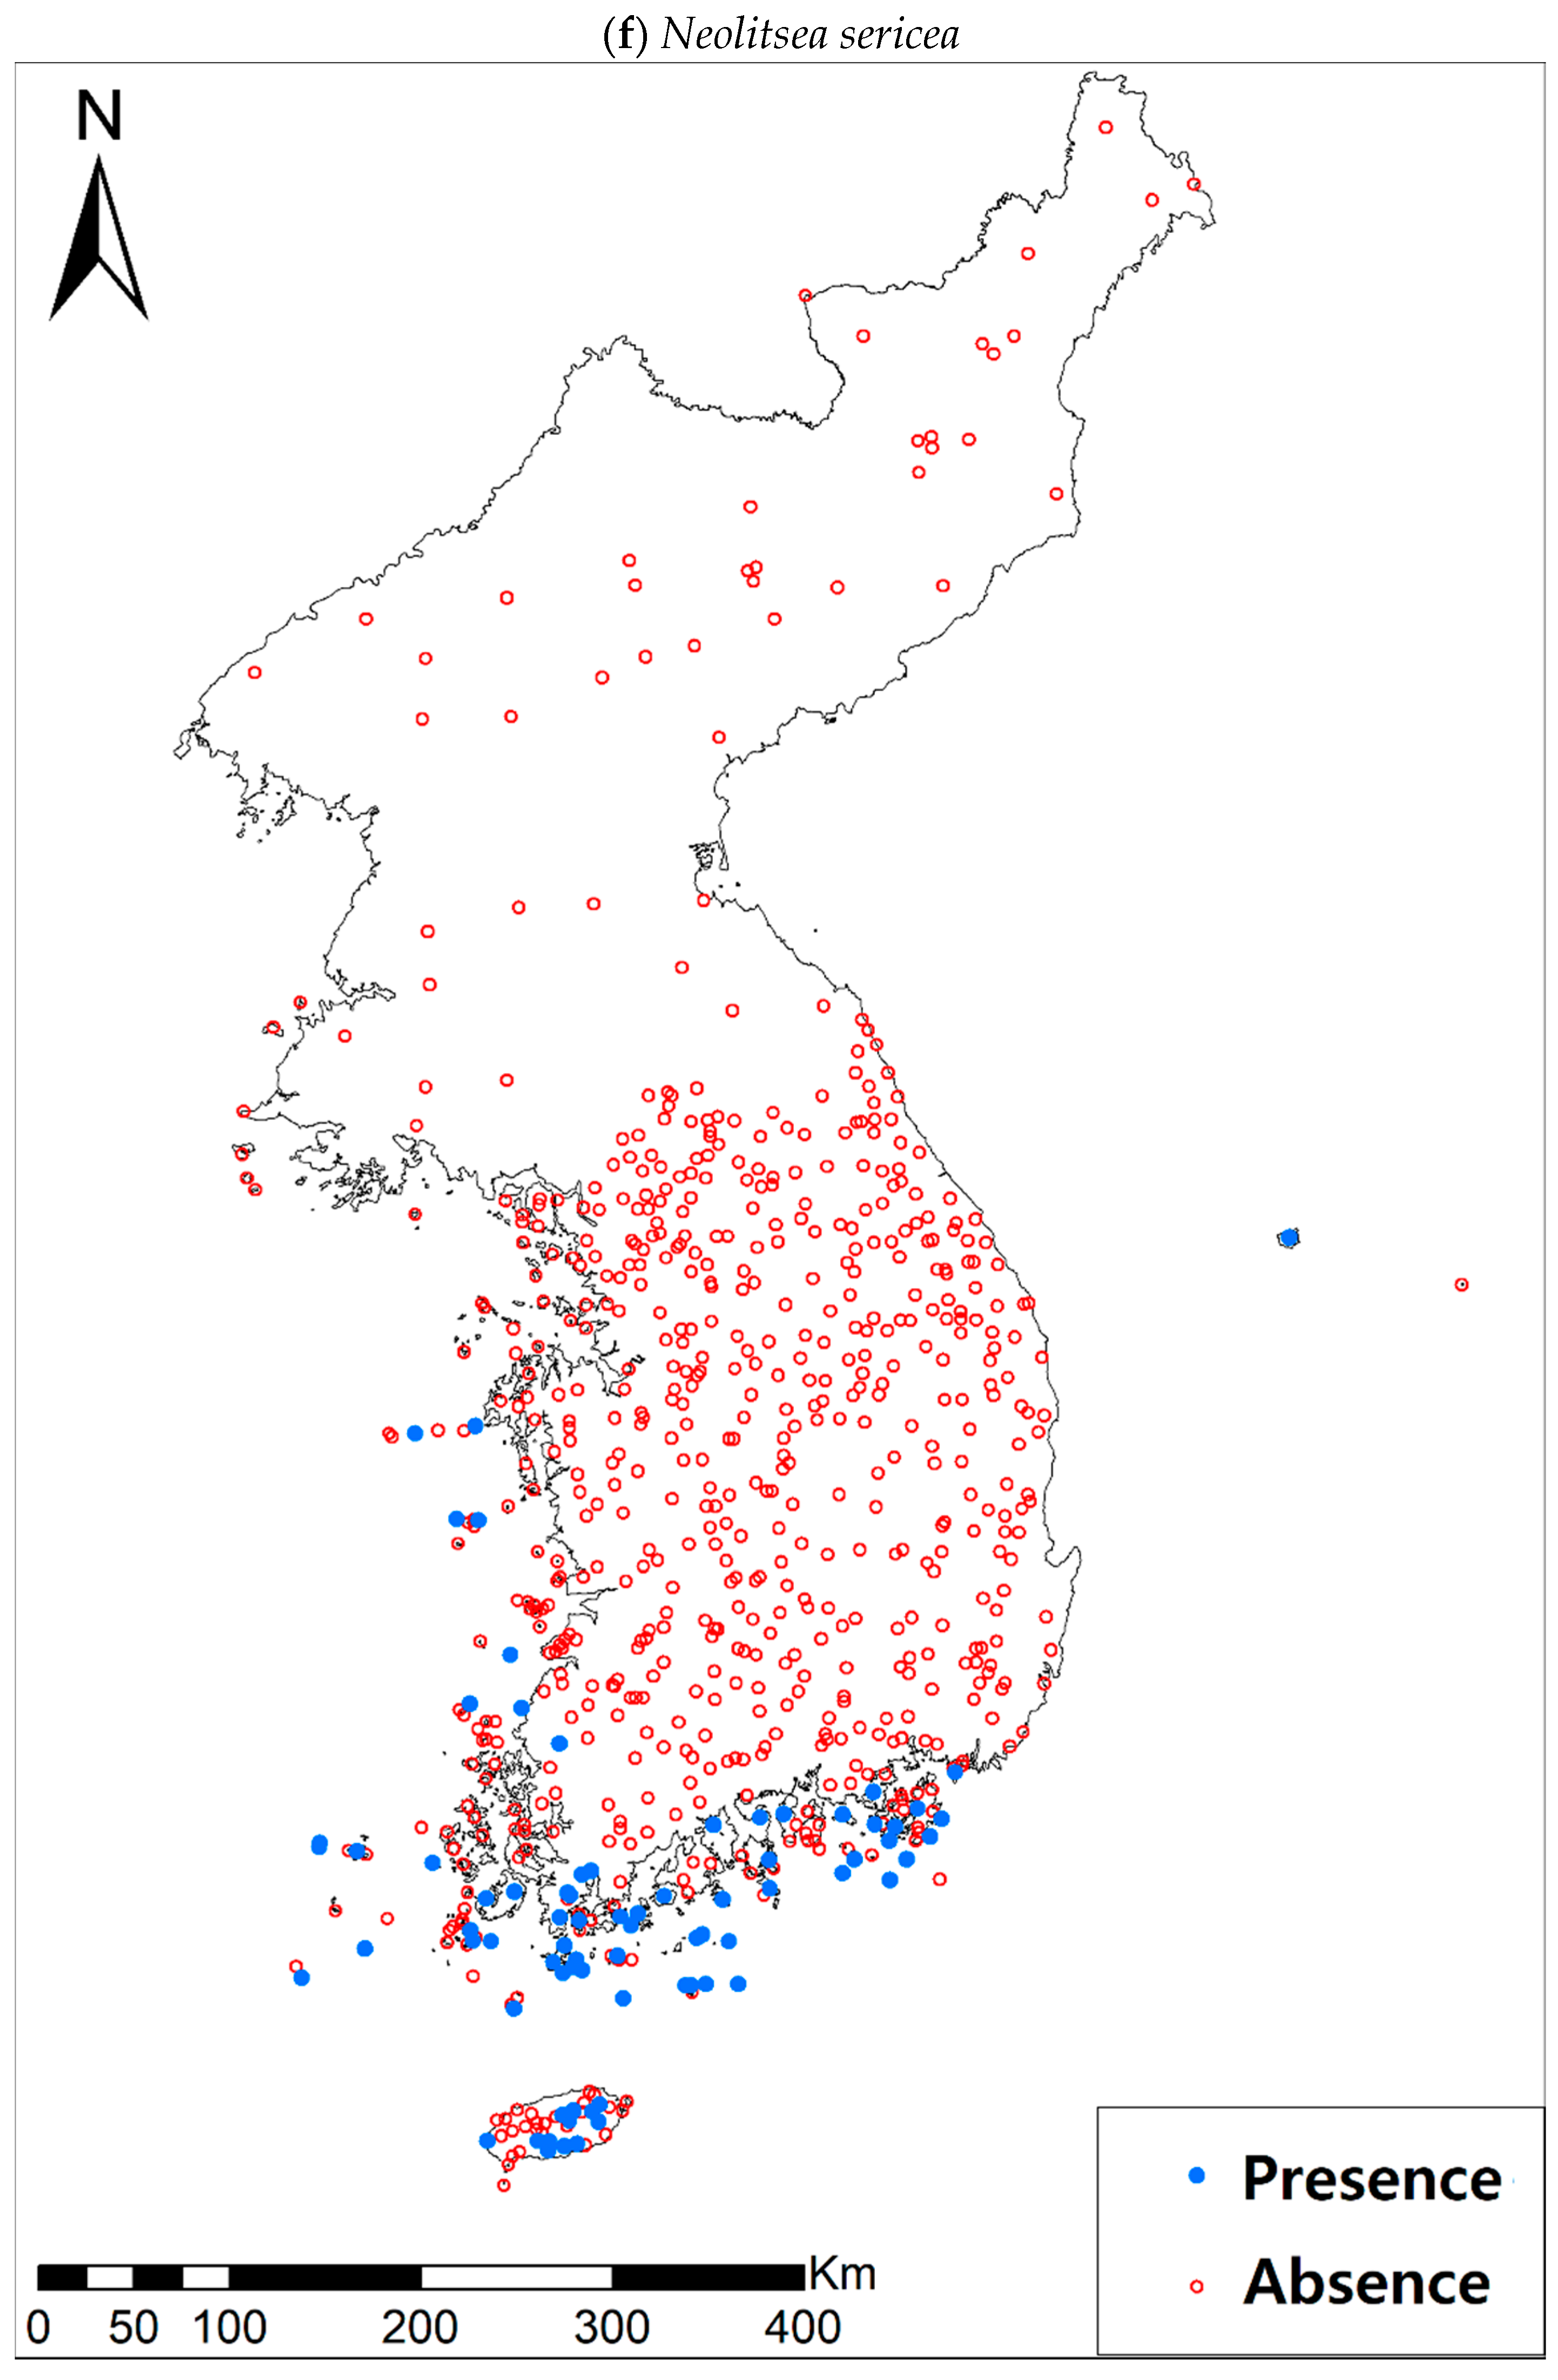
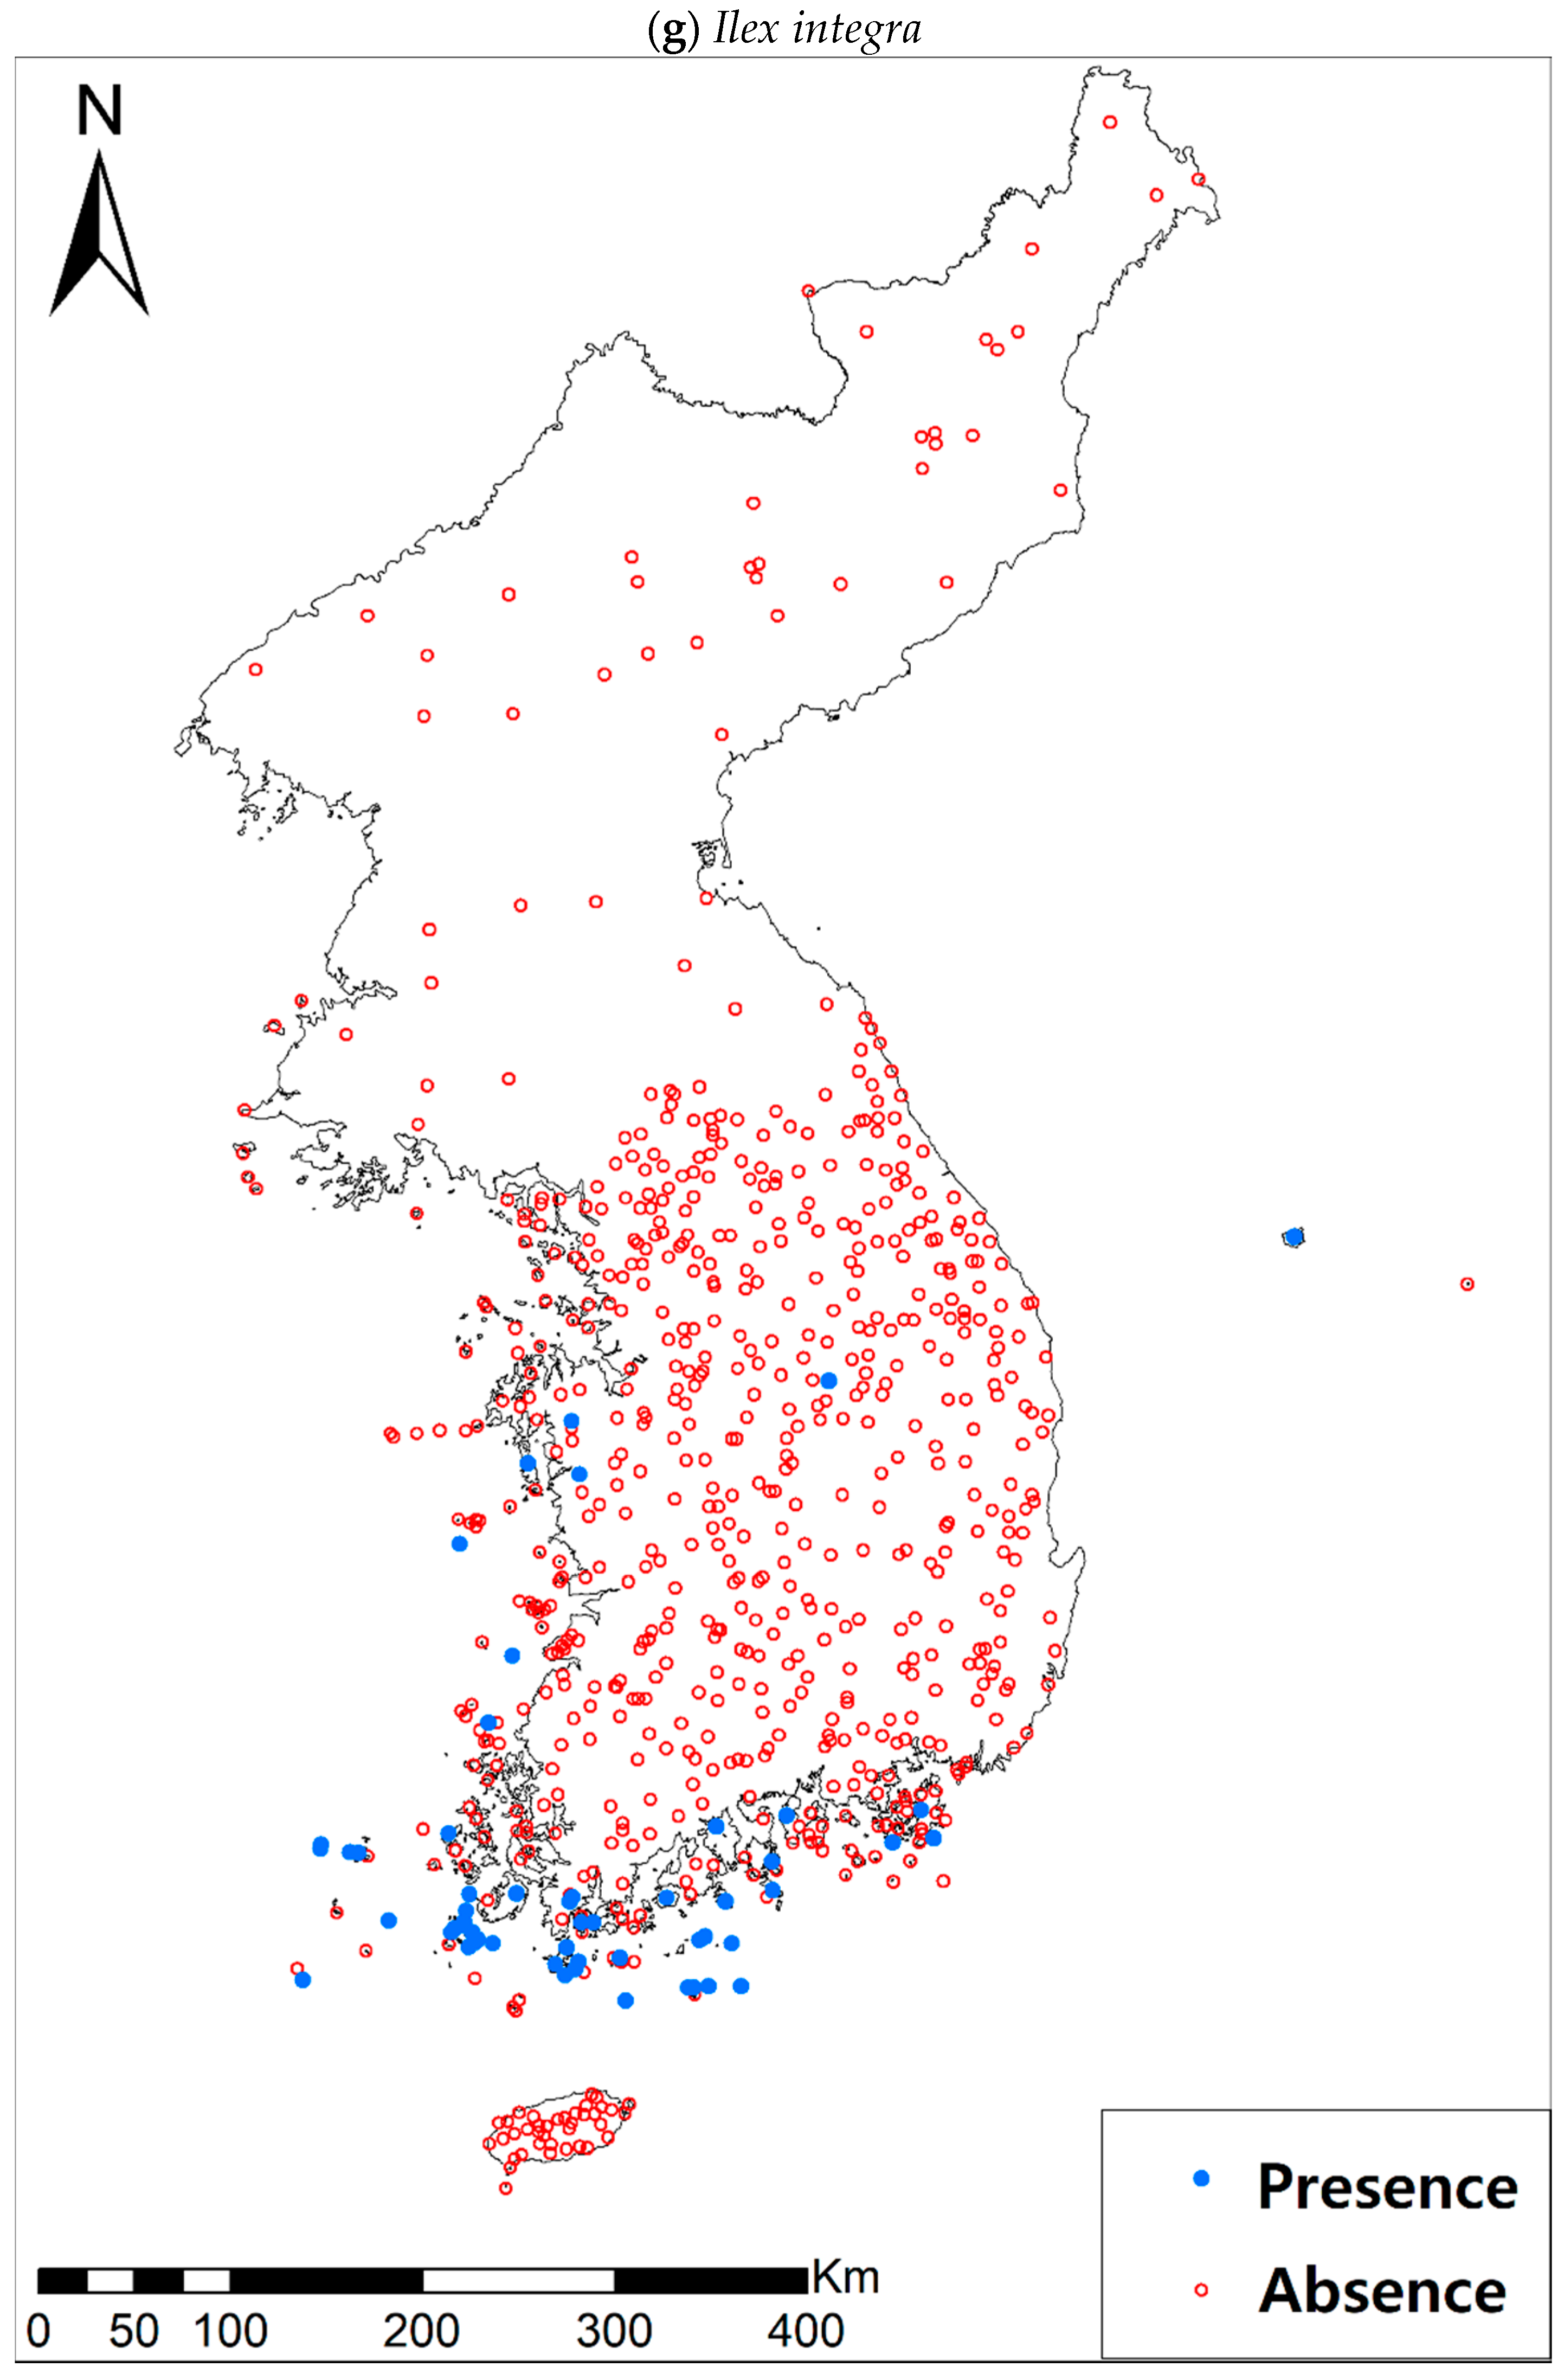
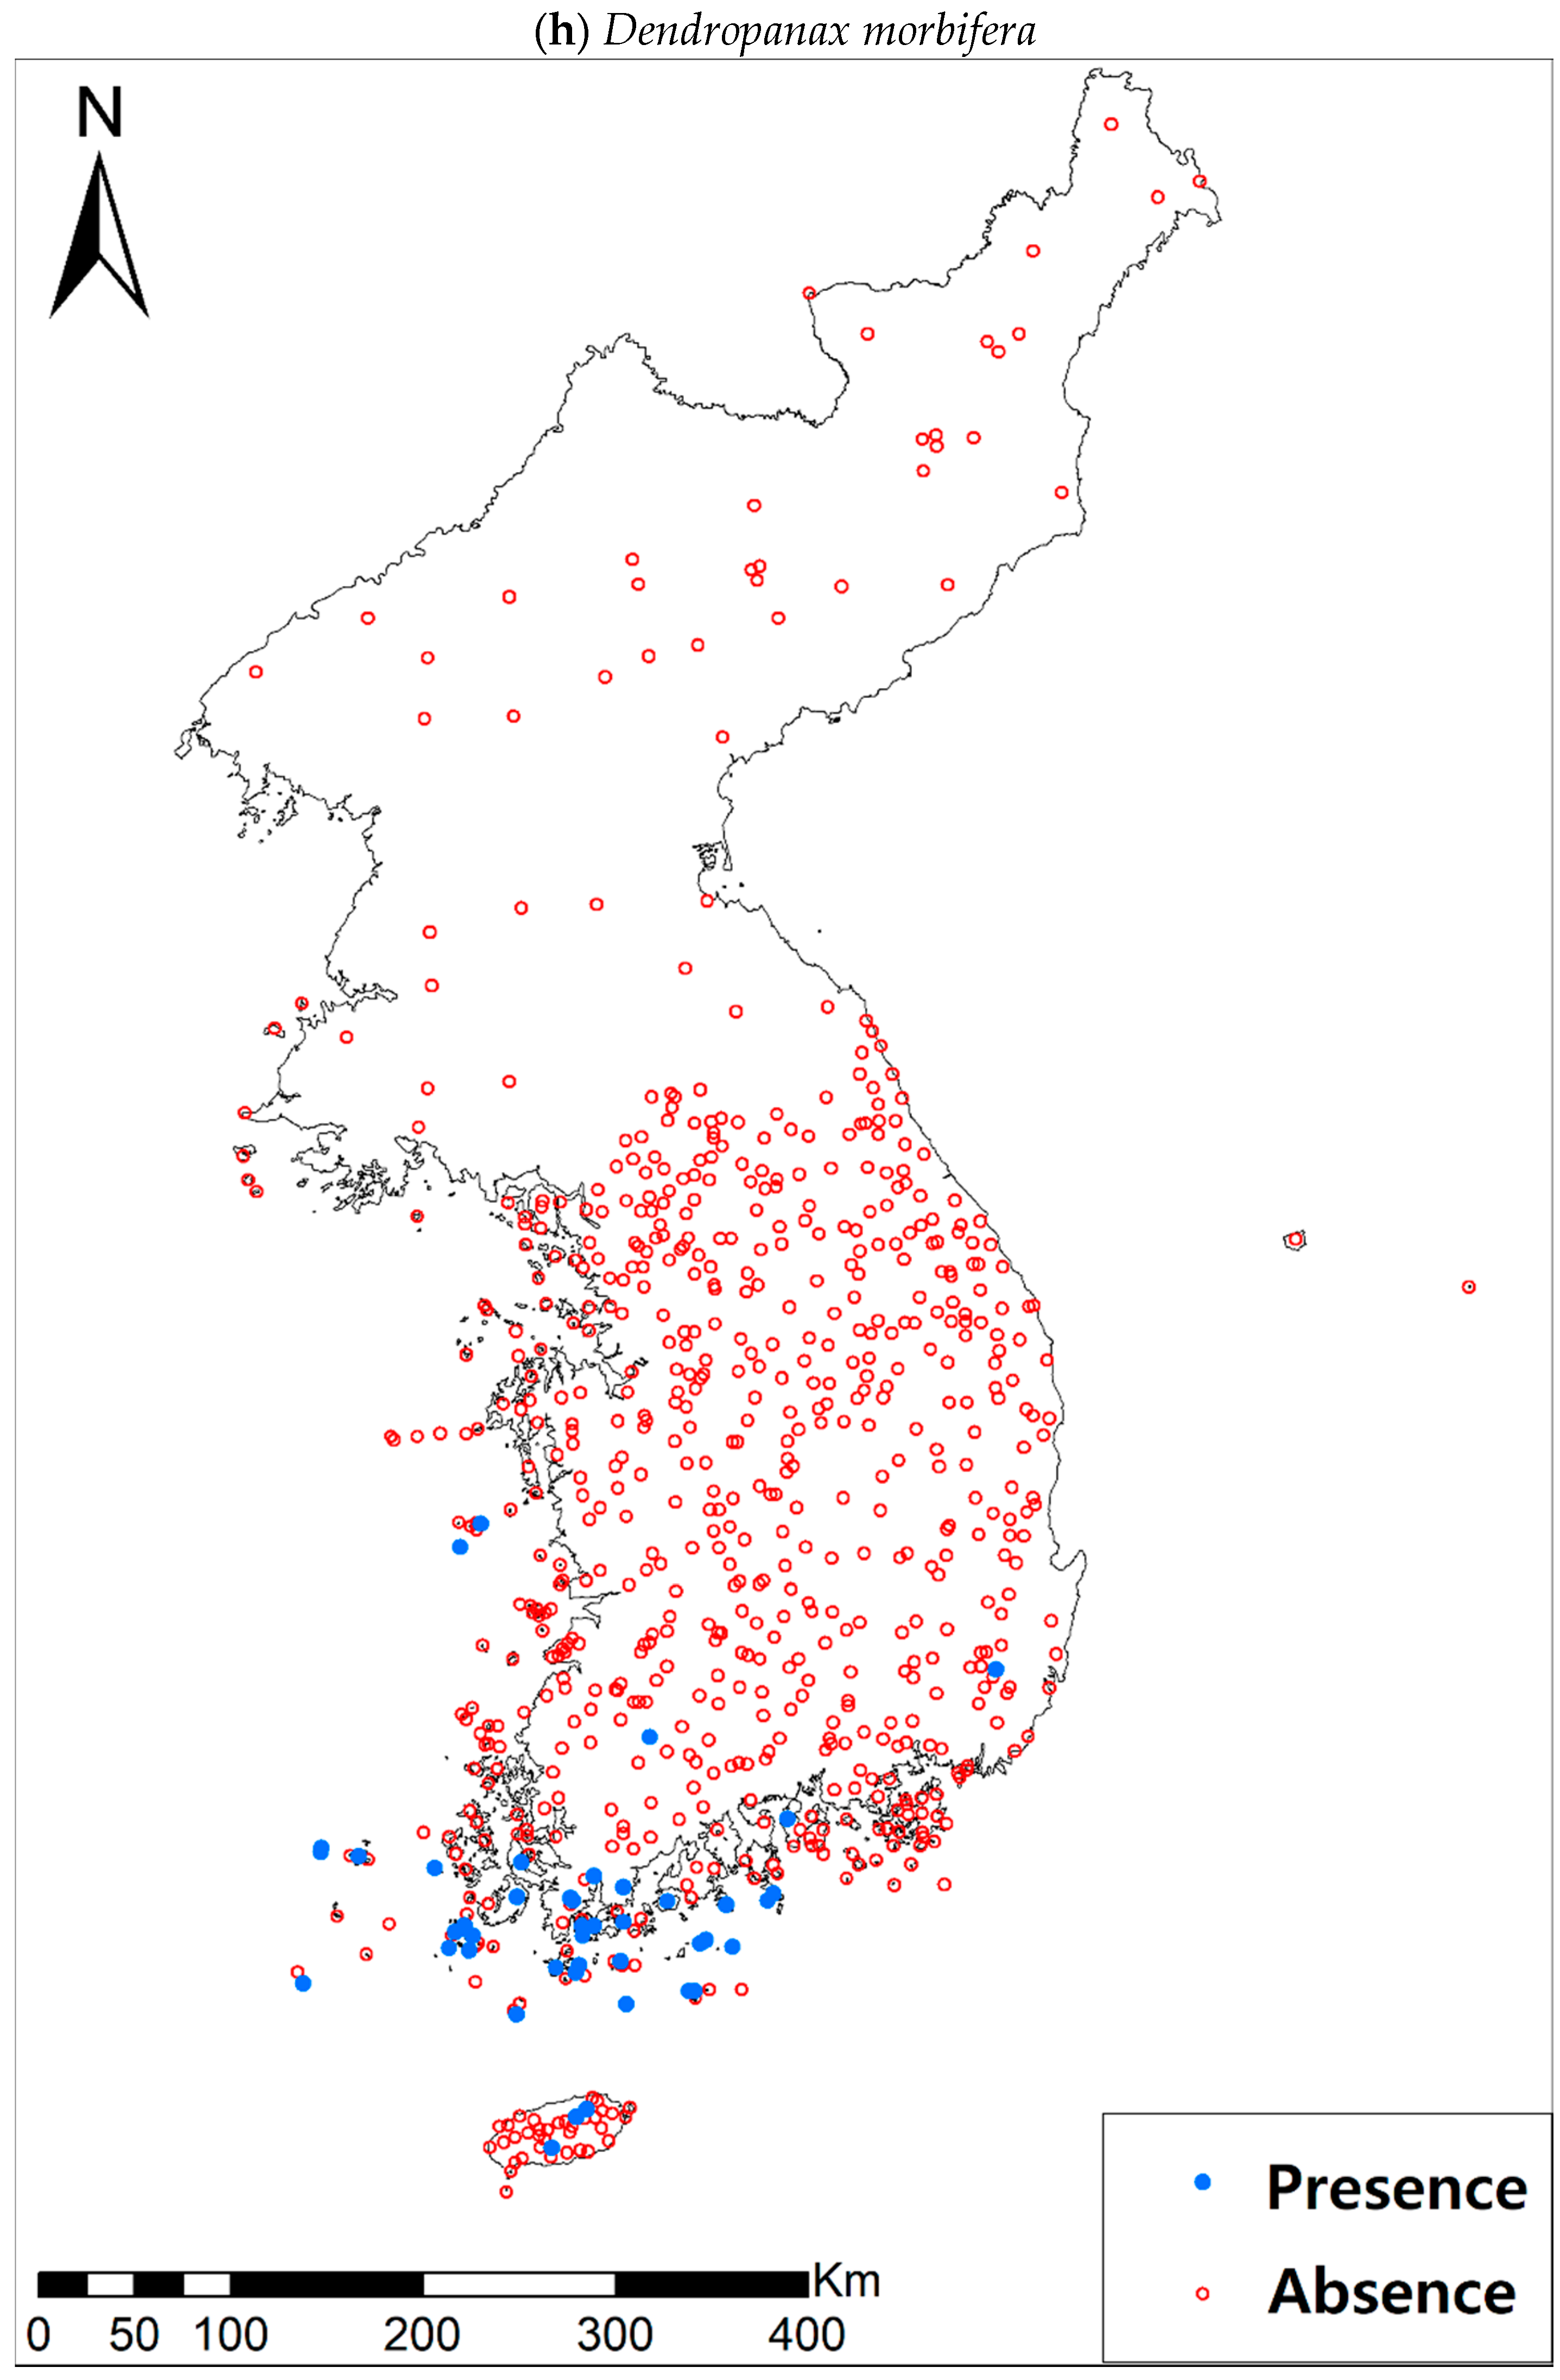
Eight study species (Table 1a, Figure A1), warm-adapted evergreen broadleaved plants, are also distributed in the southern and southwestern parts of the KP, especially in the coastal wetland areas including the islands [42]. It has been generally expected that the habitats for those species will expand or shift landwards and northwards [42,43,44] under future climate conditions of increasing precipitation and temperature [45]. The distributions of all study species, except for Pittosporum tobira (Thunb.) W.T. Aiton, are very restricted to coastal areas, which may reflect the narrow width of their climatic niche in the KP. Such species with a narrow climatic niche space could be very susceptible to habitat loss as a result of climate change [46]; furthermore, their habitat loss will be intensified by the accelerated sea-level rise and coastal developments.
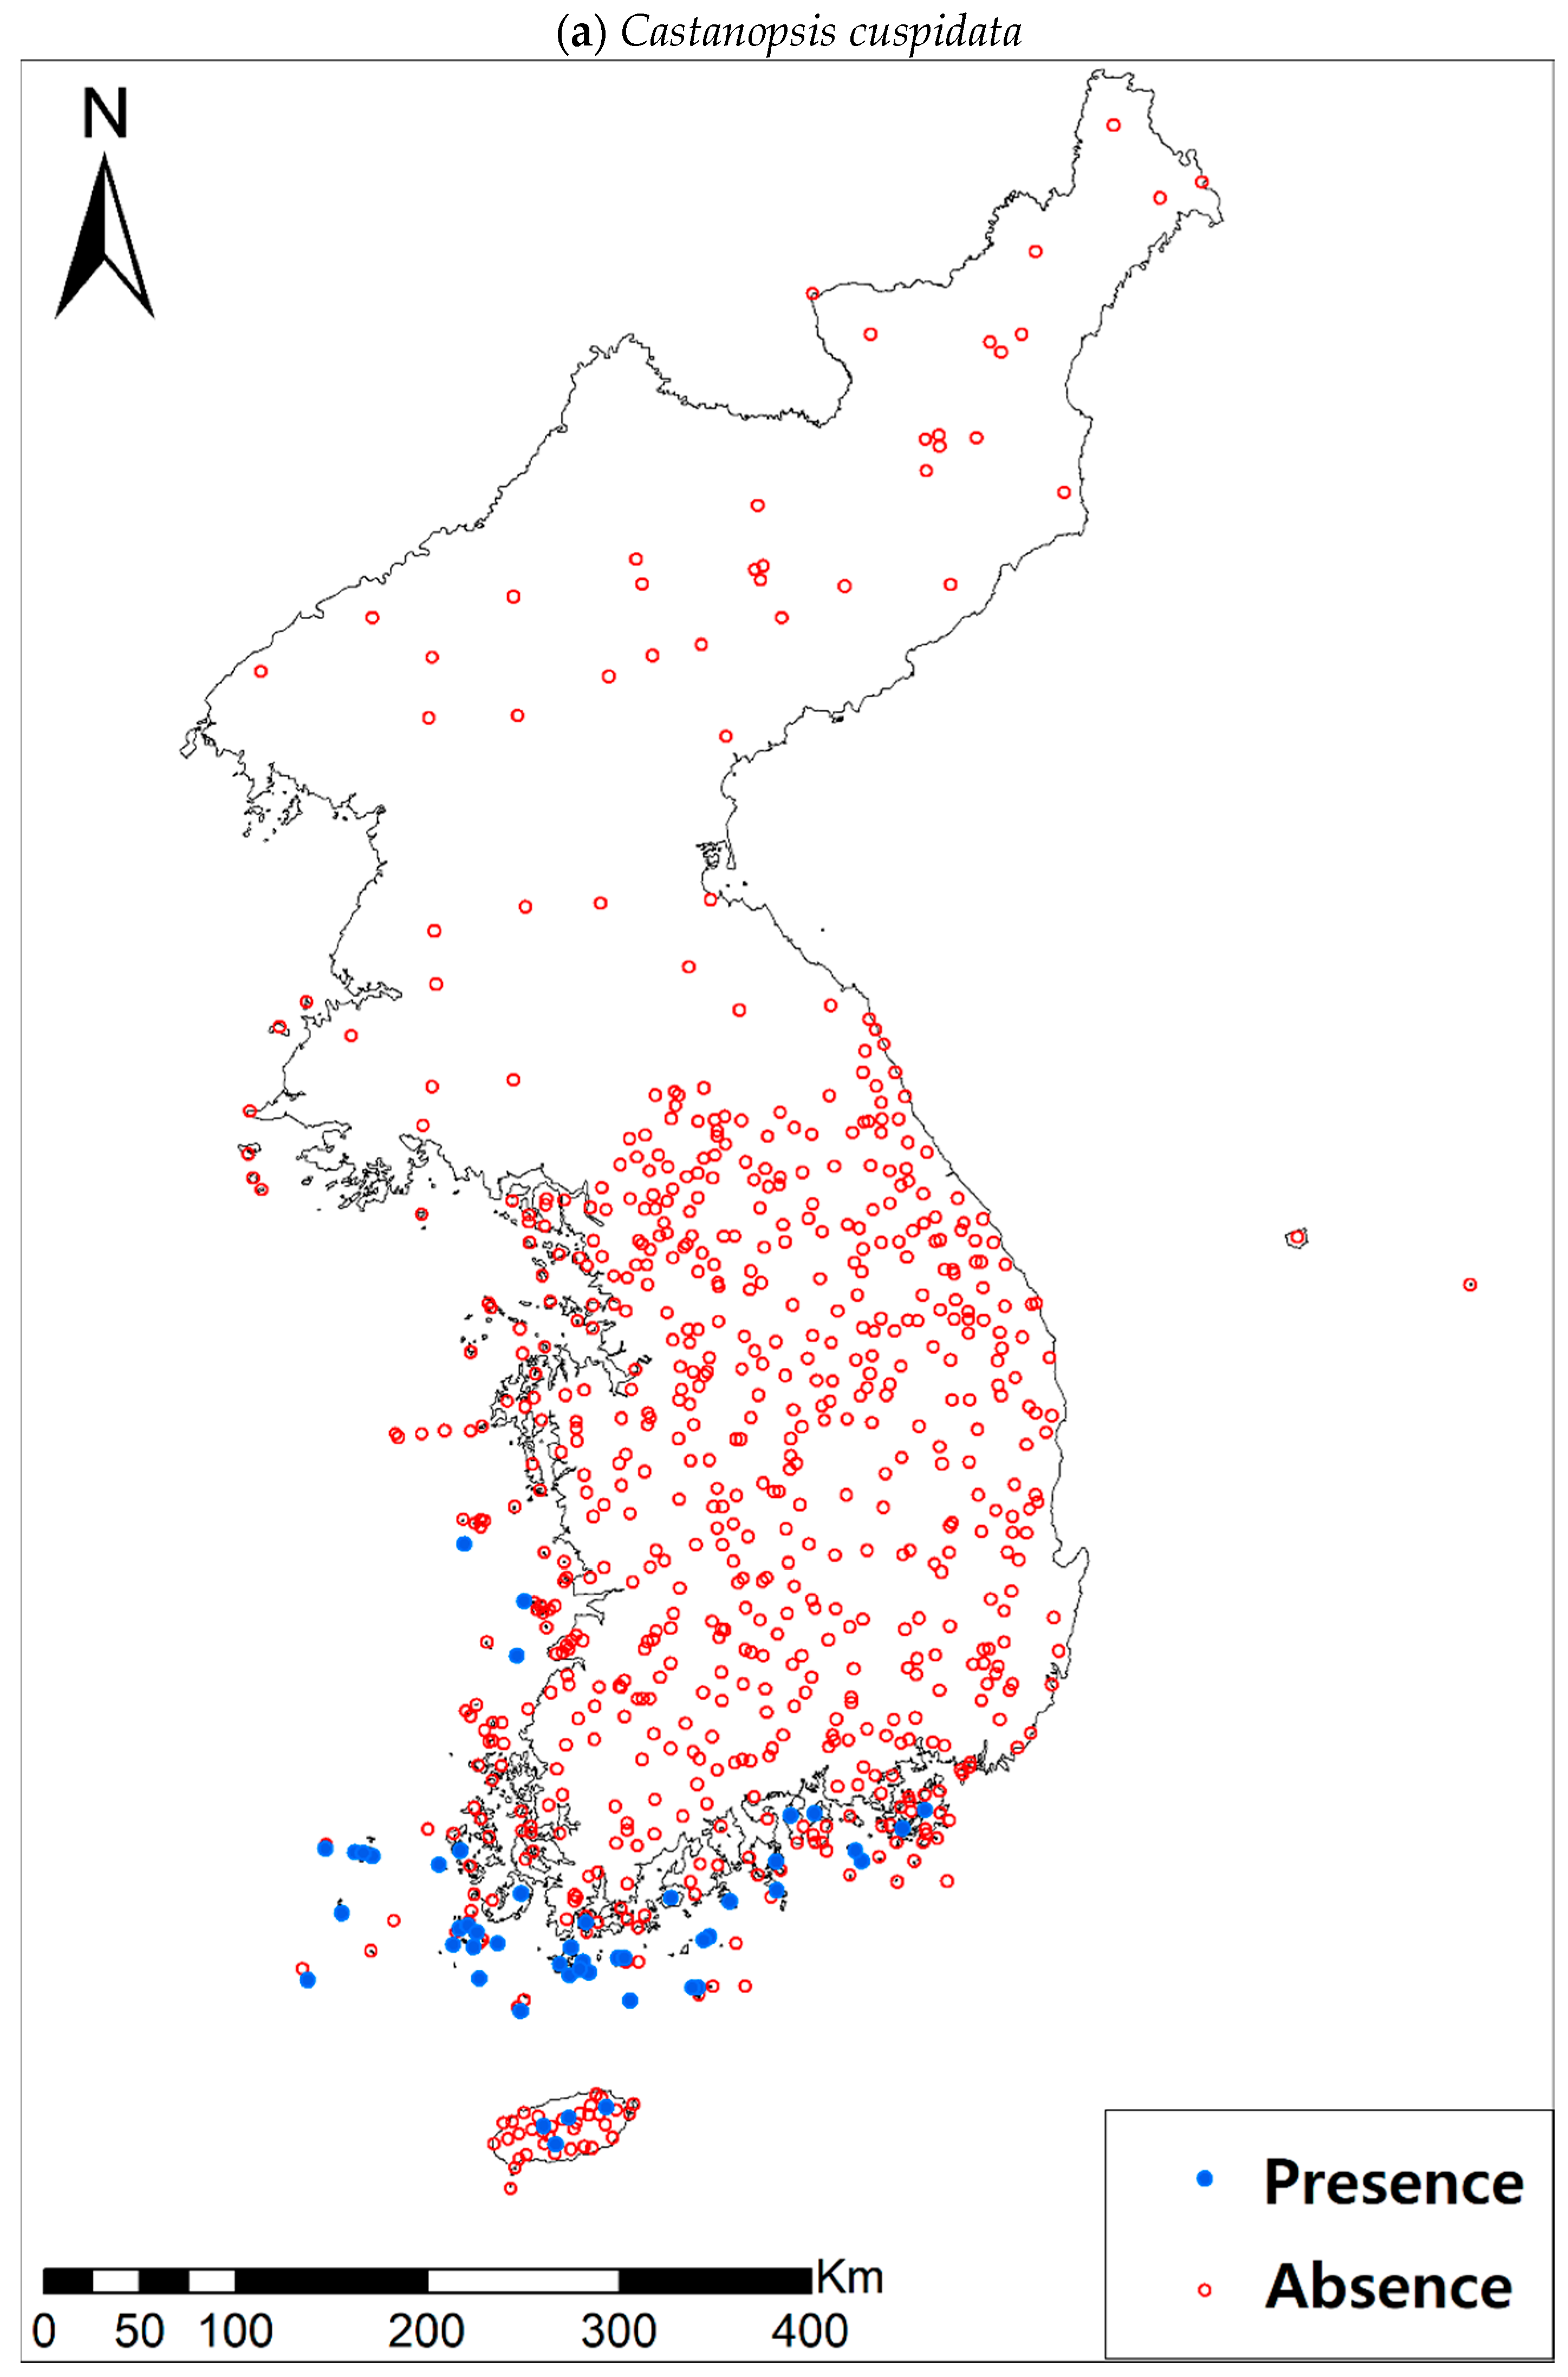
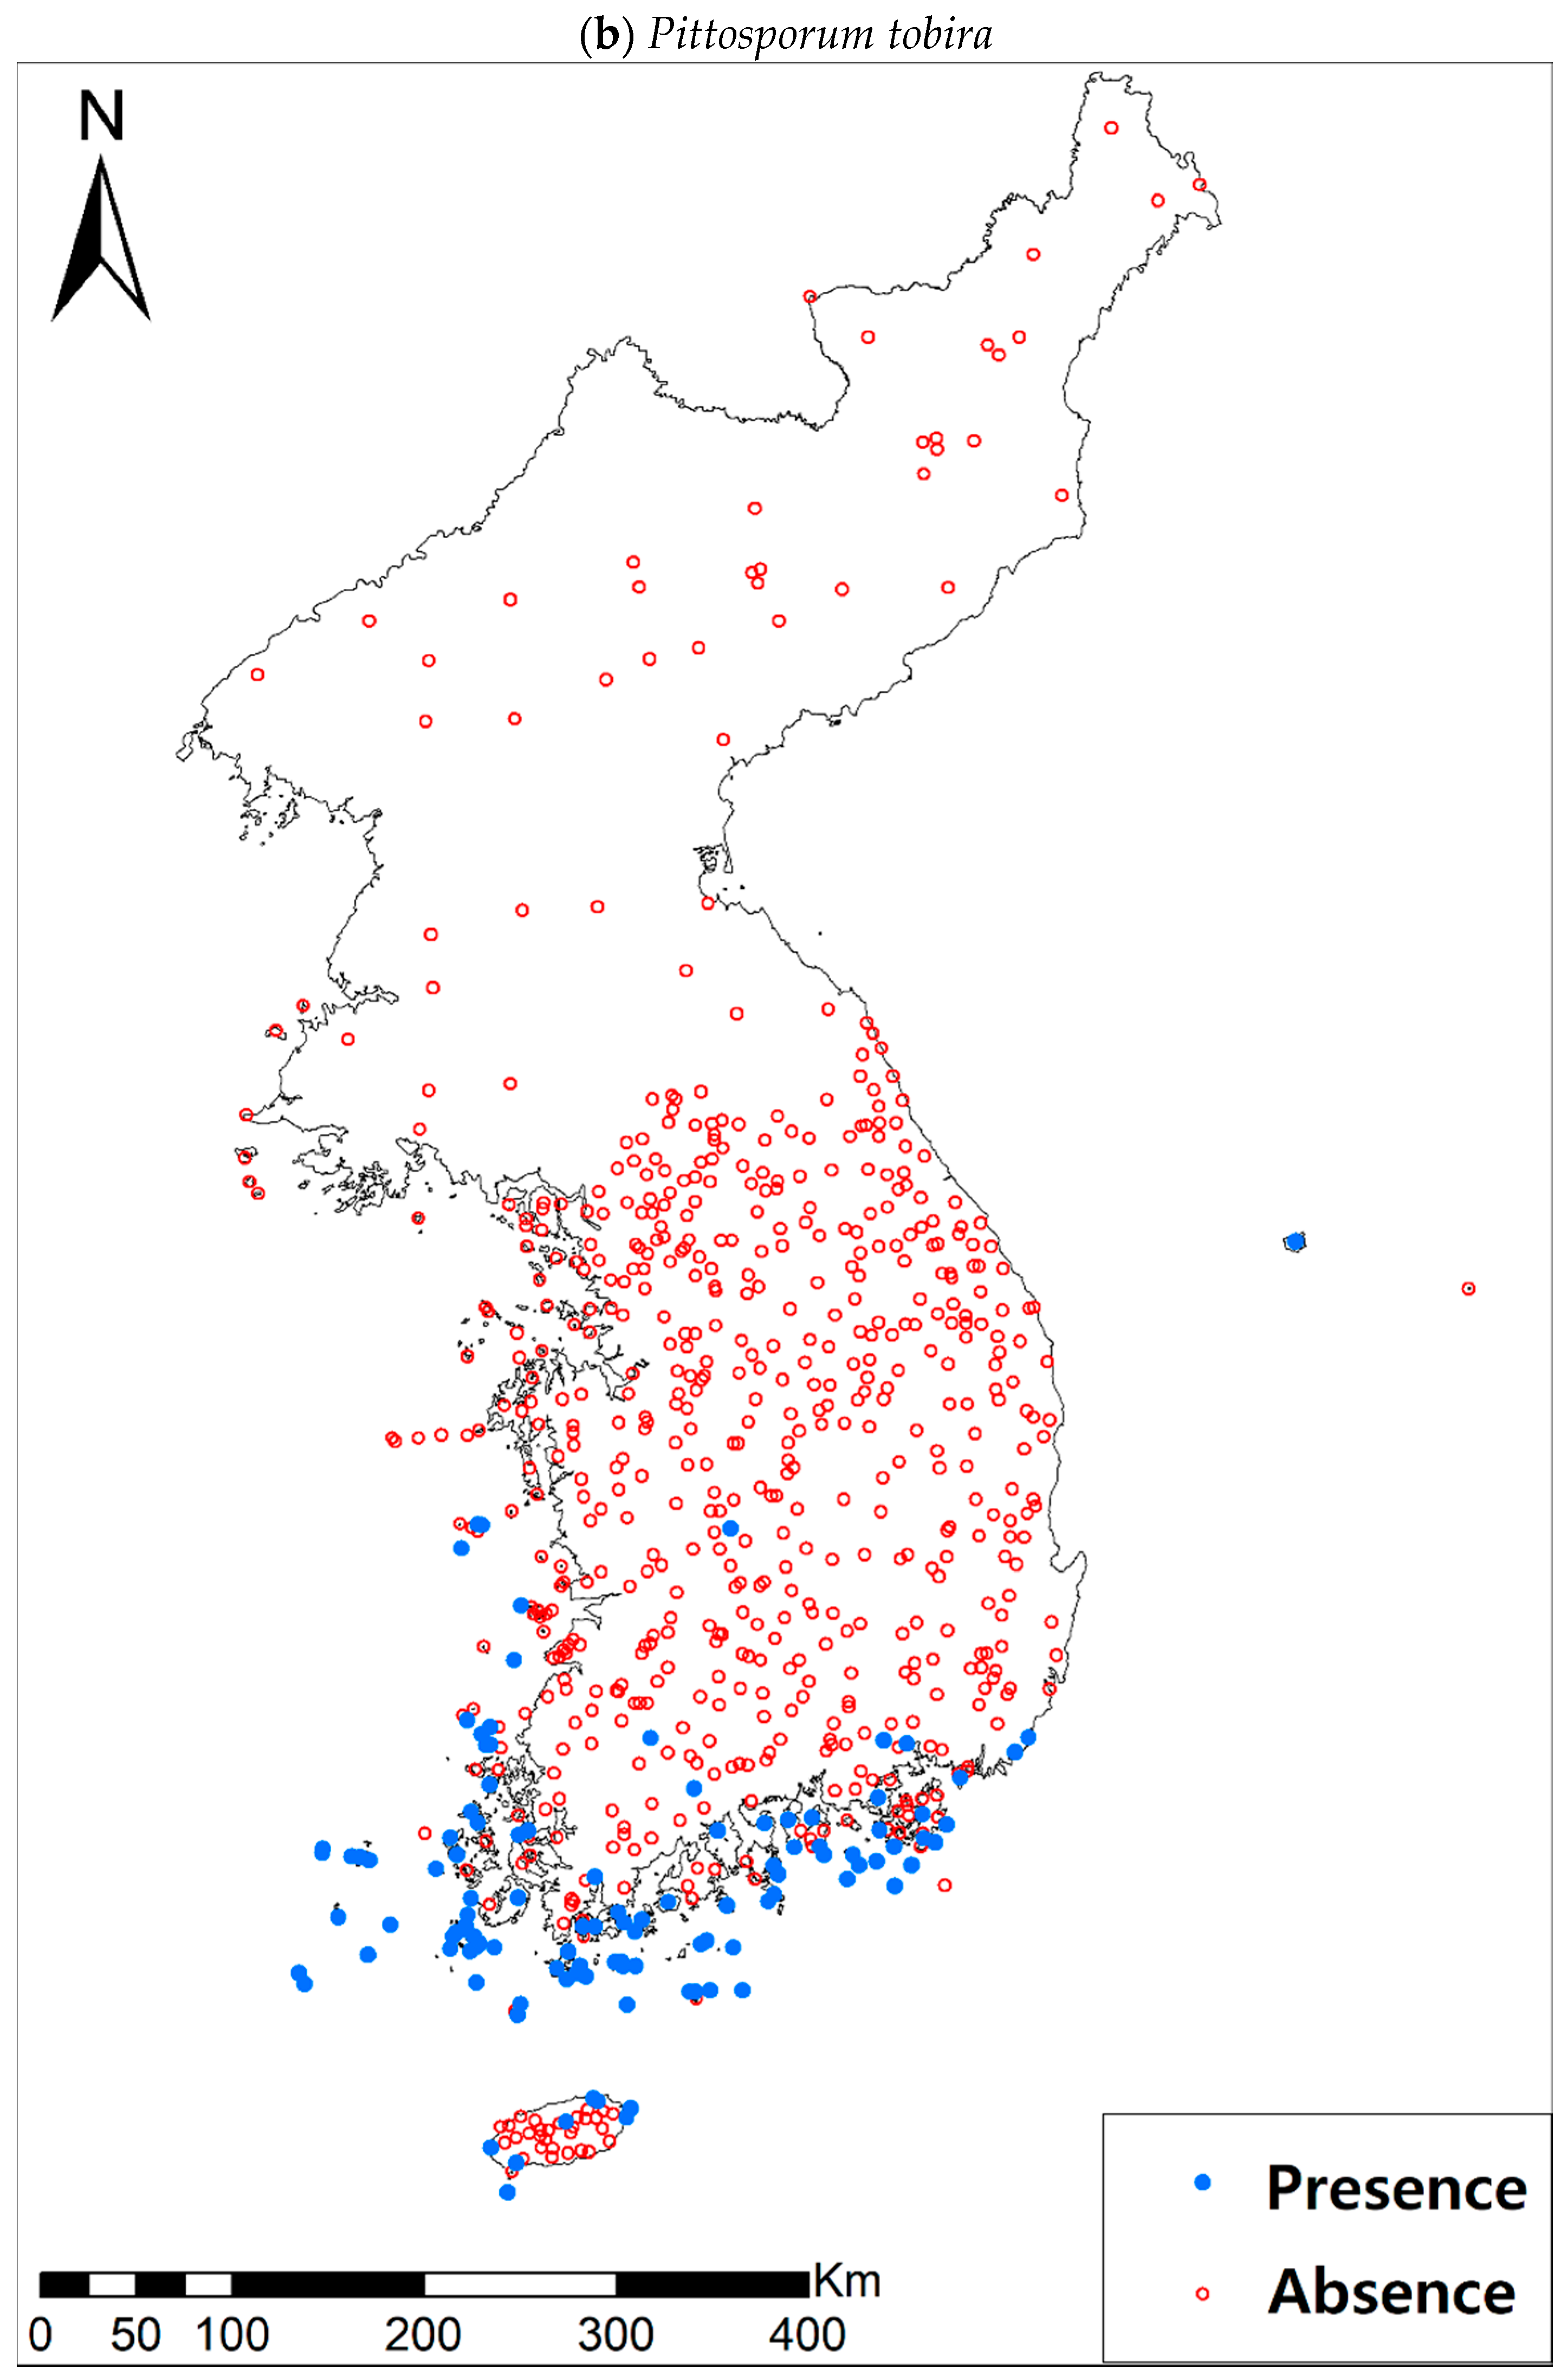
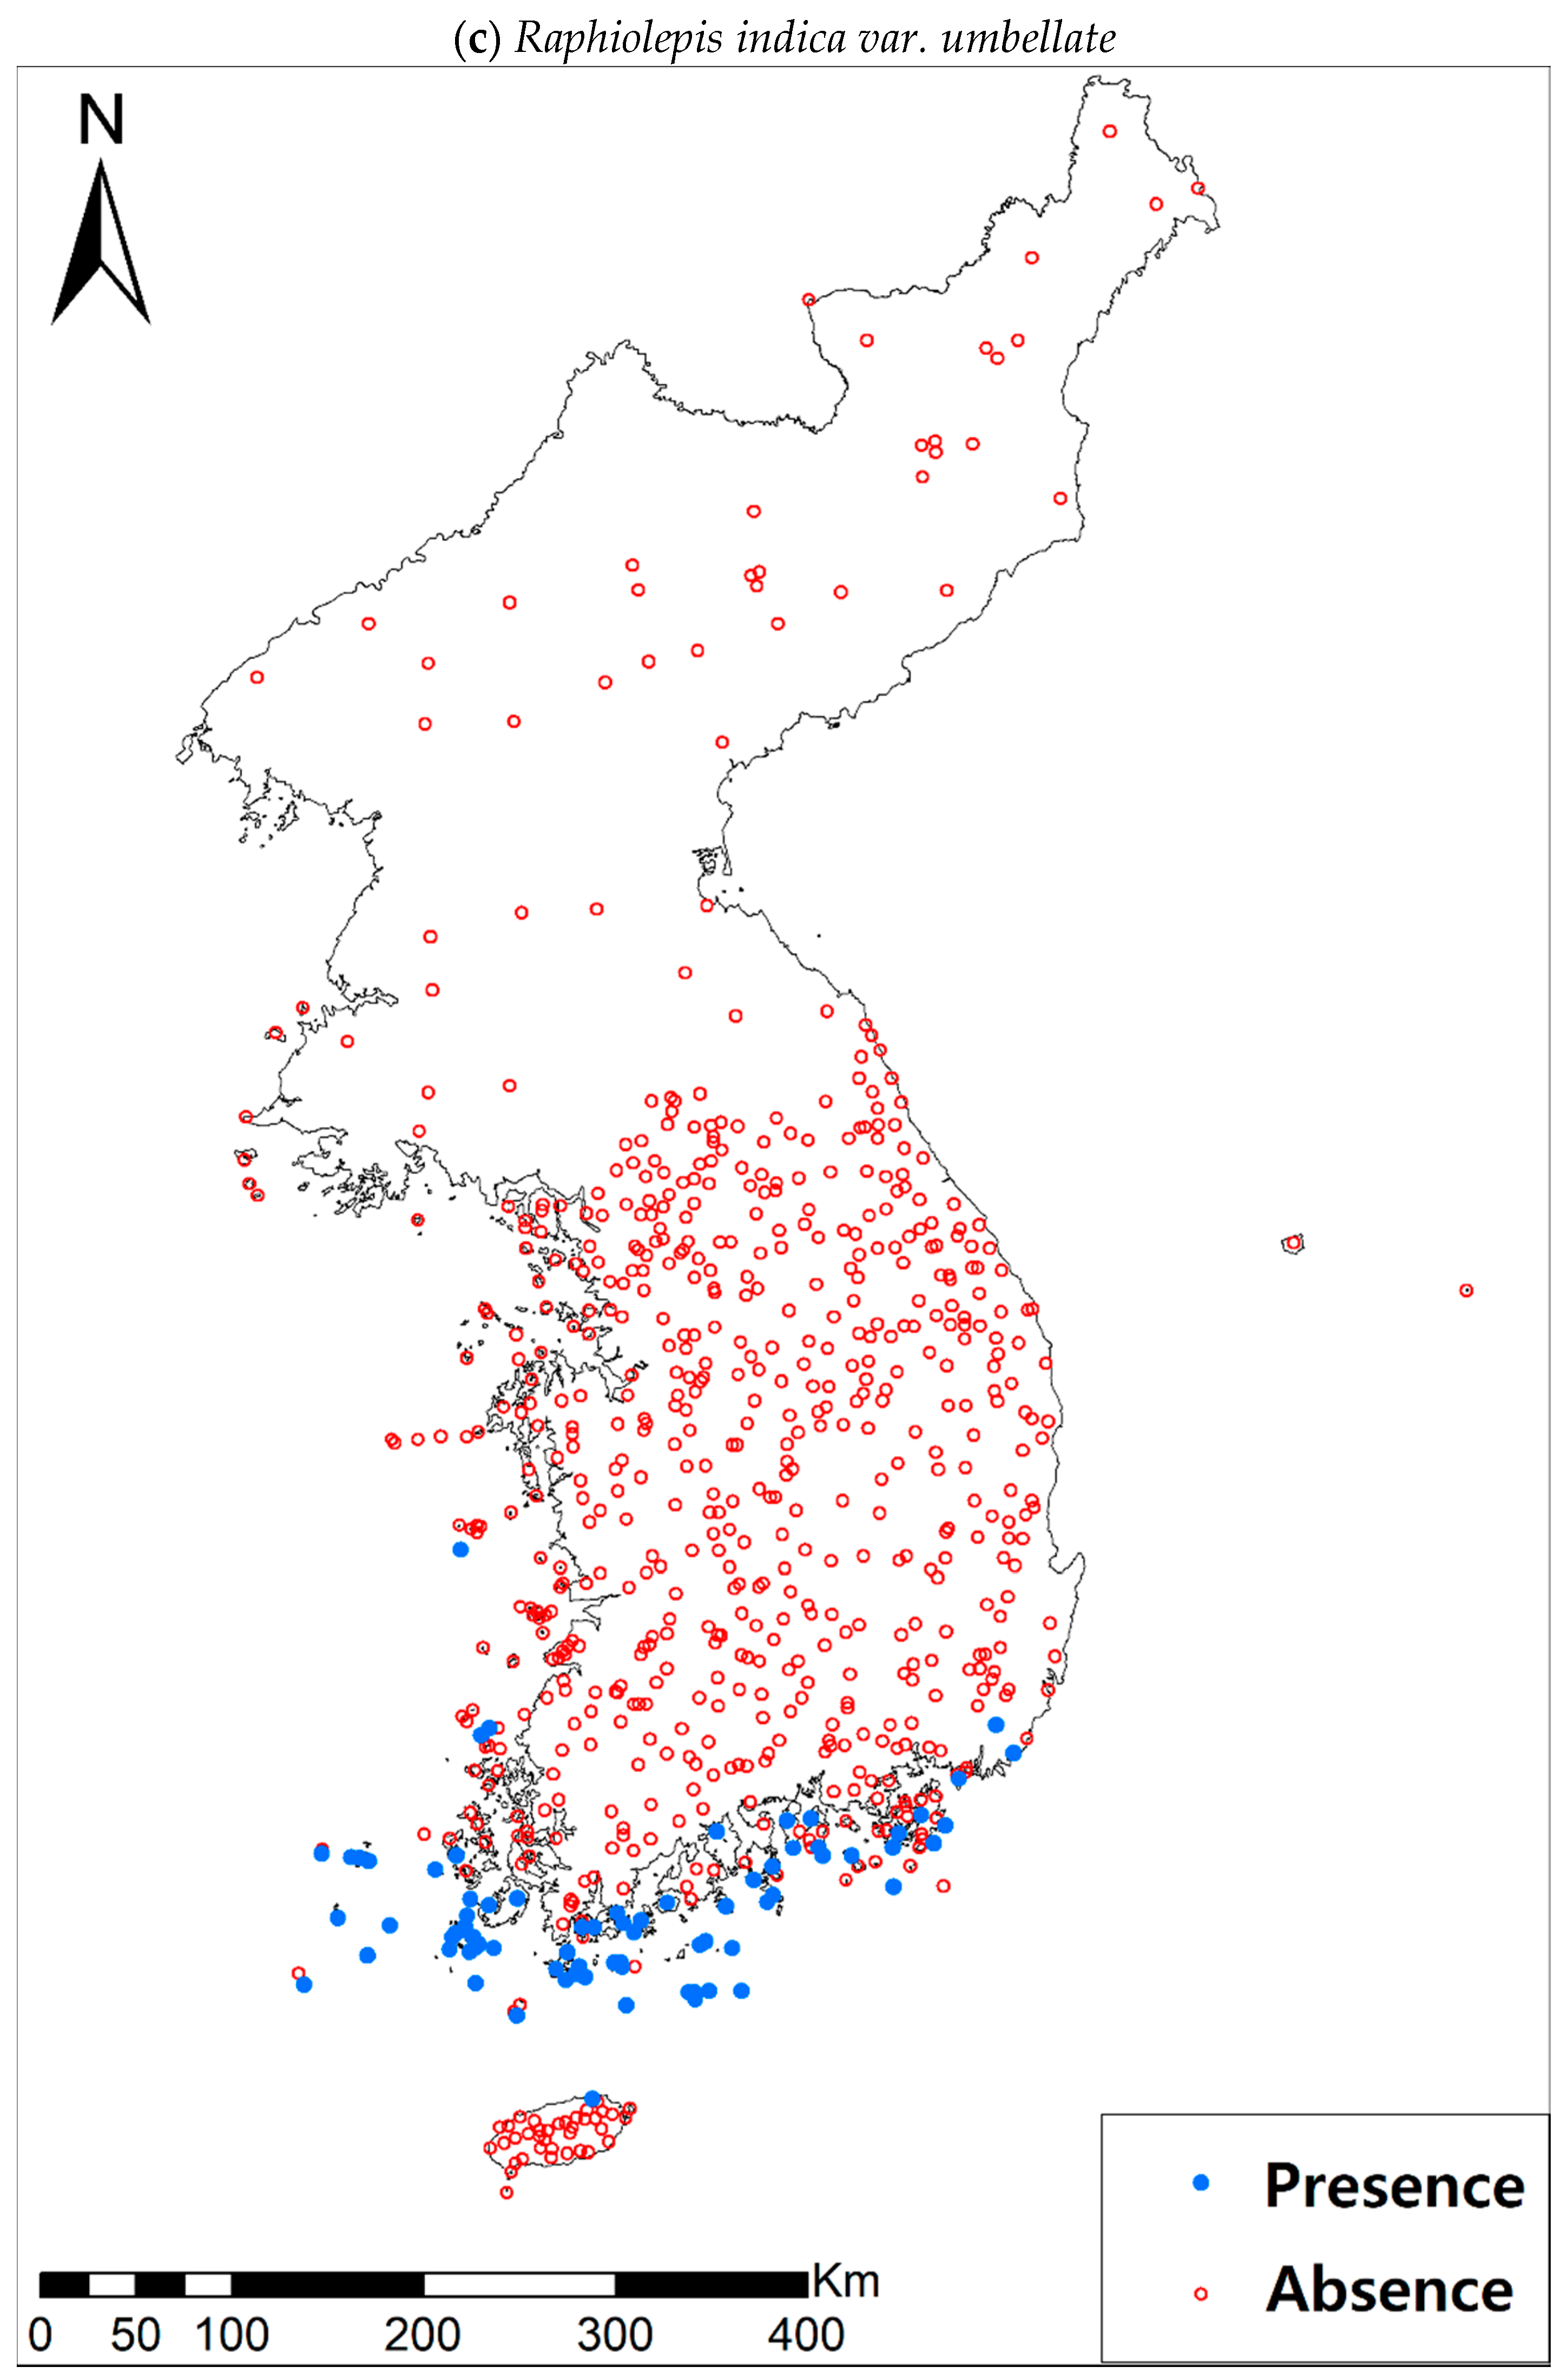
Presence/absence data of eight evergreen broadleaved plants (Table 1a, Figure A1) at 722 sites were obtained from previous studies [47,48] and the Korea National Arboretum (http://www.nature.go.kr/index.jsp). The presence/absence data were estimated from flora reports investigated by qualified botanists and taxonomists. In particular, in the case of the ROK sites, the experts visited each sampling site and generated a complete list of plants for the plots of ca. 25 m by 25 m or 10 m by 10 m in size; therefore, these data can be considered to be the presence/absence data for the SDM modeling. The distances between the sampling points were at least 2 km, with most distances being longer than 5 km.
2.2. Climatic Variables
Bioclimatic variables showed strong inter-correlations [49]. Therefore, we tested correlations on pairs of bioclimatic variables using Pearson’s r and selected five variables out of six variables showing weak correlations among them (r < 0.7): BIO1, BIO2, BIO12, BIO13, and BIO14 (Table 1b, Table A1, see Koo et al. (2015) for further details on the variable selection) [49]. Although BIO3, Isothermality (BIO2/Temperature Annual Range) (* 100), showed weak correlations with the selected variables, we did not use it, because when we tested its spatial variation from the south to the north, it did not reflect an important climatic characteristic of the KP, a clear climatic variation from the south (warm-temperate, maritime climate) to the north (cold-temperate, continental climate). Little ecophysiological research has explained climatic niches for the eight study species; therefore, the five variables were selected based on the climatic conditions of their current habitats and common ecophysiology of KP plants. The eight study species are currently distributed in the southwestern and southern coastal areas on the KP [42]. These areas have a warm and humid climate with narrow daily and annual temperature ranges (http://www.kma.go.kr/weather/climate/average_south.jsp). BIO1, BIO2, and BIO12 explain those climatic conditions well. In addition, the KP has frequently shown severe drought stresses during spring and heavy rains during summer (http://www.kma.go.kr/weather/climate/average_south.jsp). Plants of the KP are very sensitive to such weather disturbances, explained by BIO14 and BIO13.
We used the current and future bioclimatic data provided within the WorldClim Dataset (http://www.worldclim.org/), with a 30 arc-seconds (ca. 1 km2) spatial resolution. The current climate was the average for the period of 1950 to 2000. The future climates in 2050 and 2070 were the averages for the period of 2041 to 2060 and 2061 to 2080, respectively. We employed a total of 20 climate change scenarios to predict the potential future distributions of the eight study species (Table 1a) for the given period, 2050 and 2070. The 20 climate change scenarios consisted of five global circulation models (GCMs) (Table 1c) and four representative concentration pathways (RCPs). The Fifth Coupled Model Intercomparison Project (CMIP5) included those GCMs in projecting future global climate conditions, which were included in the Fifth Assessment Report (AR5) of the IPCC (http://cmip-pcmdi.llnl.gov/cmip5/availability.html). Each RCP presents a radiative forcing target level for the end of the 21st century: RCP 2.6 presents 2.6 W/m2 (=~490 ppm CO2), RCP 4.5 4.5 W/m2 (=~650 ppm CO2), RCP 6.0 6.0 W/m2 (=~850 ppm CO2), and RCP 8.5 8.5 W/m2 (=~1370 ppm CO2) [50].
2.3. Species Distribution Modeling and Model Evaluation
Diverse ensemble modelling methods, such as multi-model inference, model-averaging methods, and weighted ensemble methods, have been developed for robust SDM projections [27,28,38,51,52]. We employed nine modelling algorithms [27] for a weighted ensemble forecast [53]. In previous studies, the weighted ensemble approach best accounted for the species distributions [53]. The nine modelling algorithms were the generalized linear model (GLM) [54], generalized boosted model (GBM) [55], generalized additive model (GAM) [56], classification tree model (CTA) [57], artificial neural network (ANN) [58], surface range envelope (SRE) [59], flexible discriminant analysis (FDA) [60], random forest (RF) [61], and multivariate adaptive regression splines (MARS) [62]. First, we implemented a random 7:3 split procedure 10 times to divide up the data into training sets and testing sets, respectively, which reduces the uncertainty stemming from the data-split process [63]. The training sets were used in the individual SDM developments for each study species, and sensitivity and specificity, as well as overall model performance, were validated with the testing sets [63]. The 10 data-split processes produced a total of 90 SDMs for each species.
The SDMs predicted habitat suitability for each plant presented by the probability of occurrence under the assumption of perfect detection at survey sites and that a suitable habitat could be reached. Model performances of SDMs were evaluated with the true skill statistic (TSS) [64]. TSS has been used for assessing the predictive accuracy of SDMs, as it retains the advantages of AUC and Kappa, but compensates for their inherent issues [64,65]. This measure of SDM performance should not be affected by prevalence, but accounts for sensitivity, the proportion of observed occurrences correctly predicted by SDMs, and specificity, the proportion of observed absences correctly predicted by SDMs [63,64]. However, Kappa has been shown to depend on prevalence [64]. AUC equally accounts for sensitivity and specificity without the prevalence dependence, but relies on the geographical extents and spatial patterns of target species [65]. With an increase of the geographical extent outside the current range, the AUC values also increase [65]. Thus, model performances for the species showing very restricted geographical distributions and unbalanced presence/absence data, such as our study species, can be overestimated by AUC and underestimated by Kappa. Next, the SDM projections with TSS values above 0.7, which indicates good model performance [66,67], were combined to provide the ensemble forecasts. The ensemble forecasts were calculated based on Equation (1). The projections of individual models were weighted by the TSS values, added up, and divided by the sum of TSS values. Then, model performances of ensemble projections were also evaluated with the TSS values using the full dataset. Species distribution modelling and the TSS analysis were performed in R using the biomod2 package [39].
where i indicates individual SDMs, Pi is the probability of occurrence for the species calculated by model i, TSSi represents the TSS statistics for the projection of model i, and PTWE is the ensemble layer for each study species.
2.4. Changes in Habitat Suitability under Climate Change
The habitat suitability of all species was classified into five classes using Jenks Natural Break classification of ArcMap 10.2 (http://www.esri.com/software/arcgis/arcgis-for-desktop), and suitability maps were converted to presence-absence maps using species-specific thresholds. The TSS values were calculated across the range of possible thresholds. Then, the probability of occurrence at which the TSS value was maximized was selected as a threshold for each species (equivalent to maximizing the sum of sensitivity and specificity) [68], one of the best methods to minimize commission and omission errors [69,70]. A total of 20 suitability maps were projected under 20 climate change scenarios for each species for the given period, 2050 and 2070. The 20 projections were averaged for an ensemble projection. In the next step, the ensemble habitat suitability map was classified into five classes based on the classes used for the current habitat suitability map and converted to a binary map, a presence-absence map, completed at the threshold used for the current binary map.
The effects of climate change on the distributions of study species were assessed by analyzing the percent change of areas, accounting for expanding patterns of the range of each species, and comparing the current spatial patterns of habitat suitability classes with the future patterns.
3. Results
3.1. Model Performance and Current Distribution Patterns
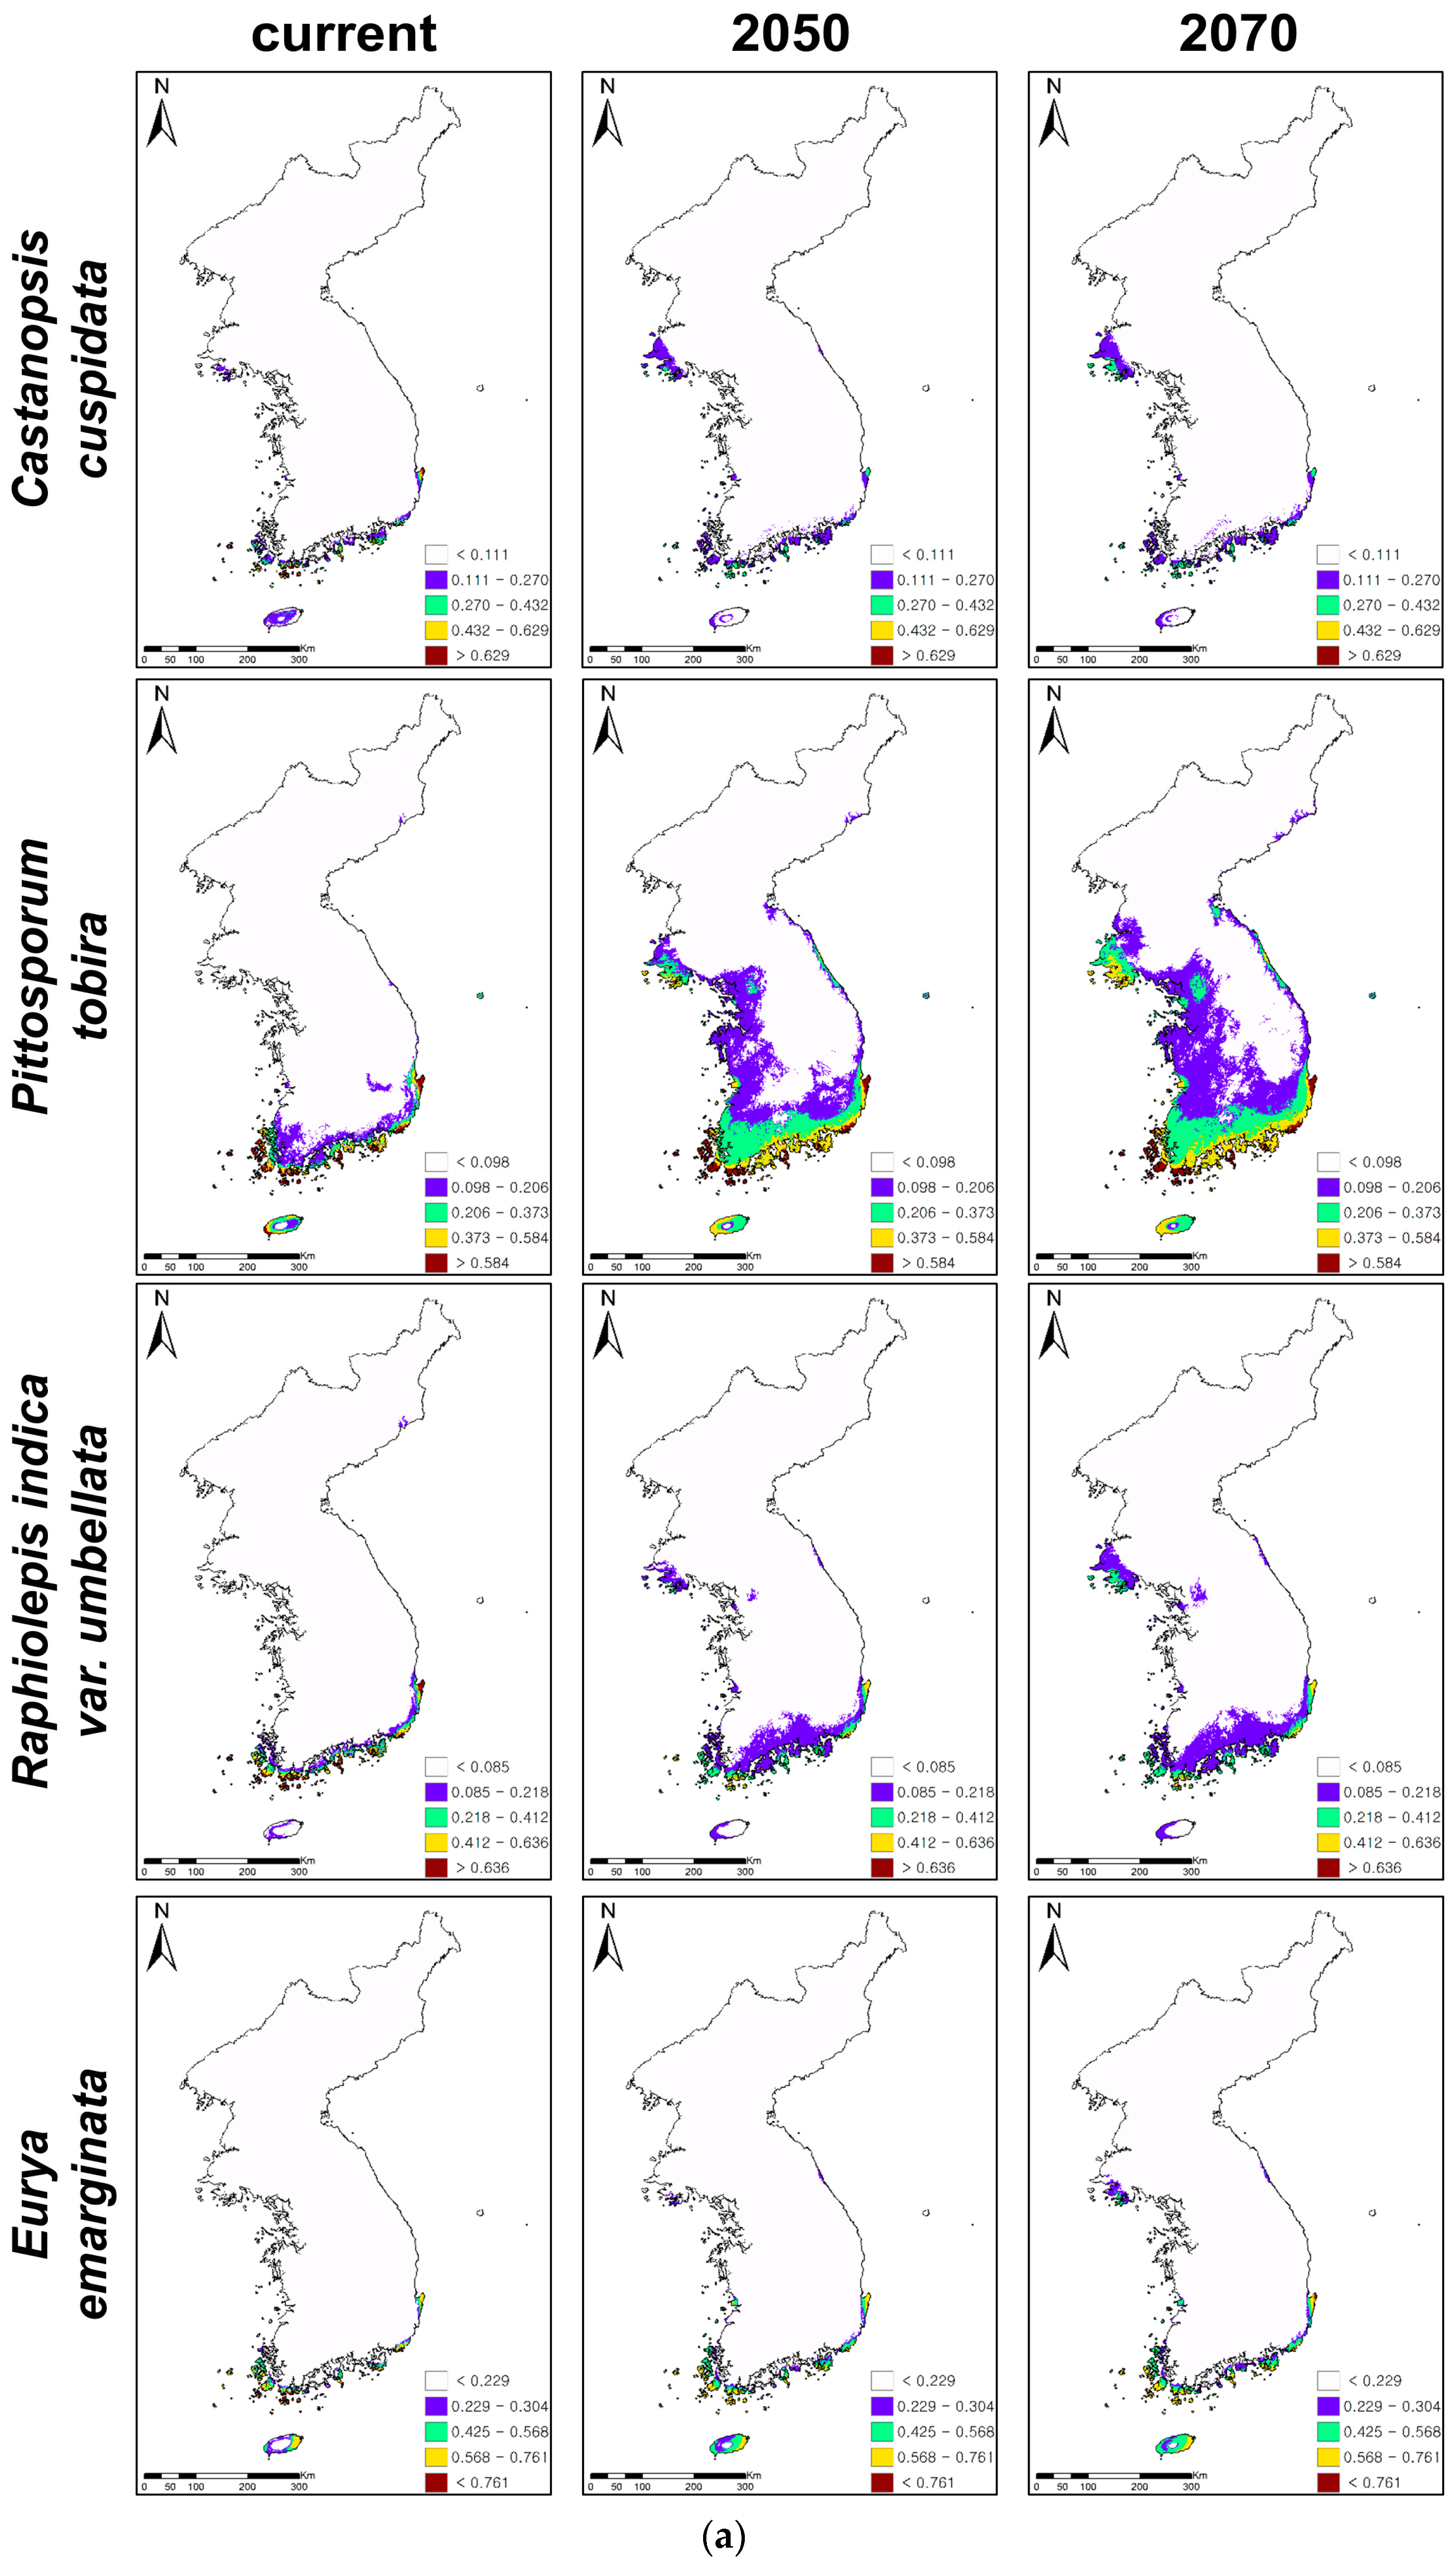
The ensemble forecasts were produced by combining individual projections with TSS values above 0.7. The threshold value of each species determined by the maximum TSS indicated the range of each evergreen (Table 2, Figure 2). The areas with a white color on the maps indicate the non-suitable habitats of all evergreens, while those with other colors highlight their climatically suitable habitats (Figure 2). The predictive accuracies of ensemble forecasts were excellent (TSS > 0.85, Table 2) for all evergreens, except for Neolitsea sericea (TSS = 0.79). The consensus projections showed that the climatically suitable habitats of most evergreens were mainly distributed in the coastal areas and on the islands of the southern and southwestern parts of the KP under current climate conditions (Figure 2). However, the suitable habitats of Pittosporum tobira were projected at the inland areas, as well as coastal areas and the islands in the southern KP (Figure 2a).
3.2. Future Distributions of Suitable Habitats for Warm-Adapted Evergreens under Climate Changes
While C. cuspidata, P. tobira, R. indica var. umbellata, and E. emarginata showed northward expansions of climatically suitable habitats, the remaining four evergreens, i.e., K. japonica, N. sericea, I. integra, and D. morbifera, presented contractions of habitats under climate changes (Table 3, Figure 2). P. tobira showed the greatest change of suitable habitats (261% increase in 2050 and 390% increase in 2070) under climate change, while K. japonica presented the least change (12% decrease in 2050 and 7% decrease in 2070). P. tobira also showed the rapidest northward and inland expansions, while C. cuspidata presented the slowest northward expansion (41% increase in 2050 and 76% increase in 2070). Furthermore, D. morbifera showed the greatest decrease of climatically suitable habitats under climate change (90% decrease in 2050 and 89% decrease in 2070). However, K. japonica presented the least loss of suitable habitats.
The predictions suggested that the climatically suitable habitats of C. cuspidata, P. tobira, R. indica var. umbellata, and E. emarginata would generally expand to the north along with the west coastal areas (Figure 2a,b). In particular, P. tobira and R. indica var. umbellata would expand from the coastal to the inland areas and from the south to the north along with the east coastal areas, as well as the west coast. On the other hand, even though C. cuspidata, R. indica var. umbellate, and E. emarginata showed potential expansions of suitable habitats under climate change, the highly suitable habitats (red-colored areas on the maps, Figure 2a) of three evergreens all declined, so there are no red colored habitats in the southwestern islands and coastal areas.
The climatically suitable habitats of K. japonica, N. sericea, I. integra, and D. morbifera contracted, and their habitats were mostly found on the islands of the southern KP (Figure 2b). High and medium suitable habitats (red- and yellow-colored areas on the maps, Figure 2b) were rarely observed for the four declining evergreens. D. morbifera showed particularly huge habitat contractions in 2050 and 2070, showing that only low suitable habitats (purple-colored areas) remained on the islands of the southern parts of the KP. On the other hand, the total habitat areas and highly suitable habitats of K. japonica and N. sericea decreased, while their low suitable habitats on the mid-west coast expanded. In addition, despite its low suitability, the island in the east, Ulleungdo, became and remained suitable for I. integra and N. sericea, respectively.
4. Discussion
The climatically suitable habitats of warm-adapted plants have been expected to shift or expand under a warming climate [8,42,44]. Such a positive expectation has led to little scholarly and managemental interest in the effects of climate change on warm-adapted plants, especially in the ROK. However, our results suggested that it depended on the species, showing that the suitable habitats of four evergreen trees would expand to the northern part of the KP, while the remaining four evergreens would decline (Figure 2). In addition, the rates of expansion and decline were very species-specific. In particular, the projections suggested that D. morbifera had the highest vulnerability to a warming climate, showing that only ca. 10% of its climatically suitable habitats would remain in 2050 and 2070. D. morbifera has been an economically important species that provides sources for traditional medicines for multiple diseases in the ROK [71]. Therefore, the habitat loss of D. morbifera will cause significant economic loss in ROK. It was expected that the distribution of D. morbifera was limited by low temperature; therefore, a warming climate could provide better habitats for D. morbifera [72]. However, our predictions were the reverse, and previous ecophysiological research also supported the possible habitat loss of this species under a warming climate because this species had a low genetic diversity [73] and preferred shading conditions and a sufficient pre-chilling period to produce superb seedlings [74].
Regardless of whether the climatically suitable habitats of eight evergreen plants would expand or contract, their highly suitable habitats, except for P. tobira, would commonly decline according to climate change (Figure 2). In particular, the high and medium suitability of K. japonica, N. sericea, I. integra, and D. morbifera (red- and yellow-colored areas on the maps, Figure 2b) was rarely observed on the maps. This indicates habitat degradations within the distribution boundary of all evergreen species under climate changes, which may restrict their habitat expansions and accelerate the corresponding habitat contractions under further climate change. Such habitat degradation could imply the potential loss of diversity of native warm-adapted evergreen trees in the southern KP under continuous and accelerated climate change. Similarly, other studies have also reported habitat and biodiversity loss, as well as an increase in the extinction risk of warm-adapted plants due to habitat degradation as a result of climate change [4,5,6,9,10,11]. For example, research on the climate-related range shifts of evergreen broadleaved trees in the Taiwan-Japan archipelago yielded a similar result, i.e., the potential habitat degradations of evergreens within the distributional boundary under climate change [12].
The coldness index and the mean temperature of the coldest month have been used to account for the northern and upper distributional limits of warm-adapted evergreens [7,12,75,76,77,78]. Previous research using the coldness index and the minimum temperature conditions predicted the expansions and shifts of future habitats for warm-adapted evergreen trees [7,12,42,75,76,77,78]. Therefore, the climatic factors used for predictions, the coldness index and the minimum temperature, may account for the difference between our predictions and the previous ones. However, recent studies have suggested that the coldness index and cold temperature conditions might not explain the northern range limit of warm-adapted evergreen broadleaved trees [76,79]. Rather, cold temperature conditions during winter (chilling requirement) are necessary for the next year’s growth of warm-adapted evergreens [74,80,81]. Temperature-related stresses on plant distribution and growth were found to be closely related to the level of water availability [82,83]. Therefore, precipitation could be a major climatic factor that controls the distribution of warm-adapted evergreens, and temperature a minor factor [5,76,83]. In addition, extreme climatic conditions, such as drought, flooding, and thermal stresses, are particularly important when explaining plant distributions, as they control the survival and growth rates of seedlings and saplings as well as adults [84]. The bioclimatic variables widely used by many species distribution studies account for those climatic conditions well. In particular, the five bioclimatic variables used in the present study aptly describe spatial and seasonal variability of the KP climate in relation to plant survival and growth. Climatic extremes, including drought stresses in spring and heavy rainfalls in summer, were particularly well explained by BIO13 and 14. Therefore, our predictions could better describe the climatically suitable habitats for the eight study species.
The current suitable habitat of each plant could be appropriately projected by a simple correlation between climatic factors and species occurrences. However, we are aware that our model predictions in the future have several limitations due to the lack of: (1) ecological and evolutionary research on the study species; and (2) information on other environmental changes related to climate change, such as sea-level rise, and land-use change. Due to the dynamic responses of plants to a changing climate, such simple correlations may not account for the future distribution of climatically suitable habitats for plants [49,85]. Much evolutionary research has addressed the issue of how modern populations of plants have adapted to current local climatic conditions, which confined the responses of plants to climate change in their local habitats [86,87,88,89,90,91,92]. Therefore, due to diverse site-specific plant responses to the climate, regional scale predictions of climate-related range shifts may not appropriately forecast the plants’ future climatically suitable habitats. Land-use change, including coastal developments for recreation, tourism, residential areas, and agricultural lands, directly removes suitable habitats for the coastal evergreens and indirectly decreases their suitable habitats via many and varied ways, such as introducing invasive species and soil pollution [93,94]. In particular, huge coastal flats were converted to lands in the western KP to secure agricultural lands, which has caused many coastal organisms, including coastal plants, bivalves, and seabirds, to lose their habitats [95]. Sea-level rise, resulting in the direct habitat loss of coastal evergreens, was found to range from 0.347 mm/year in the mid-eastern KP to 5.030 mm/year in the southern KP [96]. Accelerated sea-level rise in the future will increase the habitat loss of the four declining coastal evergreens (Figure 2b) and restrict the habitat expansions of the other four coastal evergreens (Figure 2a) in the KP.
Despite the limitations mentioned, considering the lack of studies investigating the effects of climate change on warm-adapted evergreen plants due to a positive expectation [8,42,44], this study is valuable at the current stage by providing reasons why we need: (1) climate change-related studies for warm-adapted plant species by showing the possible negative effects of climate change on the study species; (2) conservation planning and policy making for the warm-adapted species such as D. morbifera, which are highly vulnerable to climate change, e.g., finding alternative habitats and designating conservation and restricted development areas for a vulnerable species; and (3) management planning for the expanding species, e.g., P. tobira, which could invade a temperate forest and cause changes in the ecological function and process of temperate forest ecosystems. In addition, this research suggests that further ecological and evolutionary studies for the study species at local scales and the development of a long-term environmental database are necessary for better model predictions, especially in the ROK.
5. Conclusions
In this study, we predicted the potential range of eight coastal evergreen broadleaved trees in the KP under climate change. Four out of eight evergreens showed habitat expansions, while the other four presented habitat contractions. Regardless of whether their climatically suitable habitats would increase or decrease, habitat degradation was predicted within the distribution boundary for all eight evergreens. Such habitat degradation may restrict habitat expansions of the four expanding evergreens and accelerate habitat contractions for the declining evergreens under further climate change. However, our predictions may have limitations due to not considering other environmental factors and diverse responses of those trees to a changing climate. In particular, sea-level rise will cause huge habitat loss of those species, especially when considering the declining evergreens. Therefore, further ecological research that considers other environmental changes is necessary. However, despite the mentioned limitations, our research provides basic knowledge for understanding the climate change effects on the climatically suitable habitats of coastal warm-adapted evergreen trees in the KP. Taken together, the results of the present study give primary information for conservation planning of coastal vegetation, especially in the KP.
Supplementary Materials
Supplementary File 1Acknowledgments
This work was supported by Korea Environment Institute, “National Biodiversity Strategy and CBD National Report Project (Project No.: 201700504C77-00)” funded by the Ministry of Environment, the Republic of Korea.
Author Contributions
K.A.K. conceived and designed the whole research; S.U.P. performed the simulations; K.A.K. and S.U.P. analyzed the results; S.U.P. and C.S. contributed materials and analysis tools; K.A.K. wrote the paper.
Conflicts of Interest
The authors declare no conflict of interest.
Appendix A
Figure A1.
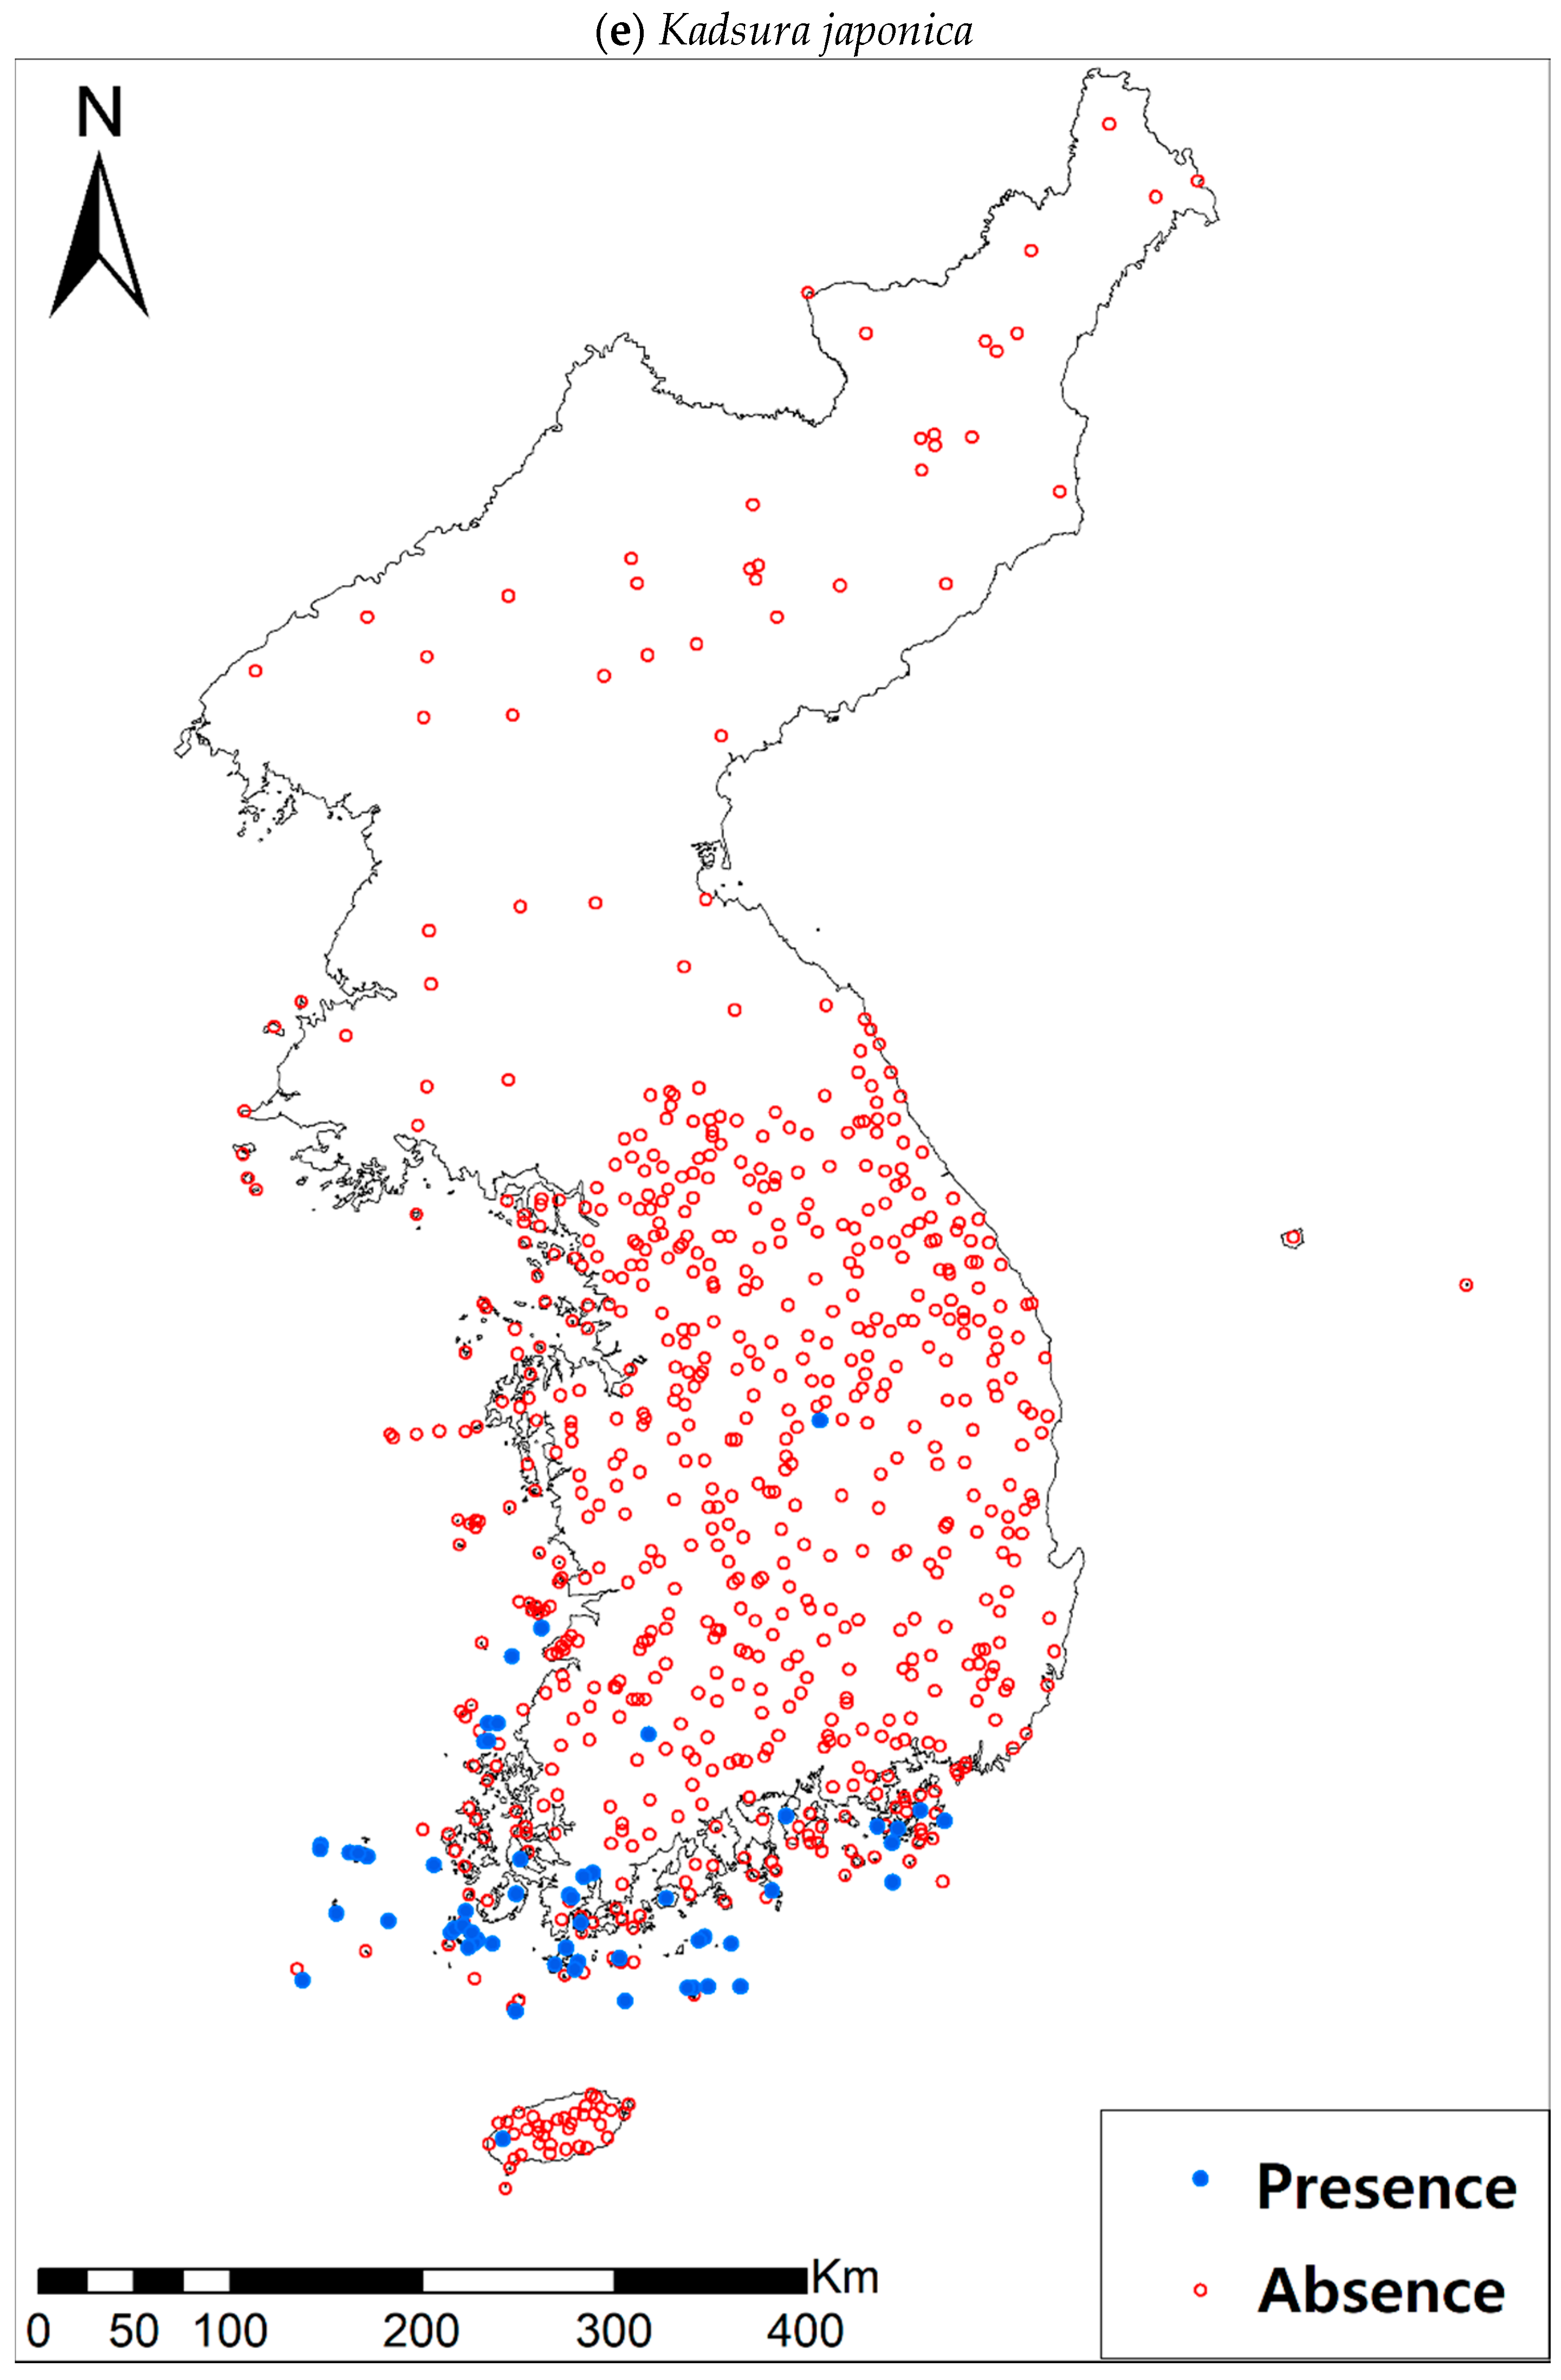
Presence/absence maps for the eight study species. For political reasons, we had no access to 52 sites in DPRK. Obviously, such spatially uneven samples and the lack of DPRK data could have negatively influenced the ability of SDM predictions [34]. However, we consider that it should not be a critical issue for modelling the climatically suitable habitats of eight coastal plants due to the lack of possibility that those species naturally occur in DPRK. Those species have been distributed in the southern coastal areas and showed a strong preference for warm and humid habitat conditions [42,97]. Therefore, colder and drier inland climate of DPRK could not account for the climatic niches of those plants. In addition, the 52 sites of DPRK represent the alpine and subalpine areas that are not found in ROK. Therefore, including those DPRK data are helpful in terms of considering the full range of the KP climatic conditions in modelling current and future distributions of the eight evergreens on the KP.
Figure A1.
Presence/absence maps for the eight study species. For political reasons, we had no access to 52 sites in DPRK. Obviously, such spatially uneven samples and the lack of DPRK data could have negatively influenced the ability of SDM predictions [34]. However, we consider that it should not be a critical issue for modelling the climatically suitable habitats of eight coastal plants due to the lack of possibility that those species naturally occur in DPRK. Those species have been distributed in the southern coastal areas and showed a strong preference for warm and humid habitat conditions [42,97]. Therefore, colder and drier inland climate of DPRK could not account for the climatic niches of those plants. In addition, the 52 sites of DPRK represent the alpine and subalpine areas that are not found in ROK. Therefore, including those DPRK data are helpful in terms of considering the full range of the KP climatic conditions in modelling current and future distributions of the eight evergreens on the KP.


Table A1.
The results of Pearson’s correlation analyses between bioclimatic variables.
| Bio1 | Bio2 | Bio3 | Bio4 | Bio5 | Bio6 | Bio7 | Bio8 | Bio9 | Bio10 | Bio11 | Bio12 | Bio13 | Bio14 | Bio15 | Bio16 | Bio17 | Bio18 | |
|---|---|---|---|---|---|---|---|---|---|---|---|---|---|---|---|---|---|---|
| Bio2 | −0.52 | |||||||||||||||||
| Bio3 | −0.02 | 0.61 | ||||||||||||||||
| Bio4 | −0.72 | 0.79 | 0.02 | |||||||||||||||
| Bio5 | 0.93 | −0.24 | 0.04 | −0.43 | ||||||||||||||
| Bio6 | 0.95 | −0.7 | −0.08 | −0.89 | 0.79 | |||||||||||||
| Bio7 | −0.68 | 0.87 | 0.16 | 0.99 | −0.39 | −0.87 | ||||||||||||
| Bio8 | 0.96 | −0.34 | −0.01 | −0.52 | 0.99 | 0.85 | −0.48 | |||||||||||
| Bio9 | 0.96 | −0.65 | −0.03 | −0.86 | 0.81 | 0.99 | −0.84 | 0.86 | ||||||||||
| Bio10 | 0.96 | −0.36 | 0 | −0.54 | 0.97 | 0.85 | −0.5 | 0.98 | 0.87 | |||||||||
| Bio11 | 0.98 | −0.63 | −0.03 | −0.85 | 0.84 | 0.99 | −0.82 | 0.89 | 0.99 | 0.89 | ||||||||
| Bio12 | 0.07 | −0.09 | 0.34 | −0.35 | −0.1 | 0.14 | −0.29 | −0.07 | 0.19 | 0.19 | 0.15 | |||||||
| Bio13 | −0.24 | 0.5 | 0.27 | 0.43 | −0.12 | −0.38 | 0.48 | −0.18 | −0.33 | −0.33 | −0.32 | 0.57 | ||||||
| Bio14 | 0.18 | −0.43 | 0.06 | −0.58 | −0.07 | 0.36 | −0.59 | 0 | 0.32 | 0.32 | 0.31 | 0.53 | −0.09 | |||||
| Bio15 | −0.45 | 0.72 | 0.05 | 0.88 | −0.17 | −0.68 | 0.88 | −0.26 | −0.63 | −0.63 | −0.61 | −0.16 | 0.67 | −0.69 | ||||
| Bio16 | −0.18 | 0.32 | 0.37 | 0.13 | −0.19 | −0.23 | 0.19 | −0.21 | −0.16 | −0.16 | −0.19 | 0.85 | 0.89 | 0.16 | 0.37 | |||
| Bio17 | 0.34 | −0.55 | 0.07 | −0.75 | 0.06 | 0.53 | −0.75 | 0.14 | 1 | 0.5 | 0.48 | 0.58 | −0.16 | 0.95 | −0.8 | 0.14 | ||
| Bio18 | −0.24 | 0.41 | 0.4 | 0.24 | −0.21 | −0.31 | 0.3 | −0.24 | −0.25 | −0.25 | −0.26 | 0.79 | 0.93 | 0.12 | 0.45 | 0.98 | 0.07 | |
| Bio19 | 0.27 | −0.54 | 0.06 | −0.72 | −0.01 | 0.47 | −0.72 | 0.07 | 0.45 | 0.45 | 0.42 | 0.6 | −0.14 | 0.95 | −0.78 | 0.16 | 0.98 | 0.1 |
References
- Alamgir, M.; Mukul, S.A.; Turton, S.M. Modelling spatial distribution of critically endangered asian elephant and hoolock gibbon in Bangladesh forest ecosystems under a changing climate. Appl. Geogr. 2015, 60, 10–19. [Google Scholar] [CrossRef]
- Parmesan, C.; Yohe, G. A globally coherent fingerprint of climate change impacts across natural systems. Nature 2003, 421, 37–42. [Google Scholar] [CrossRef] [PubMed]
- Lenoir, J.; Svenning, J.C. Climate-related range shifts—A global multidimensional synthesis and new research directions. Ecography 2015, 38, 15–28. [Google Scholar] [CrossRef]
- Costion, C.M.; Simpson, L.; Pert, P.L.; Carlsen, M.M.; Kress, W.J.; Crayn, D. Will tropical mountaintop plant species survive climate change? Identifying key knowledge gaps using species distribution modelling in Australia. Biol. Conserv. 2015, 191, 322–330. [Google Scholar] [CrossRef]
- Feeley, K.J.; Davies, S.J.; Perez, R.; Hubbell, S.P.; Foster, R.B. Directional changes in the species composition of a tropical forest. Ecology 2011, 92, 871–882. [Google Scholar] [CrossRef] [PubMed]
- Feeley, K.J.; Silman, M.R.; Bush, M.B.; Farfan, W.; Cabrera, K.G.; Malhi, Y.; Meir, P.; Revilla, N.S.; Quisiyupanqui, M.N.R.; Saatchi, S. Upslope migration of Andean trees. J. Biogeogr. 2011, 38, 783–791. [Google Scholar] [CrossRef]
- Nakao, K.; Matsui, T.; Horikawa, M.; Tsuyama, I.; Tanaka, N. Assessing the impact of land use and climate change on the evergreen broad-leaved species of quercus acuta in japan. Plant Ecol. 2011, 212, 229–243. [Google Scholar] [CrossRef]
- Klötzli, F.; Walther, G.-R. Recent Vegetation Shifts in Switzerland. In Conference on Recent Shifts in Vegetation Boundaries of Deciduous Forests, Especially Due to General Global Warming; Springer: Berlin, Germany, 1999; pp. 15–29. [Google Scholar]
- Colwell, R.K.; Brehm, G.; Cardelús, C.L.; Gilman, A.C.; Longino, J.T. Global warming, elevational range shifts, and lowland biotic attrition in the wet tropics. Science 2008, 322, 258–261. [Google Scholar] [CrossRef] [PubMed]
- Feeley, K.J. Distributional migrations, expansions, and contractions of tropical plant species as revealed in dated herbarium records. Glob. Chang. Biol. 2012, 18, 1335–1341. [Google Scholar] [CrossRef]
- Feeley, K.J.; Malhi, Y.; Zelazowski, P.; Silman, M.R. The relative importance of deforestation, precipitation change, and temperature sensitivity in determining the future distributions and diversity of amazonian plant species. Glob. Chang. Biol. 2012, 18, 2636–2647. [Google Scholar] [CrossRef]
- Nakao, K.; Higa, M.; Tsuyama, I.; Lin, C.-T.; Sun, S.-T.; Lin, J.-R.; Chiou, C.-R.; Chen, T.-Y.; Matsui, T.; Tanaka, N. Changes in the potential habitats of 10 dominant evergreen broad-leaved tree species in the Taiwan-Japan archipelago. Plant Ecol. 2014, 215, 639–650. [Google Scholar] [CrossRef]
- Wright, S.J.; Muller-Landau, H.C.; Schipper, J. The future of tropical species on a warmer planet. Conserv. Biol. 2009, 23, 1418–1426. [Google Scholar] [CrossRef] [PubMed]
- Koo, K.A.; Kong, W.-S.; Park, S.U.; Lee, J.H.; Kim, J.; Jung, H. Sensitivity of Korean fir (Abies koreana wils.), a threatened climate relict species, to increasing temperature at an island subalpine area. Ecol. Model. 2017, 353, 5–16. [Google Scholar] [CrossRef]
- Osland, M.J.; Enwright, N.M.; Day, R.H.; Gabler, C.A.; Stagg, C.L.; Grace, J.B. Beyond just sea-level rise: Considering macroclimatic drivers within coastal wetland vulnerability assessments to climate change. Glob. Chang. Biol. 2016, 22, 1–11. [Google Scholar] [CrossRef] [PubMed]
- Alongi, D.M. The impact of climate change on mangrove forests. Curr. Clim. Chang. Rep. 2015, 1, 30–39. [Google Scholar] [CrossRef]
- Valle, M.; Chust, G.; del Campo, A.; Wisz, M.S.; Olsen, S.M.; Garmendia, J.M.; Borja, Á. Projecting future distribution of the seagrass Zostera noltii under global warming and sea level rise. Biol. Conserv. 2014, 170, 74–85. [Google Scholar] [CrossRef]
- McKee, K.; Rogers, K.; Saintilan, N. Response of salt marsh and mangrove wetlands to changes in atmospheric CO2, climate, and sea level. In Global Change and the Function and Distribution of Wetlands; Springer: Berlin, Germany, 2012; pp. 63–96. [Google Scholar]
- Di Nitto, D.; Neukermans, G.; Koedam, N.; Defever, H.; Pattyn, F.; Kairo, J.G.; Dahdouh-Guebas, F. Mangroves facing climate change: Landward migration potential in response to projected scenarios of sea level rise. Biogeosciences 2014, 11, 857. [Google Scholar] [CrossRef] [Green Version]
- Ward, R.; Burnside, N.; Joyce, C.; Sepp, K.; Teasdale, P. Improved modelling of the impacts of sea level rise on coastal wetland plant communities. Hydrobiologia 2016, 774, 203–216. [Google Scholar] [CrossRef]
- Armitage, A.R.; Highfield, W.E.; Brody, S.D.; Louchouarn, P. The contribution of mangrove expansion to salt marsh loss on the Texas Gulf Coast. PLoS ONE 2015, 10, e0125404. [Google Scholar] [CrossRef] [PubMed]
- Morris, J.T.; Sundareshwar, P.; Nietch, C.T.; Kjerfve, B.; Cahoon, D.R. Responses of coastal wetlands to rising sea level. Ecology 2002, 83, 2869–2877. [Google Scholar] [CrossRef]
- Garner, K.L.; Chang, M.Y.; Fulda, M.T.; Berlin, J.A.; Freed, R.E.; Soo-Hoo, M.M.; Revell, D.L.; Ikegami, M.; Flint, L.E.; Flint, A.L. Impacts of sea level rise and climate change on coastal plant species in the central California Coast. PeerJ 2015, 3, e958. [Google Scholar] [CrossRef] [PubMed]
- Baker, D.; Hartley, A.; Butchart, S.; Willis, S. Choice of baseline climate data impacts projected species’ responses to climate change. Glob. Chang. Biol. 2016, 22, 2392–2404. [Google Scholar] [CrossRef] [PubMed] [Green Version]
- Kearney, M.R.; Wintle, B.A.; Porter, W.P. Correlative and mechanistic models of species distribution provide congruent forecasts under climate change. Conserv. Lett. 2010, 3, 203–213. [Google Scholar] [CrossRef]
- Guisan, A.; Thuiller, W. Predicting species distribution: Offering more than simple habitat models. Ecol. Lett. 2005, 8, 993–1009. [Google Scholar] [CrossRef]
- Thuiller, W.; Lafourcade, B.; Engler, R.; Araújo, M.B. Biomod—A platform for ensemble forecasting of species distributions. Ecography 2009, 32, 369–373. [Google Scholar] [CrossRef]
- Hartley, S.; Harris, R.; Lester, P.J. Quantifying uncertainty in the potential distribution of an invasive species: Climate and the argentine ant. Ecol. Lett. 2006, 9, 1068–1079. [Google Scholar] [CrossRef] [PubMed]
- Wenger, S.J.; Som, N.A.; Dauwalter, D.C.; Isaak, D.J.; Neville, H.M.; Luce, C.H.; Dunham, J.B.; Young, M.K.; Fausch, K.D.; Rieman, B.E. Probabilistic accounting of uncertainty in forecasts of species distributions under climate change. Glob. Chang. Biol. 2013, 19, 3343–3354. [Google Scholar] [CrossRef] [PubMed]
- Pearson, R.G.; Thuiller, W.; Araújo, M.B.; Martinez-Meyer, E.; Brotons, L.; McClean, C.; Miles, L.; Segurado, P.; Dawson, T.P.; Lees, D.C. Model-based uncertainty in species range prediction. J. Biogeogr. 2006, 33, 1704–1711. [Google Scholar] [CrossRef]
- Barry, S.; Elith, J. Error and uncertainty in habitat models. J. Appl. Ecol. 2006, 43, 413–423. [Google Scholar] [CrossRef]
- Leitão, P.J.; Moreira, F.; Osborne, P.E. Effects of geographical data sampling bias on habitat models of species distributions: A case study with steppe birds in Southern Portugal. Int. J. Geogr. Inf. Sci. 2011, 25, 439–454. [Google Scholar] [CrossRef]
- Bystriakova, N.; Peregrym, M.; Erkens, R.H.; Bezsmertna, O.; Schneider, H. Sampling bias in geographic and environmental space and its effect on the predictive power of species distribution models. Syst. Biodivers. 2012, 10, 305–315. [Google Scholar] [CrossRef]
- Fourcade, Y.; Engler, J.O.; Rödder, D.; Secondi, J. Mapping species distributions with maxent using a geographically biased sample of presence data: A performance assessment of methods for correcting sampling bias. PLoS ONE 2014, 9, e97122. [Google Scholar] [CrossRef] [PubMed]
- Araújo, M.B.; New, M. Ensemble forecasting of species distributions. Trends Ecol. Evolut. 2007, 22, 42–47. [Google Scholar] [CrossRef] [PubMed]
- Hannemann, H.; Willis, K.J.; Macias-Fauria, M. The devil is in the detail: Unstable response functions in species distribution models challenge bulk ensemble modelling. Glob. Ecol. Biogeogr. 2016, 25, 26–35. [Google Scholar] [CrossRef]
- Qin, Z.; Zhang, J.E.; DiTommaso, A.; Wang, R.L.; Liang, K.M. Predicting the potential distribution of lantana camara l. Under rcp scenarios using isi-mip models. Clim. Chang. 2015, 134, 193–208. [Google Scholar] [CrossRef]
- Wang, T.; Wang, G.; Innes, J.; Nitschke, C.; Kang, H. Climatic niche models and their consensus projections for future climates for four major forest tree species in the Asia–pacific region. For. Ecol. Manag. 2016, 360, 357–366. [Google Scholar] [CrossRef]
- Thuiller, W.; Georges, D.; Engler, R.; Breiner, F. Package ‘Biomod2’: Ensemble Platform for Species Distribution Mdoeling, R Package Version 3.3-7. Available online: https://cran.r-project.org/web/packages/biomod2/index.html (accessed on 1 March 2016).
- Kong, W.-S.; Watts, D. The Plant Geography of Korea with an Emphasis on the Alpine Zones; Kluwer Academic: Dordrecht, The Netherlands, 1993. [Google Scholar]
- Kim, K.; Jeong, G.Y. Factors influencing natural occurrence of fluoride-rich groundwaters: A case study in the southeastern part of the korean peninsula. Chemosphere 2005, 58, 1399–1408. [Google Scholar] [CrossRef] [PubMed]
- Koo, K.; Kong, W.-S.; Kim, C.-K. Distribution of evergreen broad-leaved plants and climate factors. J. Korean Geogr. Soc. 2001, 36, 247–257. [Google Scholar]
- Yun, J.-H.; Nakao, K.; Kim, J.-H.; Kim, S.-Y.; Park, C.-H.; Lee, B.-Y. Habitat prediction and impact assessment of Neolitsea sericea (Blume) Koidz. under Climate Change in Korea. J. Environ. Impact Assess. 2014, 23, 101–111. [Google Scholar] [CrossRef]
- Yun, J.-H.K.; Jung, H.; Oh, K.-H.; Lee, B.-Y. Distributional change and climate condition of warm-temperate evergreen broad-leaved trees in Korea. Korean J. Environ. Ecol. 2011, 25, 47–56. [Google Scholar]
- Pachauri, R.K.; Allen, M.R.; Barros, V.; Broome, J.; Cramer, W.; Christ, R.; Church, J.; Clarke, L.; Dahe, Q.; Dasgupta, P. Climate Change 2014: Synthesis Report. Contribution of Working Groups I, II and III to the Fifth Assessment Report of the Intergovernmental Panel on Climate Change; IPCC: Geneva, Switzerland, 2014. [Google Scholar]
- Botts, E.A.; Erasmus, B.F.; Alexander, G.J. Small range size and narrow niche breadth predict range contractions in South African frogs. Glob. Ecol. Biogeogr. 2013, 22, 567–576. [Google Scholar] [CrossRef]
- Koo, K. Distribution of Evergreen Broad-Leaved Trees and Climate Factors in the Korean Peninsula. Master’s Thesis, Kyung Hee University, Seoul, Korea, 2000. [Google Scholar]
- Lee, W.C.Y.; Yang, J. Plant Geography with Special Reference to Korea; Kangwon National University Press: Chooncheon, Korea, 2002; p. 412. [Google Scholar]
- Koo, K.A.; Kong, W.-S.; Nibbelink, N.P.; Hopkinson, C.S.; Lee, J.H. Potential effects of climate change on the distribution of cold-tolerant evergreen broadleaved woody plants in the Korean peninsula. PLoS ONE 2015, 10, e0134043. [Google Scholar] [CrossRef] [PubMed]
- O’Donnell, M.S.; Ignizio, D.A. Bioclimatic Predictors for Supporting Ecological Applications in the Conterminous United States; US Geological Survey Data Series; USGS: Reston, VA, USA, 2012; Volume 691.
- Araújo, M.B.; Whittaker, R.J.; Ladle, R.J.; Erhard, M. Reducing uncertainty in projections of extinction risk from climate change. Glob. Ecol. Biogeogr. 2005, 14, 529–538. [Google Scholar] [CrossRef]
- Diniz-Filho, J.A.F.; Mauricio, B.L.; Fernando, R.T.; Loyola, R.D.; Hof, C.; Nogués-Bravo, D.; Araújo, M.B. Partitioning and mapping uncertainties in ensembles of forecasts of species turnover under climate change. Ecography 2009, 32, 897–906. [Google Scholar] [CrossRef]
- Marmion, M.; Parviainen, M.; Luoto, M.; Heikkinen, R.K.; Thuiller, W. Evaluation of consensus methods in predictive species distribution modelling. Divers. Distrib. 2009, 15, 59–69. [Google Scholar] [CrossRef]
- McCullagh, P.; Nelder, J.A. Generalized Linear Models; CRC Press: Boca Raton, FL, USA, 1989; Volume 37. [Google Scholar]
- Ridgeway, G. The state of boosting. Comput. Sci. Stat. 1999, 31, 172–181. [Google Scholar]
- Hastie, T.J.; Tibshirani, R.J. Generalized Additive Models; CRC Press: Boca Raton, FL, USA, 1990; Volume 43. [Google Scholar]
- Breiman, L.; Friedman, J.; Stone, C.J.; Olshen, R.A. Classification and Regression Trees; CRC Press: Boca Raton, FL, USA, 1984. [Google Scholar]
- Ripley, B.D. Pattern Recognition and Neural Networks; Cambridge University Press: Cambridge, UK, 2007. [Google Scholar]
- Busby, J. Bioclim—A bioclimate analysis and prediction system. In Nature Conservation: Cost Effective Biological Surveys and Data Analysis; Margules, C.R., Austin, M.P., Eds.; CSIRO: Melbourne, Australia, 1991; pp. 64–68. [Google Scholar]
- Hastie, T.; Tibshirani, R.; Buja, A. Flexible discriminant analysis by optimal scoring. J. Am. Stat. Assoc. 1994, 89, 1255–1270. [Google Scholar] [CrossRef]
- Breiman, L. Random forests. Mach. Learn. 2001, 45, 5–32. [Google Scholar] [CrossRef]
- Friedman, J.H. Multivariate adaptive regression splines. Ann. Stat. 1991, 19, 1–67. [Google Scholar] [CrossRef]
- Pearson, R.G. Species’ distribution modeling for conservation educators and practitioners. In Synthesis. American Museum of Natural History; American Museum of Natural History: New York, NY, USA, 2007; Volume 3, pp. 54–89. [Google Scholar]
- Allouche, O.; Tsoar, A.; Kadmon, R. Assessing the accuracy of species distribution models: Prevalence, kappa and the true skill statistic (TSS). J. Appl. Ecol. 2006, 43, 1223–1232. [Google Scholar] [CrossRef]
- Lobo, J.M.; Jiménez-Valverde, A.; Real, R. AUC: A misleading measure of the performance of predictive distribution models. Glob. Ecol. Biogeogr. 2008, 17, 145–151. [Google Scholar] [CrossRef]
- Jones, A.W.; Dalton, C.M.; Stowe, E.S.; Post, D.M. Contribution of declining anadromous fishes to the reproductive investment of a common piscivorous seabird, the double-crested cormorant (Phalacrocorax auritus). Auk 2010, 127, 696–703. [Google Scholar] [CrossRef]
- Landis, J.R.; Koch, G.G. The measurement of observer agreement for categorical data. Biometrics 1977, 33, 159–174. [Google Scholar] [CrossRef] [PubMed]
- Ruete, A.; Leynaud, G.C. Goal-Oriented Evaluation of Species Distribution Models’ Accuracy and Precision: True Skill Statistic Profile and Uncertainty Maps. PeerJ PrePrints 2015, 3, e1208v1. [Google Scholar] [CrossRef]
- Liu, C.; Berry, P.M.; Dawson, T.P.; Pearson, R.G. Selecting thresholds of occurrence in the prediction of species distributions. Ecography 2005, 28, 385–393. [Google Scholar] [CrossRef]
- Hanberry, B.; He, H. Prevalence, statistical thresholds, and accuracy assessment for species distribution models. Web Ecol. 2013, 13, 13–19. [Google Scholar] [CrossRef]
- Moon, H.-I. Antidiabetic effects of dendropanoxide from leaves of Dendropanax morbifera Leveille in normal and streptozotocin-induced diabetic rats. Hum. Exp. Toxicol. 2011, 30, 870–875. [Google Scholar] [CrossRef] [PubMed]
- Lee, J.; Hon, J.; Yi, J.; Chun, Y.; Le, J. Characteristic of seed germination of Dendropanax morifera according to temperaure and ligh factors for estiamting change of habitat area in global warming. Clim. Res. 2013, 8, 143–151. [Google Scholar] [CrossRef]
- Kim, S.; Jang, Y.; Han, J.; Chung, H.; Lee, S.; Cho, K. Genetic variation and population structure of dendropanax morbifera lev.(araliaceae) in korea. Silvae Genet. 2006, 55, 7–13. [Google Scholar] [CrossRef]
- Choi, S.; Yoon, J.; Shin, H. Germination and growth characteristics of dendropanax morbifera lev. By sowing methods and shading conditions. Planta Med. 2013, 79, PN122. [Google Scholar] [CrossRef]
- Sakai, A.; Weiser, C. Freezing resistance of trees in North America with reference to tree regions. Ecology 1973, 54, 118–126. [Google Scholar] [CrossRef]
- Wang, X.P.; Tang, Z.Y.; Fang, J.Y. Climatic control on forests and tree species distribution in the forest region of northeast china. J. Integr. Plant Biol. 2006, 48, 778–789. [Google Scholar] [CrossRef]
- Kira, T. Forest ecosystems of east and Southeast Asia in a global perspective. Ecol. Res. 1991, 6, 185–200. [Google Scholar] [CrossRef]
- Da, L.-J.; Kang, M.-M.; Song, K.; Shang, K.-K.; Yang, Y.-C.; Xia, A.-M.; Qi, Y.-F. Altitudinal zonation of human-disturbed vegetation on mt. Tianmu, Eastern China. Ecol. Res. 2009, 24, 1287. [Google Scholar] [CrossRef]
- Chiu, C.-A.; Chiou, C.-R.; Lin, J.-R.; Lin, P.-H.; Lin, C.-T. Coldness index does not indicate the upper limit of evergreen broad-leaved forest on a subtropical island. J. For. Res. 2014, 19, 115–124. [Google Scholar] [CrossRef]
- Chen, X.; Wang, L.; Inouye, D. Delayed response of spring phenology to global warming in subtropics and tropics. Agric. For. Meteorol. 2017, 234, 222–235. [Google Scholar] [CrossRef]
- Luedeling, E.; Girvetz, E.H.; Semenov, M.A.; Brown, P.H. Climate change affects winter chill for temperate fruit and nut trees. PLoS ONE 2011, 6, e20155. [Google Scholar] [CrossRef] [PubMed]
- Moyes, A.B.; Germino, M.J.; Kueppers, L.M. Moisture rivals temperature in limiting photosynthesis by trees establishing beyond their cold-edge range limit under ambient and warmed conditions. New Phytol. 2015. [Google Scholar] [CrossRef] [PubMed]
- Song, B.; Niu, S.; Wang, S. Precipitation regulates plant gas exchange and its long-term response to climate change in a temperate grassland. J. Plant Ecol. 2016, 9, 531–541. [Google Scholar] [CrossRef]
- Niu, S.; Luo, Y.; Li, D.; Cao, S.; Xia, J.; Li, J.; Smith, M.D. Plant growth and mortality under climatic extremes: An overview. Environ. Exp. Bot. 2014, 98, 13–19. [Google Scholar] [CrossRef]
- Wiens, J.A.; Stralberg, D.; Jongsomjit, D.; Howell, C.A.; Snyder, M.A. Niches, models, and climate change: Assessing the assumptions and uncertainties. Proc. Natl. Acad. Sci. USA 2009, 106, 19729–19736. [Google Scholar] [CrossRef] [PubMed]
- Briggs, D.; Walters, S.M. Plant Variation and Evolution; Cambridge University: Cambridge, UK, 1997. [Google Scholar]
- Hamrick, J.L. Response of forest trees to global environmental changes. For. Ecol. Manag. 2004, 197, 323–335. [Google Scholar] [CrossRef]
- Davis, M.B.; Shaw, R.G. Range shifts and adaptive responses to quaternary climate change. Science 2001, 292, 673–679. [Google Scholar] [CrossRef] [PubMed]
- Sork, V.; Aitken, S.; Dyer, R.; Eckert, A.; Legendre, P.; Neale, D. Putting the landscape into the genomics of trees: Approaches for understanding local adaptation and population responses to changing climate. Tree Genet. Genomes 2013, 9, 901–911. [Google Scholar] [CrossRef]
- Graham, C.H.; Ron, S.R.; Santos, J.C.; Schneider, C.J.; Moritz, C. Integrating phylogenetics and environmental niche models to explore speciation mechanisms in dendrobatid frogs. Evolution 2004, 58, 1781–1793. [Google Scholar] [CrossRef] [PubMed]
- Hereford, J. A quantitative survey of local adaptation and fitness trade-offs. Am. Nat. 2009, 173, 579–588. [Google Scholar] [CrossRef] [PubMed]
- Grassein, F.; Lavorel, S.; Till-Bottraud, I. The importance of biotic interactions and local adaptation for plant response to environmental changes: Field evidence along an elevational gradient. Glob. Chang. Biol. 2014, 20, 1452–1460. [Google Scholar] [CrossRef] [PubMed]
- Nicholls, R.J.; Wong, P.P.; Burkett, V.; Codignotto, J.; Hay, J.; McLean, R.; Ragoonaden, S.; Woodroffe, C.D.; Abuodha, P.; Arblaster, J. Coastal Systems and Low-Lying Areas; IPCC: Geneva, Switzerland, 2007. [Google Scholar]
- Mendoza-González, G.; Martínez, M.L.; Rojas-Soto, O.R.; Vázquez, G.; Gallego-Fernández, J.B. Ecological niche modeling of coastal dune plants and future potential distribution in response to climate change and sea level rise. Glob. Chang. Biol. 2013, 19, 2524–2535. [Google Scholar] [CrossRef] [PubMed]
- Choi, Y.R. Modernization, development and underdevelopment: Reclamation of Korean tidal flats, 1950s–2000s. Ocean Coast. Manag. 2014, 102, 426–436. [Google Scholar] [CrossRef]
- Kim, Y.; Cho, K. Sea level rise around Korea: Analysis of tide gauge station data with the ensemble empirical mode decomposition method. J. Hydro-Environ. Res. 2016, 11, 138–145. [Google Scholar] [CrossRef]
- Park, S.U.; Koo, K.A.; Kong, W.-S. Potential impact of climate change on distribution of warm temperate evergreen broad-leaved trees in the Korean peninsula. J. Korean Geogr. Soc. 2016, 51, 201–217. [Google Scholar]
Figure 1.
Study site. Korean Peninsula (KP): The Republic of Korea (ROK) in the south and the Democratic People’s Republic of Korea (DPRK) in the north.
Figure 1.
Study site. Korean Peninsula (KP): The Republic of Korea (ROK) in the south and the Democratic People’s Republic of Korea (DPRK) in the north.
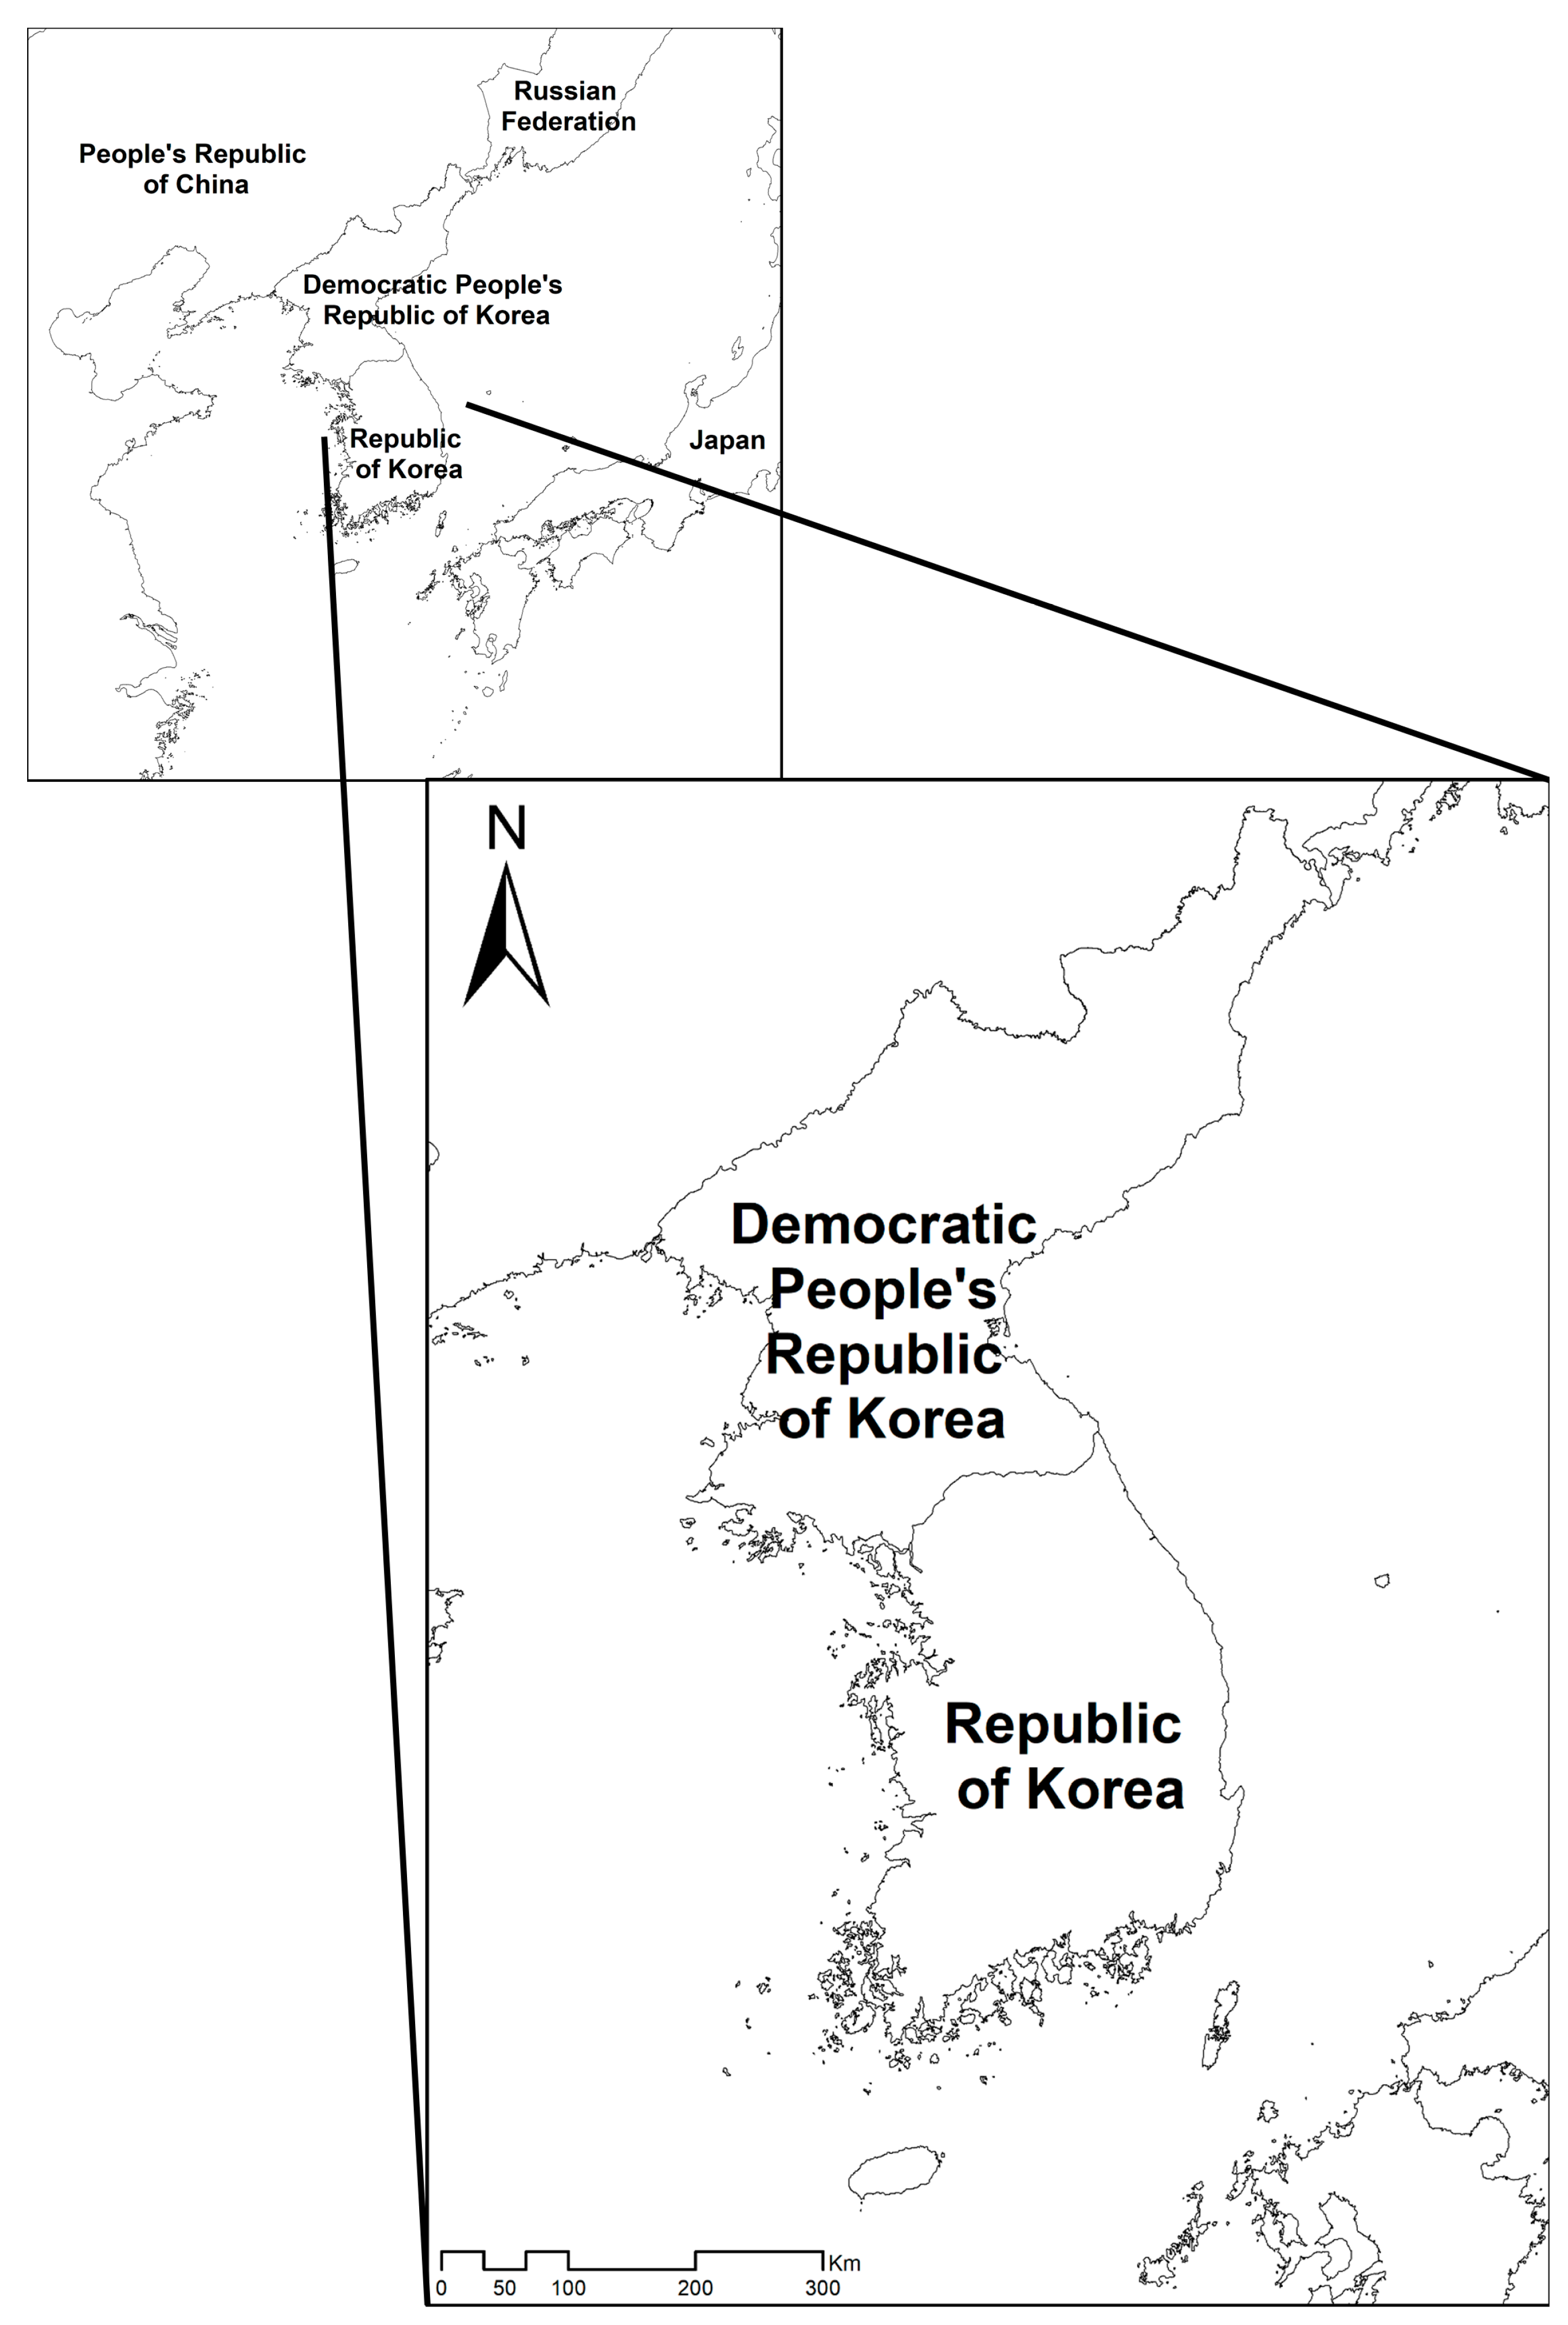
Figure 2.
Ensemble projections of current and future distributions of climatically suitable habitats for coastal evergreen broadleaved plants under climate change in 2050 and 2070. The future climatic conditions were projected under 20 climatic change scenarios, five global circulation models(GCMs), and four representative concentration pathways (RCPs), and 20 projections of climate change were ensembled for ensemble projections. (a) Presents the habitat expansions under climate changes and (b) the habitat contractions.

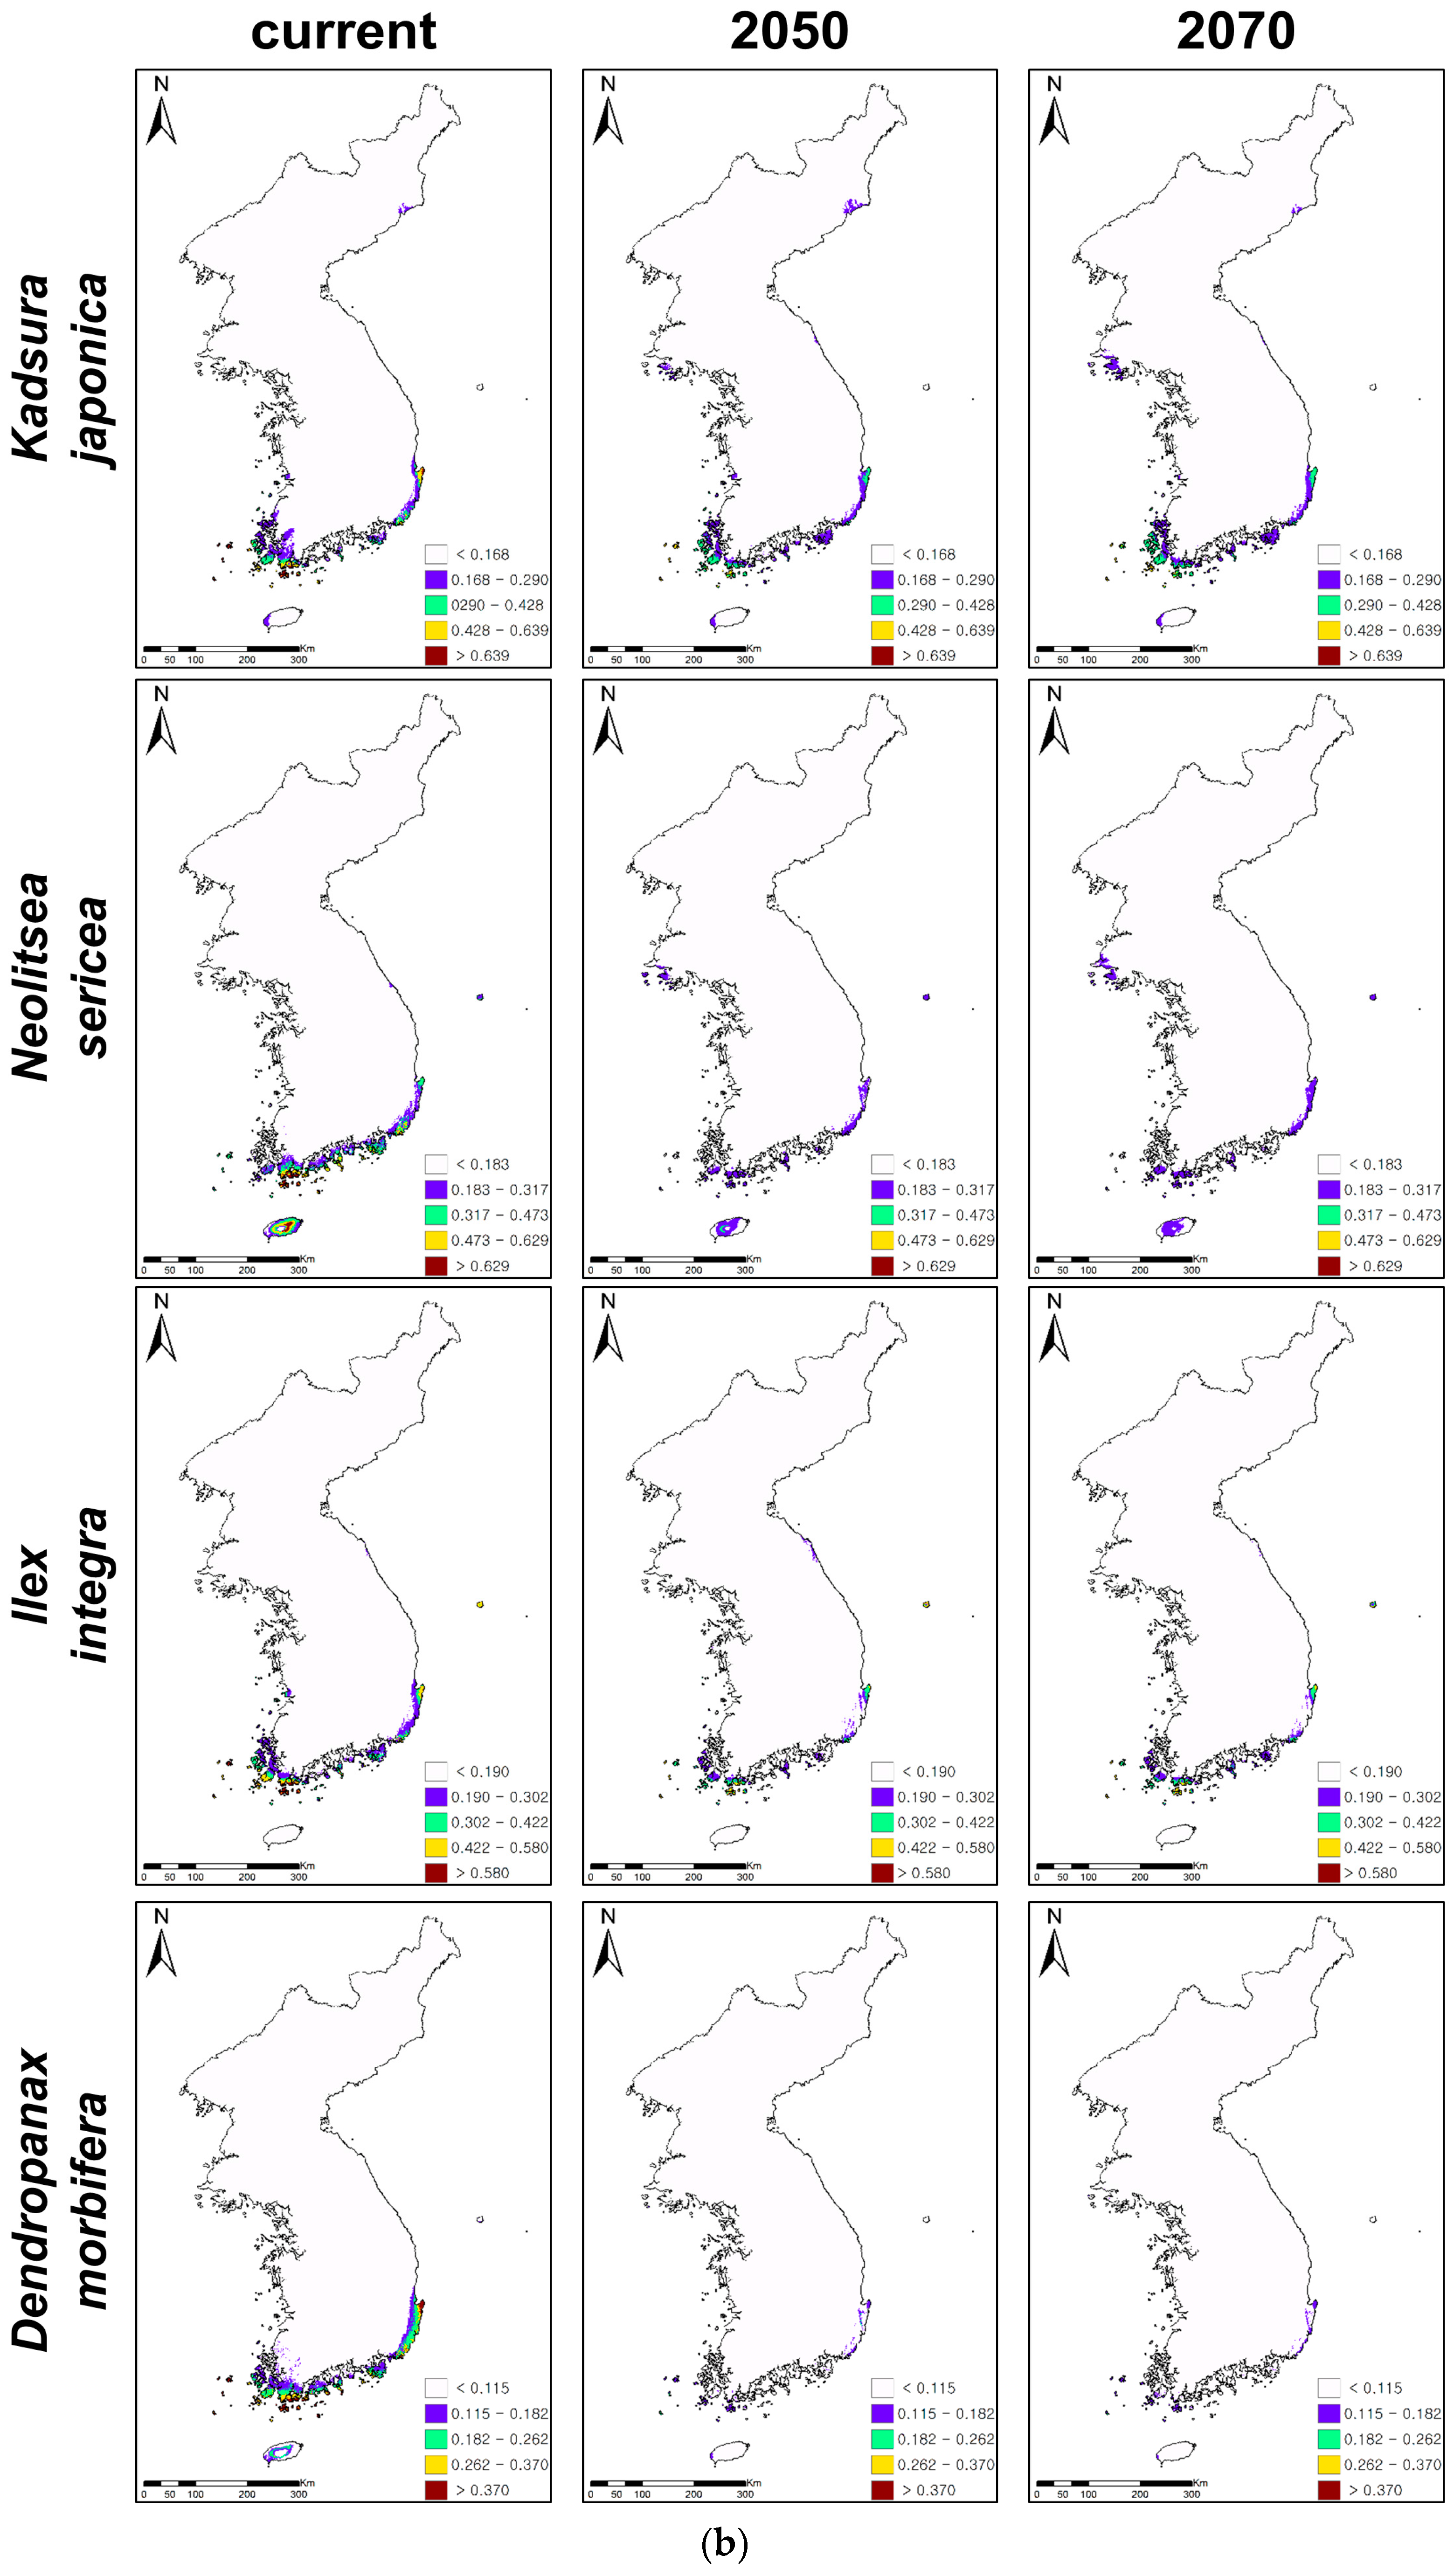
Table 1.
Study species and model variables used for species distribution model (SDM) modeling and future predictions: Eight coastal warm-adapted evergreen broadleaved plants (a), five bioclimatic variables (b), and five global circulation models (c).
Table 1.
Study species and model variables used for species distribution model (SDM) modeling and future predictions: Eight coastal warm-adapted evergreen broadleaved plants (a), five bioclimatic variables (b), and five global circulation models (c).
| (a) | ||
| Scientific Name | # of Presence (Absence) Data | |
| Castanopsis cuspidata (Thunb.) Schottky | 53 (669) | |
| Kadsura japonica (L.) Dunal | 63 (659) | |
| Neolitsea sericea (Blume) Koidz. | 86 (636) | |
| Pittosporum tobira (Thunb.) W.T. Aiton | 120 (602) | |
| Raphiolepis indica var. umbellata (Thunb.) Ohashi | 80 (642) | |
| Ilex integra Thunb. | 59 (663) | |
| Eurya emarginata (Thunb.) Makino | 71 (651) | |
| Dendropanax morbifera H. Lév. | 48 (674) | |
| (b) | ||
| Bioclimatic Variables (BIO) | Definition of Variables | |
| BIO1 | Annual Mean Temperature | |
| BIO2 | Mean Diurnal Range (Mean of monthly (max temp-min temp)) | |
| BIO12 | Annual Precipitation | |
| BIO13 | Precipitation of Wettest Month | |
| (c) | ||
| GCM | Code | Institution |
| GISS-E2-R | GSt | NASA Goddard Institute for Space Studies USA |
| HadGEM2-AO | HD | UK Met Office Hadley Centre |
| HadGEM2-ES | HE | UK Met Office Hadley Centre |
| MIROC-ESM-CHEM | MI | University of Tokyo, National Institute for Environmental Studies, and Japan Agency for Marine-Earth Science and Technology |
| MRI-CGCM3 | MG | University of Tokyo, National Institute for Environmental Studies, and Japan Agency for Marine-Earth Science and Technology |
Note: BIO indicates bioclimatic variable and GCM global circulation model. Code in the table (c) is the abbreviation for each GCM in the first column in the table.
Table 2.
Evaluation statistics of ensemble projections. TSSs, Sensitivities, and Specificities were calculated from the ensemble projection of each species using the full dataset. Sensitivities and specificities were calculated based on the threshold of suitability at which the TSS value was the maximum.
| Species Name | TSS | Threshold | Sensitivity | Specificity |
|---|---|---|---|---|
| Castanopsis cuspidata | 0.923 | 0.111 | 1.000 | 0.921 |
| Kadsura japonica | 0.866 | 0.168 | 0.917 | 0.949 |
| Neolitsea sericea | 0.898 | 0.183 | 0.980 | 0.917 |
| Pittoporum tobira | 0.860 | 0.098 | 0.968 | 0.890 |
| Raphiolepis indica var. umbellata | 0.932 | 0.085 | 1.000 | 0.932 |
| Ilex integra | 0.787 | 0.190 | 0.875 | 0.912 |
| Eurya emarginata | 0.880 | 0.229 | 0.921 | 0.959 |
| Dendropanax morbifera | 0.868 | 0.115 | 0.968 | 0.900 |
Table 3.
Areal changes of the climatic niche of eight plants under climate change. While the first four species (C. cuspidata to E. emarginata in the first column) showed expansions of suitable habitats under climate changes, the remaining four species (K. japonica to D. morbifera) presented contractions of habitats. The unit is %. The numbers show the percent areal changes under climate change.
| Species Name | 2050 | 2070 |
|---|---|---|
| Castanopsis cuspidata | 41 | 76 |
| Pittosporum tobira | 261 | 390 |
| Raphiolepis indica var. umbellata | 147 | 232 |
| Eurya emarginata | 62 | 106 |
| Kadsura japonica | −12 | −7 |
| Neolitsea sericea | −52 | −47 |
| Ilex integra | −51 | −53 |
| Dendropanax morbifera | −90 | −89 |
© 2017 by the authors. Licensee MDPI, Basel, Switzerland. This article is an open access article distributed under the terms and conditions of the Creative Commons Attribution (CC BY) license (http://creativecommons.org/licenses/by/4.0/).
Share and Cite
MDPI and ACS Style
Koo, K.A.; Park, S.U.; Seo, C. Effects of Climate Change on the Climatic Niches of Warm-Adapted Evergreen Plants: Expansion or Contraction? Forests 2017, 8, 500. https://doi.org/10.3390/f8120500
AMA Style
Koo KA, Park SU, Seo C. Effects of Climate Change on the Climatic Niches of Warm-Adapted Evergreen Plants: Expansion or Contraction? Forests. 2017; 8(12):500. https://doi.org/10.3390/f8120500
Chicago/Turabian StyleKoo, Kyung Ah, Seon Uk Park, and Changwan Seo. 2017. "Effects of Climate Change on the Climatic Niches of Warm-Adapted Evergreen Plants: Expansion or Contraction?" Forests 8, no. 12: 500. https://doi.org/10.3390/f8120500
Note that from the first issue of 2016, this journal uses article numbers instead of page numbers. See further details here.