Article

Assessing Ecosystem Services in Rubber Dominated Landscapes in South-East Asia—A Challenge for Biophysical Modeling and Transdisciplinary Valuation

1
Institute of Agricultural Sciences in the Tropics and Subtropics (Hans-Ruthenberg-Institute), University of Hohenheim, 70593 Stuttgart, Germany
2
Naturschutzjugend Baden-Württemberg, 70178 Stuttgart, Germany
3
Extension and Communication Group, Humboldt University of Berlin, 10099 Berlin, Germany
*
Author to whom correspondence should be addressed.
Forests 2017, 8(12), 505; https://doi.org/10.3390/f8120505
Submission received: 2 November 2017 / Revised: 1 December 2017 / Accepted: 13 December 2017 / Published: 15 December 2017

Abstract

:
The concept of ecosystem services (ESS) has been increasingly recognized for its potential in decision making processes concerning environmental policy. Multidisciplinary projects on rubber (Hevea brasiliensis) cultivation, integrating research on a variety of ESS, have been few and far between. More than three years of iterative workshops with regional stakeholders resulted in the development of future land use scenarios for our study area in Xishuangbanna, PR China. We used the InVEST (Integrated Valuation of Ecosystem Services and Trade-offs) modeling framework to analyze their impact on sediment retention, water yield, habitat quality, and carbon sequestration and developed a model for assessing rubber yields. We investigated the percentage deviations of integrated ESS indices in each scenario, as compared to the initial state of 2015 and as a novelty used different statistical weighting methods to include rankings for the preference of ESS from three contrasting stakeholder groups. The business-as-usual scenario (BAU, continuous rubber expansions) revealed an increase in rubber yields trading off against all other ESS analyzed. Compared to BAU, the measures introduced in the balanced-trade-offs scenario (reforestation, reduced herbicide application, riverine buffer zones, etc.) reduced the total amount of rubber yield but enhanced habitat quality and regulating ESS. The results show that the integrated indices for the provisioning of ESS would be overestimated without the inclusion of the stakeholder groups. We conclude that policy regulations, if properly assessed with spatial models and integrated stakeholder feedback, have the potential to buffer the typical trade-off between agricultural intensification and environmental protection.

1. Introduction

Ecosystem services (ESS) are defined as the benefits people obtain from ecosystems [1]. In recent years, the ESS concept has increasingly gained importance and its potential for shaping decision making processes with regard to environmental policy formulation and sustainability issues has been widely recognized [2]. Sustainably maintaining ESS and ecosystem functions (ESF) is crucial considering the increasing pressure on ecosystems caused by climate change and land use change due to e.g., deforestation, agricultural expansion, and intensification [3,4]. Spatially explicit analyses and the mapping of ESS, as well as ESF, are essential for developing management strategies for ecosystems adaptation to climate change, the maximization of socio-ecological resilience, and to ensure sustainable ESS and ESF for mankind [5].
In Montane Mainland South-East Asia (MMSEA), extensive land use changes during the last decades have resulted in the disappearance of traditional swidden farming systems and an intensification of cash crop cultivation [6]. For example, suitable environmental conditions and the absence of South American leaf blight (Pseudocercospora ulei, a major pest in rubber production systems in South America) have resulted in the expansion of rubber tree plantations in South-East Asia (SEA), today producing the majority of the world’s natural latex supply [7]. As a consequence, rubber plantations in SEA have spread mostly into former forest areas at increasingly higher altitudes and steeper slopes, which are sub-optimally suited for the growth and productivity of rubber trees [8]. In Xishuangbanna, located in Yunnan Province of P.R. China, this development was mainly driven by the expected high income possibilities from rubber cultivation [9], which is a prime example for this trade-off between economic development and environmental conservation.
Over the last ten years, numerous changes in biophysical ESF related to the large-scale implementation of rubber plantations have been reported. Forest to rubber conversions have been shown to have negative effects on soil quality [10], to increase soil erosion and surface run-off [11,12], and to reduce carbon stocks [13,14]. Hydrological effects include increased water loss through evapotranspiration during the dry season, decreasing water storage in subsurface soil and, thus, basin discharge [15]. The expansion of rubber plantations in MMSEA has led to serious losses of highly diverse rain forest areas [16], resulting in decreased floral and faunal species abundance [17] and altered species composition, mostly in disfavour of forest specialists [18]. On the other hand, rubber plantations maintain a higher number of plant species (with a lower proportion of exotic and invasive species) compared to tea plantations or irrigated crops cultivated in the area [19].
A recent review on ESS in rubber plantations has shown that the majority of publications on the subject focused on only a few ESS, thus providing incomplete and therefore insufficient information for sustainable land use planning or long-term investment decisions [20]. There is an urgent need for multidisciplinary approaches integrating research on a wide variety of ESS for ecosystem service assessments (ESA) related to rubber cultivation, as shown by Häuser et al. (2015) [20].
Several approaches for valuing ESS in rubber cultivation systems have been pursued in recent years: ESS valuation via stakeholder perceptions or expert judgements [21,22], benefit transfer methods [23], and bio-physical approaches lacking any valuation procedures [24]. Hu et al. (2008) [23] used benefit transfers based on Costanza et al. (1997) [25] to assess the monetary loss of ESS in Xishuangbanna from 1988 to 2006. Benefit transfer methods are only reasonable when provisioning changes are given across comparable goods and contexts [26], which Hu et al. (2008) [23] attempted to account for by using coefficients of sensitivity. A point of criticism for this method would be the comparison between gross domestic product and ecosystem service value, as the former is based on market prices while the latter is largely based on willingness to pay (WTP), therefore representing only limited comparative validity. Koschke et al. (2012) [27] provided a comparison between benefit transfers and valuation approaches based on expert opinions and found considerable differences for their impact on the outcome of the evaluation. The difficulty of attributing a value for biodiversity was pointed out by Atkinson et al. (2012) [28]. Concordantly, no value is given for “Habitat/refugia” as an ESS in Hu et al. (2008) [23]. Areas of high plant diversity values generally overlap with areas of high aesthetic value and high regulatory ESS [29]. To our knowledge, no study has yet been conducted to assess the effects of future trajectories of rubber-related land use changes on multiple ESS and biodiversity and subject these results to a valuation based on stakeholder perceptions.
After reviewing the currently available software solutions to model multiple ESS and biodiversity, we chose the InVEST (Integrated Valuation of Ecosystem Services and Trade-offs) modeling framework. InVEST is a suite of free and open source software models to map and value ESS [30]. It allows independent modeling of different sets of ESS, enabling the user to ensure the biophysical realism of each sub-model with respect to input data and model results. Furthermore, InVEST is able to offer flexible customizability and generalizability options, not only in terms of scaling and input data, but also for stakeholder integration and trade-off evaluation. These points represent the essential parts to be included in any ESA [31], in addition to off-site effects, which we are only able to assess in a qualitative manner for this study. Additionally, InVEST provides a sophisticated basis for reporting the modeling results in terms of transparency and comparability [32], since it has been repeatedly applied to investigate the provisioning of ESS all around the globe [33].
Thompson et al. (2012) [34] highlighted the importance of comparing contrasting scenarios to better understand the complex dynamics and relationships in socio-ecological systems. Seppelt et al. (2013) [35] further developed this idea by suggesting the combination of scenario analysis with optimization algorithms, while also stressing that optimized plans might not always be reachable for the current land system and political instruments.
The aim of this study is to attempt an assessment of ESS for a landscape significantly influenced by the expansion of rubber plantations by combining biophysical aspects of ESS modeling with the feedback of stakeholders on rules of decision making. We place an emphasis on repeatedly integrating stakeholder feedback into the scenario design and evaluation process to ensure their feasibility in regard to land use planning and policies, expert recommendations, and management practices. Thus, we aim at quantifying and evaluating the ESS provided by the land use systems and subject them to scenario analyses assessing the effect of several possible land use change trajectories for the future.

2. Materials and Methods
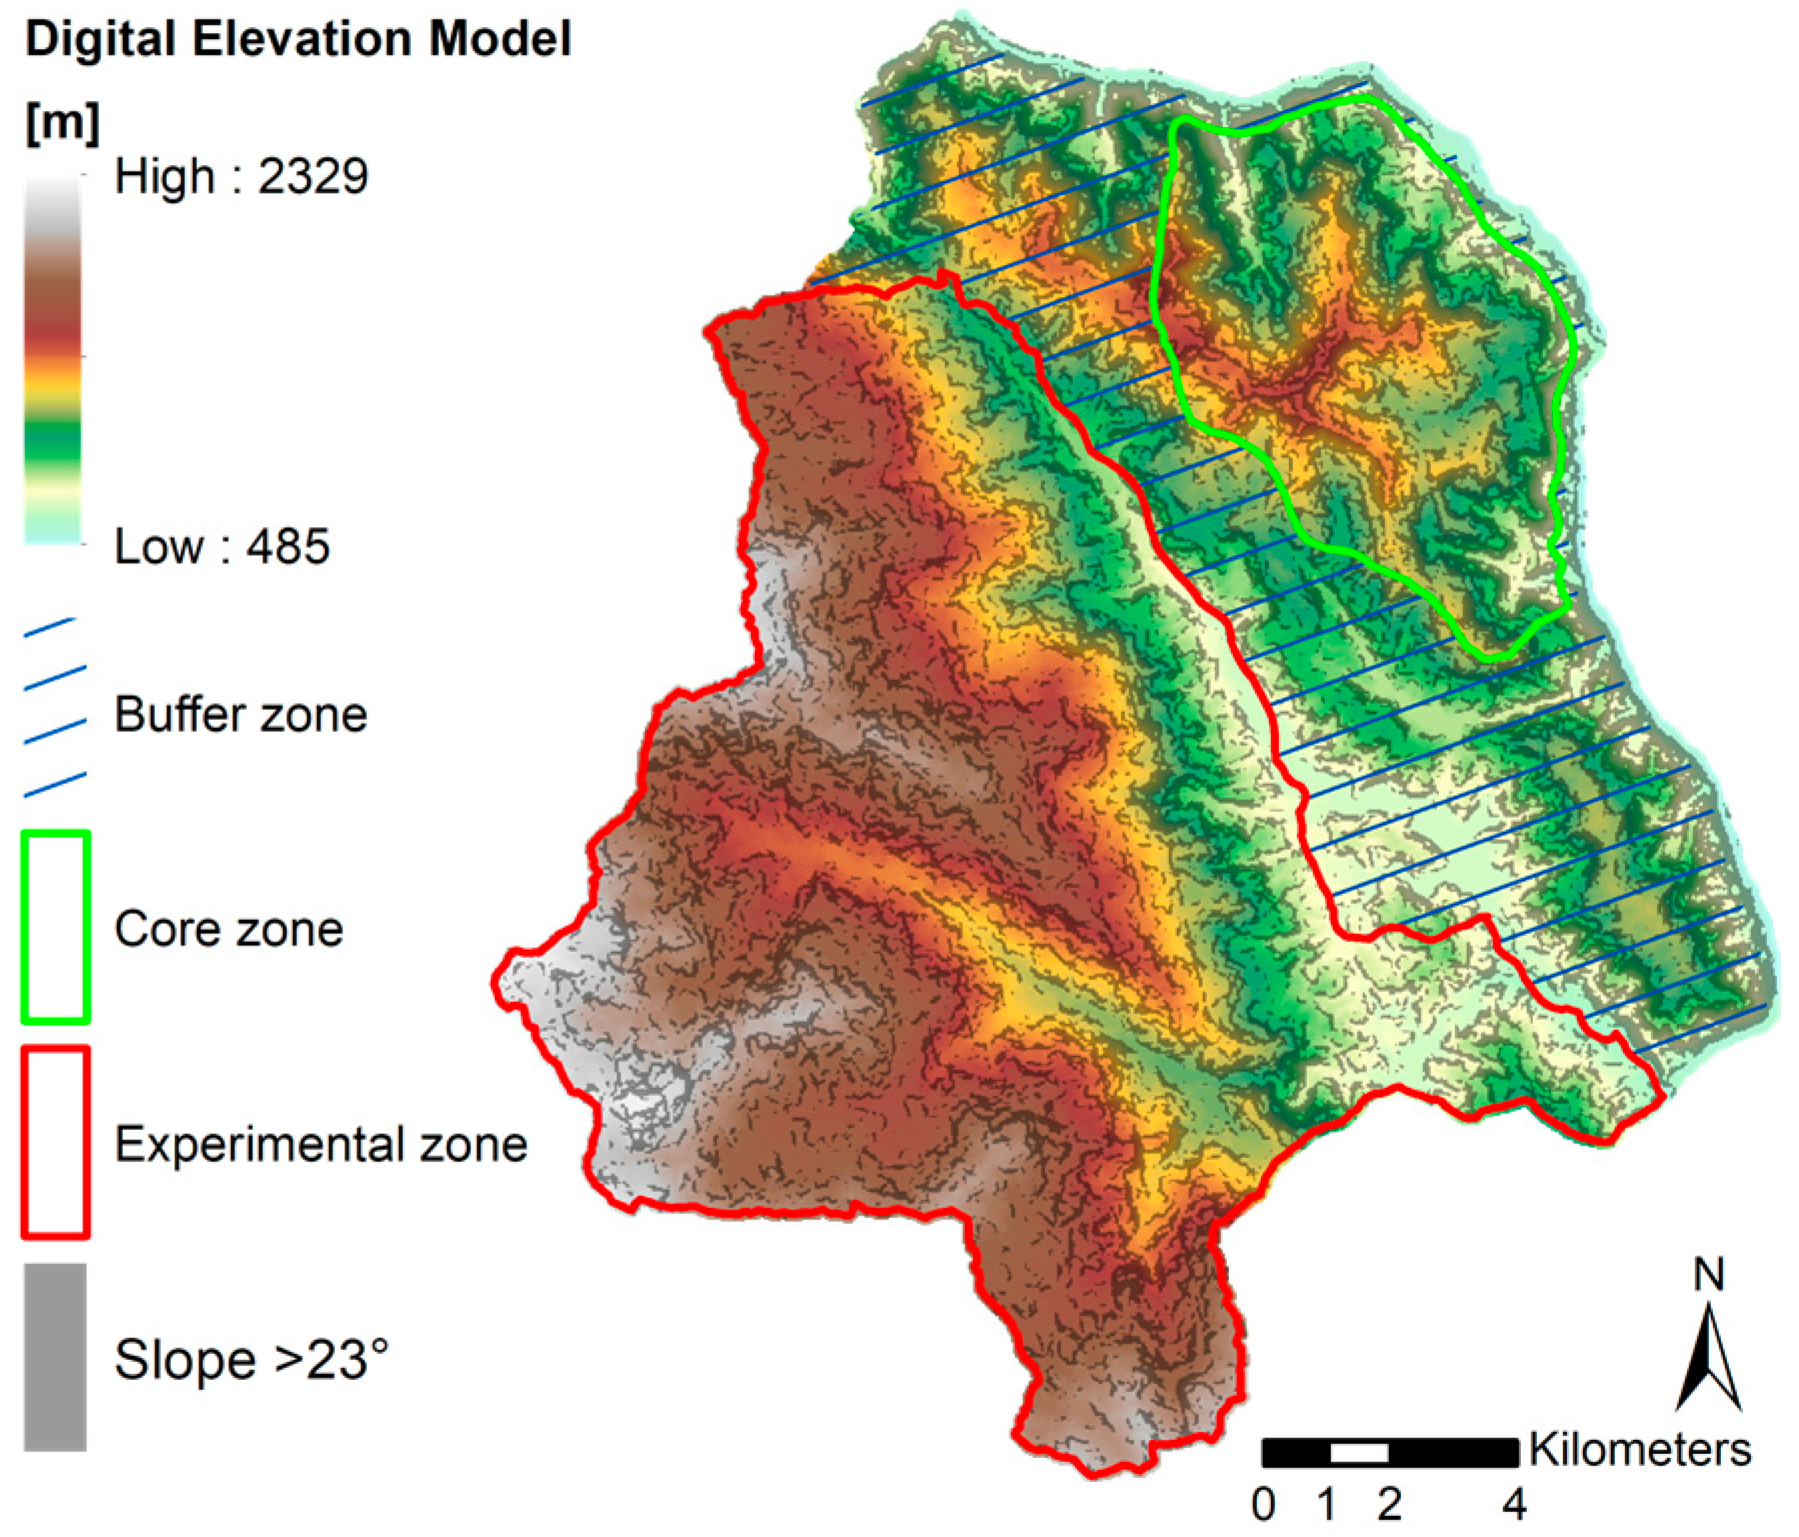
2.1. Study Area

The research area was the Naban River Watershed National Nature Reserve (henceforth referred to as Nabanhe Reserve), located at the south-western border of the Peoples Republic of China, in the Xishuangbanna Prefecture of Yunnan Province (22°08′ N 100°41′ E). It spans an area of about 271 km2. The region is characterized by an exceptional species richness, being situated within the Indo-Burma biodiversity hotspot [36]. Annual average precipitation varies between 1100 and 1600 mm and the mean annual temperature is 18–22 °C [12]. The climate of Xishuangbanna is subtropical and mostly dominated by monsoon cycles, where up to 87% of the annual precipitation occurs during the wet season from May to October [37]. With altitudes ranging from about 500 to 2300 m.a.s.l., the Nabanhe Reserve features a variety of natural vegetation types, as well as several agricultural land use systems. The nature reserve is inhabited by people from different ethnical backgrounds [38], formerly engaged in shifting cultivation and increasingly adapting the cultivation of cash crops such as rubber, sugarcane, and tea in the recent past [39]. In this region, rubber has been grown for decades in lowland valley bottoms. Over the past 15 years, rubber cultivation has spread into the hillsides, being planted on terraced slopes (at planting distances of approximately 2 m within the row and 5 m between rows), often replacing traditional orchards, vegetable cultivation or, most commonly, semi-natural or natural tropical mountainous rainforest [13]. Due to the presence of cold-spells during the dry season in spring, rubber plantations have so far been restricted to altitudes below 1000–1200 m.a.s.l. Rubber plantations are relatively prone to erosion during strong rain events before canopy closure is reached at about five years after the establishment of the plantation, with tapping (harvest of raw latex) starting two years later.

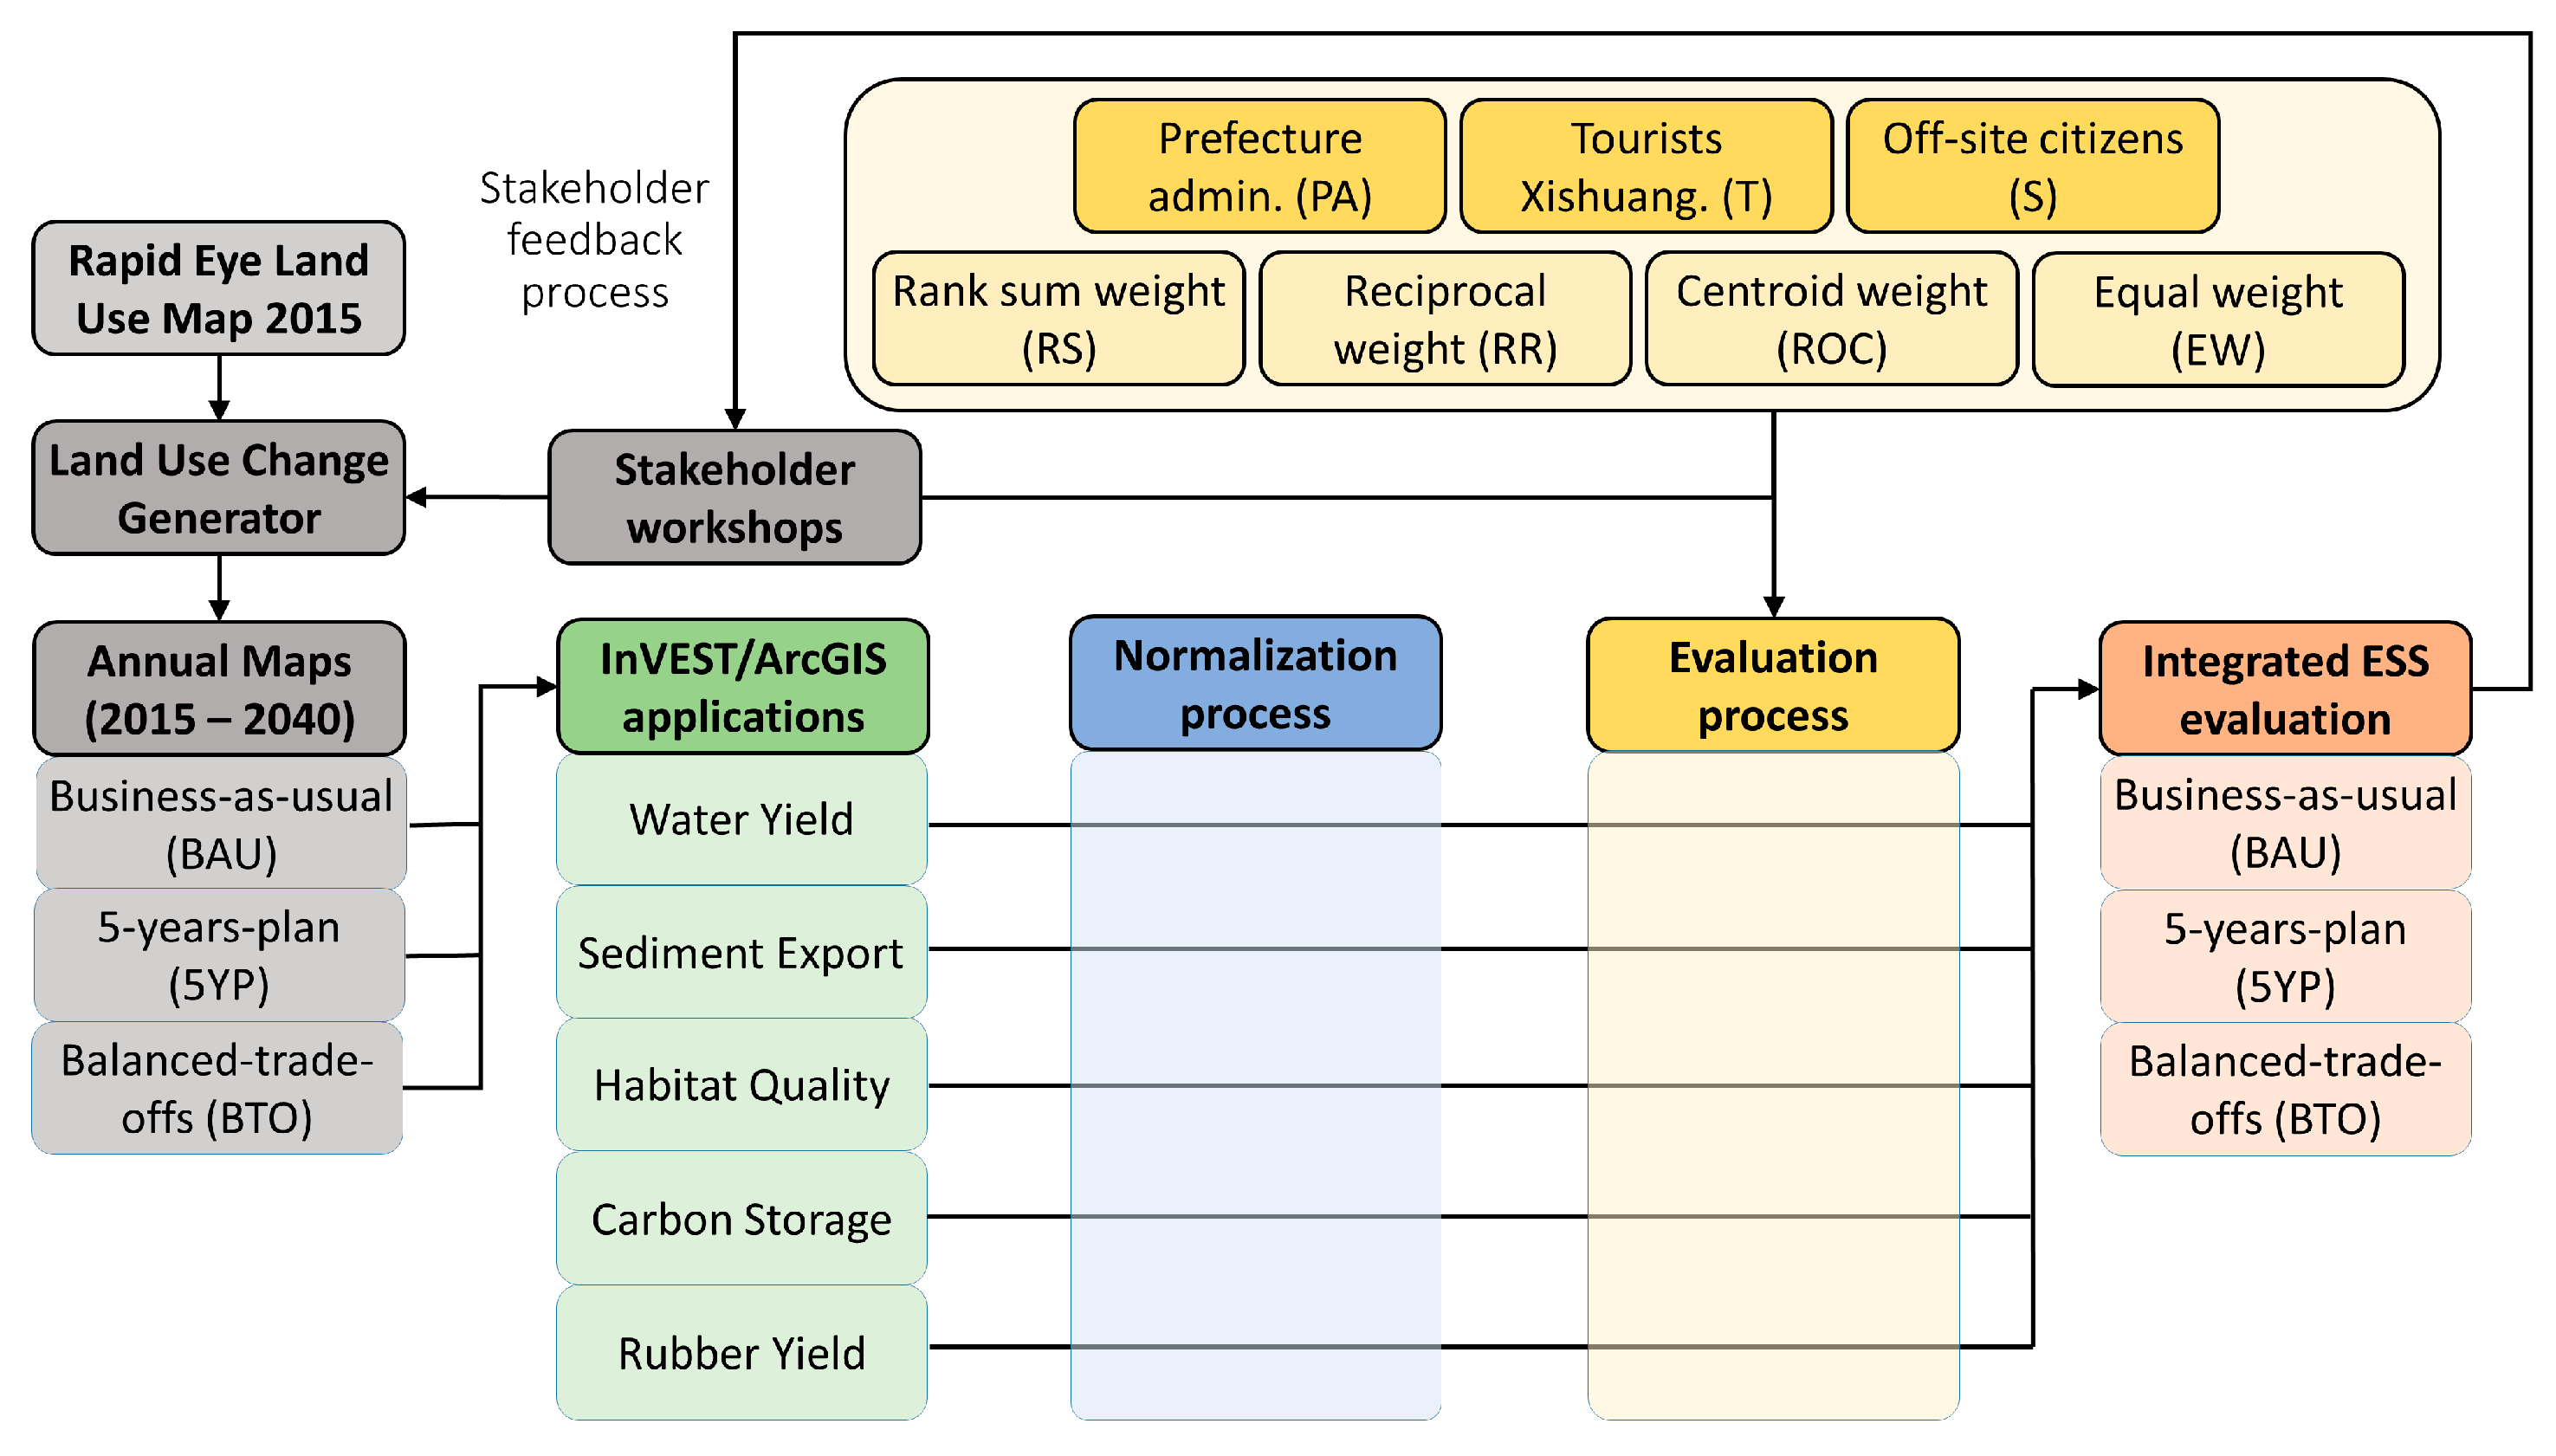
2.2. Scenario Development

Three key stakeholder groups were identified in our study area. These are local village heads and innovative farmers, prefecture administration, and politicians at a provincial level [40,41]. In a series of workshops held between January 2013 and October 2016, environmental problems, as well as management challenges related to rubber cultivation systems, were discussed by our consortium of researches and key stakeholders. The structure of the workshops was based on presentations of our consortium of researchers with a focus on thematic clusters (e.g., soil erosion, water availability, or biodiversity) followed by interactive discussion rounds. Based on the discussions and results from these workshops, we developed three future land use scenarios for the Nabanhe Reserve. Stakeholders additionally participated in the scenario development process by confirming the viability of the land use changes introduced in the scenarios regarding their spatial extent (e.g., land ownership, land use restriction), as well as their feasibility in regard to management practices. Land cover patterns derived from Rapid Eye satellite images of 2015 served as the spatially explicit starting point for the scenarios. The percentages of each land cover category in the study area at the initial state of 2015 are listed in Table 1.
The scenarios were set out to simulate land use and land management changes over the course of 25 years, ending in the year 2040. Several land use restrictions were active in the Nabanhe Reserve, as it is subdivided in different zones according to the Man and Biosphere Programme [42]. In the core zone, all access is prohibited and, therefore, no changes were set to occur in any of the simulations. Limited access was imposed in the buffer zone, whereas the experimental zone does not comprise any land use restrictions. The zones are shown in Figure 1.
For the first scenario, called Business-as-usual (BAU), we assumed a further extension of rubber, based on past rubber expansion rates in Xishuangbanna [43] and in Nabanhe Reserve [14]. This extension was set to 2% per year in relation to the area occupied by rubber in the previous year, resulting in an encroachment of rubber plantations into higher altitudes and also steeper slopes, where they replace secondary forest areas. This scenario represents the continuation of a trend observed in many other parts of MMSEA [8,44]. According to this trend, we expected this scenario to result in increased dry rubber yields trading off against the supply of other ESS.
The second scenario, called the 5-years-plan scenario (5YP), is based on the policy plan of the Xishuangbanna Prefecture Government concerning the development of rubber in Xishuangbanna for the 12th five-year plan from 2011 to 2015 [45]. Rubber plantations on sub-marginal plots are planned to be restored into near natural forest. The scenario features an annual gain of 1% of existing forest areas targeted at bushland/tea areas and rubber plantations with the following conditions: (1) Rubber sites located above 900 m.a.s.l.; and (2) rubber sites located on slopes with an inclination of more than 23°, as these areas feature a high erosion risk. With these parameters, all rubber areas eligible for reforestation will be occupied by forest before the end of the scenario run. Additionally, no further expansion of rubber plantations is allowed on locations with the aforementioned spatial properties. With the aim of evaluating the measures enforced by this governmental plan, this scenario is expected to keep rubber plantations at locations of high productivity and restore ESFs at sub-marginal areas for rubber cultivation.
The balanced-trade-offs scenario (BTO) represents the third scenario, which also incorporates all rules specified in the 5YP scenario. Additional measures include the establishment of buffer strips along the main streams in the nature reserve (Mandian and Naban). These strips were 30 m wide and consisted of secondary forest vegetation. Water conservation priority zones were to be established around the locations used by the nature reserves’ inhabitants as sources for drinking water. As a land use management measure, a reduced frequency of herbicide application for rubber plantations was introduced, starting in the first year of the simulation period, to maintain a higher amount of undergrowth in order to reduce soil erosion [12]. This scenario was expected to significantly enhance the supply of ESS without trading-off most of the financial benefits gained by rubber cultivation.
For all scenarios, the corresponding land use changes were implemented using the Land Use Change Generator module of LUCIA (Land Use Change Impact Assessment) [46]. The Land Use Change Generator does not include spatial optimization algorithms (see [47,48,49] for examples), but represents a rule-based tool allowing for spatially explicit expansion rates, target land use categories, and restricted zoning. The scenarios are not intended to accurately predict future land use patterns in the Nabanhe Reserve, but rather to assess and evaluate possible consequences of land use planning and land use management decisions as a basis for discussion with the stakeholders. The simulated land cover maps have been presented at stakeholder workshops in order to confirm their validity in terms of consistency and feasibility (Figure S1).

2.3. Selection of ESS, Model Description and Data Integration

The selection of relevant ESS is based on the results of early stakeholder workshops. Problems addressed in these workshops include the turbidity and limited availability of water in the dry season and high amounts of soil erosion, especially in the rainy season. Because of the decrease in forest areas in Nabanhe Reserve, villagers increasingly rely on buying imported vegetables, as opposed to their past lifestyle of collecting wild plants and hunting game in the forest. The concept of carbon storage and sequestration as a climate regulation service was introduced in the workshops by government officials and was previously largely unknown to the other stakeholders. While rubber yield serves as the most important proxy for private goods, all other ESS can be seen as public goods to a certain degree.
The ESA includes four sub-models of InVEST (Version 3.3.3, The Natural Capital Project: Standford, CA, USA) related to the ESS of carbon storage and sequestration, habitat quality, sediment retention, and water yield, as well as a self-developed model approximating rubber yields. Details on the biophysical relationships realized in the InVEST sub-models are given in the InVEST user guide [30]. Input parameters, spatial data, and their sources are given in the Supplementary Material for each sub-model (Tables S1–S8). InVEST’s coastal ecosystem service modules were not considered, as they were not relevant for the study area. The same applies to pollination services, as there are hardly any crops dependent on insects as pollinators in the Nabanhe Reserve. Although identified as a relevant topic during workshops with the stakeholders, nutrient retention or water quality in general could not be assessed due to insufficient data.
The carbon storage and the water yield models were implemented without any further modifications following the methodology of previous InVEST implementations [50,51,52]. For habitat quality, model parameterization and implementation was largely identical to Cotter et al. (2017) [17], updated and adapted only to reflect changes in land cover categories, using overall habitat scores as described in the Supplementary Material (Table S6). These habitat scores were derived from both field and literature data sets involving plant and animal species, and were normalized according to their abundance values for comparison. The habitat quality sub-model estimates habitat scores based on land use categories and considers threats to habitat sensitivity such as roads, settlements, and agricultural activities (e.g., chemical pest control). The sediment retention sub-model of InVEST is based on the widely used USLE (Universal Soil Loss Equation) and assigns a crop management factor (C-factor) and a support practice factor (P-factor) to every land use category [53]. By reclassifying each land use cell based on the slope of its location, we were able to implement the P-factor in a spatially explicit manner [54], allowing for better capture of the complex topographic conditions in the study area. As the crop production sub-model of InVEST was still being developed at the time of the study, we developed our own model to assess potential dry rubber yields. This model is not based on biophysical functions, but uses regional survey data of average yields corresponding to altitude, as well as the age of each respective plantation [55]. How rubber yields respond to changes in the aforementioned variables is shown by Nguyen (2013) [56], and the average yields we derived from surveys show a comparable range in relation to altitude and plantation age. Starting with plantation age values based on Beckschäfer (2017) [57], who assessed the age of rubber plantations in Xishuangbanna using remote sensing, the model dynamically simulates the economic lifespan of rubber plantations. Lowland rubber trees (<800 m.a.s.l.) are ready to be tapped after an establishment phase of seven years and remain economically viable for 25 years, while upland rubber is tapped at the age of nine (800–1000 m.a.s.l.) to 10 (>1000 m.a.s.l.) and reaches the end of its economic lifespan at the same age as lowland rubber plantations [14]. Input parameters for this procedure are given in the Supplementary Material (Table S8) and the model was implemented using ArcGIS (Version 10.3.1). Climatic variables as the input for relevant models, such as precipitation amounts, were based on 30 year averages (1960–1990) and kept constant throughout the simulation period in order not to obfuscate the influence of land use change on the ESS results [58].

2.4. Ecosystem Service Evaluation

Similar to the normalization methods applied in other ESAs [59,60], all biophysical sub-model results were normalized to a scale ranging from 0 to 1 according to the lowest and highest values, respectively. The normalization procedure is used to transform the bio-physical results of each sub-model into comparable indices and gives five spatially explicit ESS maps for every year of every scenario, where every pixel has a value between 0 and 1. These maps serve as the basis for the weighting procedure described in the following paragraphs.
For the evaluation, we used survey data of three stakeholder groups considering their preference for each of the five modeled ESS. These groups were (1) prefecture administration (PA); (2) tourists in Xishuangbanna (T); and (3) off-site citizens surveyed in Shanghai (S) [61]. Group PA serves as the most representative group for the evaluation, being most familiar with the history and environmental consequences of rubber cultivation in Xishuangbanna. Group T was considered to be important as tourism is another source of economic income for Xishuangbanna and we assumed a considerable difference in the preference of ESS between both groups. Group S represents a neutral group as many group members had no connection to Xishuangbanna.
The five ESS investigated were ranked according to their importance in descending order by each stakeholder group. Based on these ranks, different weighting factors were applied to the normalized sub-model results. Table 2 shows the ranks of each ESS and their corresponding weighting factors, based on three statistical rank weighting methods: The rank sum method (RS), inverse (or reciprocal) weights (RR), and the rank-order centroid weight method (ROC) [62]. The RS method distributes weights more homogeneously among items, whereas the RR and ROC methods apply larger weights to the top ranking items. The main difference between RR and ROC is how steep the weights decay towards the lower ranking items. We chose to employ all three methods in order to compare their effect on the end results. We also used equal weights (EW) as a neutral option, eliminating the influence of the stakeholder groups to serve as a basis for comparison. This procedure results in maps of integrated ESS indices for every year of every scenario, which feature ESS indices ranging from 0 to 1 for every pixel. These maps are the basis for spatial comparisons of changes in integrated ESS supply between the scenarios.
To allow a temporal comparison, the integrated ESS indices for every year of every scenario were summed up for the whole Nabanhe Reserve. The percentage deviations in the sums of the integrated ESS indices, resulting from the land use changes introduced in the scenarios, were compared to the initial state in 2015, which was set to 100%. This approach allowed evaluating the quantitative model results in a qualitative manner with respect to the ESS prioritized by the stakeholder groups. Scheme 1 depicts a comprehensive overview of the applied methodology.

3. Results

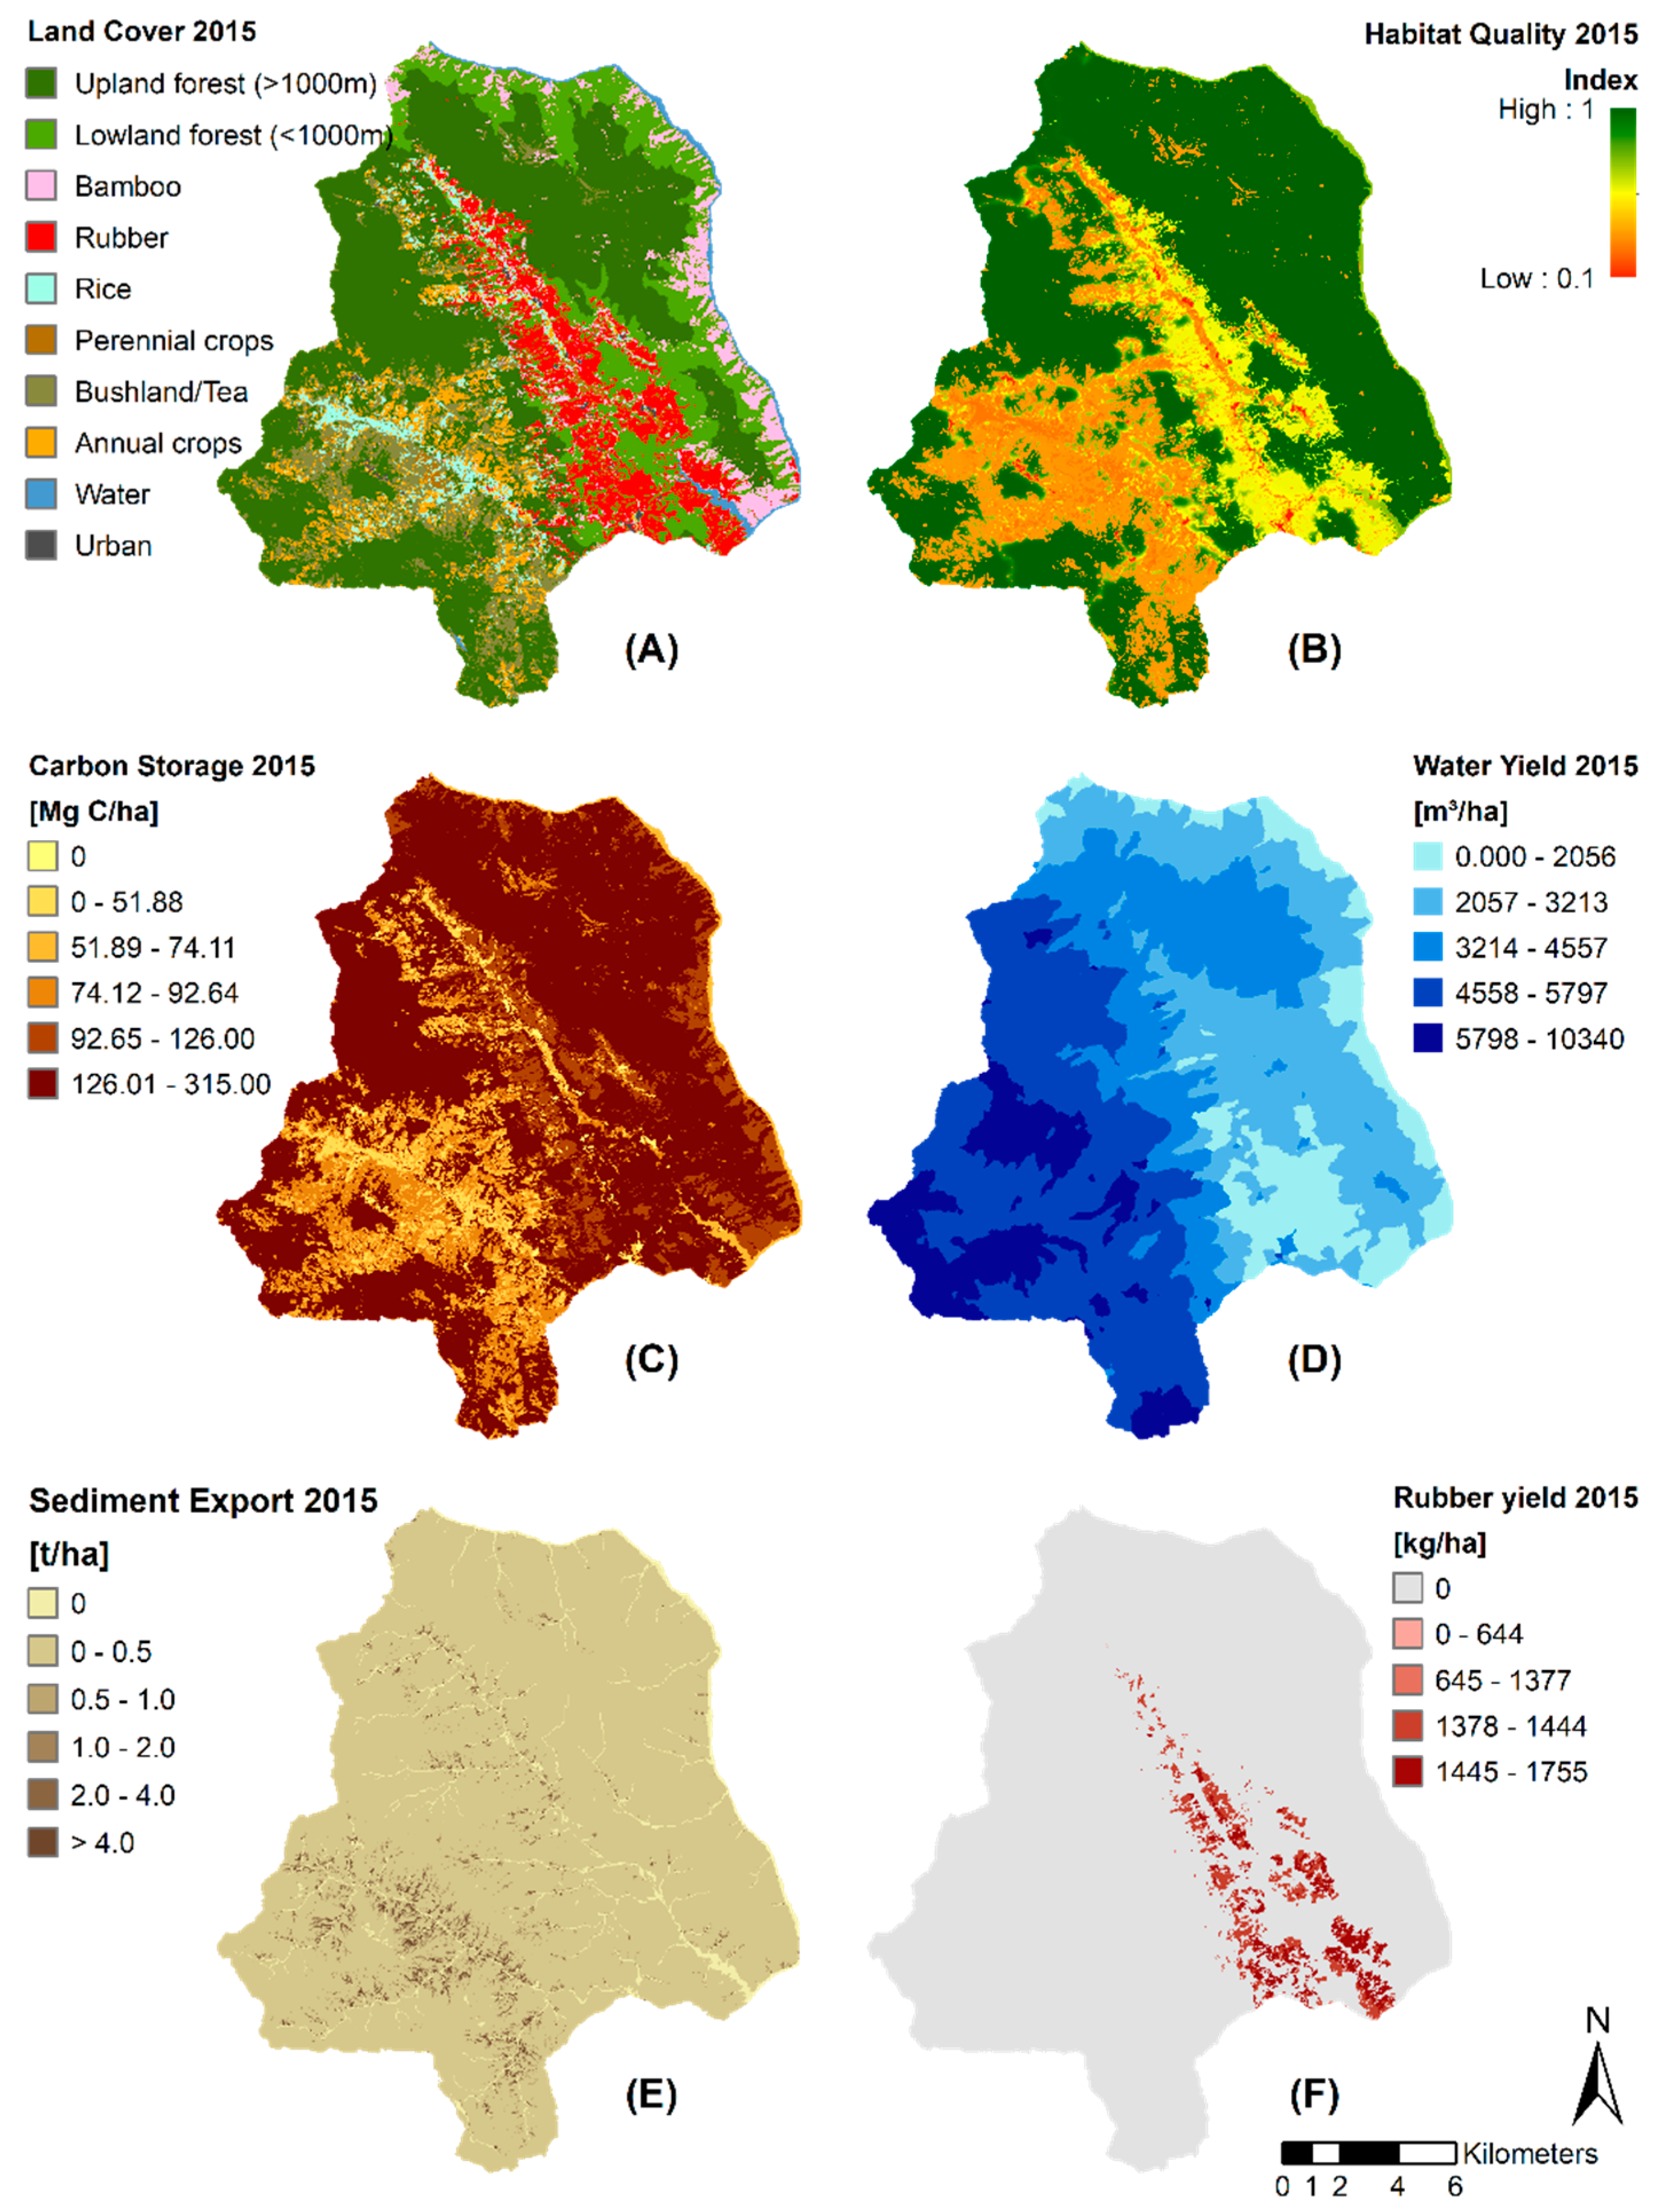
3.1. Simulated Land Use Changes and Biophysical Model Results

The proportions of land cover categories in the Nabenhe Reserve at the end of each scenario are shown in Table 3. In the BAU scenario, rubber areas increased from 9.4 to 15.2% of the study area. This resulted in the loss of 5.8% of the total forest areas in the nature reserve. In comparison to their extent in 2015, bushland/tea areas increased by 23.3%. The reforestation measures in the 5YP scenario lead to an increase of 20.5% of upland forest areas in comparison to their coverage in 2015. Lowland forest areas decreased by 12.3%, while rubber plantations gained 11.5% in comparison to 2015. The reforestation measures resulted in bushland/tea areas decreasing to a quarter of their size of 2015 in the 5YP scenario and to a fifth in BTO. In BTO, rubber areas increased by 12.6% while upland forest areas increased by 21.6% of their former shares of the nature reserve in 2015.
These simulated land use changes had varying effects on the supply of ESS. Summed results for the whole Nabanhe Reserve of each sub-model of InVEST are shown in Table 4 for the initial time step (2015) and the final year of each scenario (2040). In BAU, sediment export rates increased by 13.8% throughout the simulation period. Carbon storage, habitat quality, and water yield decreased by 4.5%, 3.1%, and 3.7%, respectively. In comparison to the BAU scenario, the 5YP and BTO scenarios lead to a higher potential for carbon storage, provision of high quality habitats, and increasing sediment retention. Compared to the initial state of 2015, all three scenarios resulted in an increase of predicted rubber yields for 2040: 61.2% for BAU, 36.4% for 5YP, and 57.8% for BTO. There is a discrepancy in the relatively low rates of rubber-related land use changes and the large differences in rubber yields when comparing the initial and the final states of the scenarios. The explanation for this is that about 50% of the areas classified as rubber in the land use map of 2015 are rubber plantations, which are too young to be tapped and only reach their productive age throughout the course of the simulation period.
In addition to a depiction of land cover in the Nabanhe Reserve, spatial representations for every ESS are shown in Figure 2. The results are depicted for the initial condition (2015) and the results for the final year of each scenario are given in the Supplementary Material (Figures S2–S4).

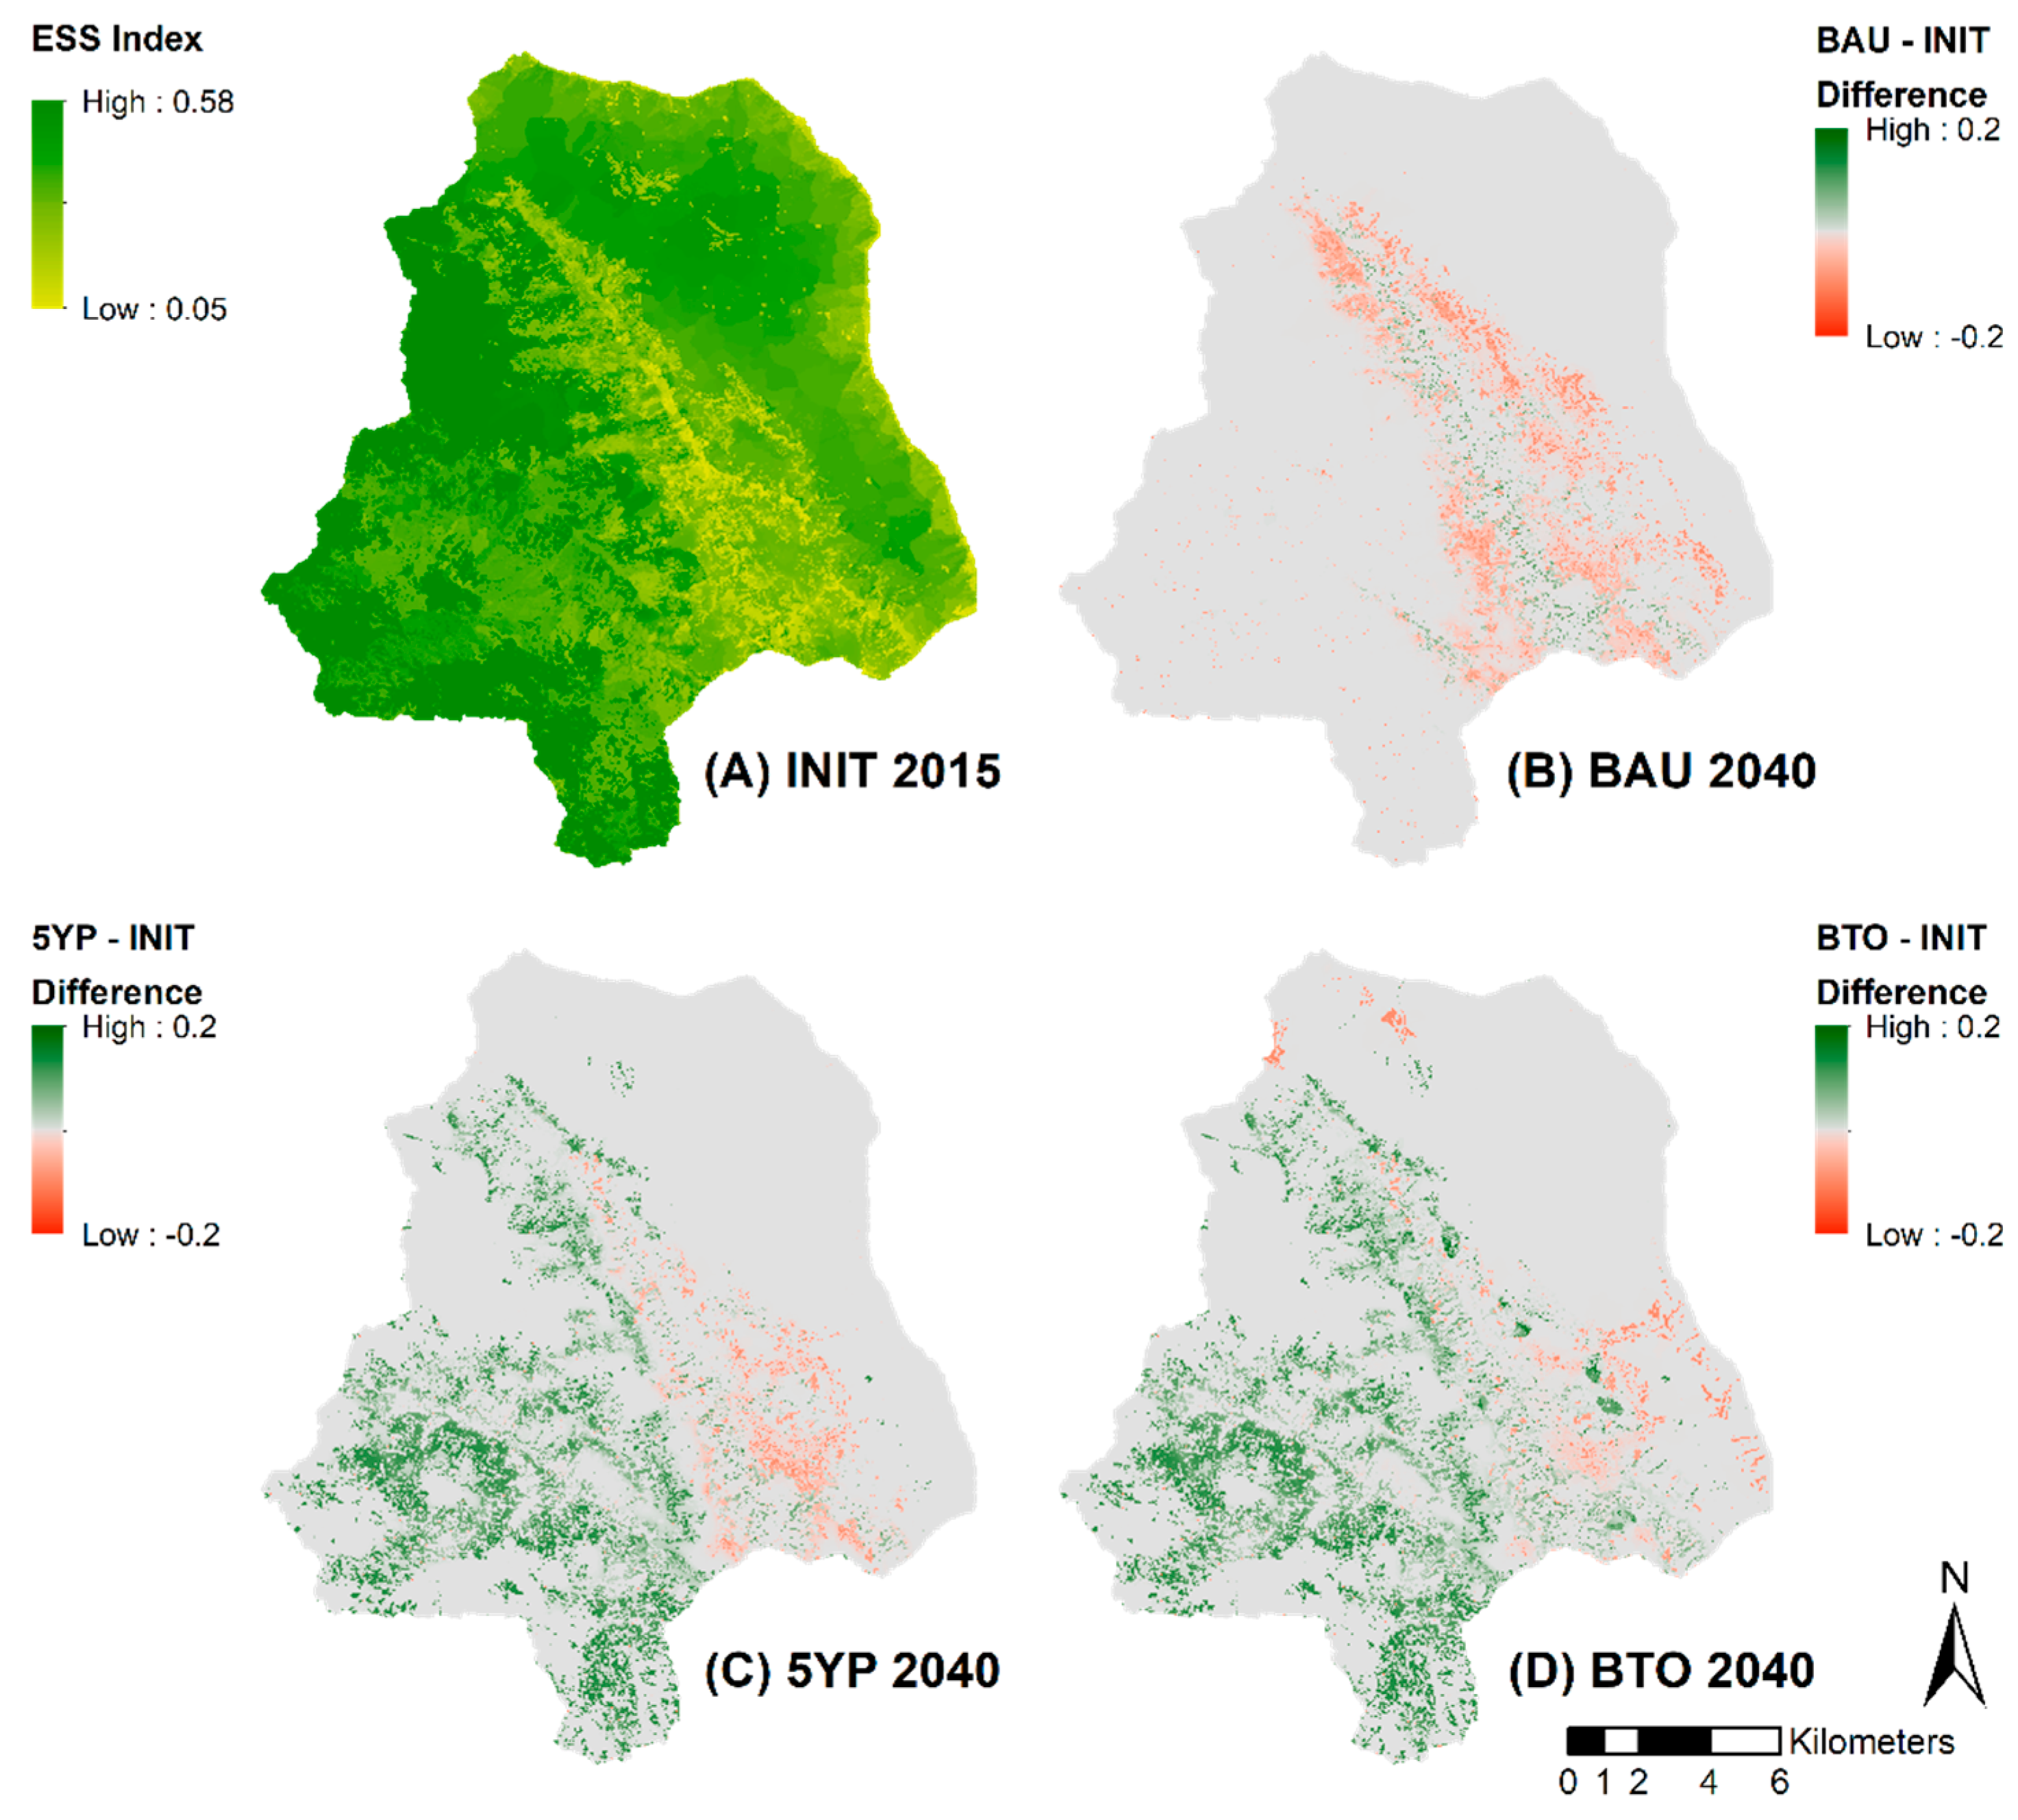
3.2. Scenario Comparisons of Integrated Spatial ESS Supply

Figure 3 depicts a map of integrated ESS supply for the initial state of 2015 (A). We chose to limit the mapped results of ESS indices to rankings by the PA group using the ROC weighting method. Results based on the other stakeholder groups and weighting methods feature a similar spatial representation and are shown in the next sub-section of the results chapter using a temporal representation. In the integrated ESS supply map, dark green areas (high ESS index) mainly represent secondary forest areas in the uplands. Lower values are found in urban, as well as in agriculturally dominated areas. (B–D) depict changes in the integrated ESS values compared to (A) at the end of the BAU, 5YP, and BTO scenario, respectively. Integrated ESS supply maps for the final year of each scenario are given in the Supplementary Material (Figure S5). In BAU, we mainly observe the negative impact of rubber expansion on the integrated ESS index. New rubber plantations on locations in the lowlands with potentially high yields show positive changes. None of the land use changes introduced in the scenarios change the integrated ESS index by more than 20% per pixel in comparison to the initial state. In (C,D), we observe the positive changes introduced by the reforestation efforts in the uplands, as well as the weed management changes in rubber plantations (D), as they increase the integrated ESS index for rubber areas with reduced erosion amounts. The negative changes are mainly due to shifting rubber yields in the lifespan of rubber plantations, as many areas that were productive in 2015 go through a re-establishment phase and are not yet ready to be tapped in 2040.

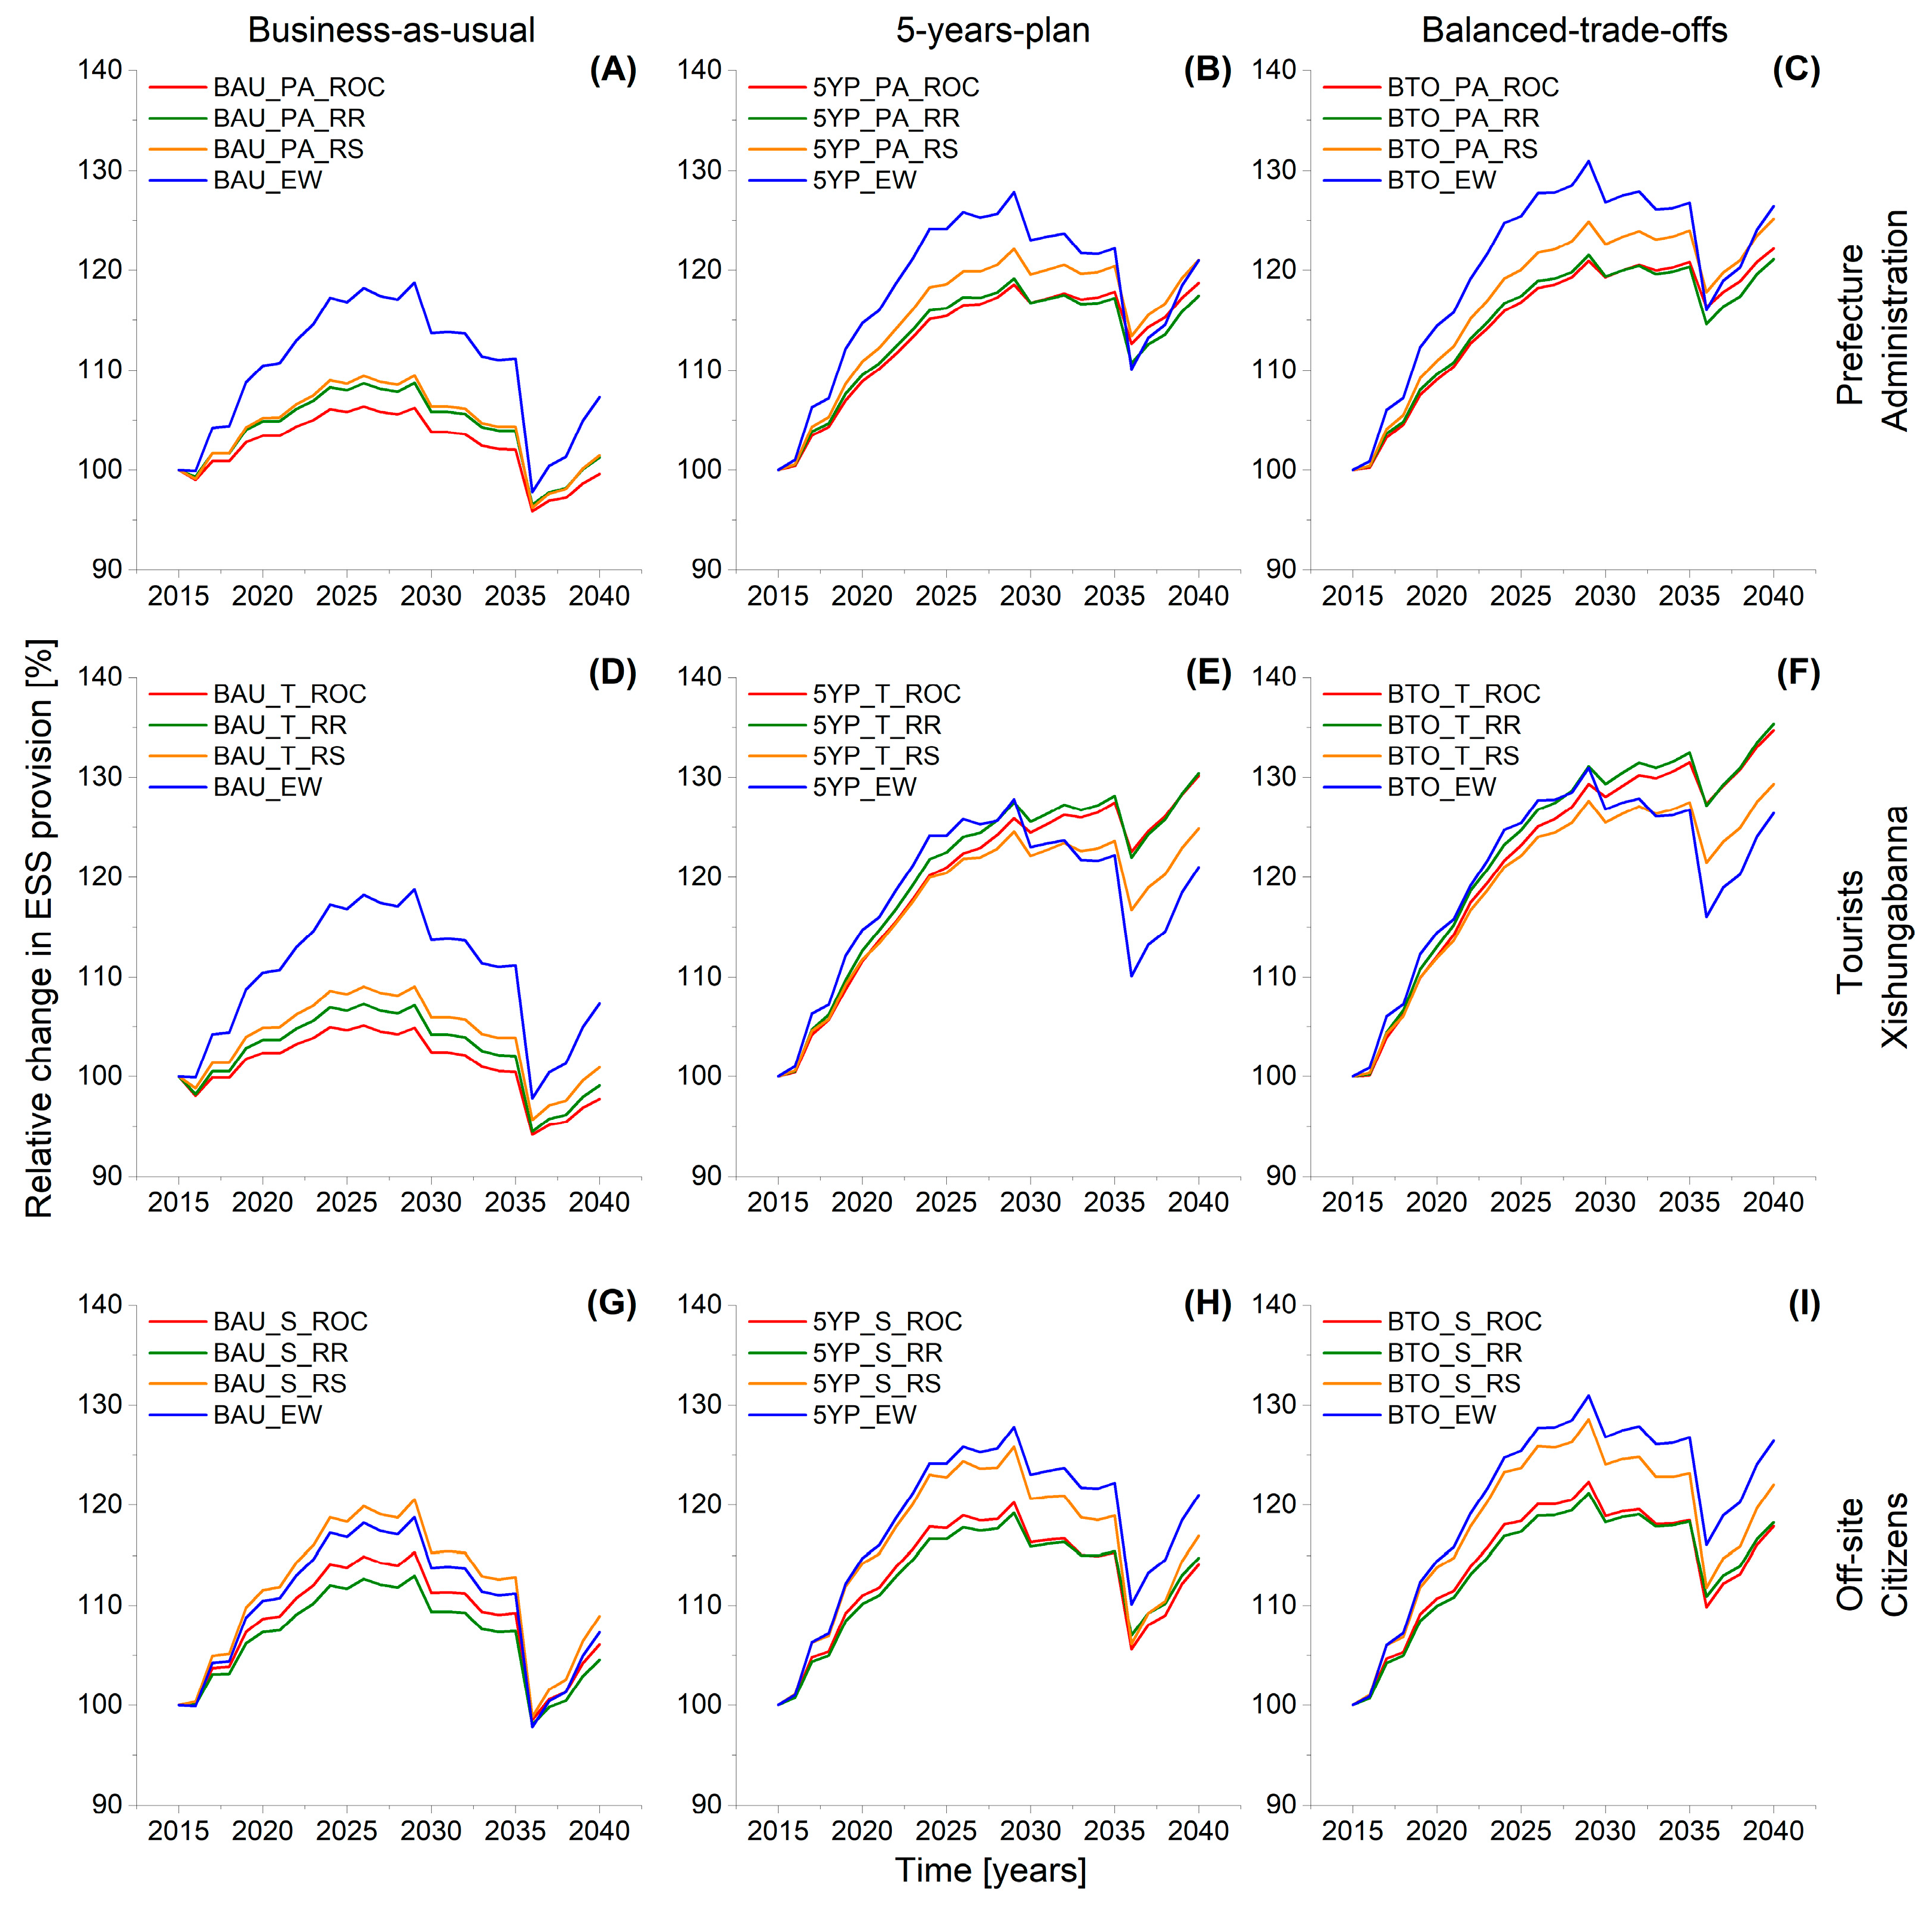
3.3. Scenario Comparisons of Temporal Integrated ESS Supply

Figure 4 shows the changes in the summed integrated ESS indices for the Nabanhe Reserve throughout the simulation period for each scenario according to each stakeholder groups’ ranks and weighting method. With rankings of the PA group, the curves for the weighted integrated ESS indices are generally lower in comparison to the curve of equal weights. The weighted curves for the BAU scenario ranked by the T group depict a similar relationship to the curve of equal weights in comparison to PA. In contrast, the trajectories using the T group ranks for the 5YP and BTO scenario result in higher ESS indices as compared to equal weights by the end of the scenario. These exceptions aside, comparing the scenario trajectories with respect to weighting methods, we find the same trends throughout the scenarios and stakeholder rankings, with ROC and RR leading to similar results and RS resulting in slightly higher values in comparison to ROC and RR.
To give an indicator of the performance of the scenarios in relation to the initial condition of 2015 (set to 100%) with respect to the ranks of the stakeholder groups and weighting methods, we list the integrated ESS indices at the end of the simulation period (2040) in Table 5. We generally find the lowest values in the BAU scenario, higher values for 5YP, and the highest values for BTO, regardless of which weighting method or stakeholder groups’ preferences were used. Differences between the ranks of the stakeholder groups are most pronounced in group T, as the lowest ESS indices result from the BAU scenario and the highest ESS indices from the BTO scenario.

4. Discussion

4.1. Weighting Methods and ESS Evaluation

While reviewing tools for the spatial modeling of ESS, Ochoa & Urbina-Cardona (2017) [63] found that of all reviewed publications, only 21.6% analysed three or more ESS categories, with the majority focusing on only one ESS category (60%). With this study, we contribute to the small number of papers quantitatively assessing multiple ESS including regulation services (water yield, sediment retention, and carbon storage), biodiversity (habitat quality for multiple species), and a very crucial provisioning service for the study area (rubber yield).
The time series of integrated ESS indices for all three scenarios generally showed the results we expected during the scenario design phase. The biophysical results assessed by InVEST depict a decreasing trend for all ESS in the BAU scenario, while rubber yields are increasing. When compared to the other scenarios, the equally weighted integrated ESS trajectories showed the lowest values in BAU as the expansion of rubber plantations lowers the provision of all ESS aside from rubber yields. Nevertheless, the increase in rubber yields is high enough to trade off against the loss in other ESS, when focusing on equally weighted indices only. Rubber yields are increasing throughout the greater part of the simulation period until the year 2036. At that point in time, many plantations which were planted before 2011, when market prices for rubber were at a peak, reach the end of their economic lifespan in the simulation. At this point, the negative trend in the other ESS becomes apparent and leads to the first negative changes of the integrated ESS indices in relation to the initial state of 2015. As roughly half of all rubber plantations in Nabanhe Reserve reach their productive stage during the first years of the simulation, a high increase in rubber yields is present in all scenarios, regardless of the differing rubber expansion rates. For the provisioning of ESS, our results show that the 5YP scenario is a clear improvement in comparison to the BAU scenario, confirming that the current regional policy, if properly implemented, could improve the provision of ESS. Additionally, we were able to further develop the 5YP scenarios’ positive impacts on the supply of ESS with the BTO scenario by means of a reduced herbicide application in rubber plantations, as well as upland and riverine buffer zone reforestation measures.
In a review on the social evaluation of ESS, Felipe-Lucia et al. (2015) [64] found that 22.9% of the reviewed studies focused on preference rankings for ESS, while only 7.2% provided a comparison between the present and future provision of ESS. This study adds to the lacking numbers of ESAs for future scenarios and is the first to do so for rubber production systems. Improvements in regard to the ESS evaluation could be made by using more sophisticated techniques such as Likert Scales [65] or the Analytical Hierarchy Process [66].

4.2. Transdisciplinarity and Ranking of Multiple ESS

We deem the rankings of the PA group to be the most representative for the ESA, as this group has the longest and most direct relationship with environmental changes in the study area. The beneficial effects of the measures introduced in the 5YP and BTO scenario are not only present for the equally weighted ESS indices, but also for the ESS indices as weighted by the PA group, albeit with lower total values. The ESS indices as weighted by the T group lead to the lowest values for BAU and the highest values for 5YP and BTO. This suggests that the governmental land use plan might also be beneficial for the tourism sector. We assume that this result would have been even more pronounced if cultural services had been included in the ESA. The ESS indices as weighted by the S group show the highest ESS indices for BAU and the lowest values for 5YP and BTO in comparison to the other stakeholder groups. Many measures introduced in 5YP and BTO were specifically targeted to enhance sediment retention. Group S ranked sediment retention as second to last in terms of importance (as compared to rank 1 for Group T and rank 2 for Group PA). Therefore, the improvements in the landscapes potential to retain sediments in the 5YP and BTO scenario have a lower impact on the integrated ESS indices as ranked by Group S in comparison to the ranks of Group T or Group PA.
The results suggest that the integrated indices for the provisioning of ESS in all scenarios would be overestimated without the inclusion of the stakeholder groups, as the integrated ESS indices based on equal weights generally lead to higher values in comparison to the rank-weighted ESS indices. The difference between the weighted and unweighted integrated ESS trajectories was most pronounced in the BAU scenario when using the rankings of the PA and T groups.
We refrained from using benefit transfer methods for the ESA, as the assignment of monetary values to ESS is highly dependent on the beneficiaries and the case-specific context, and may vary highly in terms of spatial and temporal scales [67]. Roughly half of all publications on ESS in China focus on monetary valuation, with about 32% adopting the benefit transfer framework proposed by Costanza et al. (1997) [25,68]. Only 31% of ESS studies relied on quantitative assessments and only 2% used a perspective-based valuation approach [68], which represent the approaches we combined in this study. The spatial heterogeneity of the study area precluded the use of direct benefit transfers. Different ESS evaluation methods, ranging from monetary to expert-opinion-based evaluation, can drastically alter the outcome of the assessment [27]. This holds true for the preference-based evaluation method used in this study as well. The importance of each ESS is dependent on whom the question is posed to, who the actual beneficiaries are, and which method is used to weigh the options against one another.
As shown in this study, future land use scenarios in combination with stakeholder preferences on ESS is an advantageous pathway to pursue for assessing the effect of policy plans on the supply of ESS. Using a dedicated and well-documented software application such as InVEST provides a basis for comparisons with future ESAs of rubber cultivation systems, as it has become the most frequently applied tool to model ESS in recent years [63]. Improvements to the design of the scenarios would be possible by utilizing land use optimization algorithms, which were shown to successfully optimize the provision of ESS [48,49], as well as an active integration of multifunction and uncertainty effects [69]. We do not claim that BTO is the best possible solution for our study area, but we want to emphasize that the close interaction with stakeholders not only confirmed the viability of our suggested management measures, but also widened their understanding of the consequences of future land use conversions they are accountable for. As put forward by Seppelt et al. (2013) [35], optimized landscapes might not be reachable given the current political environment and land use system. Our method of involving stakeholders from the very start of the scenario design allowed us to circumvent this problem.
The evaluation of ESS presented in this study is based on stakeholder preferences, but critical decisions concerning land use change and management still lie in the hands of the farmers. Water availability and erosion have been identified as being of critical importance to the local stakeholders (PA), but it is hard to imagine the conservation of environmental services without economic incentives or policy regulations. Smajgl et al. (2015) [70] concluded that incentive mechanisms such as PES (payments for ecosystem services) should be implemented with great caution, as they can lead to unexpected results such as a further increase of rubber areas. On the other hand, PES schemes might lead to higher adoption rates of rubber agroforests, as shown in a case study from Sumatra by Villamor et al. (2014), although the majority of (simulated) farmers there persisted in cultivating monoculture rubber. Although beneficial, our work with stakeholders still only accounted for a very limited reach, leaving a majority of the potential beneficiaries of our work out of the picture. Our results revealed promising land use plans for the future in Xishuangbanna, but their implementation might still pose a considerable challenge.

4.3. Model Uncertainties

Model calibration and validation represent crucial factors for uncertainty evaluation in ESAs, but are often omitted due to the scale, scope, and multidisciplinary character of the respective assessments [50,60,71]. These factors also increase the difficulty to appropriately monitor variables such as sediment export or water yield over a long term, especially in remote areas of subtropical mountainous SEA.
Several studies conclude that the expansion of rubber plantations has negative effects on the water cycle in Xishuangbanna and other parts of SEA [15,72,73]. Liu et al. (2017) [24] found that the expansion of plantations (also including tea and sugarcane) decreased the water yield by 32% (and carbon storage by 45%) in a period between 1976 and 2012. In comparison, our study revealed relatively minor changes for water yield (a decrease of 4.5% in BAU), even though forest and rubber areas undergo the highest transformation rates throughout all scenarios. Reasons for this are the shorter simulation period and the large share of forest areas in the Nabanhe Reserve. Averaged on an annual basis, there is only a 10% difference between the evapotranspiration coefficients (Kc) for rubber and the forest categories, which largely explains the small changes in total water yield predicted by the InVEST water yield model. The model is likely to yield different results when seasonal variations of Kc coefficients are implemented into the model, reflecting the strong seasonality in precipitation and leaf area dynamics in the region.
The initial run of the sediment retention model identified high altitude bushland areas as most prone to erosion. The expansion of rubber plantations in the BAU scenario accounted for the additional sediment exports (an increase of 13.5%). In 5YP and BTO, the encroachment of rubber into the few remaining areas with suitable environmental conditions in the Nabanhe Reserve successfully avoided additional patches with a high erosion probability. On the landscape scale, however, the high reduction of sediment exports in 5YP and BTO was mainly due to reforestation efforts in the uplands, replacing the bushlands with trees. Additional reductions found in BTO were due to changes in ground cover management practices in rubber plantations. The large difference in sediment export compared to the minor differences in water yield seem to be contradictive, but comparable relationships have been confirmed in earlier studies on rubber plantation management changes [74]. However, the water yield sub-model of InVEST did not allow us to adequately capture the effect of management changes introduced in the BTO scenario when compared to field measurements of surface runoff in rubber plantations in the study area [12].
For this study, sediment export and water yield model runs were calibrated with annual sediment export and run-off measurements in a sub-watershed of the study area in 2014, a year with below average precipitation amounts in Nabanhe Reserve [12]. Therefore, a certain discrepancy with the long term annual averages used as the precipitation input is to be expected and we assume the water yield results to be slightly underestimated by InVEST. The same holds true for the sediment export model. Since we evaluated percentage changes compared to the initial situation in 2015, the uncertainties in the quantitative amounts of erosion and run-off are of minor importance to the trajectories of integrated ESS provision within the timeframe of the scenario simulations (Figure 4).
Sensitivity analyses of InVEST water yield applications [75] have shown the model to respond most sensitively to the amount of annual average precipitation, followed by potential evapotranspiration and the plant evapotranspiration coefficients Kc. We performed sensitivity analyses for both the water yield and sediment export models. Detailed results for both are given in the Supplementary Material (Figures S6 and S7).

5. Conclusions

This study estimates the effects of potential future land use change scenarios on the provisioning of multiple ESS in a mountainous watershed. It is the first of its kind to combine spatially explicit modeling of five relevant ESS for scenarios initiated and validated by stakeholders for rubber cultivation systems. Furthermore, we subjected the modeled results to a preference-based evaluation by multiple stakeholder groups. Our analyses show detrimental consequences induced by rubber expansions for all assessed ESS, with the exception of raw material provision (rubber yields). Based on a comprehensive assessment of ESS, we find that further continuing the trend of rubber expansions in the study area is not the best option in terms of integrated ESS supply on a landscape scale. Land use planning alternatives, such as rubber expansions restricted to suitable areas only, in combination with reforestation efforts at less suitable locations, might be used to keep crucial environmental functions intact. Management options such as reduced herbicide application in rubber plantations and the establishment of riverine buffer zones reduce the amount of exported sediments. Additionally, the landscape’s potential to sequester carbon and provide suitable habitats for a variety of plant and animal species is enhanced by these measures. The cycle of repeatedly integrating stakeholder feedback into scenario development and model adaptions not only confirmed the practicability of our suggested rubber management options, but also gave stakeholders a wider view on the consequences of future land use conversions they are accountable for. The inclusion of stakeholder preferences in the evaluation of ESS was crucial, as the integrated ESS indices were generally overestimated when using equally weighted ESS results in the ESA. We conclude that policy regulations at the local level, if properly assessed with spatial models and integrated stakeholder feedback, have the potential to buffer the typical trade-off between agricultural intensification and environmental protection for rubber cultivation systems in South-East Asia. Implementing these regulations at the local level might still pose a considerable challenge.

Supplementary Materials

The following are available online at www.mdpi.com/1999-4907/8/12/505/s1, Figure S1: Land cover maps of the Nabanhe Reserve of the initial state of 2015 (A) and the final year (2040) of each scenario: Business-as-usual (B), 5-years-plan (C) and Balanced-trade-offs (D), Figure S2: Ecosystem service results at the last year (2040) of the BAU scenario (A) including habitat quality (B), carbon storage (C), water yield (D), sediment export (E) and rubber yield (F), Figure S3: Ecosystem service results at the last year (2040) of the 5YP scenario (A) including habitat quality (B), carbon storage (C), water yield (D), sediment export (E) and rubber yield (F), Figure S4: Ecosystem service results at the last year (2040) of the BTO scenario (A) including habitat quality (B), carbon storage (C), water yield (D), sediment export (E) and rubber yield (F), Figure S5: Ecosystem service index integrating the five ecosystem services weighted by Xishuangbanna prefecture administration using the ROC (centroid weight) method for the initial year of 2015 (A) as well as additional results for the final year of each scenario (Business-as-usual (B), 5-years-plan (C) and Balanced-trade-offs (D)), Figure S6: Sensitivity analysis of the InVEST sediment export model, Figure S7: Sensitivity analysis of the InVEST water yield model, Table S1: Input values for the InVEST sediment retention model for the C- and P-factors of the USLE equation for every land cover category, Table S2: Additional parameterization (spatial data and calibration parameters) for the InVEST sediment retention model, Table S3: Kc coefficients and rooting depth of every land cover category for the InVEST water yield model listed with their sources, Table S4: Additional input parameters for the InVEST water yield model, Table S5: Input values for the carbon storage model for each carbon pool and every land use category in Nabanhe Reserve, Table S6: Habitat quality threats for the BAU, the 5YP and the BTO scenario in parenthesis (where applicable), Table S7: Overall habitat scores (vertebrates, invertebrates, flora) and the sensitivity of each land cover category to each threat, Table S8: Rubber yield estimations based on survey data in Xishuangbanna.

Acknowledgments

This study was supported by the German-Chinese joint research project SURUMER (Sustainable Rubber Cultivation in the Mekong Region), funded by the German Federal Ministry of Education and Research (BMBF) (Grant number FKZ 01LL0919), who also provided the funding for open access publication. Many thanks go to all SURUMER members, especially Xueqing Yang, Reza Golbon, Manuel Krauss, Lydia Seitz, Franziska Harich, Sabine Baumgartner, Sabine Stürz, Konrad Martin, Michael Ahlheim, Hermann Waibel, Shi Min, Thomas Aenis, Gerhard Langenberger, and Carsten Marohn. Thanks to EFTAS Remote Sensing Transfer of Technology GmbH group for creating the initial land use map. The financial support of the “Water–People–Agriculture” Research Training Group funded by the Anton & Petra Ehrmann-Stiftung is gratefully acknowledged. We would like to thank two anonymous reviewers for their comments and suggestions, which strengthened the quality of the paper substantially.

Author Contributions

All authors contributed to the ideas and experimental design of the project. S.B. created the land use maps of the scenarios. K.T. and I.H. performed the model parameterization. K.T. modeled the results. K.T., I.H., and M.C. analyzed the results. J.W. facilitated stakeholder interactions. H.L. provided field data for model parameterization and calibration. K.T. wrote the paper. All authors provided editorial advice to the structure and content of the paper.

Conflicts of Interest

The authors declare no conflict of interest.

References

  1. Millenium Ecosystem Assessment. Ecosystems and Human Well-Being: Synthesis; Island Press: Washington, DC, USA, 2005; ISBN 1-59726-040-1. [Google Scholar]
  2. Daily, G.C.; Matson, P.A. Ecosystem services: From theory to implementation. Proc. Natl. Acad. Sci. USA 2008, 105, 9455–9456. [Google Scholar] [CrossRef] [PubMed]
  3. Costanza, R.; de Groot, R.; Sutton, P.; van der Ploeg, S.; Anderson, S.J.; Kubiszewski, I.; Farber, S.; Turner, R.K. Changes in the global value of ecosystem services. Glob. Environ. Chang. 2014, 26, 152–158. [Google Scholar] [CrossRef]
  4. Metzger, M.J.; Rounsevell, M.D.A.; Acosta-Michlik, L.; Leemans, R.; Schröter, D. The vulnerability of ecosystem services to land use change. Agric. Ecosyst. Environ. 2006, 114, 69–85. [Google Scholar] [CrossRef]
  5. Martínez-Harms, M.J.; Balvanera, P.; Methods, N. Environmental consequences of the demise in swidden cultivation for mapping ecosystem service supply: A review. Int. J. Biodivers. Sci. Ecosyst. Serv. Manag. 2012, 8, 17–25. [Google Scholar] [CrossRef]
  6. Ziegler, A.D.; Bruun, T.B.; Guardiola-Claramonte, M.; Giambelluca, T.W.; Lawrence, D. Thanh Lamin montane mainland southeast asia: Hydrology and geomorphology. Hum. Ecol. 2009, 37, 361–373. [Google Scholar] [CrossRef]
  7. Fox, J.; Castella, J.-C. Expansion of rubber (Hevea brasiliensis) in Mainland Southeast Asia: What are the prospects for smallholders? J. Peasant Stud. 2013, 40, 155–170. [Google Scholar] [CrossRef]
  8. Chen, H.; Yi, Z.-F.; Schmidt-Vogt, D.; Ahrends, A.; Beckschäfer, P.; Kleinn, C.; Ranjitkar, S.; Xu, J. Pushing the limits: The pattern and dynamics of rubber monoculture expansion in Xishuangbanna, SW China. PLoS ONE 2016, 11, 1–15. [Google Scholar] [CrossRef] [PubMed]
  9. Ahlheim, M.; Börger, T.; Frör, O. Replacing rubber plantations by rain forest in Southwest China—Who would gain and how much? Environ. Monit. Assess. 2015, 187, 1–20. [Google Scholar] [CrossRef] [PubMed]
  10. Li, H.; Ma, Y.; Liu, W.; Liu, W. Soil changes induced by rubber and tea plantation establishment: Comparison with tropical rain forest soil in Xishuangbanna, SW China. Environ. Manag. 2012, 50, 837–848. [Google Scholar] [CrossRef] [PubMed]
  11. Wu, Z.-L.; Liu, H.-M.; Liu, L.-Y. Rubber cultivation and sustainable development in Xishuangbanna, China. Int. J. Sustain. Dev. World Ecol. 2001, 8, 337–345. [Google Scholar] [CrossRef]
  12. Liu, H.; Blagodatsky, S.; Giese, M.; Liu, F.; Xu, J.; Cadisch, G. Impact of herbicide application on soil erosion and induced carbon loss in a rubber plantation of Southwest China. Catena 2016, 145, 180–192. [Google Scholar] [CrossRef]
  13. Li, H.; Ma, Y.; Aide, T.M.; Liu, W. Past, present and future land-use in Xishuangbanna, China and the implications for carbon dynamics. For. Ecol. Manag. 2008, 255, 16–24. [Google Scholar] [CrossRef]
  14. Yang, X.; Blagodatsky, S.; Lippe, M.; Liu, F.; Hammond, J.; Xu, J.; Cadisch, G. Land-use change impact on time-averaged carbon balances: Rubber expansion and reforestation in a biosphere reserve, South-West China. For. Ecol. Manag. 2016, 372, 149–163. [Google Scholar] [CrossRef]
  15. Guardiola-Claramonte, M.; Troch, P.A.; Ziegler, A.D.; Giambelluca, T.W.; Durcik, M.; Vogler, J.B.; Nullet, M.A. Hydrologic effects of the expansion of rubber (Hevea brasiliensis) in a tropical catchment. Ecohydrology 2010, 3, 306–314. [Google Scholar] [CrossRef]
  16. Li, H.; Aide, T.M.; Ma, Y.; Liu, W.; Cao, M. Demand for rubber is causing the loss of high diversity rain forest in SW China. Biodivers. Conserv. 2007, 16, 1731–1745. [Google Scholar] [CrossRef]
  17. Cotter, M.; Häuser, I.; Harich, F.K.; He, P.; Sauerborn, J.; Treydte, A.C.; Martin, K.; Cadisch, G. Biodiversity and ecosystem services—A case study for the assessment of multiple species and functional diversity levels in a cultural landscape. Ecol. Indic. 2017, 75, 111–117. [Google Scholar] [CrossRef]
  18. Meng, L.-Z.; Martin, K.; Weigel, A.; Liu, J.-X. Impact of rubber plantation on carabid beetle communities and species distribution in a changing tropical landscape (southern Yunnan, China). J. Insect Conserv. 2012, 16, 423–432. [Google Scholar] [CrossRef]
  19. Cotter, M.; Berkhoff, K.; Gibreel, T.; Ghorbani, A.; Golbon, R.; Nuppenau, E.-A.; Sauerborn, J. Designing a sustainable land use scenario based on a combination of ecological assessments and economic optimization. Ecol. Indic. 2014, 36, 779–787. [Google Scholar] [CrossRef]
  20. Häuser, I.; Thellmann, K.; Cotter, M.; Sauerborn, J. Ecosystem services and biodiversity of rubber plantations—A systematic review. CAB Rev. Perspect. Agric. Vet. Sci. Nutr. Nat. Resour. 2015, 10. [Google Scholar] [CrossRef]
  21. Pfund, J.-L.; Watts, J.D.; Boissière, M.; Boucard, A.; Bullock, R.M.; Ekadinata, A.; Dewi, S.; Feintrenie, L.; Levang, P.; Rantala, S.; et al. Understanding and integrating local perceptions of trees and forests into incentives for sustainable landscape management. Environ. Manag. 2011, 48, 334–349. [Google Scholar] [CrossRef] [PubMed] [Green Version]
  22. Sohel, M.S.I.; Ahmed Mukul, S.; Burkhard, B. Landscape’s capacities to supply ecosystem services in Bangladesh: A mapping assessment for Lawachara National Park. Ecosyst. Serv. 2015, 12, 128–135. [Google Scholar] [CrossRef]
  23. Hu, H.; Liu, W.; Cao, M. Impact of land use and land cover changes on ecosystem services in Menglun, Xishuangbanna, Southwest China. Environ. Monit. Assess. 2008, 146, 147–156. [Google Scholar] [CrossRef] [PubMed]
  24. Liu, S.; Yin, Y.; Liu, X.; Cheng, F.; Yang, J.; Li, J.; Dong, S.; Zhu, A. Ecosystem Services and landscape change associated with plantation expansion in a tropical rainforest region of Southwest China. Ecol. Model. 2017, 353, 129–138. [Google Scholar] [CrossRef]
  25. Costanza, R.; D’Arge, R.; De Groot, R.; Farber, S.; Grasso, M.; Hannon, B.; Limburg, K.; Naeem, S.; O’Neill, R.V.; Paruelo, J.; et al. The value of the world’s ecosystem services and natural capital. Nature 1997, 387, 253–260. [Google Scholar] [CrossRef]
  26. Bateman, I.J.; Brouwer, R.; Ferrini, S.; Schaafsma, M.; Barton, D.N.; Dubgaard, A.; Hasler, B.; Hime, S.; Liekens, I.; Navrud, S.; et al. Making Benefit Transfers Work: Deriving and Testing Principles for Value Transfers for Similar and Dissimilar Sites Using a Case Study of the Non-Market Benefits of Water Quality Improvements Across Europe. Environ. Resour. Econ. 2011, 50, 365–387. [Google Scholar] [CrossRef]
  27. Koschke, L.; Fürst, C.; Frank, S.; Makeschin, F. A multi-criteria approach for an integrated land-cover-based assessment of ecosystem services provision to support landscape planning. Ecol. Indic. 2012, 21, 54–66. [Google Scholar] [CrossRef]
  28. Atkinson, G.; Bateman, I.; Mourato, S. Recent advances in the valuation of ecosystem services and biodiversity. Oxf. Rev. Econ. Policy 2012, 28, 22–47. [Google Scholar] [CrossRef]
  29. Gos, P.; Lavorel, S. Stakeholders’ expectations on ecosystem services affect the assessment of ecosystem services hotspots and their congruence with biodiversity. Int. J. Biodivers. Sci. Ecosyst. Serv. Manag. 2012, 8, 93–106. [Google Scholar] [CrossRef]
  30. Sharp, R.; Tallis, H.; Ricketts, T.; Guerry, A. D.; Wood, S. A.; Chaplin-Kramer, R.; Nelson, E.; Ennaanay, D.; Wolny, S.; Olwero, N.; et al. InVEST 3.3.3 User’s Guide; The Natural Capital Project: Standford, CA, USA, 2016. [Google Scholar]
  31. Seppelt, R.; Dormann, C.F.; Eppink, F.V.; Lautenbach, S.; Schmidt, S. A quantitative review of ecosystem service studies: Approaches, shortcomings and the road ahead. J. Appl. Ecol. 2011, 48, 630–636. [Google Scholar] [CrossRef]
  32. Seppelt, R.; Fath, B.; Burkhard, B.; Fisher, J.L.; Grêt-Regamey, A.; Lautenbach, S.; Pert, P.; Hotes, S.; Spangenberg, J.; Verburg, P.H.; et al. Form follows function? Proposing a blueprint for ecosystem service assessments based on reviews and case studies. Ecol. Indic. 2012, 21, 145–154. [Google Scholar] [CrossRef]
  33. The Natural Capital Project. How Does It Work? Available online: https://www.naturalcapitalproject.org/how-do-we-know-it-works/#where-we-work (accessed on 25 October 2017).
  34. Thompson, J.R.; Wiek, A.; Swanson, F.J.; Carpenter, S.R.; Fresco, N.; Hollingsworth, T.; Spies, T.A.; Foster, D.R. Scenario studies as a synthetic and integrative research activity for long-term ecological research. BioScience 2012, 62, 367–376. [Google Scholar] [CrossRef]
  35. Seppelt, R.; Lautenbach, S.; Volk, M. Identifying trade-offs between ecosystem services, land use, and biodiversity: A plea for combining scenario analysis and optimization on different spatial scales. Curr. Opin. Environ. Sustain. 2013, 5, 458–463. [Google Scholar] [CrossRef]
  36. Myers, N.; Mittermeier, R.A.; Mittermeier, C.G.; Da Fonseca, G.A.B.; Kent, J. Biodiversity hotspots for conservation priorities. Nature 2000, 403, 853–858. [Google Scholar] [CrossRef] [PubMed]
  37. Li, Z.; Zhang, Y.; Wang, S.; Yuan, G.; Yang, Y.; Cao, M. Evapotranspiration of a tropical rain forest in Xishuangbanna, Southwest China. Hydrol. Process. 2010, 24, 2405–2416. [Google Scholar] [CrossRef]
  38. Wehner, S.; Herrmann, S.; Berkhoff, K. CLUENaban—A land use change model combining social factors with physical landscape factors for a mountainous area in Southwest China. Ecol. Indic. 2014, 36, 757–765. [Google Scholar] [CrossRef]
  39. Xu, J. The political, social, and ecological transformation of a landscape: The case of rubber in Xishuangbanna, China. Mt. Res. Dev. 2006, 26, 254–262. [Google Scholar] [CrossRef]
  40. Aenis, T.; Wang, J.; Hofmann-Souki, S.; Lixia, T.; Langenberger, G.; Cadisch, G.; Martin, K.; Cotter, M.; Krauss, M.; Waibel, H. Research-praxis integration in South China—The rocky road to implement strategies for sustainable rubber cultivation in the Mekong Region. In River Sedimentation, Proceedings of the 13th International Symposium on River Sedimentation, Stuttgart, Germany, 19–22 September 2016; CRC Press: Boca Raton, FL, USA, 2017; p. 1343. [Google Scholar]
  41. Aenis, T.; Wang, J. From information giving to mutual scenario definition: Stakeholder participation towards Sustainable Rubber Cultivation in Xishuangbanna, Southwest China. In Farming Systems Facing Global Challenges: Capacities and Strategies; Aenis, T., Knierim, A., Riecher, M.-C., Ridder, R., Schobert, H., Fischer, H., Eds.; Humboldt-Universität zu Berlin, Lebenswissenschaftliche Fakultät: Berlin, Germany, 2016; Volume 1, pp. 618–625. [Google Scholar]
  42. Naban River Watershed National Nature Reserve Bureau. Naban River Watershed National Nature Reserve (NRWNNR)—Atlas of Ecological Baseline Results; 666100 Jinghong, Yunnan Province, China; NRWNNRB: Jinghong, China, 2014. [Google Scholar]
  43. Xu, J.; Grumbine, R.E.; Beckschäfer, P. Landscape transformation through the use of ecological and socioeconomic indicators in Xishuangbanna, Southwest China, Mekong Region. Ecol. Indic. 2014, 36, 749–756. [Google Scholar] [CrossRef]
  44. Ahrends, A.; Hollingsworth, P.M.; Ziegler, A.D.; Fox, J.M.; Chen, H.; Su, Y.; Xu, J. Current trends of rubber plantation expansion may threaten biodiversity and livelihoods. Glob. Environ. Chang. 2015, 34, 48–58. [Google Scholar] [CrossRef]
  45. Yi, Z.-F.; Cannon, C.H.; Chen, J.; Ye, C.-X.; Swetnam, R.D. Developing indicators of economic value and biodiversity loss for rubber plantations in Xishuangbanna, Southwest China: A case study from Menglun township. Ecol. Indic. 2014, 36, 788–797. [Google Scholar] [CrossRef]
  46. Marohn, C.; Cadisch, G. Land Use Change Impact Assessment. Available online: https://lucia.uni-hohenheim.de/en/85418 (accessed on 10 October 2017).
  47. Chang, N.-B.; Wen, C.-G.; Wu, S.L. Optimal management of environmental and land resources in a reservoir watershed by multiobjective programming. J. Environ. Manag. 1995, 44, 144–161. [Google Scholar] [CrossRef]
  48. Estrella, R.; Cattrysse, D.; van Orshoven, J. Comparison of Three Ideal Point-Based Multi-Criteria Decision Methods for Afforestation Planning. Forests 2014, 5, 3222–3240. [Google Scholar] [CrossRef] [Green Version]
  49. Uhde, B.; Heinrichs, S.; Stiehl, C.R.; Ammer, C.; Müller-Using, B.; Knoke, T. Bringing ecosystem services into forest planning—Can we optimize the composition of Chilean forests based on expert knowledge? For. Ecol. Manag. 2017, 404, 126–140. [Google Scholar] [CrossRef]
  50. Bhagabati, N.K.; Ricketts, T.; Sulistyawan, T.B.S.; Conte, M.; Ennaanay, D.; Hadian, O.; McKenzie, E.; Olwero, N.; Rosenthal, A.; Tallis, H.; et al. Ecosystem services reinforce Sumatran tiger conservation in land use plans. Biol. Conserv. 2014, 169, 147–156. [Google Scholar] [CrossRef]
  51. Polasky, S.; Nelson, E.; Pennington, D.; Johnson, K.A. The impact of land-use change on ecosystem services, biodiversity and returns to landowners: A case study in the state of Minnesota. Environ. Resour. Econ. 2011, 48, 219–242. [Google Scholar] [CrossRef]
  52. Hamel, P.; Guswa, A.J. Uncertainty analysis of a spatially explicit annual water-balance model: Case study of the Cape Fear basin, North Carolina. Hydrol. Earth Syst. Sci. 2015, 19, 839–853. [Google Scholar] [CrossRef]
  53. Wischmeier, W.H.; Smith, D.D. Predicting Rainfall Erosion Losses—A Guide to Conservation Planning; USDA, Science and Education Administration: Hyattsville, MD, USA, 1978.
  54. Sheikh, A.H.; Palria, S.; Alam, A. Integration of GIS and universal soil loss equation (USLE) for soil loss estimation in a Himalayan watershed. Recent Res. Sci. Technol. 2011, 3, 51–57. [Google Scholar]
  55. Waibel, H.; Min, S.; Huang, J. Small scale rubber farming and income risk in Xishuangbanna, China. In Proceedings of the World Congress on Agroforestry, Delhi, India, 10–14 February 2014. [Google Scholar]
  56. Nguyen, B.T. Large-scale altitudinal gradient of natural rubber production in Vietnam. Ind. Crops Prod. 2013, 41, 31–40. [Google Scholar] [CrossRef]
  57. Beckschäfer, P. Obtaining rubber plantation age information from very dense Landsat TM & ETM + time series data and pixel-based image compositing. Remote Sens. Environ. 2017, 196, 89–100. [Google Scholar] [CrossRef]
  58. Hijmans, R.J.; Cameron, S.E.; Parra, J.L.; Jones, P.G.; Jarvis, A. Very high resolution interpolated climate surfaces for global land areas. Int. J. Climatol. 2005, 25, 1965–1978. [Google Scholar] [CrossRef]
  59. Hoyer, R.; Chang, H. Assessment of freshwater ecosystem services in the tualatin and Yamhill basins under climate change and urbanization. Appl. Geogr. 2014, 53, 402–416. [Google Scholar] [CrossRef]
  60. Nelson, E.; Mendoza, G.; Regetz, J.; Polasky, S.; Tallis, H.; Cameron, D.R.; Chan, K.M.A.; Daily, G.C.; Goldstein, J.; Kareiva, P.M.; et al. Modeling multiple ecosystem services, biodiversity conservation, commodity production, and tradeoffs at landscape scales. Front. Ecol. Environ. 2009, 7, 4–11. [Google Scholar] [CrossRef]
  61. Ahlheim, M.; Frör, O.; Möller, B.; Zhang, Y.; Xi, W. Welfare Economic Valuation of a Sustainable Rubber Production in Southeast Asia: An Exemplary Study in SW-China. In Tropentag 2013 “Agricultural Development within the Rural-Urban Continuum”; Stuttgart-Hohenheim: Stuttgart, Germany, 2013. [Google Scholar]
  62. Roszkowska, E. Rank ordering criteria weighting methods–A comparative overview. Optim. Stud. Ekon. 2013, 14–33. [Google Scholar] [CrossRef]
  63. Ochoa, V.; Urbina-Cardona, N. Tools for spatially modeling ecosystem services: Publication trends, conceptual reflections and future challenges. Ecosyst. Serv. 2017, 26, 155–169. [Google Scholar] [CrossRef]
  64. Felipe-Lucia, M.R.; Comín, F.A.; Escalera-Reyes, J. A framework for the social valuation of ecosystem services. Ambio 2015, 44, 308–318. [Google Scholar] [CrossRef] [PubMed]
  65. Likert, R. A technique for the measurement of attitudes. Arch. Psychol. 1932, 22, 55. [Google Scholar]
  66. Saaty, T.L. How to make a decision: The analytic hierarchy process. Eur. J. Op. Res. 1990, 48, 9–26. [Google Scholar] [CrossRef]
  67. Schmidt, S.; Manceur, A.M.; Seppelt, R. Uncertainty of monetary valued ecosystem services—Value transfer functions for global mapping. PLoS ONE 2016, 11. [Google Scholar] [CrossRef] [PubMed]
  68. Jiang, W. Ecosystem services research in China: A critical review. Ecosyst. Serv. 2017, 26, 10–16. [Google Scholar] [CrossRef]
  69. Knoke, T.; Paul, C.; Hildebrandt, P.; Calvas, B.; Castro, L.M.; Härtl, F.; Döllerer, M.; Hamer, U.; Windhorst, D.; Wiersma, Y.F.; et al. Compositional diversity of rehabilitated tropical lands supports multiple ecosystem services and buffers uncertainties. Nat. Commun. 2016, 7, 11877. [Google Scholar] [CrossRef] [PubMed]
  70. Smajgl, A.; Xu, J.; Egan, S.; Yi, Z.-F.; Ward, J.; Su, Y. Assessing the effectiveness of payments for ecosystem services for diversifying rubber in Yunnan, China. Environ. Model. Softw. 2015, 69, 187–195. [Google Scholar] [CrossRef]
  71. Kovacs, K.; Polasky, S.; Nelson, E.; Keeler, B.L.; Pennington, D.; Plantinga, A.J.; Taff, S.J. Evaluating the Return in Ecosystem Services from Investment in Public Land Acquisitions. PLoS ONE 2013, 8. [Google Scholar] [CrossRef] [PubMed]
  72. Tan, Z.-H.; Zhang, Y.-P.; Song, Q.-H.; Liu, W.-J.; Deng, X.-B.; Tang, J.-W.; Deng, Y.; Zhou, W.-J.; Yang, L.-Y.; Yu, G.-R.; et al. Rubber plantations act as water pumps in tropical China. Geophys. Res. Lett. 2011, 38. [Google Scholar] [CrossRef]
  73. Giambelluca, T.W.; Mudd, R.G.; Liu, W.; Ziegler, A.D.; Kobayashi, N.; Kumagai, T.; Miyazawa, Y.; Lim, T.K.; Huang, M.; Fox, J.; et al. Evapotranspiration of rubber (Hevea brasiliensis) cultivated at two plantation sites in Southeast Asia. Water Resour. Res. 2016, 52, 660–679. [Google Scholar] [CrossRef]
  74. Cha, Z.-Z.; Lin, Z.-M.; Luo, W.; Li, S.-C.; Luo, X.-H. Sustainable land management practices for rubber plantations in mountainous area of Hainan. Pedosphere 2005, 15, 404–408. [Google Scholar]
  75. Sánchez-Canales, M.; López Benito, A.; Passuello, A.; Terrado, M.; Ziv, G.; Acuña, V.; Schuhmacher, M.; Elorza, F.J. Sensitivity analysis of ecosystem service valuation in a Mediterranean watershed. Sci. Total Environ. 2012, 440, 140–153. [Google Scholar] [CrossRef] [PubMed]
Figure 1. Map of Nabanhe Reserve featuring functional zones from the Man and Biosphere Programme and a digital elevation model in a 30 × 30 m resolution (ASTER Digital Elevation Model (“astergtm2_n22e100_dem” (ASTER GDEM is a product of METI and NASA))). Steep slopes (>23°) were derived from the ASTER DEM using the “Slope” tool of ArcGIS (Version 10.3.1) and are depicted in a grey shade.
Forests 08 00505 g001
Scheme 1. Comprehensive scheme of the applied methodological framework.
Forests 08 00505 sch001
Figure 2. (A) depicts land cover in the Nabanhe Reserve in the baseline year 2015, derived from Rapid Eye scenes. (BF) show the corresponding ESS maps for habitat quality, carbon storage, water yield, sediment export, and rubber yield, respectively. All maps feature a resolution of 30 × 30 m.
Forests 08 00505 g002
Figure 3. (A) shows the ecosystem service index integrating the five ecosystem services weighted by Xishuangbanna prefecture administration using the ROC (centroid weight) method for the year 2015. (BD) show differences in the ESS index between the BAU (Business-as-usual), the 5YP (5-year-plan), and the BTO (Balanced-trade-offs) scenarios and the initial state of 2015, respectively.
Forests 08 00505 g003
Figure 4. Changes in integrated ESS provision relative to the initial state of 2015. Each graph contains time series corresponding to the scenario (BAU: Business-as-usual (A,D,G); 5YP: 5-years-plan (B,E,H); BTO: Balanced-trade-offs (C,F,I) and stakeholder group ranking (Prefecture Administration (AC), Tourists Xishuangbanna (DF), Off-site Citizens (GI), as well as the statistical weighting method (ROC: centroid weights, RR: inverse weights, RS: rank sum; EW: equal weights).
Forests 08 00505 g004
Table 1. Proportions of land cover categories in the Nabanhe Reserve (271 km2) as of 2015.
Land Cover CategoryCoverage in 2015 (%)
Upland forest 145.9
Lowland forest 115.4
Bamboo5.8
Rubber9.4
Rice4.1
Perennial crops1.1
Bushland/tea 28.8
Annual crops5.8
Water1.3
Urban0.4
1 Upland forest and lowland forest are based on the altitude of their respective location (above/below 1000 m.a.s.l.). 2 Bushland areas and tea plantations were put into one category since the similarity of the spectral signature did not allow for a reliable distinction between them.
Table 2. Ranking of each ecosystem service based on feedback of three stakeholder groups concerning their importance in descending order and their corresponding weight factors used for the ecosystem service evaluation.
RankESS and Stakeholder GroupsWeighting Method
PATSRSRRROCEW
1WaterSoilBiodiversity0.330.440.450.2
2SoilBiodiversityWater0.270.220.260.2
3BiodiversityWaterRubber0.210.140.160.2
4RubberRubberSoil0.120.110.090.2
5CarbonCarbonCarbon0.070.090.040.2
Note: The terms for ecosystem services were abbreviated as follows: “Water” for water yield, “Soil” for sediment retention, “Biodiversity” for habitat quality, “Rubber” for rubber yield, and “Carbon” for carbon storage. The full descriptions for the stakeholder groups and weighting methods are: Prefecture administration (PA), Xishuangbanna tourists (T), Off-site citizens (S), Rank sum weight (RS), Reciprocal weight (RR), Centroid weight (ROC), and Equal weight (EW).
Table 3. Proportions of land cover categories in the Nabanhe Reserve (271 km2) for the final year of each scenario.
Land Cover CategoryCoverage in 2040 (%)
Business as Usual (BAU)5-Years-Plan (5YP)Balanced-Trade-Offs (BTO)
Upland forest 143.755.355.7
Lowland forest 112.613.513.4
Bamboo5.05.85.8
Rubber15.210.410.5
Rice4.14.14.1
Perennial crops1.11.11.1
Bushland/tea 210.92.31.9
Annual crops5.85.85.8
Water1.31.31.3
Urban0.40.40.4
1 Upland forest and lowland forest are based on the altitude of their respective location (above/below 1000 m.a.s.l.) 2 Bushland and tea plantations were put into one category since the similarity of the spectral signature did not allow for a reliable distinction between them.
Table 4. Ecosystem service provision determined by InVEST at the initial state of 2015, as well as the final year (2040) of each scenario for the Nabanhe Reserve (271 km2).
ScenarioWater Yield (km³)Sediment Export (106 kg)Habitat Quality (10³ HQ Index)Dry Rubber Yield (106 kg)Carbon Storage (106 kg)
Initial state (2015)102532321.855337
Business-as-usual (2040) 199612252.985095
5-years-plan (2040) 2102242482.525693
Balanced-trade-offs (2040) 3102192492.925693
1 Business-as-usual: Further rubber expansion based on past expansion rates in South-East Asia. 2 5-years-plan: Restricted rubber expansion and reforestation of high altitude and steep slope plantations and bushland areas. 3 Balanced-trade-offs: Includes all measures introduced in the 5-years-plan-scenario, as well as reduced herbicide application for rubber plantations, riverine buffer zones, and water source protection areas.
Table 5. Integrated ESS indices at the final year of the simulation (2040) for all stakeholder groups and weighting methods in comparison to the initial condition of 2015, which is set to 100%.
Stakeholder Group and Weighting MethodBusiness-As-Usual (BAU) (%)5-Years-Plan (5YP) (%)Balanced-Trade-Offs (BTO) (%)
PA_ROC99.60118.71122.16
PA_RR101.25117.45121.08
PA_RS101.47121.01125.15
T_ROC97.76130.15134.71
T_RR99.10130.40135.35
T_RS100.91124.85129.33
S_ROC106.07114.07117.89
S_RR104.54114.75118.27
S_RS108.91116.90122.01
EW107.29120.99126.42
Note: The full descriptions for the stakeholder groups and weighting methods are: Prefecture administration (PA), Xishuangbanna tourists (T), Off-site citizens (S), Centroid weight (ROC), Reciprocal weight (RR), Rank sum weight (RS), and Equal weight (EW).

