Article

Temporal Variation of Ecological Factors Affecting Bird Species Richness in Urban and Peri-Urban Forests in a Changing Environment: A Case Study from Milan (Northern Italy)

Department of Earth and Environmental Sciences, University of Milano-Bicocca, Piazza della Scienza 1, 20126 Milano, Italy
*
Author to whom correspondence should be addressed.
Forests 2017, 8(12), 507; https://doi.org/10.3390/f8120507
Submission received: 20 October 2017 / Revised: 10 December 2017 / Accepted: 15 December 2017 / Published: 19 December 2017

Abstract

:
Urban and peri-urban forests determine different habitat services for biodiversity according to their characteristics. In this study, we relate ecological characteristics of urban and peri-urban forests to forest bird species richness and we assess whether their effect changed over time due to the urban sprawl within the urban region of Milan, Italy. We analyse two periods (1998–2002 and 2010–2014) using weighted generalized linear models that considered urban and peri-urban forests collectively and urban and peri-urban forests separately. Patch area, proximity to source areas and number of surrounding urban and peri-urban forests were the main factors predicting species richness within urban and peri-urban forests in both periods. While there were no differences in factors affecting bird richness in peri-urban forests between the two periods, the negative effect of urban matrix density was statistically significant for birds inhabiting urban forests in the second period. Moreover, protected areas within urban and peri-urban forests and urban forests in the second period were important determinants in providing suitable habitat for birds at the regional scale. This study offered important insights regarding urban and peri-urban forests characteristics that should be maintained to ensure biodiversity conservation across changing urban landscapes.

1. Introduction

The continuous growth in number and size of urban areas poses great challenges for ensuring human well-being and preventing an increasing loss of habitats and biodiversity [1]. In 2010, the International Year of Biodiversity, urbanization was viewed as endangering more species and to be more geographically ubiquitous than any other human activity [2]. The loss of biodiversity is of critical concern, given that diversity plays a key role in long-term ecosystem functioning and in provisioning of ecosystem services [3,4]. One of the challenges to ecosystem functionality and the provision of ecosystem services is the increasing fragmentation of natural and semi-natural habitats due to urban sprawl [5]. Increasing urbanization has created a network of ecological barriers that have exacerbated the isolation of natural habitats scattered across the landscape [6,7,8]. In this context, small residual natural forests, as well as new wooded areas arising from reforestation or secondary succession following land abandonment, have grown in importance [9].
Urban and peri-urban forests (UPUFs) are crucial to maintain biodiversity, which in turn provides a large number of ecosystem services upon which local human communities depend [10]. Indeed, UPUFs can provide refuge for species whose native habitats have been largely lost [11], even allowing for the occurrence of forest specialists in these urban and peri-urban landscapes [12,13]. They may play a role in providing dispersal corridors or stepping stones among habitat patches [14,15]. The presence of UPUFs has enabled some urban areas to host high levels of biodiversity [16]. For instance, in Leipzig, Austria, high bird diversity occurs in dense housing districts, with open backyards that contain older trees than the ones in the surrounding areas [17]. Urban biodiversity conservation represents a great challenge and it calls for investigations at large spatial scales [18] aimed at identifying which particular characteristics of UPUFs should be maintained to effectively preserve biodiversity. Indeed, the characteristics of UPUFs such as size, spatial pattern, management strategies, or the effect of the surrounding urban matrix, may have a significant effect on biodiversity [14,19]. In the study reported here, we focus on forest bird species, a group that is considered to be a good indicator of forest biodiversity because of its propensity to respond rapidly to habitat changes [20]. Specifically, we aimed to assess whether the effect of particular characteristics of UPUFs on forest bird species richness varied over time due to the intensification of urban sprawl that occurred between 2000 and 2012 in the urban region of Milan, Italy, one of the largest urban areas in Europe. By providing evidence of the importance that different UPUF characteristics have in a rapidly changing urban environment, we highlight the need to investigate forest bird richness relative to continuous urban growth to provide insight into the current contribution of UPUFs to effectively support biodiversity conservation.

2. Materials and Methods
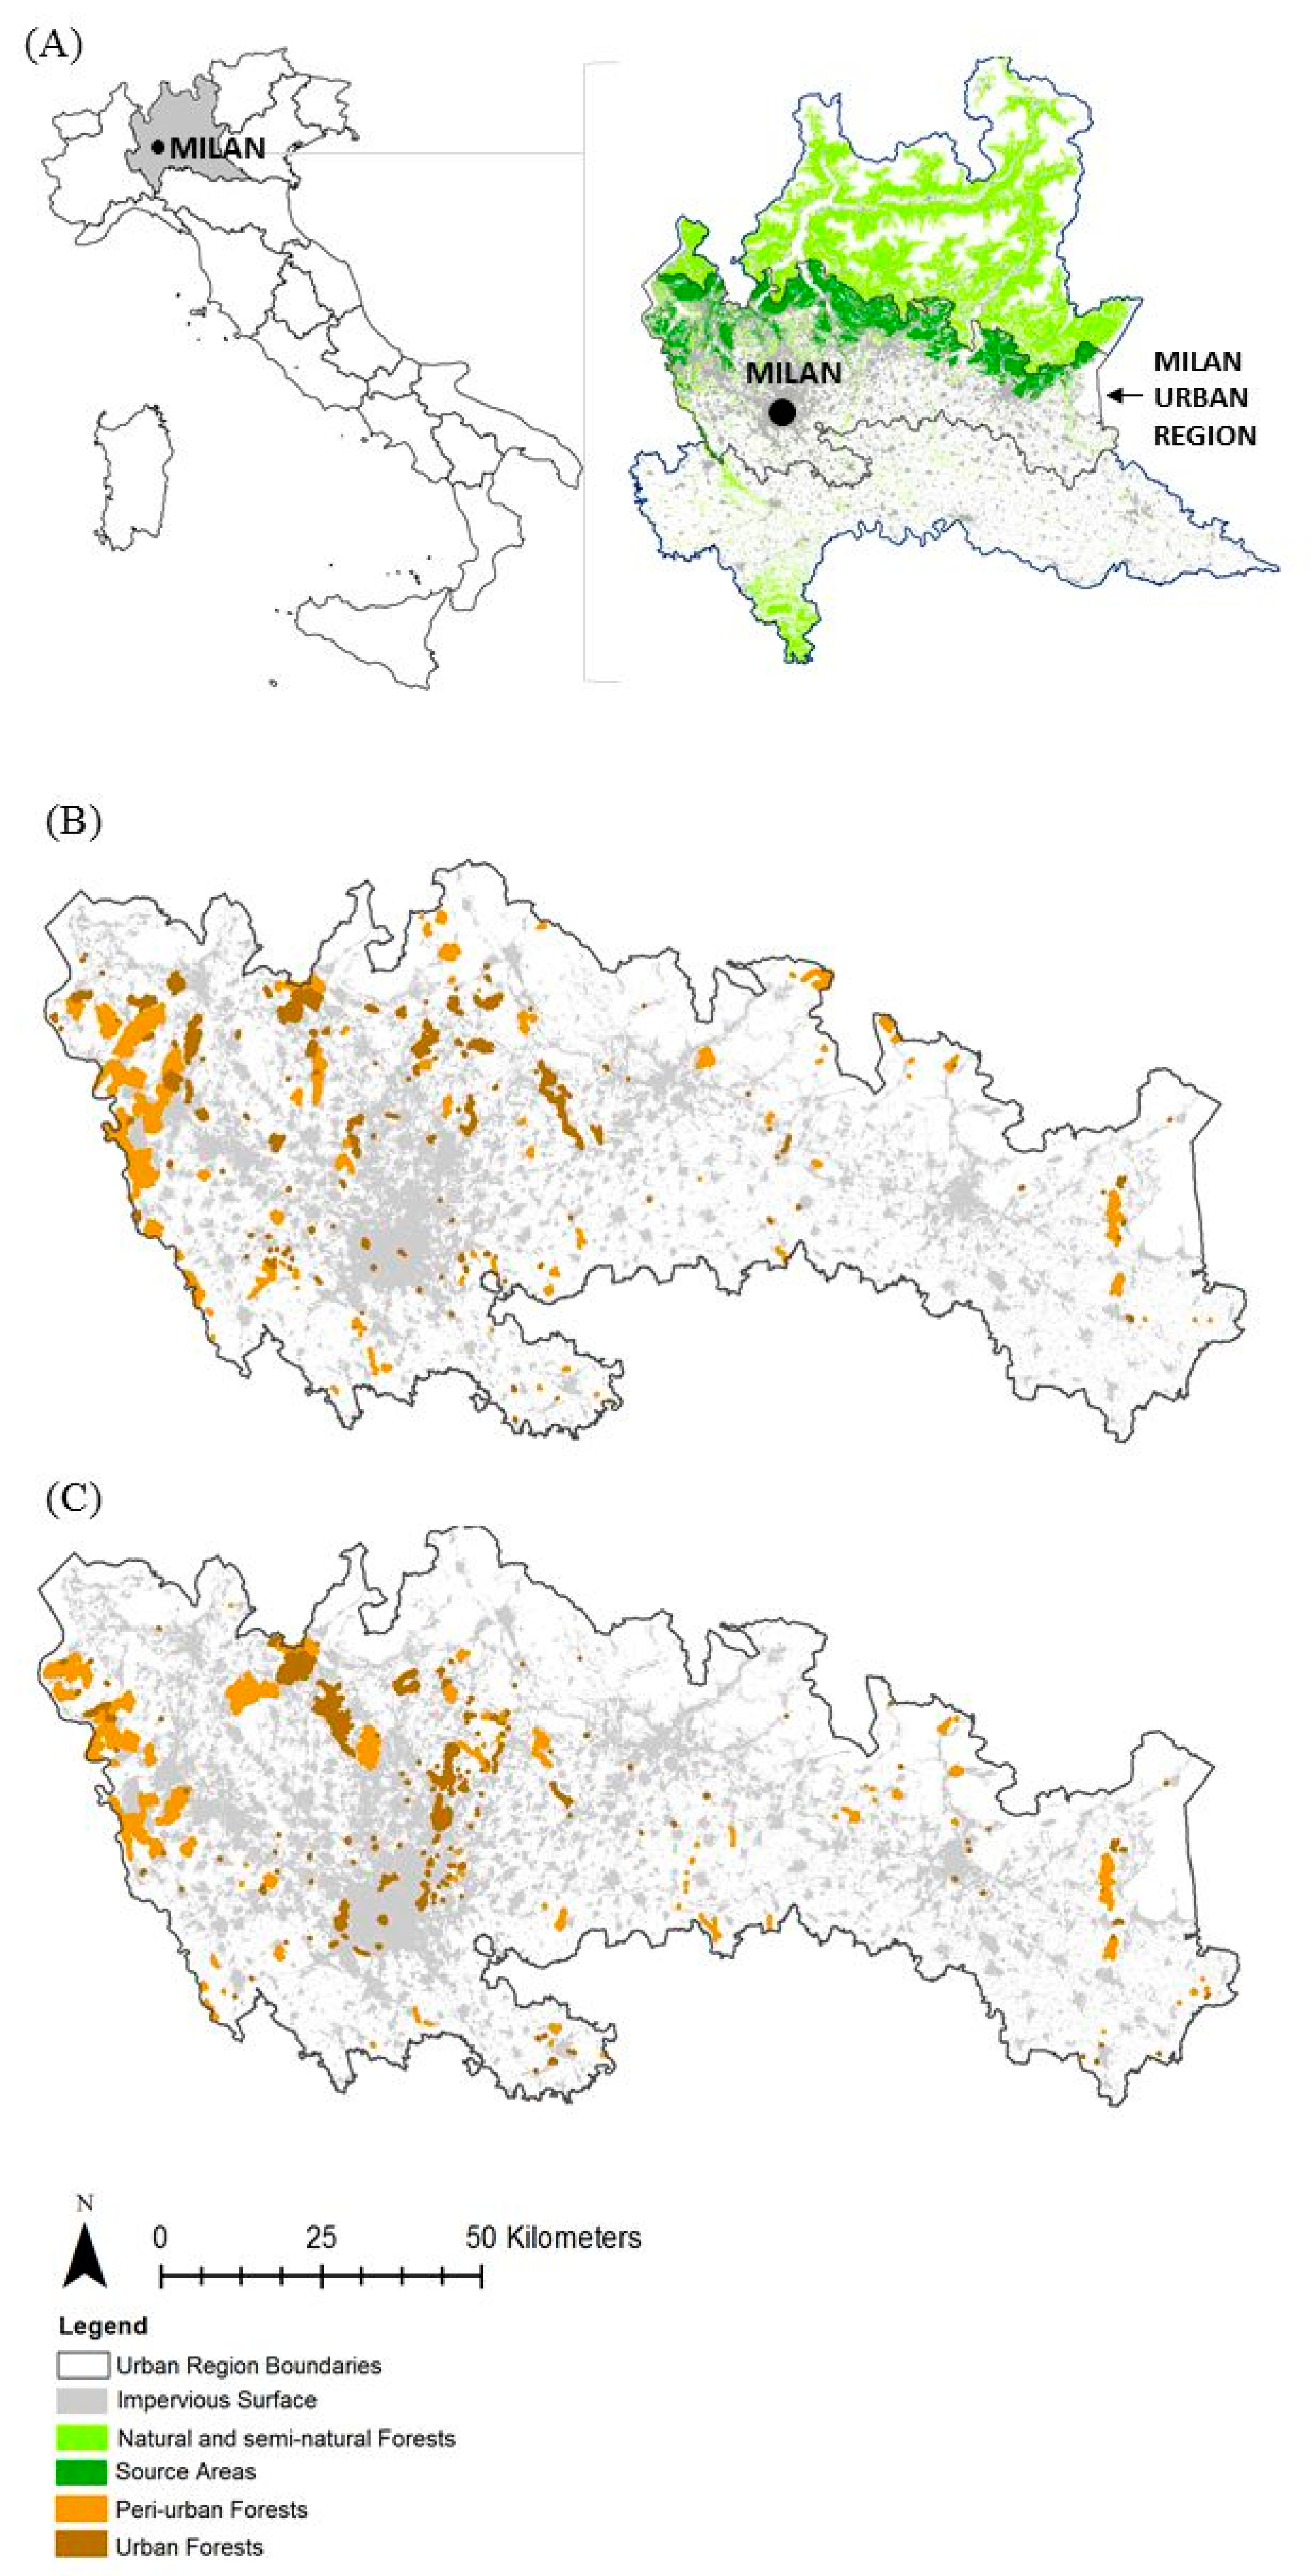
2.1. Study Area

In this study, we focus on UPUFs within the urban region of Milan, an area of 8090 km2 in northern Italy (Figure 1). The urban region is defined as a widespread geographical area associated with a major city with surrounding lands and it comprises urban, peri-urban rural and natural lands within its boundaries [21]. The determination of the spatial extension of the urban region of Milan was based on a combination of land use and population density (for more details, see [22]). The urban region is characterized by a northern band of natural and semi-natural lands separated from the southern agricultural lands by a semi-continuous urban belt. The presence of UPUFs in this area is of particular interest as the urban region could represent a semi-permeable barrier to animal dispersal between the mountain region characterizing the northern part of Lombardy and the floodplain in the south (Figure 1A). Overall, land cover types within the urban region are mainly represented by anthropogenic or agricultural areas (together covering approximately 70% of the area), while forests cover 20% and semi-natural lands, together with water bodies and wetlands, cover the remaining 10%.

2.2. Bird Data

Bird data are obtained from a long-term (1992–2016) monitoring program of breeding birds in Lombardy [23]. Surveys were performed each year during the breeding season (10 May–20 June), from sunrise to 11:00 a.m. (Central European Time, CET), only in good weather conditions (sunny to cloudy, without rain or strong winds). Data were collected using the 10 min unlimited distance point count technique [24,25]. For this research, we select point counts conducted in urban and peri-urban forest patches or within a 50 m buffer around them. To detect temporal variations of the use of UPUFs by birds over time, we select point counts performed during two time-windows: 1998–2002 and 2008–2012. We use five-year time-windows to avoid anomalous year effects that could bias the conclusions [19]. For this study, we consider only forest-dependent species, that we define as species breeding on trees or shrubs. Moreover, we only consider species detected in at least 5% of the patches identified for each time-window. Indeed, species with such low frequencies of occurrence are probably those characterized by a very low detection probability due to their intrinsic rarity (e.g., lesser spotted woodpecker Dendrocopus minor) or as a result of ineffective survey methods (e.g., birds of prey). Overall, we examined 34 bird species for the time-window 1998–2002 and 30 for the time-window 2008–2012 (for the complete list of species, see Table S2).

2.3. Landscape Data

The identification of UPUF patches and the evaluation of their characteristics rely on the land-use digital maps (Destinazione d'Uso dei Suoli Agricoli e Forestali, DUSAF) available for the year associated with the midpoint of each time-window (1998–2002: DUSAF 1.1 update to 2000, [26]; 2010–2014: DUSAF 4 update to 2012, [27]; both maps have a minimum mapping unit of 1600 m2). In particular, we take into account all patches belonging to one of the following categories of land cover: green urban areas (DUSAF class: 141), tree plantations (224), broadleaved forests (311), coniferous forests (312), mixed forests (313), broadleaved reforestations (i.e., temporary arboreal plantations) (314) and shrublands (324). From the original sets of urban and peri-urban forest patches, for each period we select only the patches where point counts were performed. Moreover, we exclude all patches larger than 1000 ha and all those composed of broadleaved or mixed forests, because they could be considered as source areas for the target forest-dependent bird species in our study area [28]. In those large patches, the percentage of observed forest-dependent species ranged from 71% to 97% of the whole pool of forest-dependent species in the time-window 1998–2002 and from 80% to 87% in the time-window 2010–2014. Only source areas where at least 20 point counts were performed during each period were considered. In this way, we obtained 402 patches for the 2000 map and 240 for the 2012 map. To allow for a reasonable comparison, we randomly select 240 patches among the 402 obtained for 2000, and check that the mean and variance of patch size of the two samples were comparable (2000: mean = 54.7 ha, sd (standard deviation) = 117.3; 2012: mean = 47.7 ha, sd = 130.2) (Figure 1B,C). Using ArcGIS 10 (Release 10, 2011, Environmental Systems Research Institute, Redlands, CA, USA) [29], and starting from the 2000 and 2012 cartographies, we calculated the following landscape variables for each patch: patch area (PA), minimum distance from the nearest source area (DSA; i.e., a forest patch larger than 1000 ha), surface occupied by forests (SF) in a buffer of 1000 m (see [19,28] for studies which adopted a similar buffer size), number of neighboring forest (NF) patches in a buffer of 1000 m, surface occupied by urban areas (excluding urban green areas) in a buffer of 1000 m (SU) and number of neighboring urban (NU) patches in a buffer of 1000 m. For each UPUF, we also consider the type of urban or peri-urban forest (TYPE; e.g., green urban area, broadleaved forest, tree plantation), if it was included in a protected area or not (PrA/notPrA) and if it was classified as an urban or as a peri-urban forest (URB/PERI-URB). This last variable is obtained based on the classification developed in a previous effort to map the boundaries of the urban region. In order to do that, the area of the urban region was divided into a 100 × 100 m grid and each cell classified as urban, peri-urban, rural or natural. Definition of such classes was based on a combination of built-up surface and population density data (for further details, see [22]). In order to define urban and peri-urban forests for this study, we determine the percentage of inclusion of the forest patches into urban or peri-urban cells. Patches included in urban cells for more than 50% of the patch area are classified as urban forests (URB), otherwise they are classified as peri-urban forests (PERI-URB). The mean and ranges of all the environmental variables considered are listed in Table S1.

2.4. Statistical Analysis

In order to evaluate whether the effect of different environmental variables on bird species richness characterizing UPUFs changed over time, we use six statistical models. Specifically, we use three pairs of models (each pair consists of one model for the first and one for the second time-window). The first pair of models considers the whole set of UPUFs, while the second and the third pairs consider urban forests and peri-urban forests, respectively.
We test the first pair of models using Weighted Generalized Linear Models (WGLMs) with a Poisson distribution and the total number of bird species detected (i.e., species richness) in each UPUF during the five years of each time-window as the dependent variable. Continuous covariates include PA, DSA, SF, NF, SU and NU, whereas TYPE, PrA/notPrA and URB/PERI-URB are considered as categorical variables. Similarly, we test the second and third pairs of models using WGLMs with a Poisson distribution and species richness, detected in urban forests and peri-urban forests, respectively. We consider the same suite of continuous and categorical variables with the exception of URB/PERI-URB. In addition, we include the spatial coordinates of patch centroids (East and North) within each model, to control for two ecological processes that could affect bird species richness in Lombardy. The first process considers differences in bird species assemblages in Lombardy moving from continuous forests of the Alps to fragmented forests of the lowland (i.e., North to the South), while the second process considers a natural increase of forest bird species richness moving from East to West, as observed in other studies carried out in Lombardy (e.g., [30]). All of the continuous independent variables are standardized by subtracting the mean of variables and dividing by the standard deviation (i.e., by centering and scaling). To control for sampling effort among patches, the number of point counts per patch is used as a weighting factor, assuming that the number of point counts per patch indicates the precision of the information contained in the associated observation (i.e., species richness). All the models are checked for over-dispersion [31] using the AER package in R [32]. In order to remove collinearity between variables, for each model we calculate the Variance Inflation Factor (VIF) using the usdm package in R [33] and, starting from the covariate showing the higher VIF value, we systematically remove all the covariates with a VIF value >3 [34], until all the variables in the model show a VIF value <3. We also verify that all other GLM requirements are met by visually checking diagnostic plots (normal Q–Q plot, Scale–Location plot of standardized residuals against fitted values and Cook’s plot against leverages). We check for spatial autocorrelation in model residuals using Moran’s I test with 999 permutations [35] by means of the spdep package in R [36]. All the analyses are performed using R Version 3.4(Foundation for Statistical Computing, Vienna, Austria) [37].

3. Results

3.1. Forest Bird Richness

The mean number of species detected within each forest patch surveyed was 8.88 (±0.24 standard error (SE)) for 1998–2000 and 8.84 (±0.24 SE) for 2010–2014. Considering urban forests only, the mean number of species detected within each patch was 8.22 (±0.22 SE) for 1998–2000 and 8.04 (±0.21 SE) for 2010–2014; while considering peri-urban forests only, the mean number of species detected within each patch was 9.60 (±0.26 SE) for 1998–2000 and 10.40 (±0.28 SE) for 2010–2014.

3.2. Models

The WGLM using the whole set of UPUFs for the first period accounted for 41% of the variance (Table 1). Both PA and NF had a significant positive influence on bird species richness. Conversely, the DSA showed a significant negative effect. The model showed that bird species richness was on average 0.151 (SE = 0.041) lower in urban forest patches than peri-urban forests. The analysis also showed that there are fewer species moving eastward.
The WGLM that included UPUFs for the second period accounted for 37% of the variance (Table 2). Like the model for the first time-window, both PA and NF had a significant positive influence on bird species richness, while the DSA showed a significant negative effect. The model also showed that bird species richness was on average 0.163 (SE = 0.033) lower in urban forest patches than peri-urban forests, and that bird species richness was on average 0.169 (SE = 0.043) higher in patches included in protected areas. The analysis showed that species richness was higher in patches moving towards the East.
The WGLM for the first period, considering urban forests only, accounted for 31% of the variance (Table 3). In this model, only PA had a significant positive influence on bird species richness. The analysis also showed that there are fewer species moving eastward.
The WGLM used for the second period, considering urban forests only, accounted for 56% of the variance (Table 4). Similar to the model considering urban forests only for the first period, PA had a significant positive influence on bird species richness. Conversely, this model also showed a significant negative effect on bird species richness of both DSA and NU. The model also showed that, considering the second period, bird species richness was on average 0.151 (SE = 0.054) higher in patches included in protected areas and species richness was higher in patches to the East.
The WGLM used for the first period, considering only peri-urban forests, accounted for 46% of the variance (Table 5). In this model, both PA and NF showed a significant positive influence on bird species richness, while the DSA had a significant negative effect. The analysis also showed that there are fewer species moving to the East and to the North.
The WGLM performed for the second period, considering peri-urban forests only, accounted for 9% of the variance (Table 6). In this model, PA had a significant positive influence on bird species richness, while NF and the DSA showed a marginally significant positive and negative effect on bird species richness, respectively.

4. Discussion

4.1. Factors Affecting Bird Species Richness in UPUFs

Urbanization affects the heterogeneity of the landscape and, consequently, the distribution and abundance of resources upon which birds depend [38]. In urban and peri-urban areas, fragmentation has the same deleterious effects on urban birds as in other fragmented landscapes [39]. For bird species in the UPUFs of the urban region of Milan, patch area, proximity to source areas and number of surrounding UPUFs were the main factors explaining differences in species richness for both the 1998–2002 and 2010–2014 periods.
A positive effect of forest patch size on urban biodiversity has been previously found [40,41,42,43]. Our study supports previous findings associated with species–area relationships [44] in urban and in peri-urban landscapes. The higher bird richness observed in large urban and peri-urban forests was likely a result of the fact that urban-avoider species (such as forest interior specialist) may be present in addition to typically urban-tolerant species [45,46]. Indeed, the presence of forest interior species in an urban area can be due to the presence of green areas of adequate size and habitat structure, which allow the colonization by species with specific area and habitat requirements [39].
Our results highlight the importance of source areas to urban regions. Indeed, source areas usually produce a surplus of individuals that can disperse to less favourable areas. As demonstrated by island biogeography theory [47], if there is no immigration of individuals from source areas, animal populations that occupy isolated habitat patches may be subject to extinction [28]. Similarly, populations of forest birds within UPUFs may be negatively affected by the absence of source areas that provide new sources of genetic variation. Because the size of UPUF patches is generally not adequate to maintain a vital population of forest species, it is thus arguable that source areas represent fundamental elements for the maintenance of functional metapopulations [39,48]. In Milan, as in many other European cities located in intensive agricultural landscapes with scarce forest resources, it may be especially important to conserve extended natural woodlands surrounding the urban region to maintain viable populations of forest-dependent species within urban and peri-urban forest patches. Moreover, previous studies demonstrated how in these source areas it is also crucial to ensure proper forest management, as only the maintenance of forests characterized by a high degree of structural complexity can guarantee the persistence of abundant and rich bird assemblages [49].
The analyses based on the entire set of UPUFs suggested an important role of multiple forest patches within the matrix. These surrounding forest patches likely represent stepping stone habitats that may increase the permeability of the urban matrix [50] by decreasing the density of the surrounding infrastructure, facilitating colonization from and to adjacent forest patches. Stepping stones may either be viewed as elements that simply decrease the distance among patches [51], or they can provide functional corridors to animal movement [43]. The high importance of stepping stones in an urban area can be explained because connectivity is particularly important in urban landscapes [52,53], where the urban matrix greatly restrains bird movement [39]. In the case of the urban region of Milan, they appear to be a valuable element to support adjacent forest patches colonization. In this context, spatially aggregated UPUFs may work synergistically, generating the so-called “archipelago effect”, to host richer bird assemblages compared to more isolated patches [28]. However, given the complexity of the urban environment in terms of heterogeneity of the land-cover mosaic and disturbance pressures [54], further studies testing the actual capacity of specific forest patches to act as functional corridors (i.e., with data on bird movements) are needed.

4.2. Temporal Changes of the Effect of UPUFs Characteristics on Bird Richness

Many urban areas worldwide are expanding [55] and this may lead to severe land consumption, with the conversion of very large geographic areas into new anthropogenic landscapes. Urban sprawl affects birds at multiple levels of biological organization, from individuals at the local scale, to communities across continents [38]. Although the intensity of disturbance caused by urban sprawl is similar to that caused by deforestation, the former is more permanent, and the lands affected are less likely to revert to pre-disturbance conditions [38,56].
When disentangling the effect of environmental variables on UPUFs in Milan, it appears that although there are no differences in factors affecting birds in peri-urban forests between 2000 and 2012, the importance of inclusion in a protected area and the density of the surrounding urban matrix were important predictors of species richness for birds found in urban forests. It is interesting that in the first period the only factor explaining variation in bird species richness in urban forests was patch size. In a relatively limited time, just over a decade, the proximity of source areas and the protection regime of urban forests appeared to be as important as patch size as a predictor of species richness. The role of source areas was more important in the second time period compared to the first period likely because of the increase of urbanization that occurred in the study area over one decade. Indeed, the inhospitable nature of the urban matrix among forest patches increased as well and, thus, so did the degree of isolation between patches. It is known that demographic rates of populations inhabiting small habitat patches tend to become unfavourable (e.g., low reproductive success and high mortality rate) as isolation increases, mainly due to inbreeding and genetic drift. In this context, populations inhabiting small patches depend much more on immigration of individuals from source areas than compared to cases with weaker isolation [57,58,59]. Concomitant with the role of sources and protection was the deleterious effect of the dense surrounding urban matrix to the urban forests. Habitat patches are components of a landscape mosaic, and the presence of a given species in a patch is a function not only of patch size and isolation, but also of the type and characteristics of neighboring habitats [60]. Urban forest patches in our study area exhibited a rather depauperate bird assemblage relative to peri-urban forests in both 1998–2010 and 2010–2014. In fact, moderate urban development typically increases heterogeneity, but extreme development decreases heterogeneity and the availability of resources as they are permanently replaced with impervious surface and human infrastructure [38,61,62,63,64]. This pattern results in an increase in species richness and diversity with moderate levels of urbanization and a decrease with higher levels [38]. In the latter case, it is likely that additional environmental requirements need to be satisfied in order to preserve biological diversity compared to peri-urban areas.
The significant effect of the inclusion of a patch in a protected area emerged in the second time period when considering either the entire set of UPUFs or urban forests, suggesting that the protected areas that have been recently established (2000 Natura Sites: SCI—Site of Community Importance and SPA—Special Protection Areas) in the urban region of Milan offer greater advantages to bird conservation in urban forests compared to traditional regional protected areas, where protection policies are less stringent. This indicates that, despite the positive impact of patch size and proximity to source areas and to other forest patches, the inclusion of a forest patch in a protected area is an important strategy to maintain high levels of bird biodiversity in urban forests. This information can be used in conservation practices aimed at enhancing species richness in those urban landscapes where other options (e.g., extension of the size patches, creation of other proximate UPUFs) are not as feasible. Of course, this last result can be, in part, explained by considering that when reserves are designed they are usually located in areas characterized by more suitable habitats [65] where maintenance of biodiversity is favoured [66].

5. Conclusions

Urban sprawl leads to increased conservation challenges [67]. An important issue is the reduction of the conflict between conservation priorities associated with natural and semi-natural habitats found within an urban region and the expansion of the built-up area [14]. This study offers important insights regarding which characteristics of UPUFs should be maintained to ensure a long-term persistence of rich bird assemblages in a changing urban area. Understanding how bird species respond to the past and to the current UPUF system and which factors could sustain species richness at different urban densities, from city core to peri-urban areas, is crucial when attempting to focus development towards biodiversity initiatives and the maintenance of fundamental ecosystem services.
Although urban ecosystem services provided by biodiversity are often supplied at smaller spatial scales and are more fragmented or disrupted than those of natural environments, they greatly affect and benefit the whole urban population. Following some projections, urban biodiversity will comprise a larger fraction of the world’s repository of biodiversity in the future [68] and thus its proper management may have important effects from local to wider regional scales. Thus, undertaking pertinent conservation strategies may lead to multiple benefits, from providing suitable habitats for species to enabling opportunities for residents to experience nature and other cultural benefits deriving from urban and peri-urban forests.

Supplementary Materials

The following are available online at www.mdpi.com/1999-4907/8/12/507/s1, Table S1. Variables considered to evaluate temporal changes of the effect of urban and per-urban forest patches’ characteristics on bird species richness in the urban region of Milan (northern Italy).

Acknowledgments

We thank the General Directorate for Agriculture of the Lombardy Region (D.G. Agricoltura della Regione Lombardia) and the Regional Agency for Agricultural and Forestry Development (ERSAF, Ente Regionale per lo Sviluppo Agricolo e Forestale) for supporting this research. We thank the Ministry of Education, Universities and Research that provided funds with the research program PRIN 2012 (NEUFOR project, grant number 2012K3A2HJ). We also thank two anonymous reviewers for their constructive comments.

Author Contributions

C.C., E.P-S., L.B., O.D. conceived and designed the study; V.O., O.D. performed the analyses; C.C., O.D. wrote the paper.

Conflicts of Interest

The authors declare no conflict of interest.

References

  1. Haase, D.; Frantzeskaki, N.; Elmqvist, T. Ecosystem services in urban landscapes: Practical applications and governance implications. Ambio 2014, 43, 407–412. [Google Scholar] [CrossRef] [PubMed]
  2. Wratten, S.; Sandhu, H.; Cullen, R.; Costanza, R. Ecosystem Services in Agricultural and Urban Landscapes; John Wiley & Sons: Hoboken, NJ, USA, 2013. [Google Scholar]
  3. Mace, G.M.; Norris, K.; Fitter, A.H. Biodiversity and ecosystem services: A multilayered relationship. Trends Ecol. Evol. 2012, 27, 19–26. [Google Scholar] [CrossRef] [PubMed]
  4. Haines-Young, R.; Potschin, M. The links between biodiversity, ecosystem services and human well-being. In Ecosystem Ecology: A New Synthesis; Raffaelli, D.G., Frid, C.L., Eds.; Cambridge University Press: Cambridge, UK, 2010; pp. 110–139. [Google Scholar]
  5. Lafortezza, R.; Coomes, D.A.; Kapos, V.; Ewers, R.M. Assessing the impacts of fragmentation on plant communities in New Zealand: Scaling from survey plots to landscapes. Glob. Ecol. Biogeogr. 2010, 19, 741–754. [Google Scholar] [CrossRef]
  6. Scolozzi, R.; Morri, E.; Santolini, R. Delphi-based change assessment in ecosystem service values to support strategic spatial planning in Italian landscapes. Ecol. Indic. 2012, 21, 134–144. [Google Scholar] [CrossRef]
  7. Geneletti, D. Using spatial indicators and value functions to assess ecosystem fragmentation caused by linear infrastructures. Int. J. Appl. Earth Obs. Geoinf. 2004, 5, 1–15. [Google Scholar] [CrossRef]
  8. Lafortezza, R.; Brown, R.D. A framework for landscape ecological design of new patches in the rural landscape. Environ. Manag. 2004, 34, 461–473. [Google Scholar] [CrossRef] [PubMed]
  9. Hladnik, D.; Pirnat, J. Urban forestry-Linking naturalness and amenity: The case of Ljubljana, Slovenia. Urban For. Urban Green. 2011, 10, 105–112. [Google Scholar] [CrossRef]
  10. Sanesi, G.; Gallis, C.; Kasperidus, H.D. Urban forests and their ecosystem services in relation to human health. In Forests, Trees and Human Health; Nilsson, K., Sangster, M., Konijnendijk, C.C., Eds.; Springer: Dordrecht, The Netherlands, 2011; pp. 23–40. [Google Scholar]
  11. Angold, P.G.; Sadler, J.P.; Hill, M.O.; Pullin, A.; Rushton, S.; Austin, K.; Small, E.; Wood, B.; Wadsworth, R.; Sanderson, R.; et al. Biodiversity in urban habitat patches. Sci. Total Environ. 2006, 360, 196–204. [Google Scholar] [CrossRef] [PubMed]
  12. Park, C.R.; Lee, W.S. Relationship between species composition and area in breeding birds of urban woods in Seoul, Korea. Landsc. Urban Plan. 2000, 51, 29–36. [Google Scholar] [CrossRef]
  13. Mörtberg, U.; Wallentinus, H.G. Red-listed forest bird species in an urban environment assessment of green space corridors. Landsc. Urban Plan. 2000, 50, 215–226. [Google Scholar] [CrossRef]
  14. Sandström, U.G.; Angelstam, P.; Mikusiski, G. Ecological diversity of birds in relation to the structure of urban green space. Landsc. Urban Plan. 2006, 77, 39–53. [Google Scholar] [CrossRef]
  15. Bolger, D.T.; Scott, T.A.; Rotenberry, J.T. Use of corridor-like landscape structures by bird and small mammal species. Biol. Conserv. 2001, 102, 213–224. [Google Scholar] [CrossRef]
  16. Elmqvist, T.; Setälä, H.; Handel, S.N.; Van Der Ploeg, S.; Aronson, J.; Blignaut, J.N.; Gómez-Baggethun, E.; Nowak, D.J.; Kronenberg, J.; De Groot, R. Benefits of restoring ecosystem services in urban areas. Curr. Opin. Environ. Sustain. 2015, 14, 101–108. [Google Scholar] [CrossRef] [Green Version]
  17. Strohbach, M.; Haase, D.; Kabisch, N. Birds and the city: Urban biodiversity, land use, and socioeconomics. Ecol. Soc. 2009, 14, 31. [Google Scholar] [CrossRef]
  18. Mcdonald, R.I.; Forman, R.T.; Kareiva, P.; Neugarten, R.; Salzer, D.; Fisher, J. Urban effects, distance, and protected areas in an urbanizing world. Landsc. Urban Plan. 2009, 93, 63–75. [Google Scholar] [CrossRef]
  19. Donnelly, R.; Marzluff, J.M. Relative importance of habitat quantity, structure, and spatial pattern to birds in urbanizing environments. Urban Ecosyst. 2006, 9, 99–117. [Google Scholar] [CrossRef]
  20. Sekercioglu, C.H. Increasing awareness of avian ecological function. Trends Ecol. Evol. 2006, 21, 464–471. [Google Scholar] [CrossRef] [PubMed]
  21. Forman, R.T. Urban Regions: Ecology and Planning beyond the City; Cambridge University Press: Cambridge, UK, 2008. [Google Scholar]
  22. Canedoli, C.; Crocco, F.; Comolli, R.; Padoa-Schioppa, E. Landscape fragmentation and urban sprawl in the urban region of Milan. Landsc. Res. 2017, 1–20. [Google Scholar] [CrossRef]
  23. Bani, L.; Massimino, D.; Orioli, V.; Bottoni, L.; Massa, R. Assessment of population trends of common breeding birds in Lombardy, Northern Italy, 1992–2007. Ethol. Ecol. Evol. 2009, 21, 27–44. [Google Scholar] [CrossRef]
  24. Blondel, J.; Ferry, C.; Frochor, B. Point counts with unlimited distance. Stud. Avian Biol. 1981, 6, 414–420. [Google Scholar]
  25. Fornasari, L.; Bani, L.; de Carli, E.; Massa, R. Optimum design in monitoring common birds and their habitat. Gibier Faune Sauvag. 1998, 15, 309–322. [Google Scholar]
  26. Ente Regionale per i Servizi all’Agricoltura e alle Foreste (ERSAF). Destinazione d’Uso dei Suoli Agricoli e Forestali (DUSAF 1.1); Ente Regionale per i Servizi all’Agricoltura e alle Foreste della Lombardia: Milano, Italy, 2002. [Google Scholar]
  27. Ente Regionale per i Servizi all’Agricoltura e alle Foreste (ERSAF). Destinazione d’Uso dei Suoli Agricoli e Forestali (DUSAF 4); Ente Regionale per i Servizi all’Agricoltura e alle Foreste della Lombardia: Milano, Italy, 2014. [Google Scholar]
  28. Dondina, O.; Orioli, V.; D’Occhio, P.; Luppi, M.; Bani, L. How does forest species specialization affect the application of the island biogeography theory in fragmented landscapes? J. Biogeogr. 2017, 44, 1041–1052. [Google Scholar] [CrossRef]
  29. Environmental Systems Research Institute (ESRI). ArcGIS Desktop: Release 10; Environmental Systems Research Institute: Redlands, CA, USA, 2011. [Google Scholar]
  30. Massimino, D.; Orioli, V.; Pizzardi, F.; Massa, R.; Bani, L. Usefulness of coarse grain data on forest management to improve bird abundance models. Ital. J. Zool. 2010, 77, 71–80. [Google Scholar] [CrossRef]
  31. Cameron, A.C.; Trivedi, P.K. Regression-based Tests for Overdispersion in the Poisson Model. J. Econom. 1990, 46, 347–364. [Google Scholar] [CrossRef]
  32. Kleiber, C.; Zeileis, A. Applied Econometrics with R; Springer: New York, NY, USA, 2008; Available online: http://CRAN.R-project.org/package=AER (accessed on 1 July 2017).
  33. Naimi, B. usdm: Uncertainty Analysis for Species Distribution Models. 2015 R package Version 1.1-15. Available online: https://CRAN.R-project.org/package=usdm (accessed on 1 July 2017).
  34. Zuur, A.F.; Ieno, E.N.; Walker, N.J.; Saveliev, A.A.; Smith, G.M. Mixed Effects Models and Extensions in Ecology with R; Springer Science+Business Media: New York, NY, USA, 2009. [Google Scholar] [CrossRef]
  35. Cliff, A.D.; Ord, J.K. Spatial Processes: Models and Applications; Pion Ltd.: London, UK, 1981. [Google Scholar]
  36. Bivand, R.; Altman, M.; Anselin, L.; Assunção, R.; Berke, O.; Bernat, A.; Blanchet, G.; Blankmeyer, E.; Carvalho, M.; Christensen, B.; et al. Package Spdep: Spatial Dependence—Weighting Schemes, Statistics and mOdels. R Package Version 0.5-88. 2015. Available online: www.cran.r-project.org (accessed on 1 July 2017).
  37. R Core Team. R: A Language and Environment for Statistical Computing; R Foundation for Statistical Computing: Vienna, Austria, 2017; Available online: https://www.R-project.org/ (accessed on 1 July 2017).
  38. Blair, R. The effects of urban sprawl on birds at multiple levels of biological organization. Ecol. Soc. 2004, 9, 2. [Google Scholar] [CrossRef]
  39. Fernandez-Juricic, E.; Jokimäki, J. A habitat island approach to conserving birds in urban landscapes: Case studies from southern and northern Europe. Biodivers. Conserv. 2001, 10, 2023–2043. [Google Scholar] [CrossRef]
  40. Faeth, S.H.; Kane, T.C. Urban biogeography. Oecologia 1978, 32, 127–133. [Google Scholar] [CrossRef] [PubMed]
  41. Basham, R.; Law, B.; Banks, P. Microbats in a ‘leafy’ urban landscape are they persisting, and what factors influence their presence? Austral Ecol. 2010, 36, 663–678. [Google Scholar] [CrossRef]
  42. Shanahan, D.F.; Miller, C.; Possingham, H.P.; Fuller, R.A. The influence of patch area and connectivity on avian communities in urban revegetation. Biol. Conserv. 2011, 144, 722–729. [Google Scholar] [CrossRef]
  43. Beninde, J.; Veith, M.; Hochkirch, A. Biodiversity in cities needs space: A meta-analysis of factors determining intra-urban biodiversity variation. Ecol. Lett. 2015, 18, 581–592. [Google Scholar] [CrossRef] [PubMed]
  44. Arrhenius, O. Species and area. J. Ecol. 1921, 9, 95–99. [Google Scholar] [CrossRef]
  45. Drinnan, I.N. The search for fragmentation thresholds in a Southern Sydney Suburb. Biol. Conserv. 2005, 124, 339–349. [Google Scholar] [CrossRef]
  46. Conole, L.E.; Kirkpatrick, J.B. Functional and spatial differentiation of urban bird assemblages at the landscape scale. Landsc. Urban Plan. 2011, 100, 11–23. [Google Scholar] [CrossRef]
  47. MacArthur, R.H.; Wilson, E.O. The Theory of Island Biogeography; Princeton University Press: Princeton, NJ, USA, 1967. [Google Scholar]
  48. Hanski, I. Metapopulation dynamics. Nature 1998, 396, 41. [Google Scholar] [CrossRef]
  49. Dondina, O.; Orioli, V.; Massimino, D.; Pinoli, G.; Bani, L. A method to evaluate the combined effect of tree species composition and woodland structure on indicator birds. Ecol. Indic. 2015, 55, 44–51. [Google Scholar] [CrossRef]
  50. Saura, S.; Bodin, Ö.; Fortin, M.J. Stepping stones are crucial for species’ long-distance dispersal and range expansion through habitat networks. J. Appl. Ecol. 2014, 51, 171–182. [Google Scholar] [CrossRef]
  51. Fahrig, L. Effects of habitat fragmentation on biodiversity. Annu. Rev. Ecol. Evol. Syst. 2003, 34, 487–515. [Google Scholar] [CrossRef]
  52. Adams, L.W.; Dove, L.E. Wildlife Reserves and Corridors in the Urban Environment: A Guide to Ecological Landscape Planning and Resource Conservation; National Institute for Urban Wildlife: Columbia, MD, USA, 1989. [Google Scholar]
  53. Alberti, M. The effects of urban patterns on ecosystem function. Int. Reg. Sci. Rev. 2005, 28, 168–192. [Google Scholar] [CrossRef]
  54. Laurance, W.F. Theory meets reality: How habitat fragmentation research has transcended island biogeographic theory. Biol. Conserv. 2008, 141, 1731–1744. [Google Scholar] [CrossRef]
  55. Benfield, F.K. Once there were greenfields. In Forum for Applied Research and Public Policy; Benfield, F.K., Ed.; University of Tennessee, Energy, Environment and Resources Center: Knoxville, TN, USA, 1999; Volume 14, No. 3; p. 6. [Google Scholar]
  56. McKinney, M.L. Urbanization as a major cause of biotic homogenization. Biol. Conserv. 2006, 127, 247–260. [Google Scholar] [CrossRef]
  57. Giplin, M.E.; Soulé, M.E. Minimum viable populations: Processes of species extinctions. In Conservation Biology: The Science of Scarcity and Diversity; Soulé, M.E., Ed.; Sinauer Associates: Sunderland, MA, USA, 1986; pp. 19–34. [Google Scholar]
  58. Crnokrack, P.; Roff, D.A. Inbreeding depression in the wild. Heredity 1999, 83, 260–270. [Google Scholar] [CrossRef]
  59. Frankham, R.; Briscoe, D.A.; Ballou, J.D. Introduction to Conservation Genetics; Cambridge University Press: New York, NY, USA, 2002. [Google Scholar]
  60. Andren, H. Effects of habitat fragmentation on birds and mammals in landscapes with different proportions of suitable habitat: A review. Oikos 1994, 355–366. [Google Scholar] [CrossRef]
  61. Whitney, G.G.; Adams, S.D. Man as a maker of new plant communities. J. Appl. Ecol. 1980, 17, 431–448. [Google Scholar] [CrossRef]
  62. Godron, M.; Forman, R.T. Landscape modification and changing ecological characteristics. In Disturbance and Ecosystems; Mooney, H.A., Godron, M., Eds.; Springer: New York, NY, USA, 1983; pp. 12–28. [Google Scholar]
  63. Mooney, H.A.; Gulmon, S.L. The determinants of plant productivity—Natural versus man-modified communities. In Disturbance and Ecosystems; Mooney, H.A., Godron, M., Eds.; Springer: New York, NY, USA, 1983; pp. 146–158. [Google Scholar]
  64. Rudnicky, J.L.; McDonnell, M.J. Forty-eight years of canopy change in a hardwood-hemlock forest in New York City. Bull. Torrey Bot. Club 1989, 116, 52–64. [Google Scholar] [CrossRef]
  65. Galvin, K.A.; Reid, R.S.; Behnke, R.H.; Hobbs, N.T. Fragmentation in Semi-Arid and Arid Landscapes. Consequences for Human and Natural Systems; Springer: Dordrecht, The Netherlands, 2008. [Google Scholar]
  66. Sicurella, B.; Orioli, V.; Pinoli, G.; Ambrosini, R.; Bani, L. Effectiveness of the system of protected areas of Lombardy (Northern Italy) in preserving breeding birds. Bird Conserv. Int. 2017, 1–18. [Google Scholar] [CrossRef]
  67. McKinney, M.L. Urbanization, biodiversity, and conservation: The impacts of urbanization on native species are poorly studied, but educating a highly urbanized human population about these impacts can greatly improve species conservation in all ecosystems. Bioscience 2002, 52, 883–890. [Google Scholar] [CrossRef]
  68. Faeth, S.H.; Bang, C.; Saari, S. Urban biodiversity: Patterns and mechanisms. Ann. N. Y. Acad. Sci. 2011, 1223, 69–81. [Google Scholar] [CrossRef] [PubMed]
Figure 1. (A) Location of the Lombardy region and Milan in northern Italy (left), and natural and semi-natural forest distribution in Lombardy (right); black borders delimit the urban region of Milan. (B) The urban region of Milan and urban and peri-urban forest patches considered for the first study period (1998–2002). (C) The urban region of Milan and urban and peri-urban forest patches considered for the second study period (2010–2014).
Forests 08 00507 g001
Table 1. Results of the Poisson Weighted Generalized Linear Model (WGLM) performed for 1998–2002 considering the entire set of urban and peri-urban forest patches in the urban region (UR) of Milan. PA: patch area. DSA: minimum distance from the nearest source area. NF: number of neighboring forest patches in a buffer of 1000 m. PrA: patch included within a protected area (patch not included within a protected area represents the control level). URB: patch classified as an urban forest (patch classified as a peri-urban forest represents the control level). East and North: coordinates of each patch centroid. SE: standard error of estimates. z: Wald statistic for testing the hypothesis that the corresponding estimate is equal to zero (null hypothesis). Pr(>|z|): probability that the null hypothesis is true. VIF: Variance Inflation Factor. The model explained 41% of the null deviance.
PredictorsEstimateSEzPr(>|z|)VIF
(Intercept)2.2900.04452.135<0.001-
PA0.0650.0123.398<0.0012.24
DSA−0.0590.030−1.9860.0472.49
NF0.0630.0193.398<0.0011.75
PrA0.0360.0480.7450.4561.48
URB−0.1510.041−3.656<0.0011.33
East−0.0970.022−4.369<0.0011.46
North−0.0330.027−1.2140.2252.18
Table 2. Results of the Poisson WGLM for 2010–2014 considering the entire set of urban and peri-urban forest patches in the UR of Milan. PA: patch area. DSA: minimum distance from the nearest source area. NF: number of neighboring forest patches in a buffer of 1000 m. PrA: patch included within a protected area (patch not included within a protected area represents the control level). URB: patch classified as an urban forest. East and North: coordinates of each patch centroid (patch classified as a peri-urban forest represents the control level). SE: standard error of estimates. z: Wald statistic for testing the hypothesis that the corresponding estimate is equal to zero (null hypothesis). Pr(>|z|): probability that the null hypothesis is true. VIF: Variance Inflation Factor. The model explained 37% of the null deviance.
PredictorsEstimateSEzPr(>|z|)VIF
(Intercept)2.3130.03761.634<0.001-
PA0.0930.0127.968<0.0012.06
DSA−0.1160.025−4.662<0.0011.89
NF0.0320.0152.1100.0351.96
PrA0.1690.0433.917<0.0011.81
URB−0.1630.033−4.947<0.0011.12
East0.1360.0206.859<0.0011.88
North−0.0380.024−1.5230.1282.07
Table 3. Results of the Poisson WGLM for 1998–2002 using the set of urban forest patches only in the UR of Milan. PA: patch area. DSA: minimum distance from the nearest source area. NF: number of neighboring forest patches in a buffer of 1000 m. PrA: patch included within a protected area (patch not included within a protected area represents the control level). East and North: coordinates of each patch centroid. SE: standard error of estimates. z: Wald statistic for testing the hypothesis that the corresponding estimate is equal to zero (null hypothesis). Pr(>|z|): probability that the null hypothesis is true. VIF: Variance Inflation Factor. The model explained 31% of the null deviance.
PredictorsEstimateSEzPr(>|z|)VIF
(Intercept)2.0680.04447.5341<0.001-
PA0.0970.0372.6500.0082.76
DSA0.0070.0490.1430.8862.70
NF0.0020.0420.0530.9582.57
PrA0.0980.0611.6000.1101.18
East−0.1460.035−4.145<0.0011.18
North0.0690.0481.4410.1502.86
Table 4. Results of the Poisson WGLM for 2010–2014 considering the set of urban forest patches only in the UR of Milan. PA: patch area. DSA: minimum distance from the nearest source area. NU: number of neighboring urban patches in a buffer of 1000 m. PrA: patch included within a protected area (patch not located inside within a protected area represents the control level). East and North: coordinates of each patch centroid. SE: standard error of estimates. z: Wald statistic for testing the hypothesis that the corresponding estimate is equal to zero (null hypothesis). Pr(>|z|): probability that the null hypothesis is true. VIF: Variance Inflation Factor. The model explained 56% of the null deviance.
PredictorsEstimateSEzPr(>|z|)VIF
(Intercept)2.0770.03854.765<0.001-
PA0.1620.01312.092<0.0012.74
DSA−0.1870.042−4.461<0.0012.64
NU−0.1040.022−4.646<0.0012.95
PrA0.1500.0542.7870.0051.42
East0.1050.0254.215<0.0011.42
North−0.0460.042−1.0860.2772.75
Table 5. Results of the Poisson WGLM performed for 1998–2002 considering the set of peri-urban forest patches only in the UR of Milan. PA: patch area. DSA: minimum distance from the nearest source area. NF: number of neighboring forest patches in a buffer of 1000 m. PrA: patch included within a protected area (patch not included within a protected area represents the control level). East and North: coordinates of each patch centroid. SE: standard error of estimates. z: Wald statistic for testing the hypothesis that the corresponding estimate is equal to zero (null hypothesis). Pr(>|z|): probability that the null hypothesis is true. VIF: Variance Inflation Factor. The model explained 46% of the null deviance.
PredictorsEstimateSEzPr(>|z|)VIF
(Intercept)2.3950.07332.618<0.001-
PA0.0930.0165.654<0.0012.35
DSA−0.1000.040−2.4430.0152.57
NF0.0540.0222.4160.0161.88
PrA−0.0820.094−0.8720.3832.57
East−0.0830.038−2.1790.0292.73
North−0.1310.036−3.608<0.0012.12
Table 6. Results of the Poisson WGLM performed for 2010–2014 considering the set of peri-urban forest patches only in the UR of Milan. PA: patch area. DSA: minimum distance from the nearest source area. NF: number of neighboring forest patches in a buffer of 1000 m. PrA: patch included within a protected area (patch not included within a protected area represents the control level). East and North: coordinates of each patch centroid. SE: standard error of estimates. z: Wald statistic for testing the hypothesis that the corresponding estimate is equal to zero (null hypothesis). Pr(>|z|): probability that the null hypothesis is true. VIF: Variance Inflation Factor. The model explained 9% of the null deviance.
PredictorsEstimateSEzPr(>|z|)VIF
(Intercept)2.5720.03769.086<0.001-
PA0.0480.0202.4020.0161.68
DSA−0.0620.034−1.8090.0701.55
NF0.0400.0231.7350.0831.52
PrA−0.0580.049−1.1770.2391.17
North−0.0060.033−0.1920.8481.80

